Quick Start
Step 1: Register and Login to the Account
Enter Guance official site and refer to Registration Guide to become Guance users.
Step 2: Install DataKit
DataKit is an official data collection application released by Guance, which supports the collection of hundreds of kinds of data, and can collect a variety of data such as host, process, container, log, application performance and user access in real time.
After the account registration is successful, log in to the Guance studio to start the installation.
Example
Here, take the example of installing DataKit on Linux host.
For more details, please refer to the documentation Host Install DataKit and K8s Install DataKit.
1. Get the installation command
Log in to studio, click Integrations on the left, and select DataKit at the top to see the installation commands of various platforms.
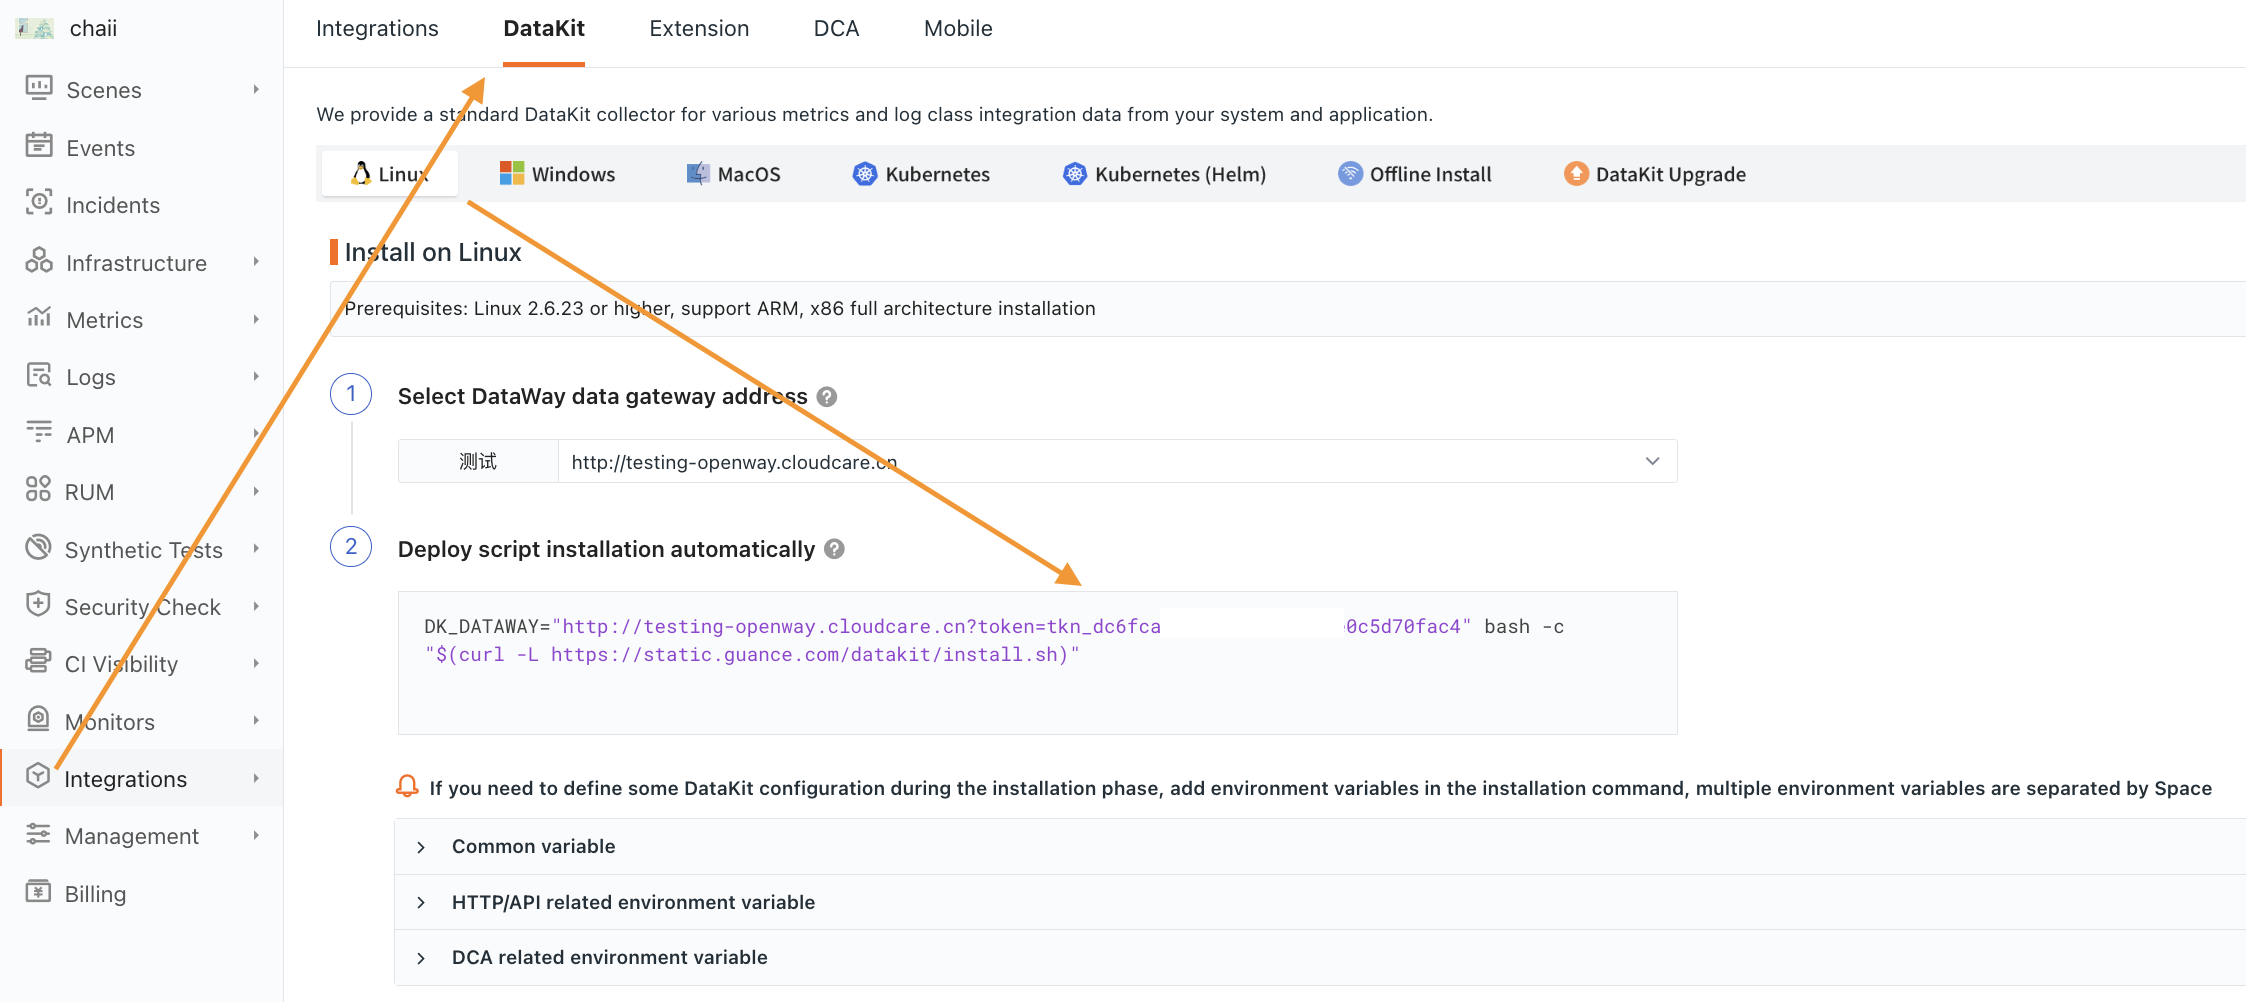
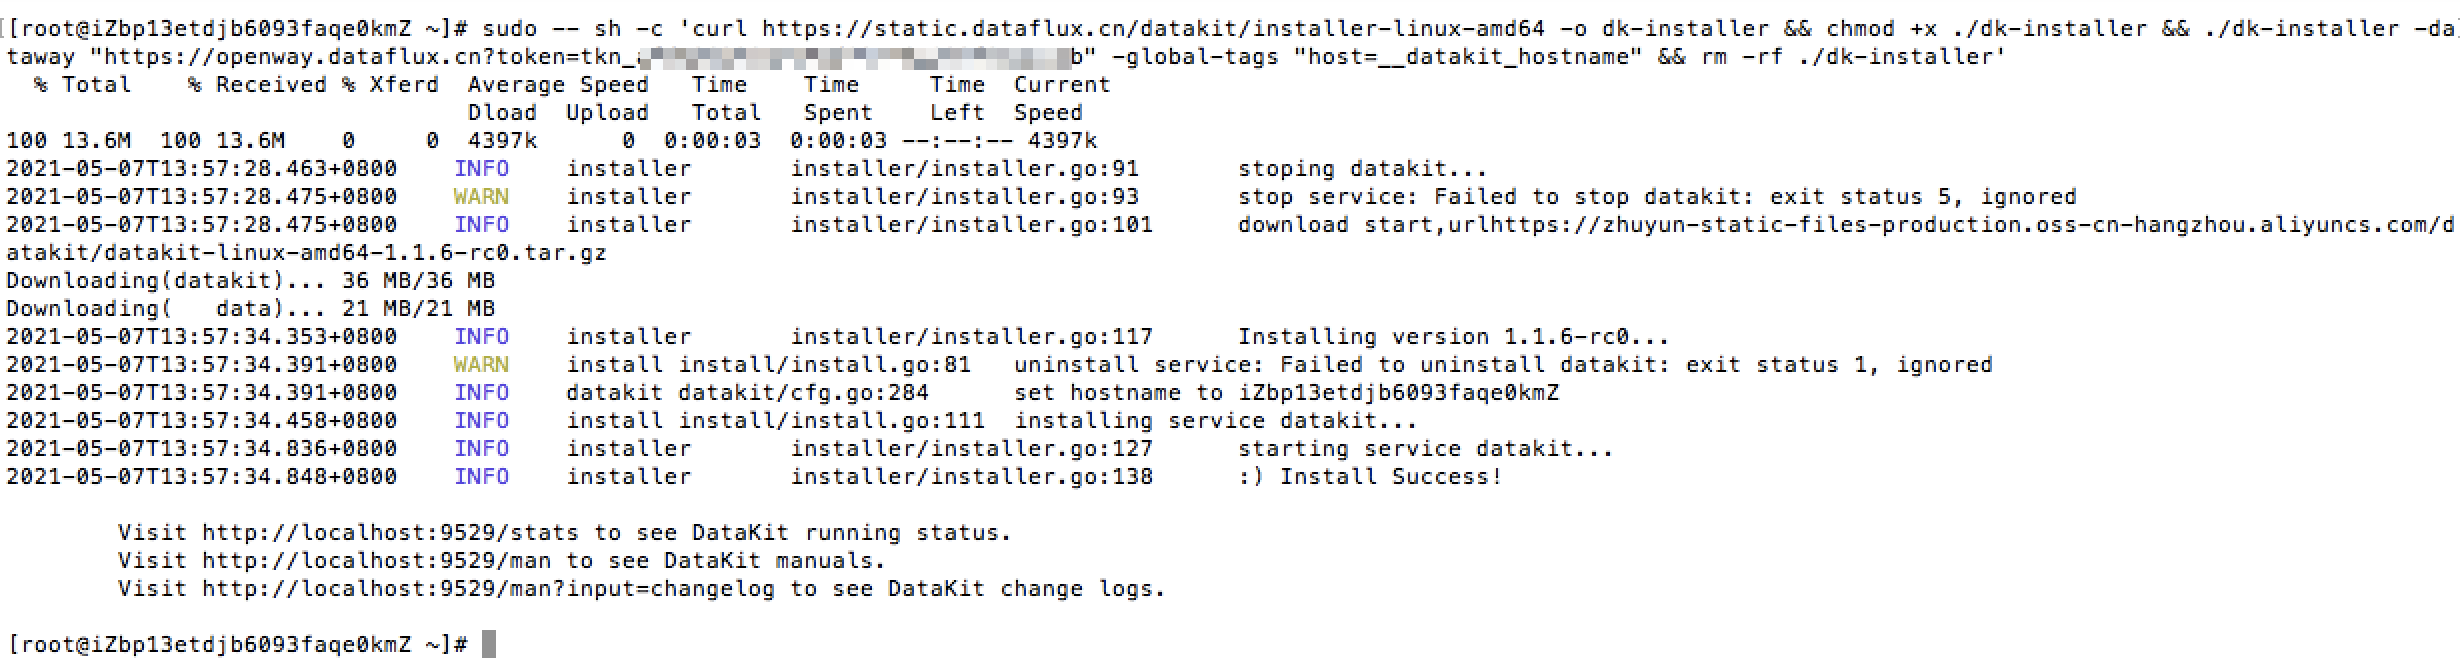
2. Execute the install command
Copy the corresponding installation command and execute it. If the installation is successful, you will see the following prompt on the terminal.
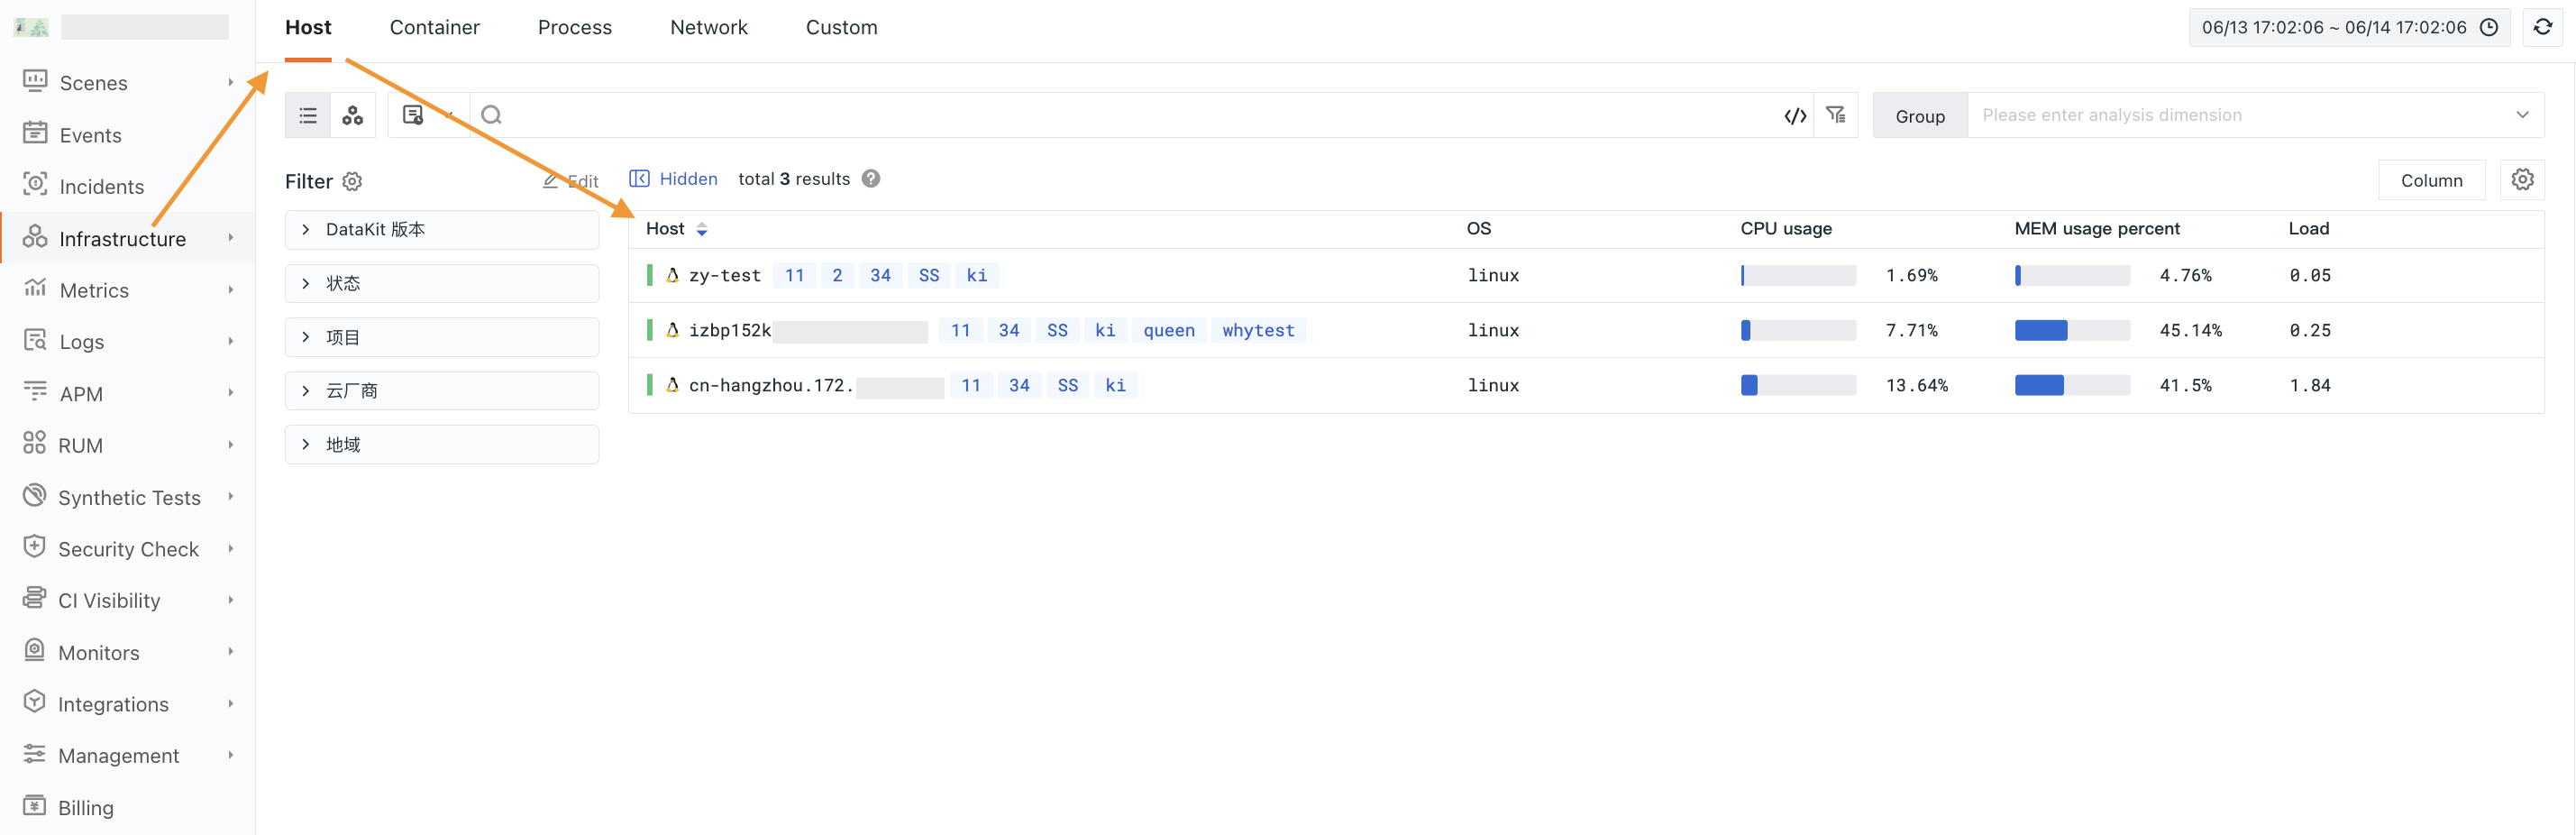
3. View the running status
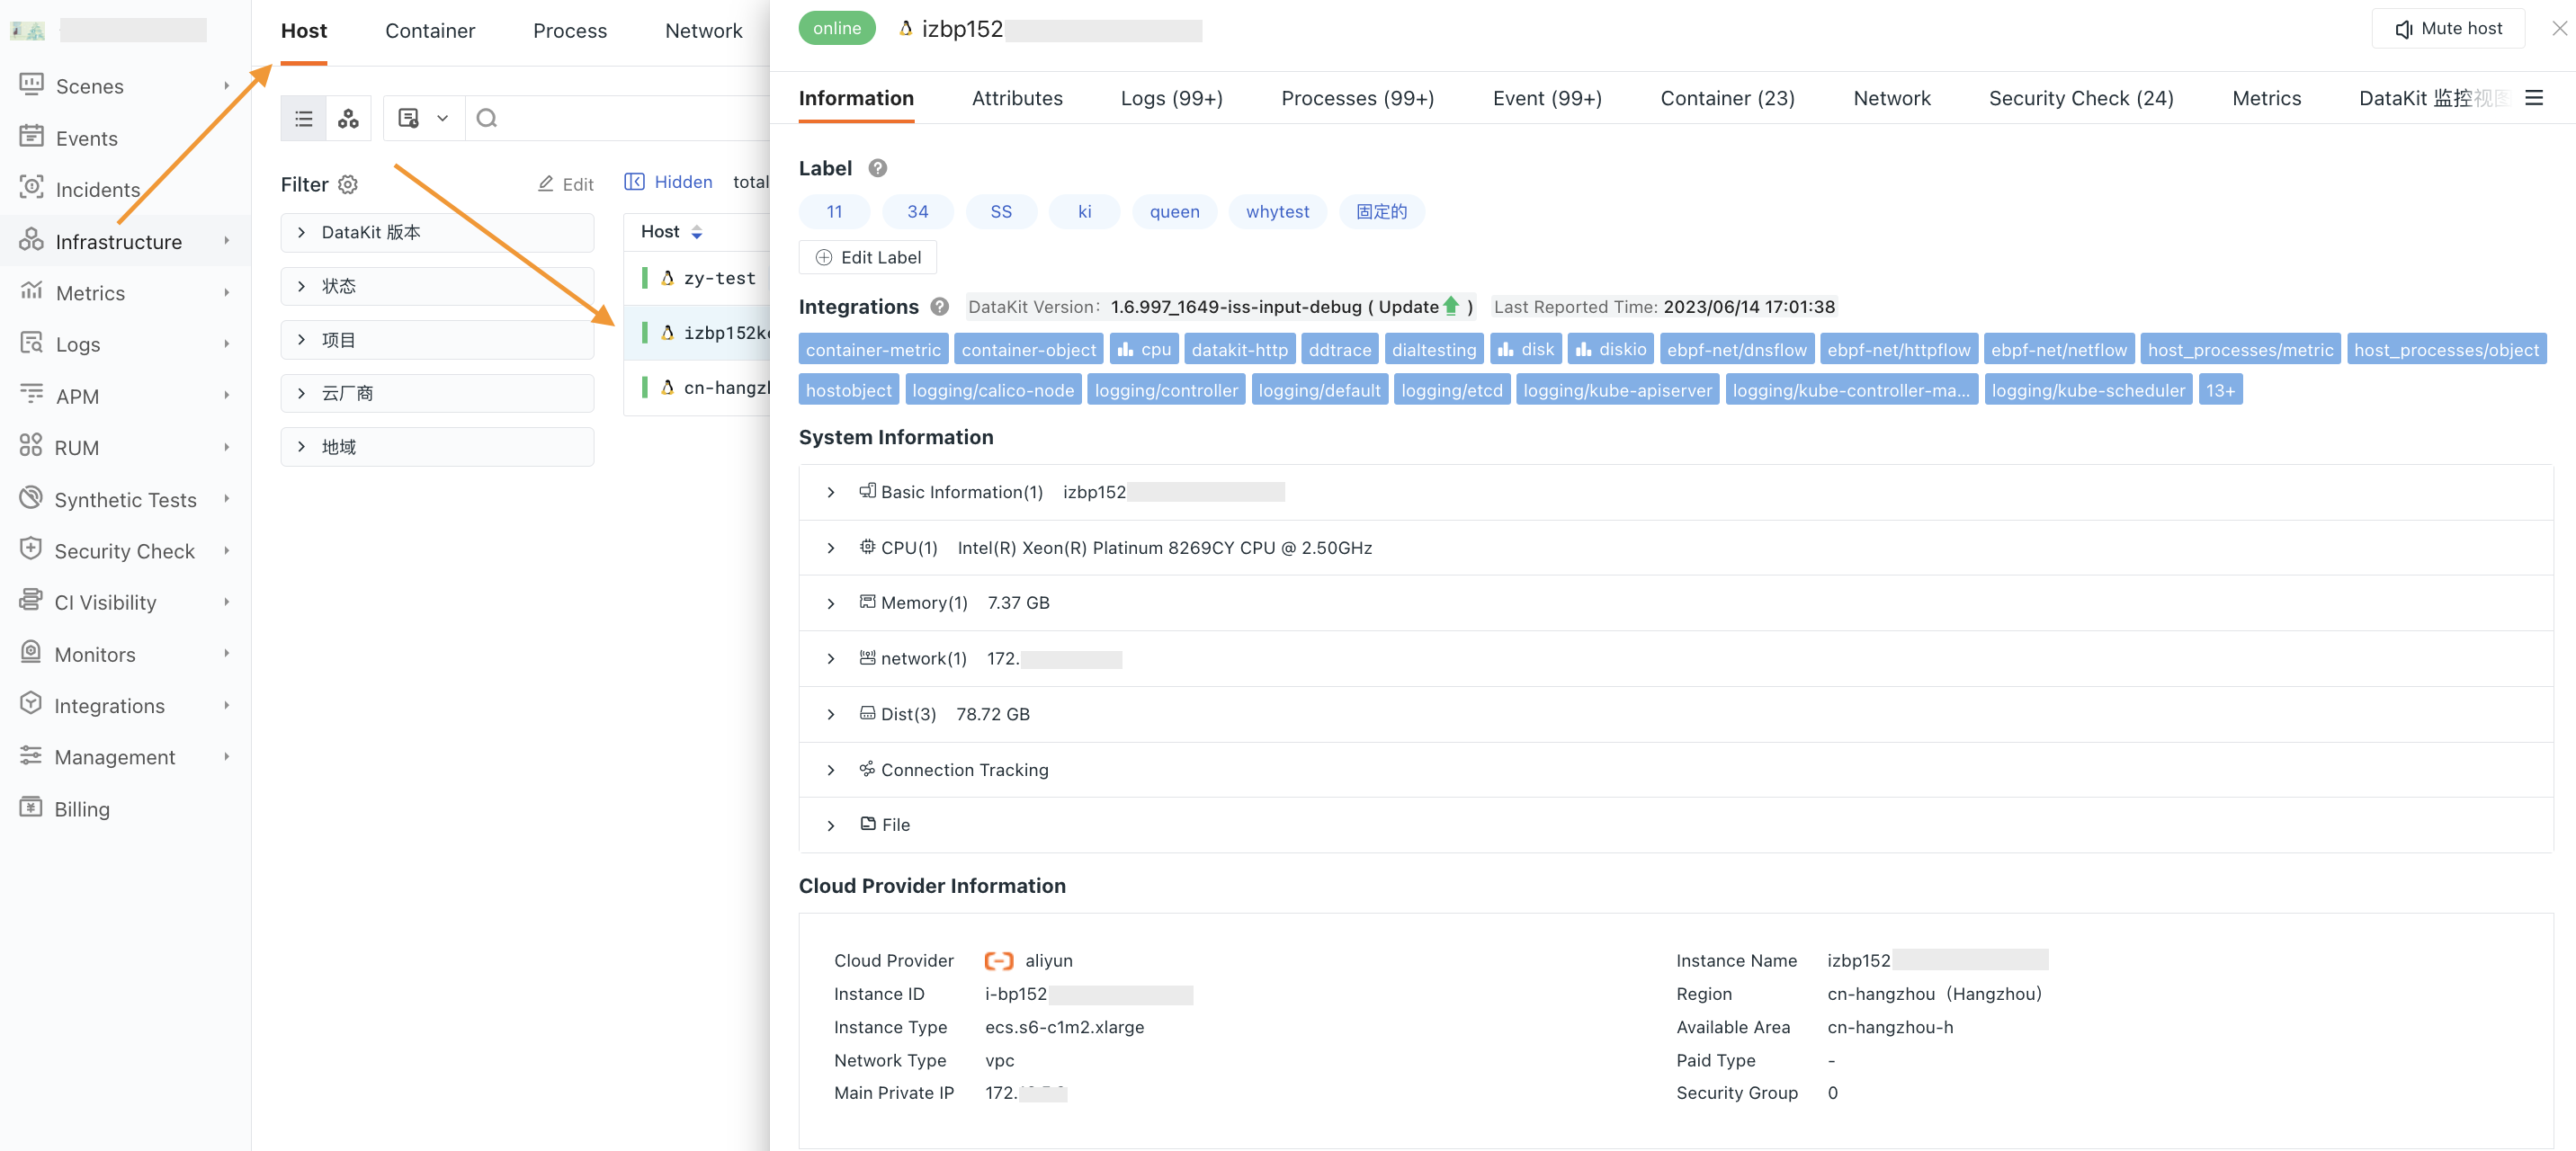
Enter the studio and click Infrastructure on the left to view the list of hosts with DataKit installed.
More reading: DataKit Service Management, DataKit Status Query and DataKit Troubleshooting.
Execute the following command to get the basic operation of the native DataKit.
Step 3: Start Guance
After the datakit is successfully installed, a batch of data metrics collectors are turned on by default without having to be turned on manually. According to the collected data metrics, Guance has various functions to help you observe.
Infrastructure
Guance supports collecting object data including hosts, cloud hosts, containers, processes and other cloud services and actively reporting them to the workspace.
Scenes
In Guance, you can build Scenes that satisfy different businesses from different perspectives, including dashboards, notes and explorers.
Take adding a Linux dashboard here as an example:
Click Scenes on the left, click Dashboards > Create in turn, search for Linux in System View, select Host Overview _ Linux Monitoring View and click Confirm to add it.
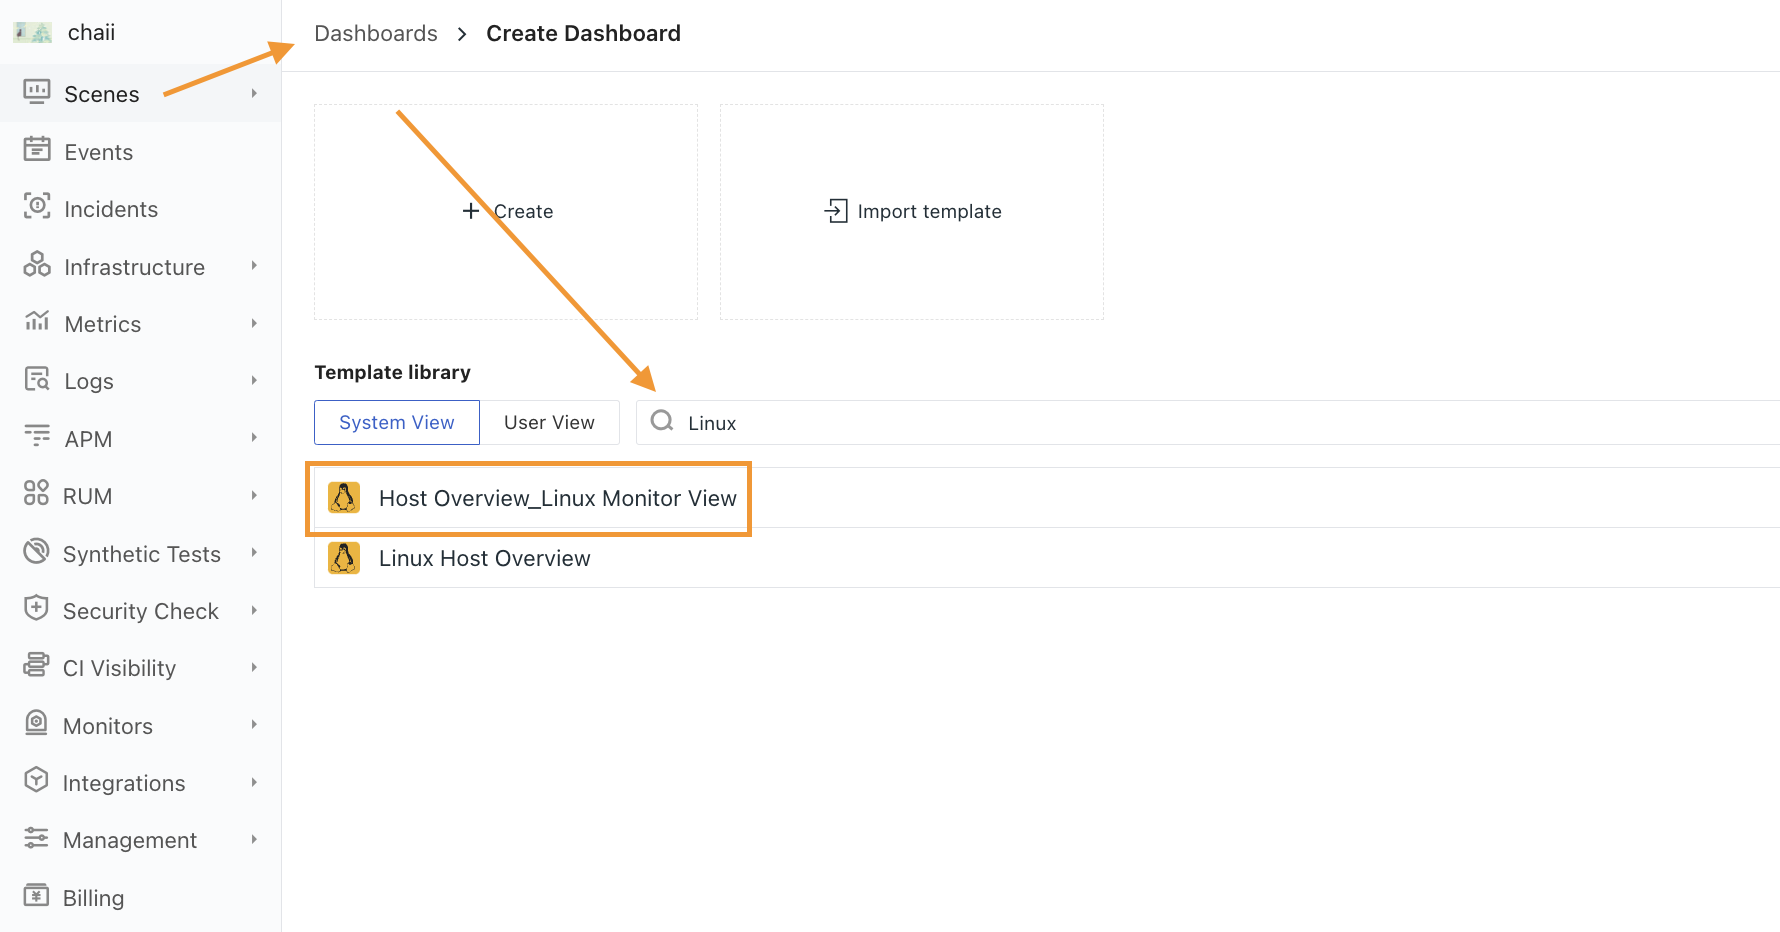
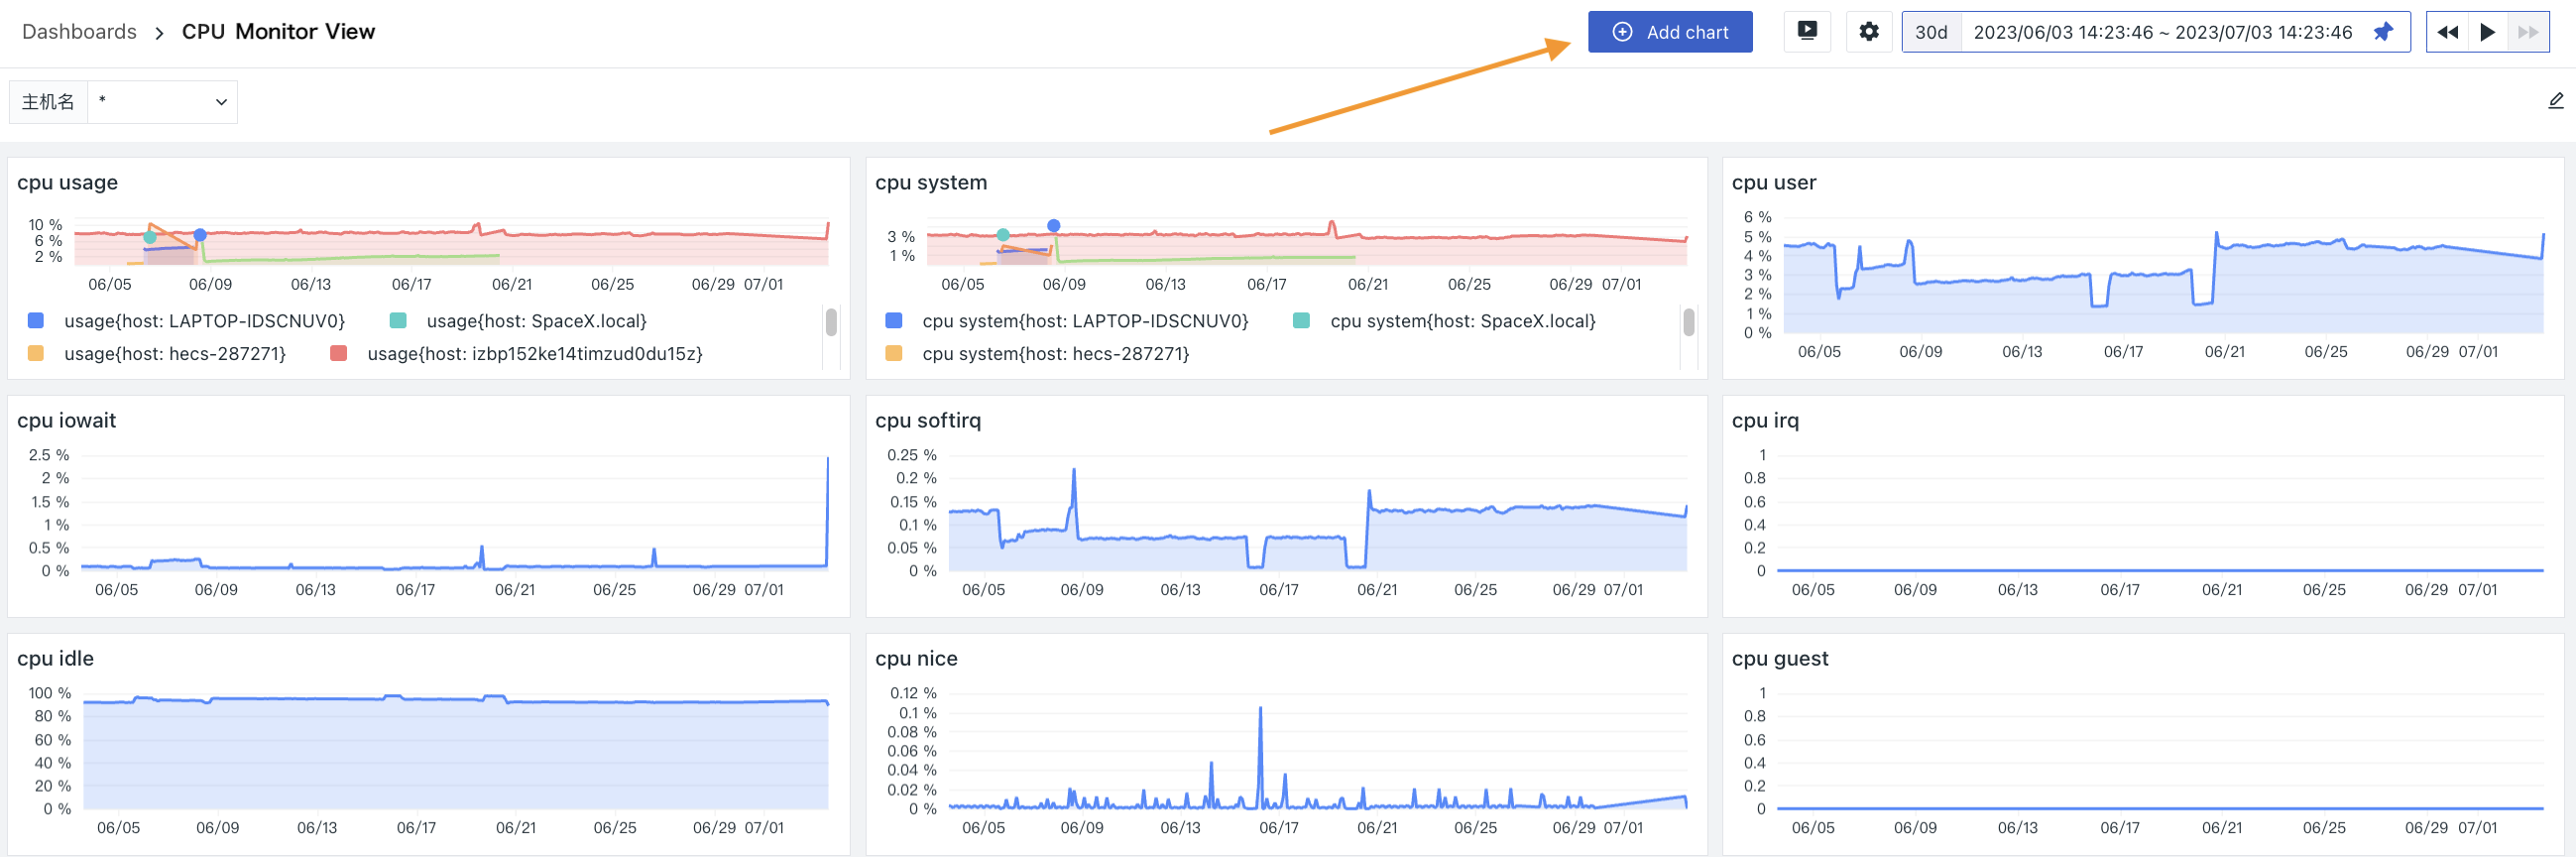
System view is a standard template provided by Guance, which helps users intuitively track, analyze and display key performance metrics and monitor the overall performance. Click Add Charts to customize the addition of a variety of visual charts.
Metrics
Guance has the ability of collecting global data, and the metric data obtained by the collector will be automatically reported to the studio. You can analyze and manage the metric data in space uniformly through Metrics.
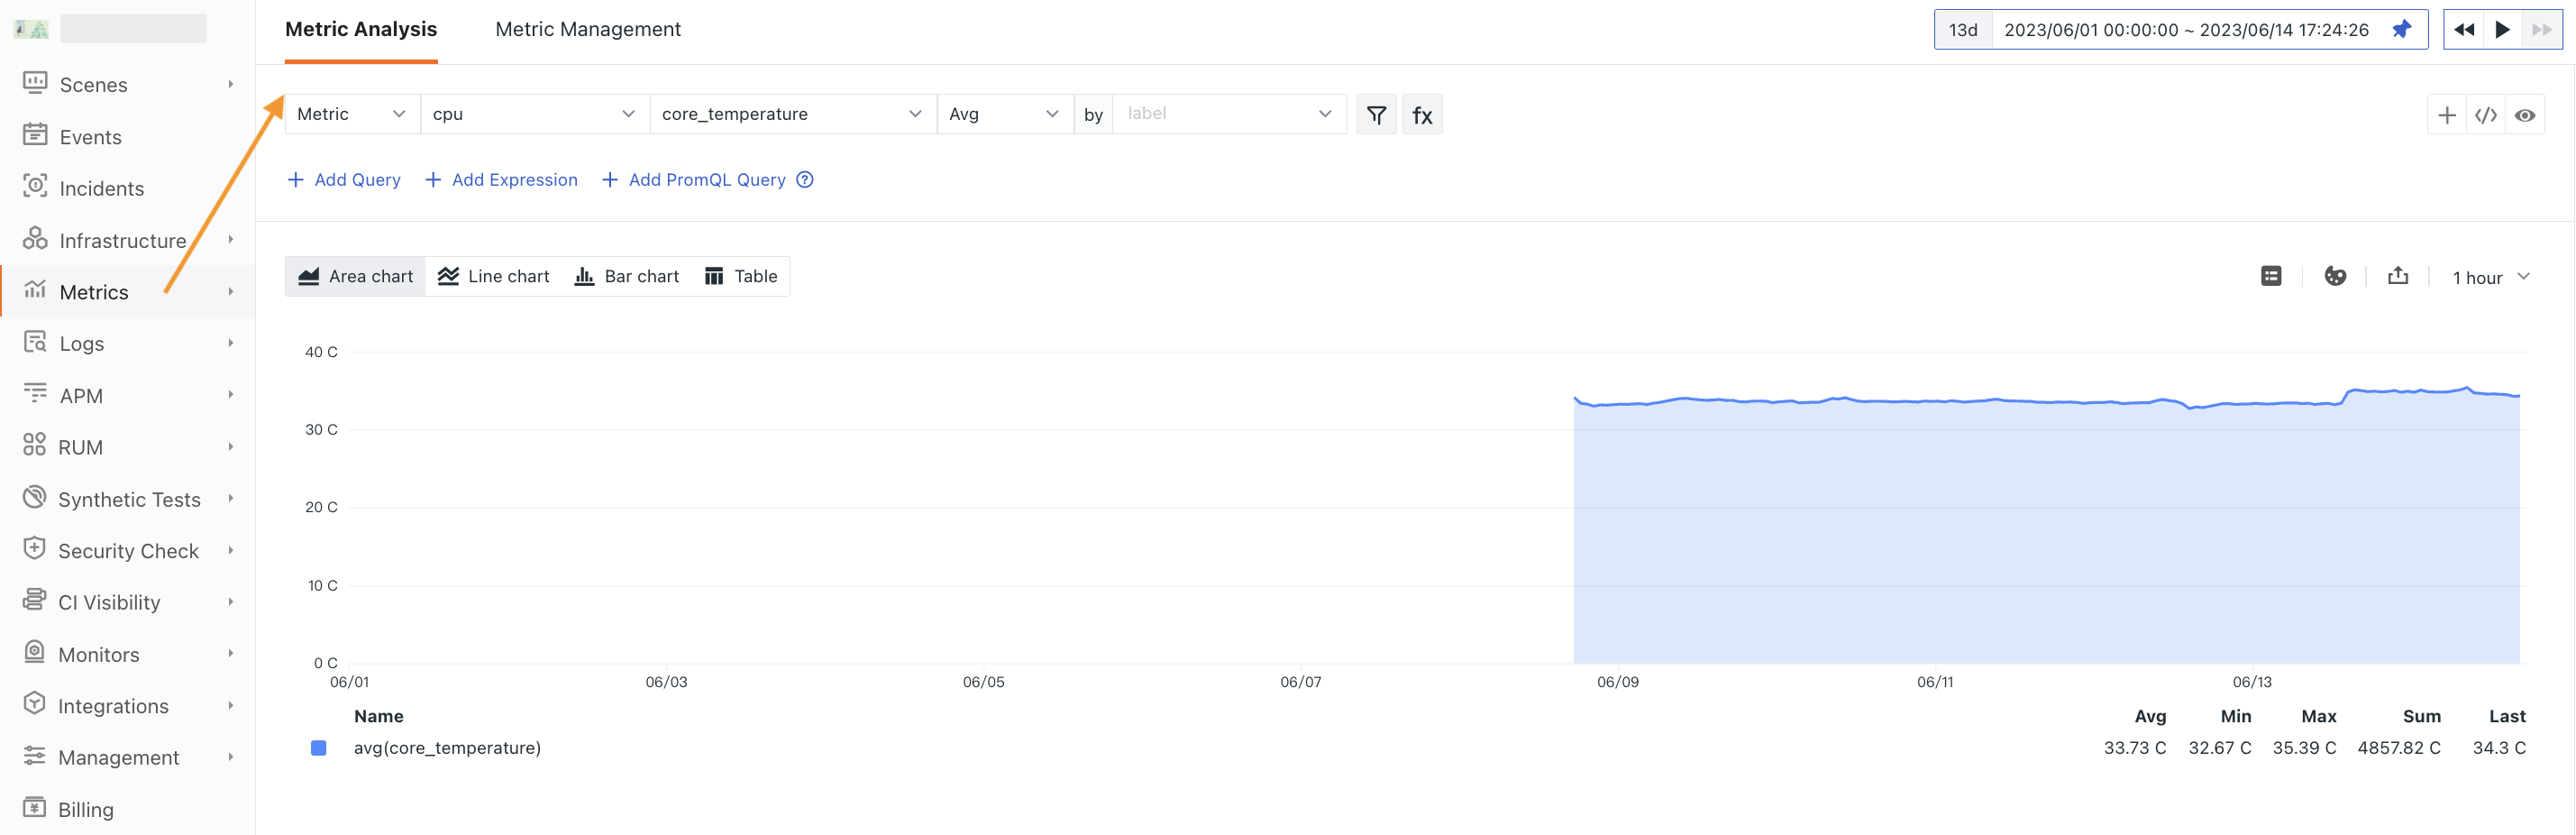
Metric Analysis can query and analyze metrics and other data types (Logs, basic objects, custom objects, events, APM, RUM, Security Check, network, Profile, etc.).
The following example shows a comparative analysis of CPU utilization of different host ip in the current workspace in the last 15 minutes.
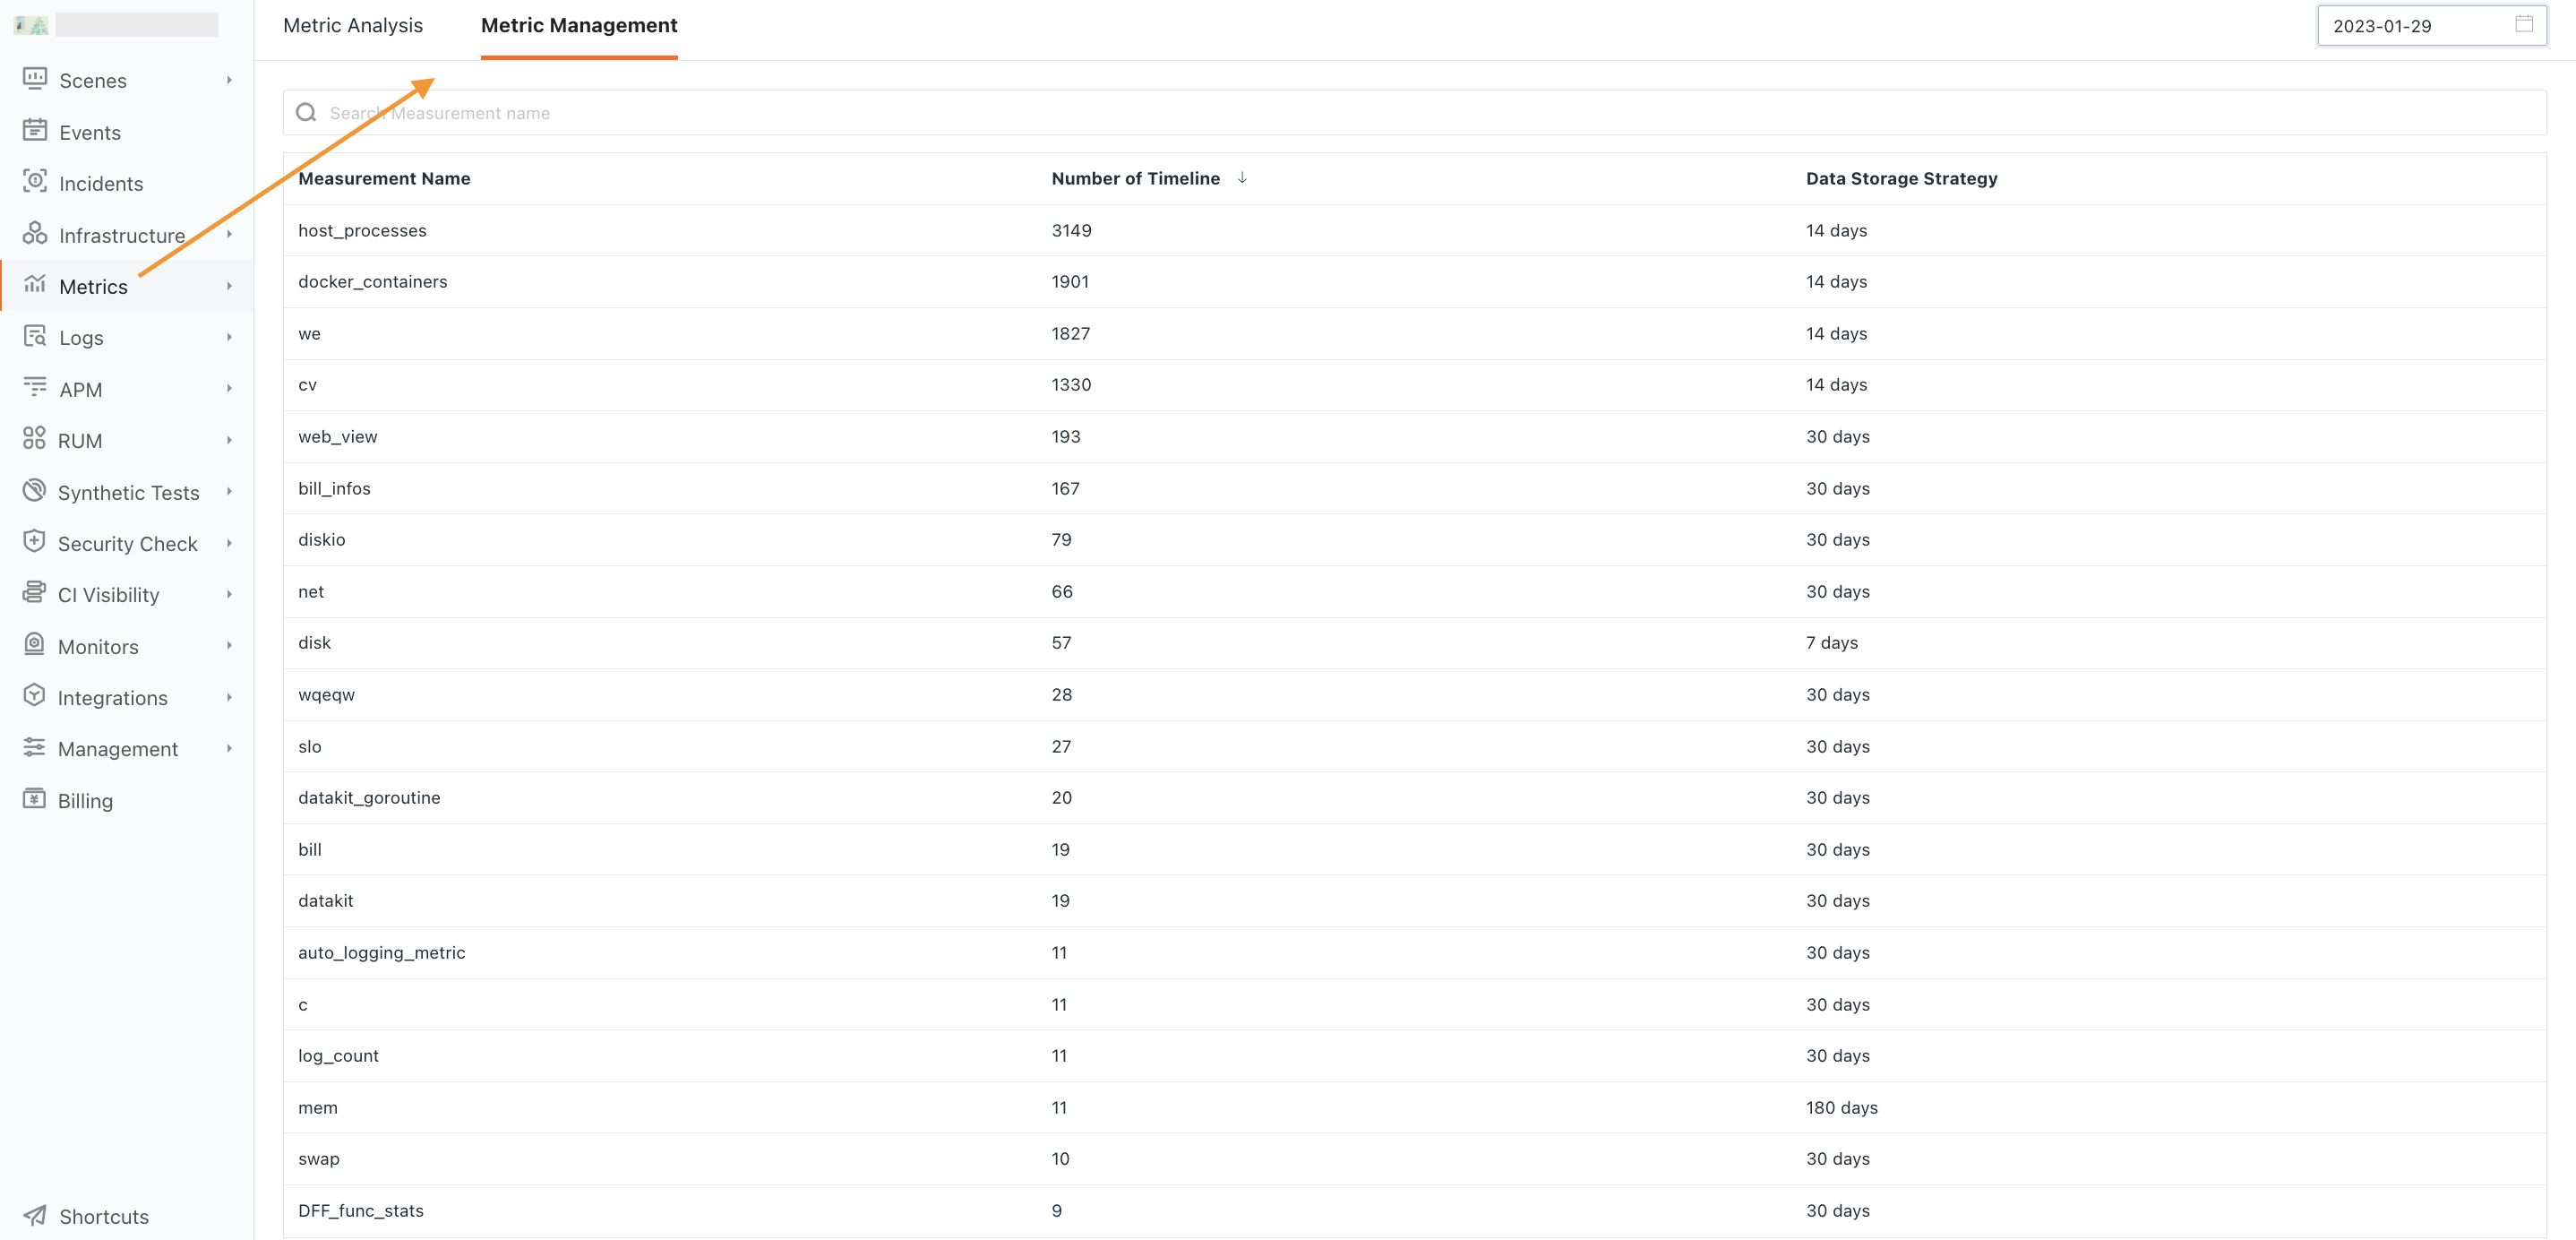
You can view all the metrics reported to the workspace, the number of timelines and data storage policy information.
Monitors
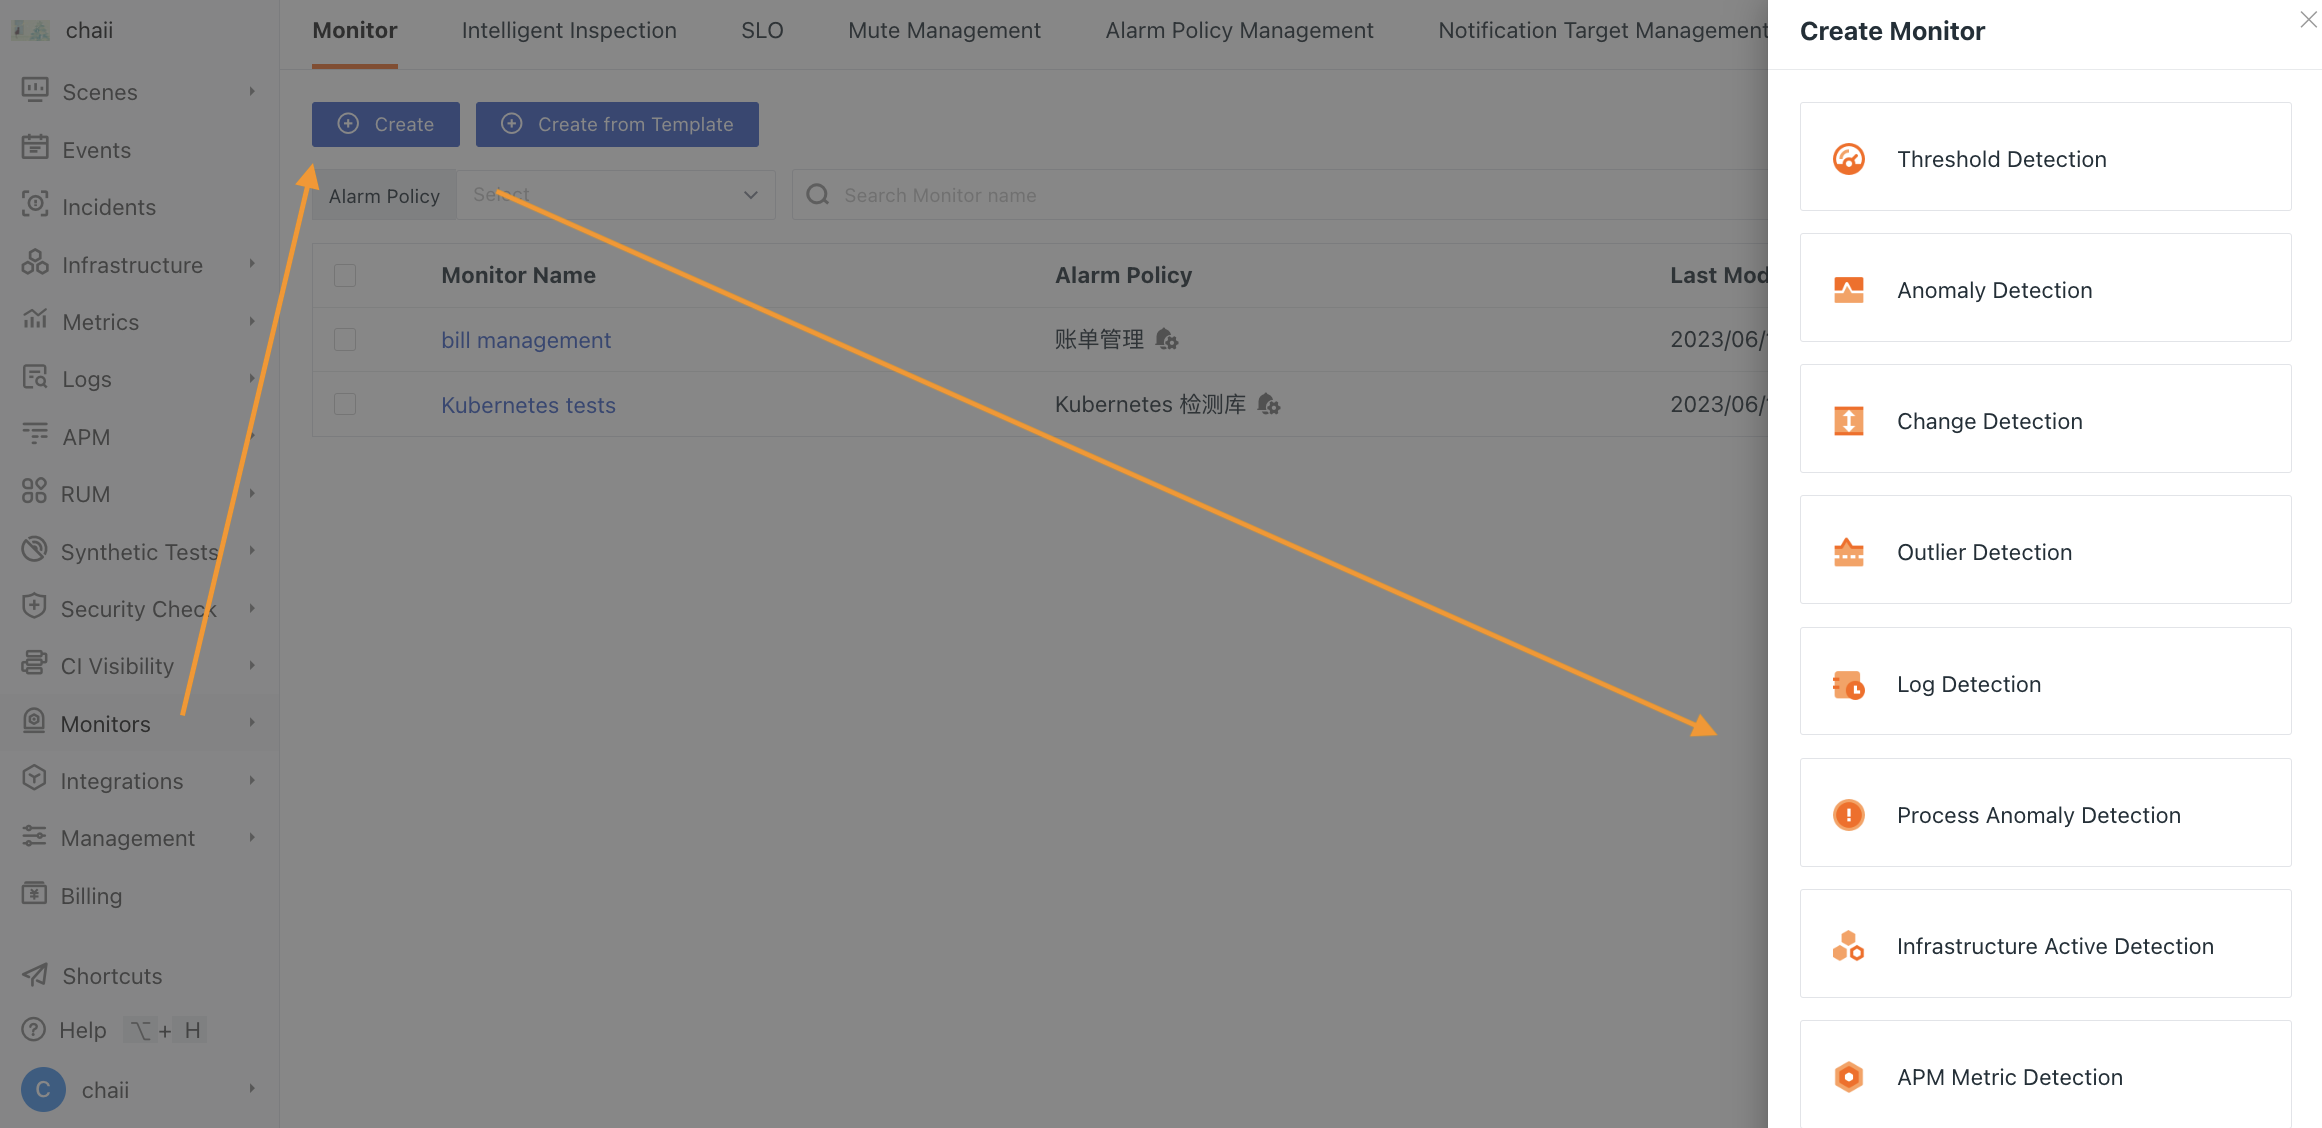
Guance has powerful anomaly monitoring capability, which not only provides a series of monitoring templates including Docker, ElasticSearch and Host, but also supports custom monitors. With the alarm notification function, it can find problems in time to help you quickly find, locate and solve problems.
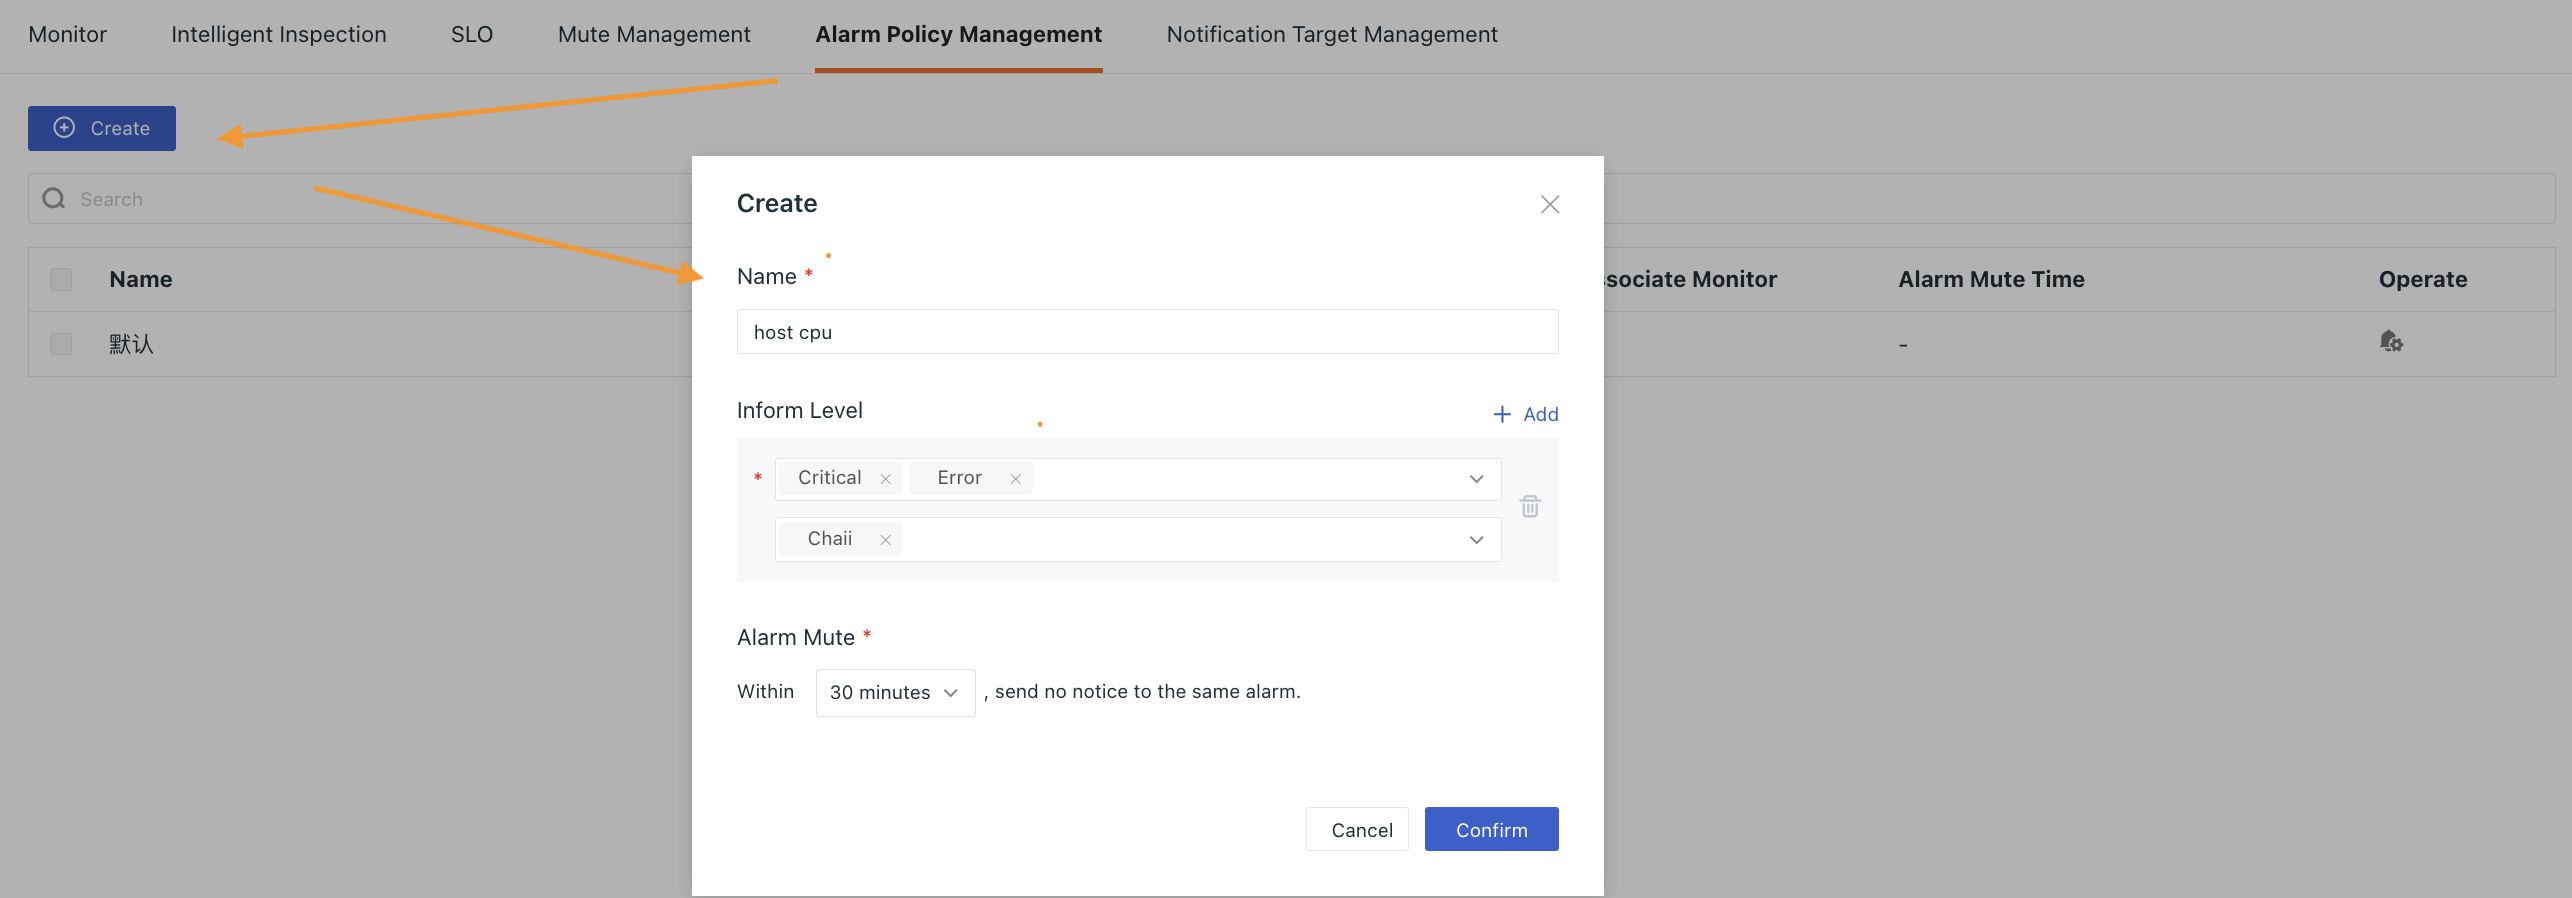
In Monitors, you can choose Create or Import template.
The following example shows that in the current workspace, once every 1 minute, whether there is the maximum memory utilization value of a host ip in the past 15 minutes triggers different levels of threshold detection conditions.
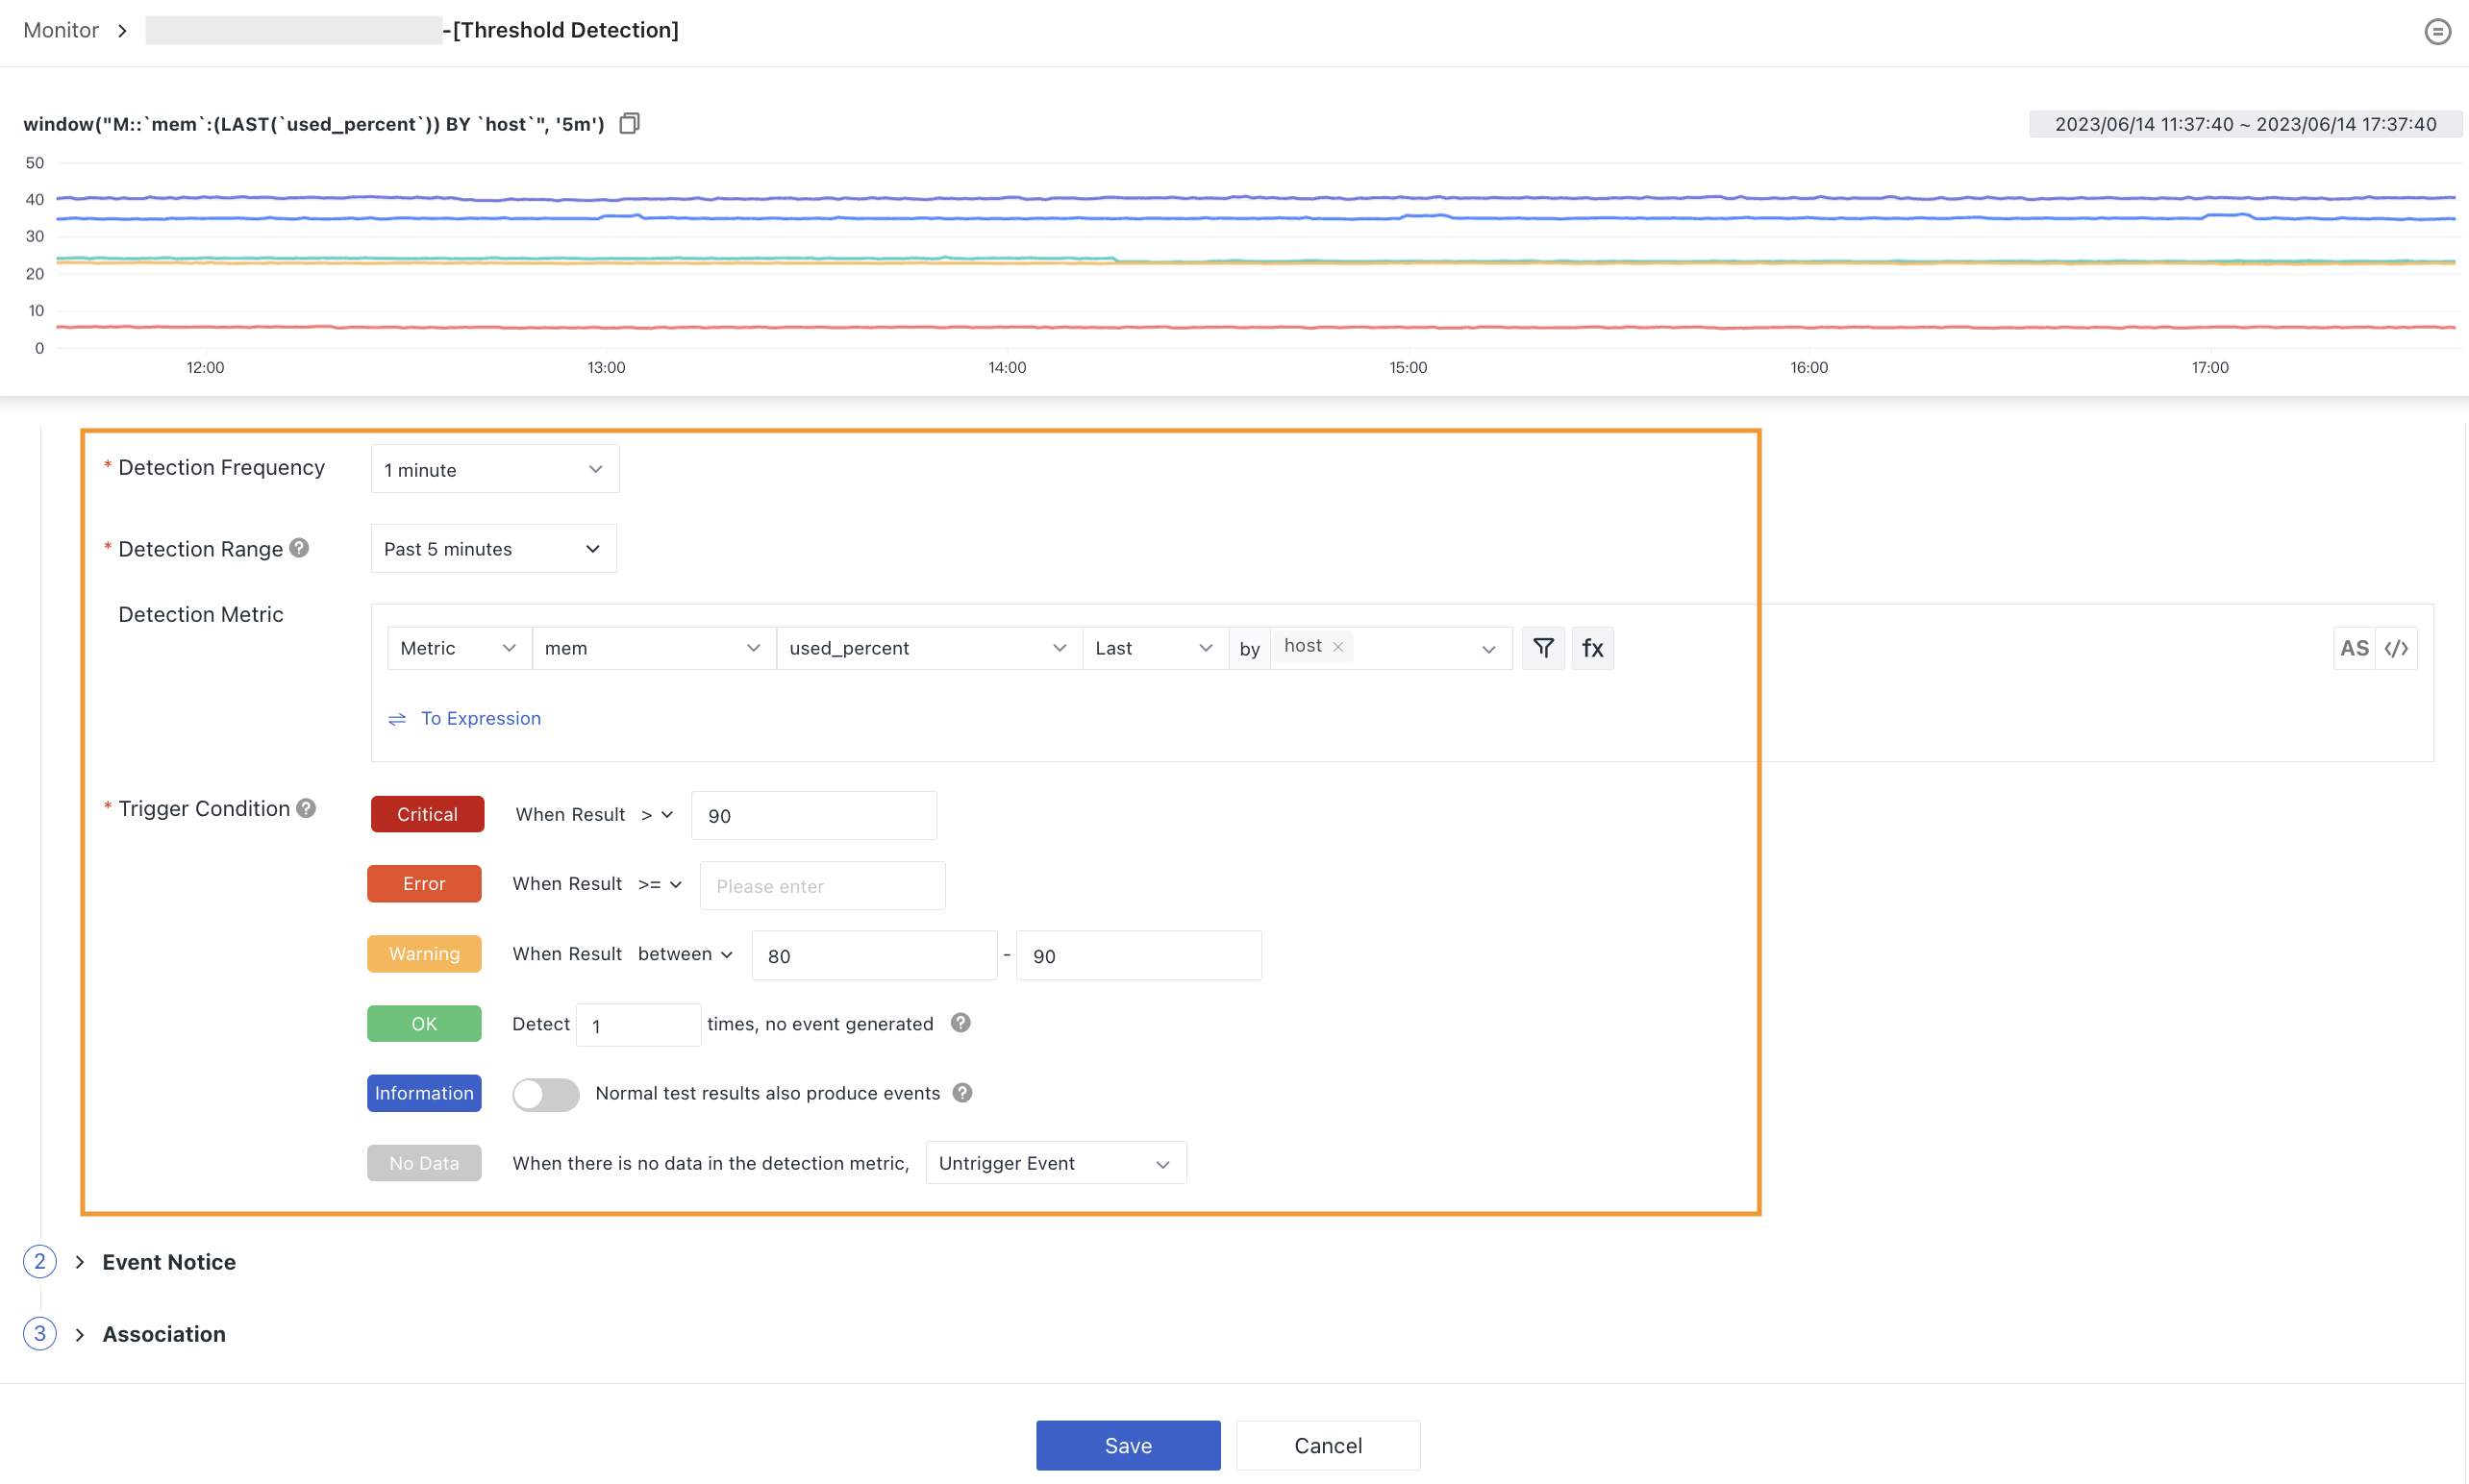
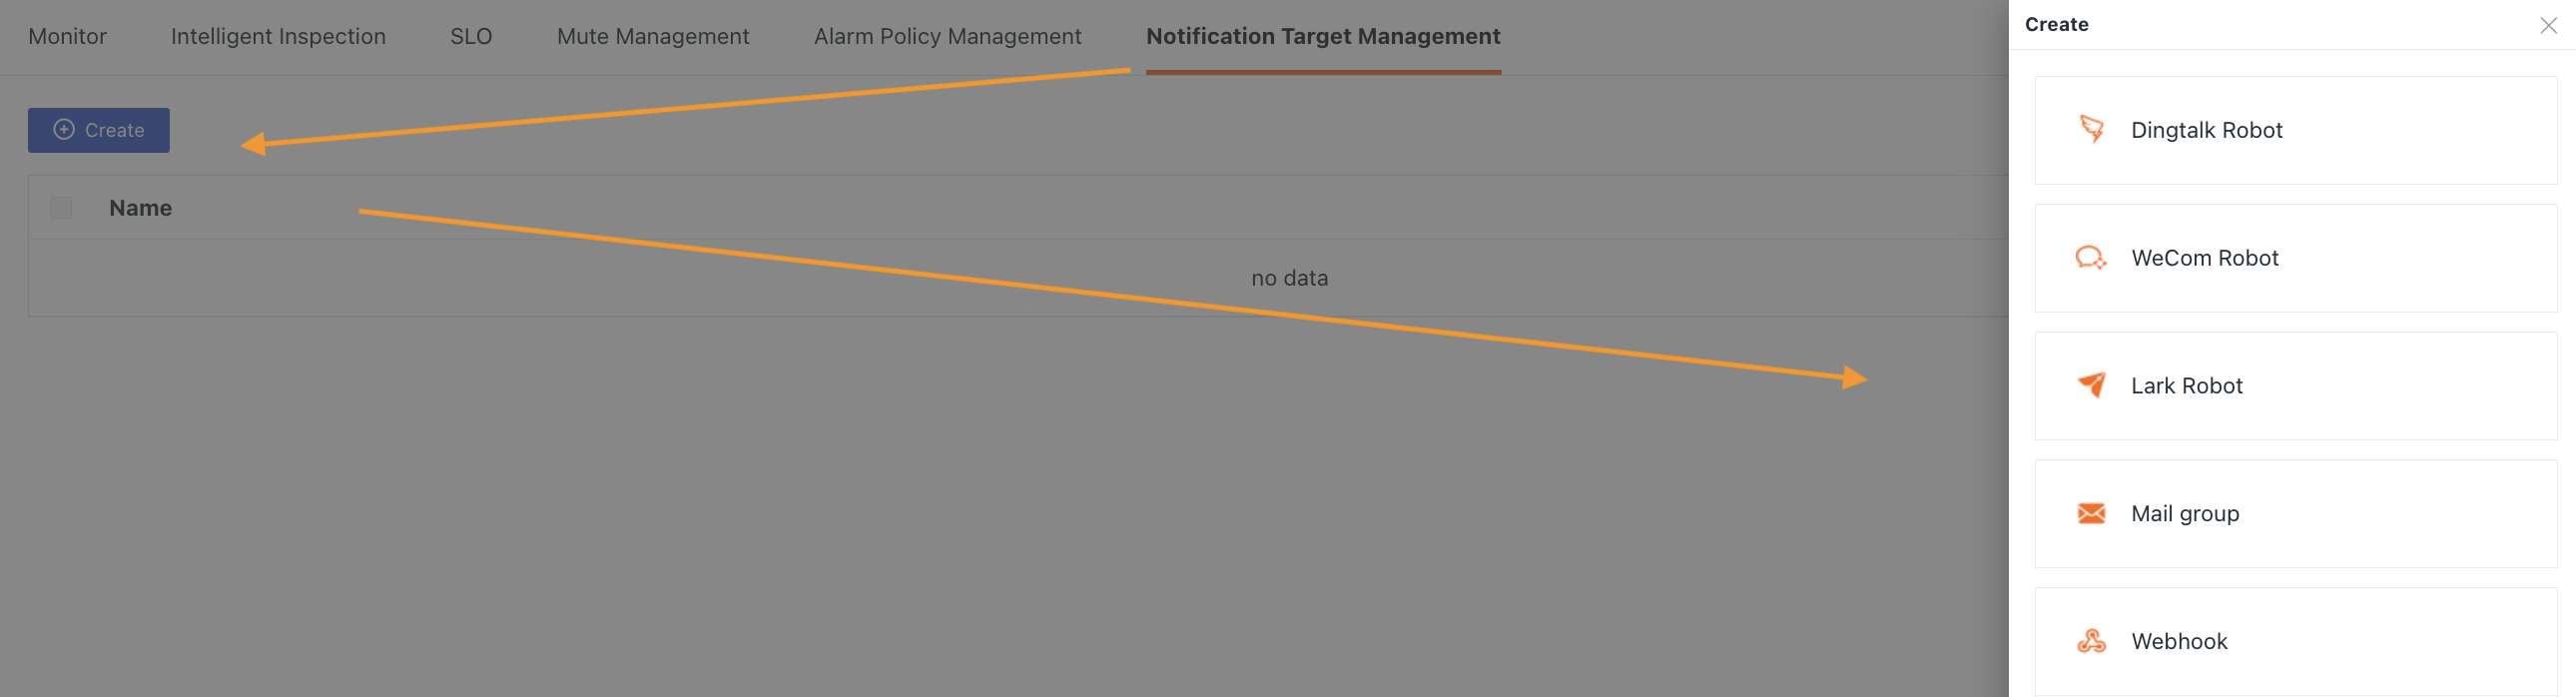
If it is necessary to send alarm information to a specific notification object when the monitor triggers the condition, relevant configuration can be carried out in the corresponding module.
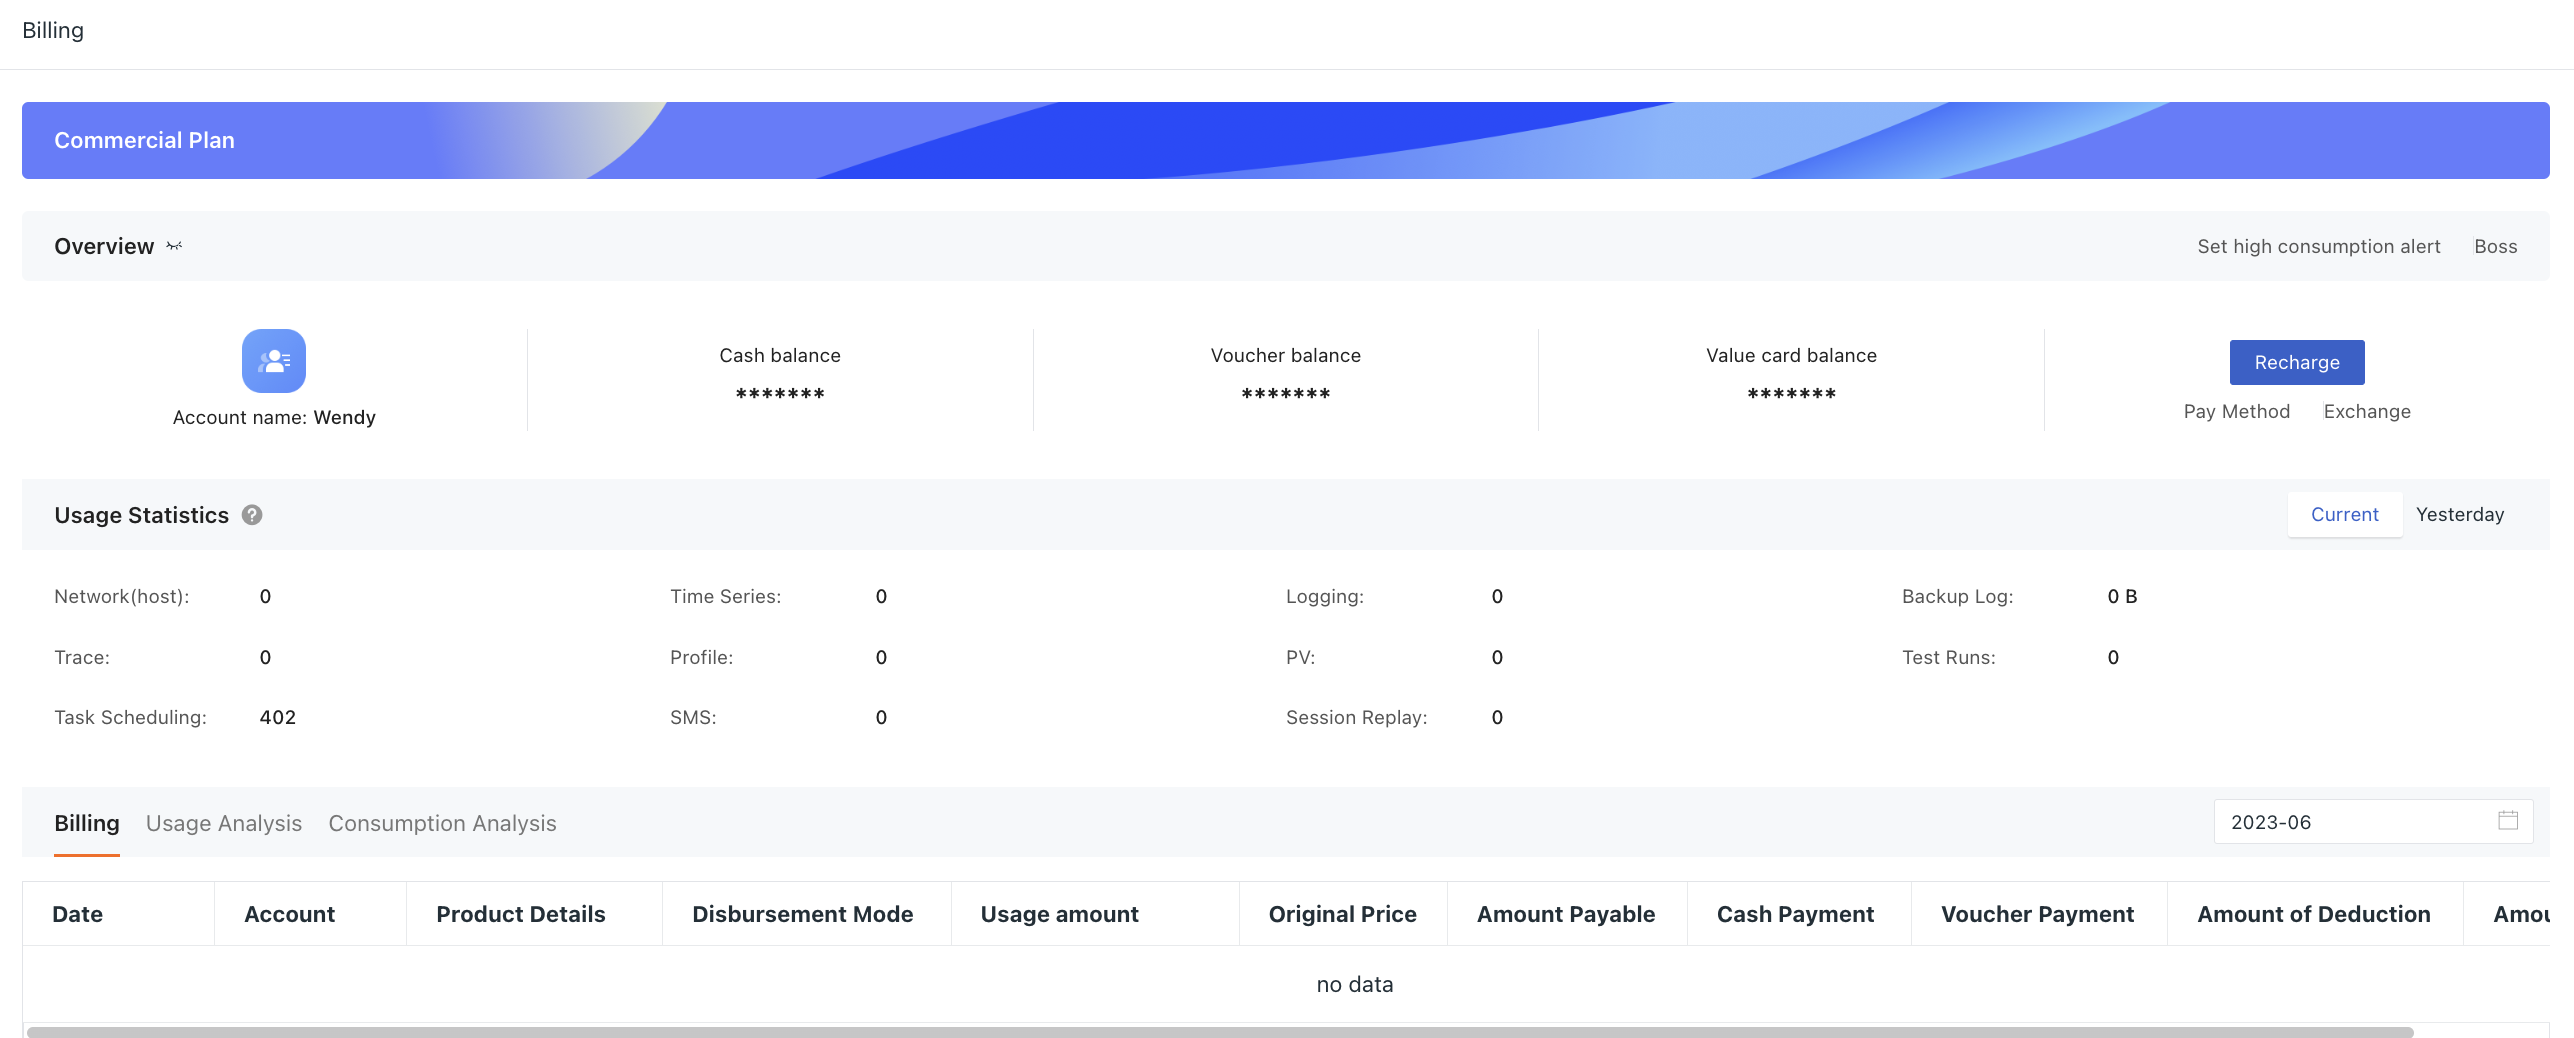
Billing
In Billing, you can view the plan information, usage statistics, billing list and other information of the current workspace.
The following figure shows the perspective of the owner of the commercial workspace: