Server Application Error Inspection
Background
When the server encounters runtime errors, we need to detect them early and issue timely warnings so that developers and operations personnel can troubleshoot. It's important to promptly confirm whether these errors have potential impacts on the application. The content reported by the server application error inspection event is a reminder for developers and operations teams about new errors that occurred in the past hour and provides diagnostic clues associated with the specific location of the error.
Prerequisites
- Guance "Application Performance Monitoring" has already integrated applications.
- Self-hosted DataFlux Func Guance Special Edition or activate DataFlux Func (Automata).
- In Guance "Management / API Key Management," create an API Key used for operations.
Note: If you're considering using cloud servers for offline deployment of DataFlux Func, ensure it’s deployed with the same carrier and region as the currently used Guance SaaS deployment here.
Enabling Inspections
In your self-hosted DataFlux Func, install "Guance Custom Inspection (APM Errors)" via the "Script Market" and configure the Guance API Key to complete the activation process.
In the DataFlux Func Script Market, select the inspection scenario you want to enable, click Install, configure the Guance API Key and GuanceNode, then choose to deploy and start the script.

After successfully deploying the startup script, it will automatically create the startup script and automatic trigger configuration. You can directly jump to view the corresponding configuration through the link.

Configuring Inspections
You can configure filtering conditions for inspections in either the Intelligent Inspection module of Guance Studio or in the automatically generated startup script in DataFlux Func. Below are two configuration methods for reference:
Configuring Inspections in Guance
Enable/Disable
Memory leak inspections are enabled by default but can be manually turned off. Once enabled, inspections will run for the configured service list.
Editing
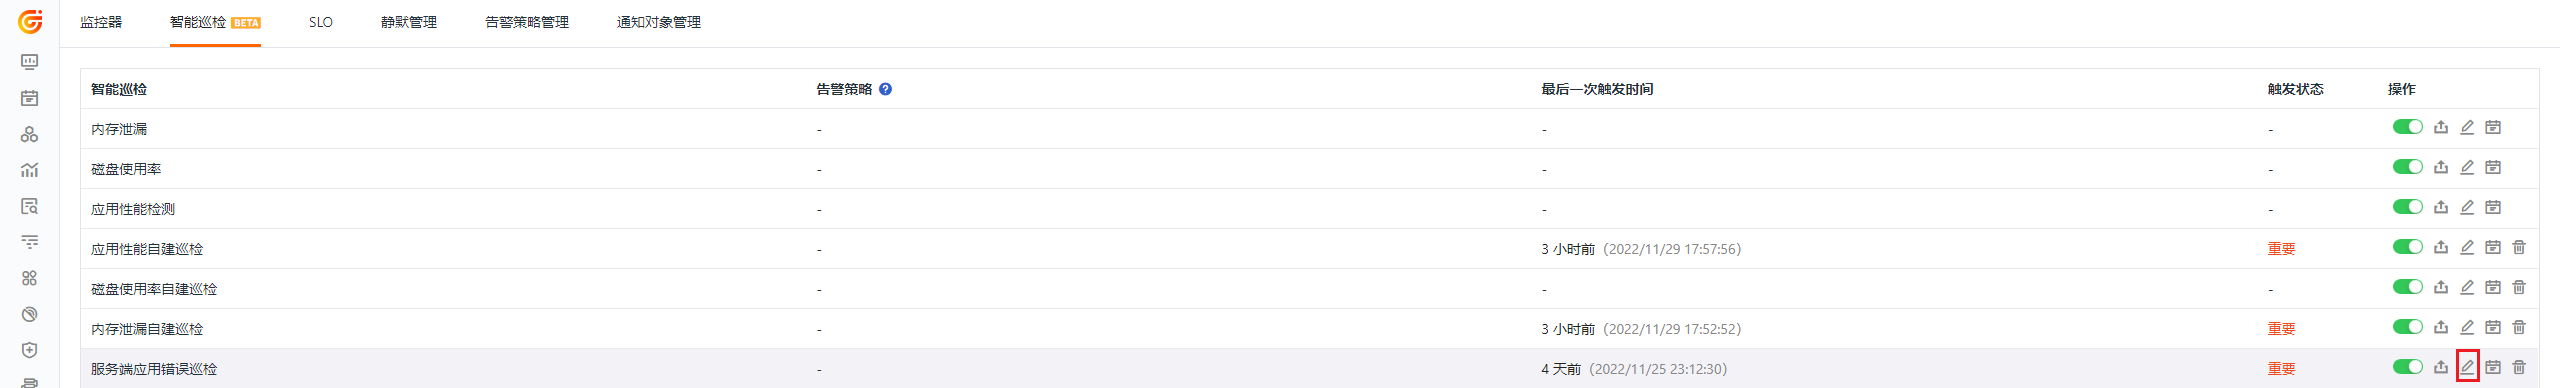
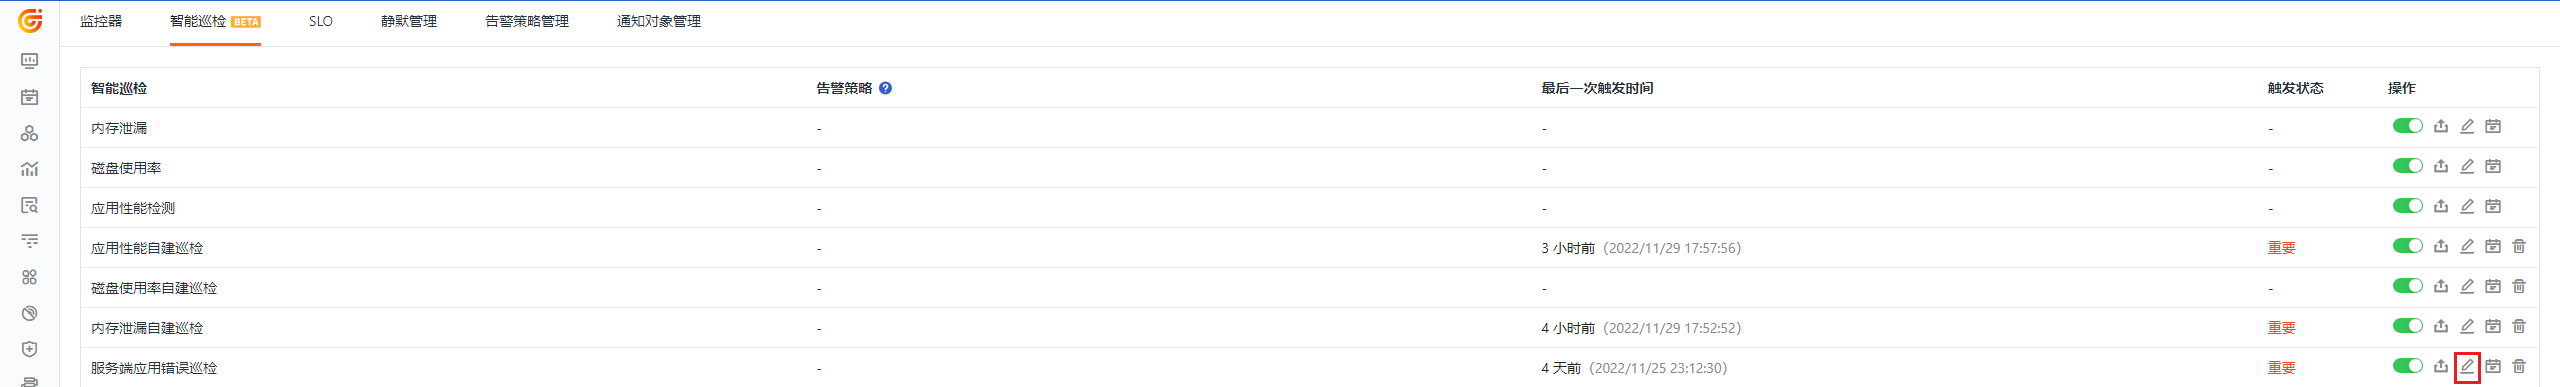
The intelligent inspection "Server Application Error Inspection" supports manual addition of filter conditions. Click the Edit button under the operation menu on the right side of the intelligent inspection list to edit the inspection template.
- Filter Conditions: Configure the list of app_names to be detected (optional; if not configured, all app_names will be detected by default).
- Alert Notifications: Supports selecting and editing alert strategies, including the event level of notifications, notification targets, and the alert silence period.
To configure entry parameters, click Edit, enter the corresponding detection objects in the parameter configuration, and save to start the inspection:
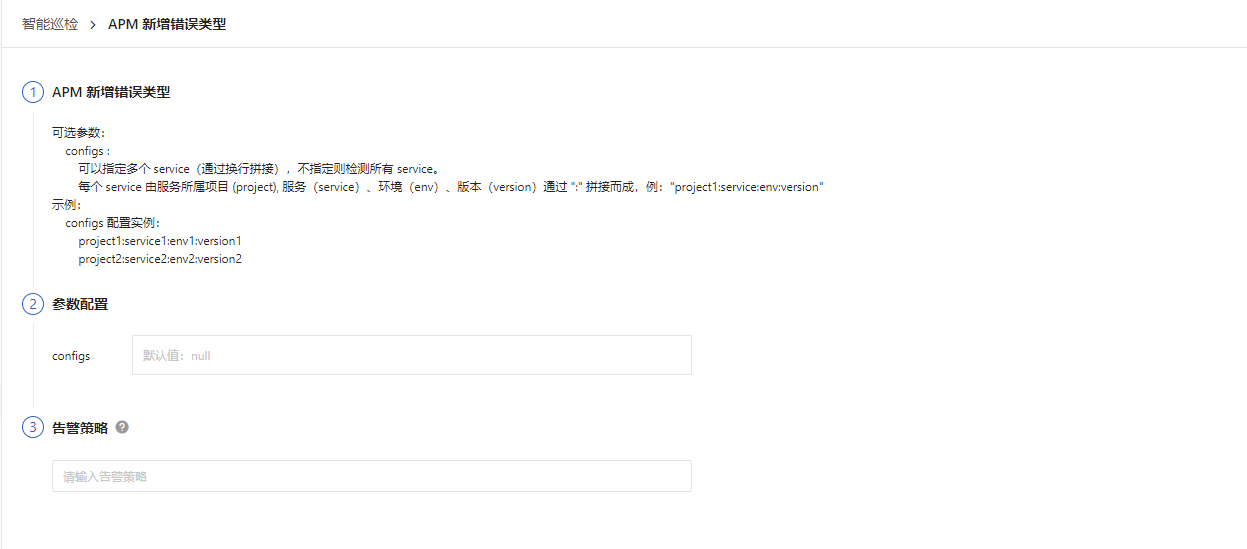
You can refer to the following example to configure multiple projects, environments, versions, and services:
 // Configuration Example:
    configs Configuration Instance:
        project1:service1:env1:version1
        project2:service2:env2:version2
Note: In the self-hosted DataFlux Func, when writing custom inspection processing functions, additional filtering conditions can also be added (refer to sample code configurations). Note that parameters configured in Guance Studio will override those set in the custom inspection processing function.
Configuring Inspections in DataFlux Func
In DataFlux Func, after configuring the required filtering conditions for the inspection, you can test by selecting the run() method directly from the page and clicking Run. After publishing, the script will execute normally. You can also view or modify the configuration in Guance "Monitoring / Intelligent Inspection."
from guance_monitor__runner import Runner
from guance_monitor__register import self_hosted_monitor
import guance_monitor_apm_error__main as main

# Support for using filtering functions to filter the objects being inspected, for example:
def filter_project_servcie_sub(data):
    project = data['project']
    service_sub = data['service_sub']
    '''
    Filter service_sub, define conditions that match service_sub, return True for matching, False otherwise.
    return True|False
    '''
    if service_sub in ['xxx-xxx-auth:dev:1.0']:
        return True


@self_hosted_monitor(account['api_key_id'], account['api_key'])
@DFF.API('New APM Error Types', fixed_crontab='0 * * * *', timeout=900)
def run(configs=None):
    """
    Optional Parameters:
        configs :
            Can specify multiple services (by concatenating with line breaks), unspecified detects all services.
            Each service consists of the project (project), service, environment (env), and version (version) concatenated with ":", e.g., "project1:service:env:version"
    Example:
        configs Configuration Instance:
            project1:service1:env1:version1
            project2:service2:env2:version2
    """
    checkers = [
        main.ApmErrorCheck(configs=configs, filters=[filter_project_servcie_sub]), # Support for user-configured multiple filtering functions that are executed sequentially.
    ]

    Runner(checkers, debug=False).run()
Viewing Events
This inspection scans for newly added application errors in the last hour. When new errors occur, the intelligent inspection generates corresponding events. Under the operation menu on the right side of the intelligent inspection list, click the View Related Events button to view the corresponding abnormal events.
Event Details Page
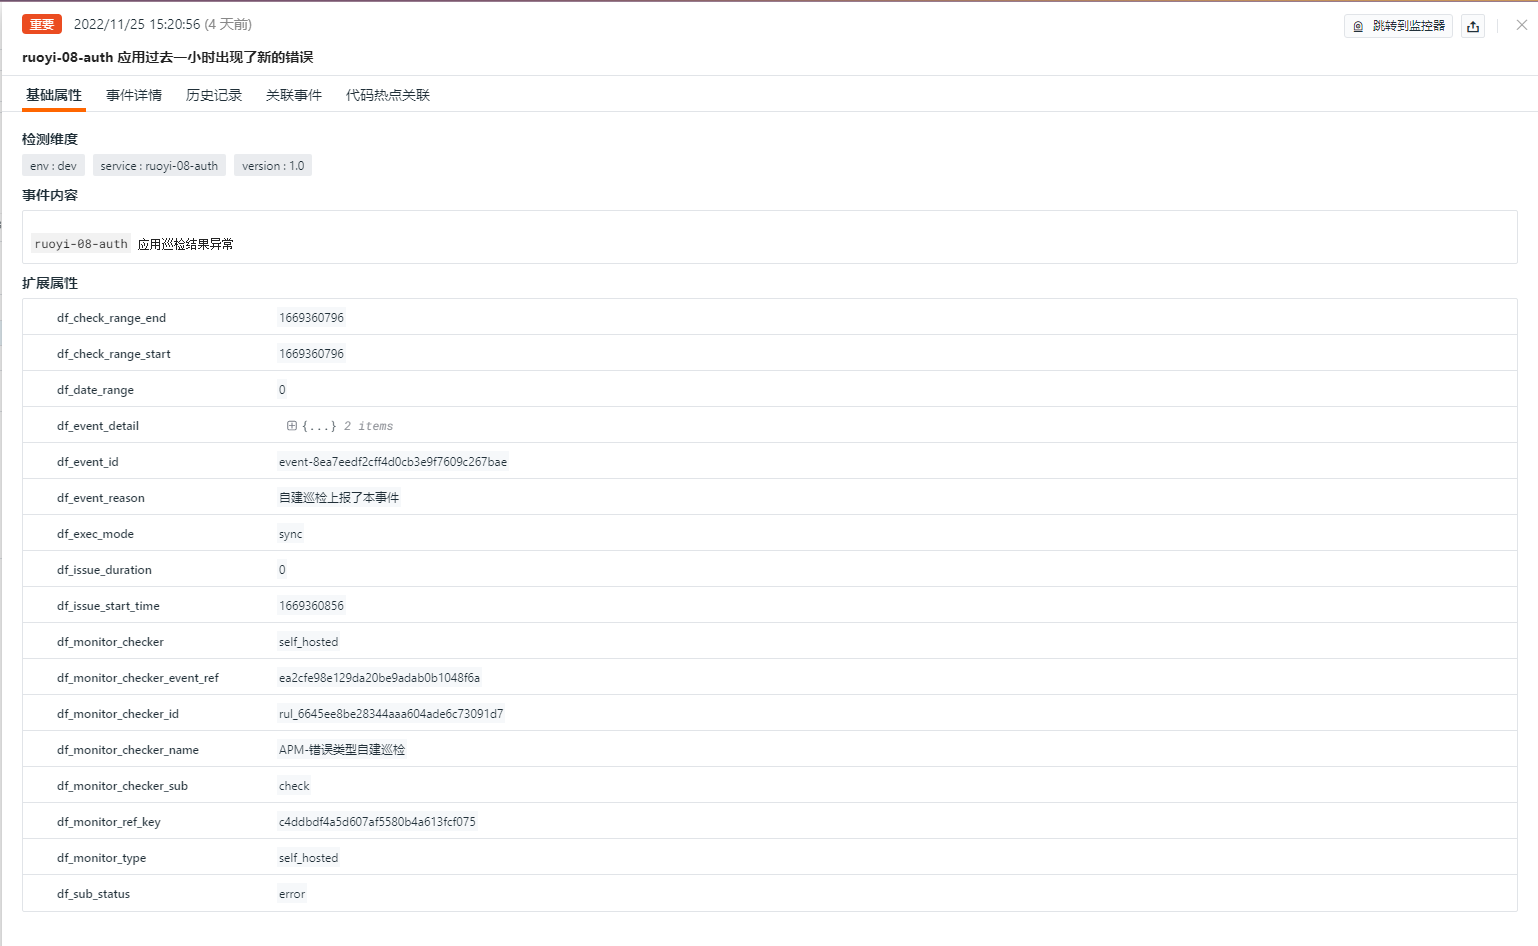
Click Event to view the details page of the intelligent inspection event, which includes the event status, the time of the anomaly occurrence, the anomaly name, basic attributes, event details, alert notifications, history records, and related events.
- Click the small icon in the upper-right corner of the details page labeled "View Monitor Configuration" to view and edit the current intelligent inspection configuration details.
Basic Attributes
- Detection Dimensions: Based on the filtering conditions set in the intelligent inspection configuration, support copying detection dimensions
key/value, adding to filters, and viewing related logs, containers, processes, security checks, traces, user analysis, synthetic tests, and CI data. - Extended Attributes: After selecting extended attributes, support copying in
key/valueformat, forward/reverse filtering.
Event Details
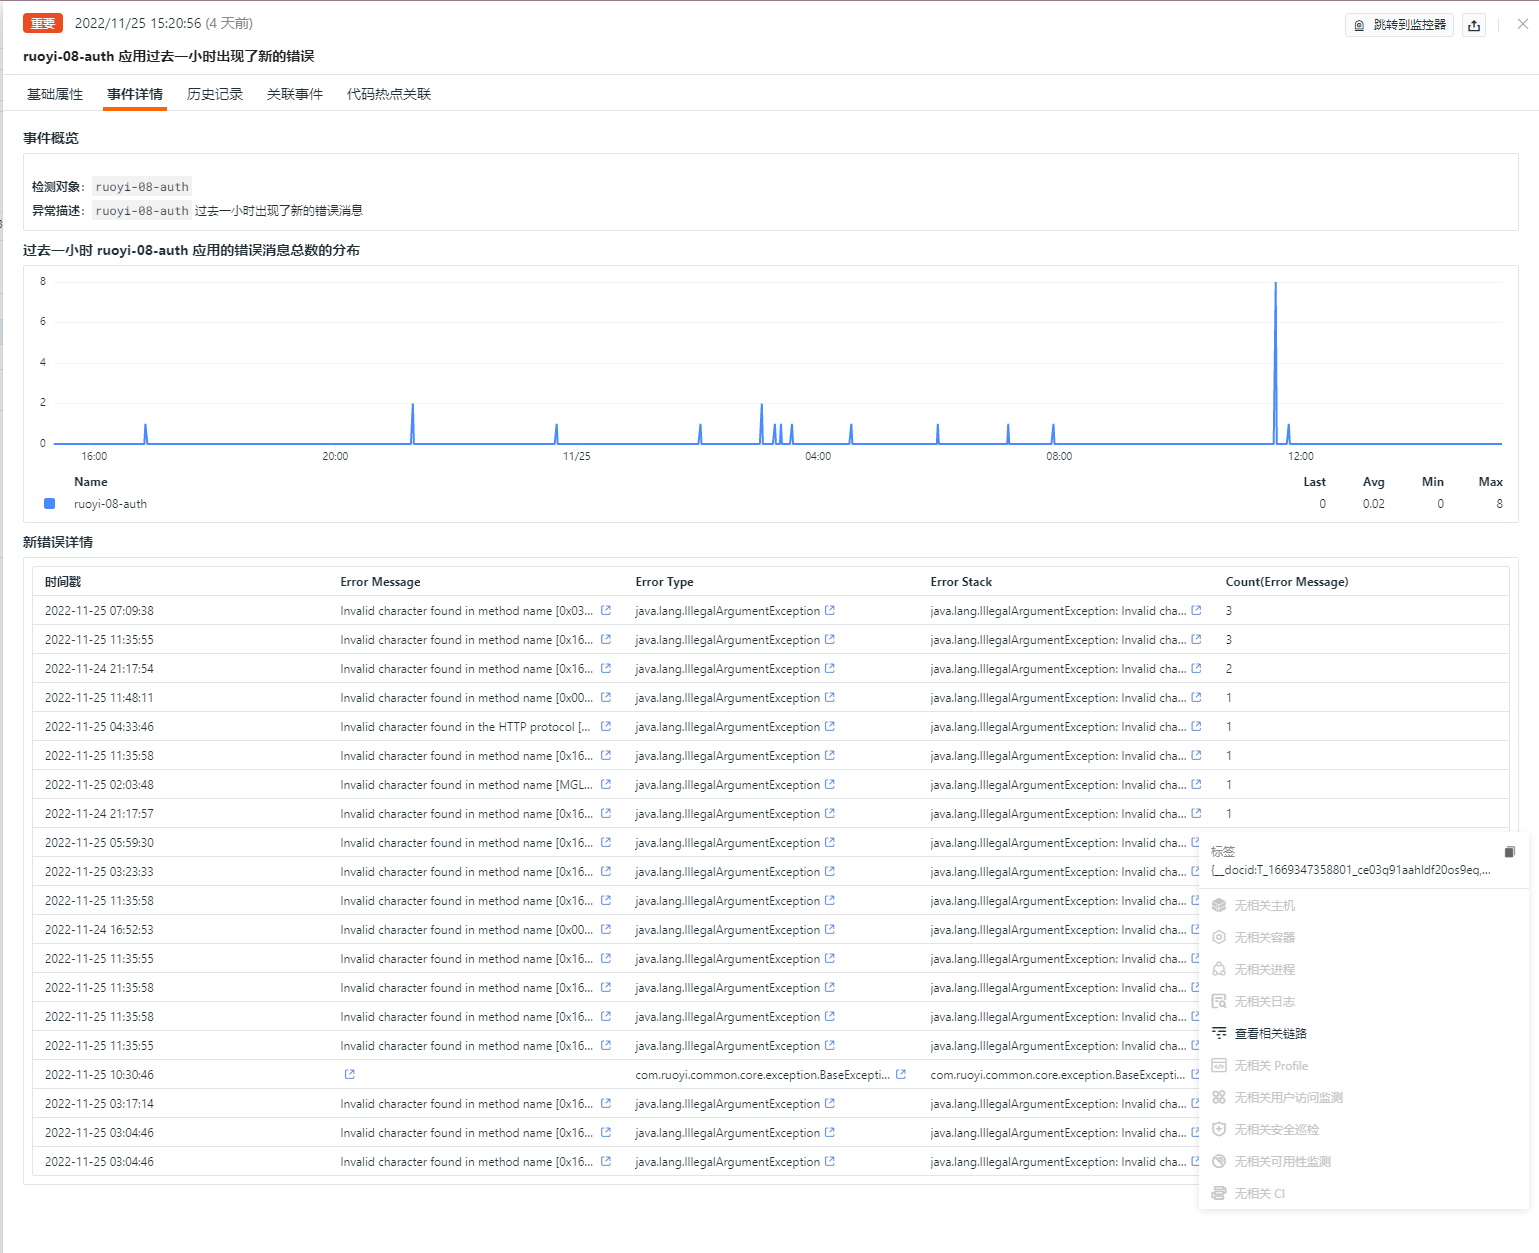
- Event Overview: Describes the object and content of the abnormal inspection event.
- Error Distribution: View the change in the number of errors that occurred in the last hour for the current abnormal application.
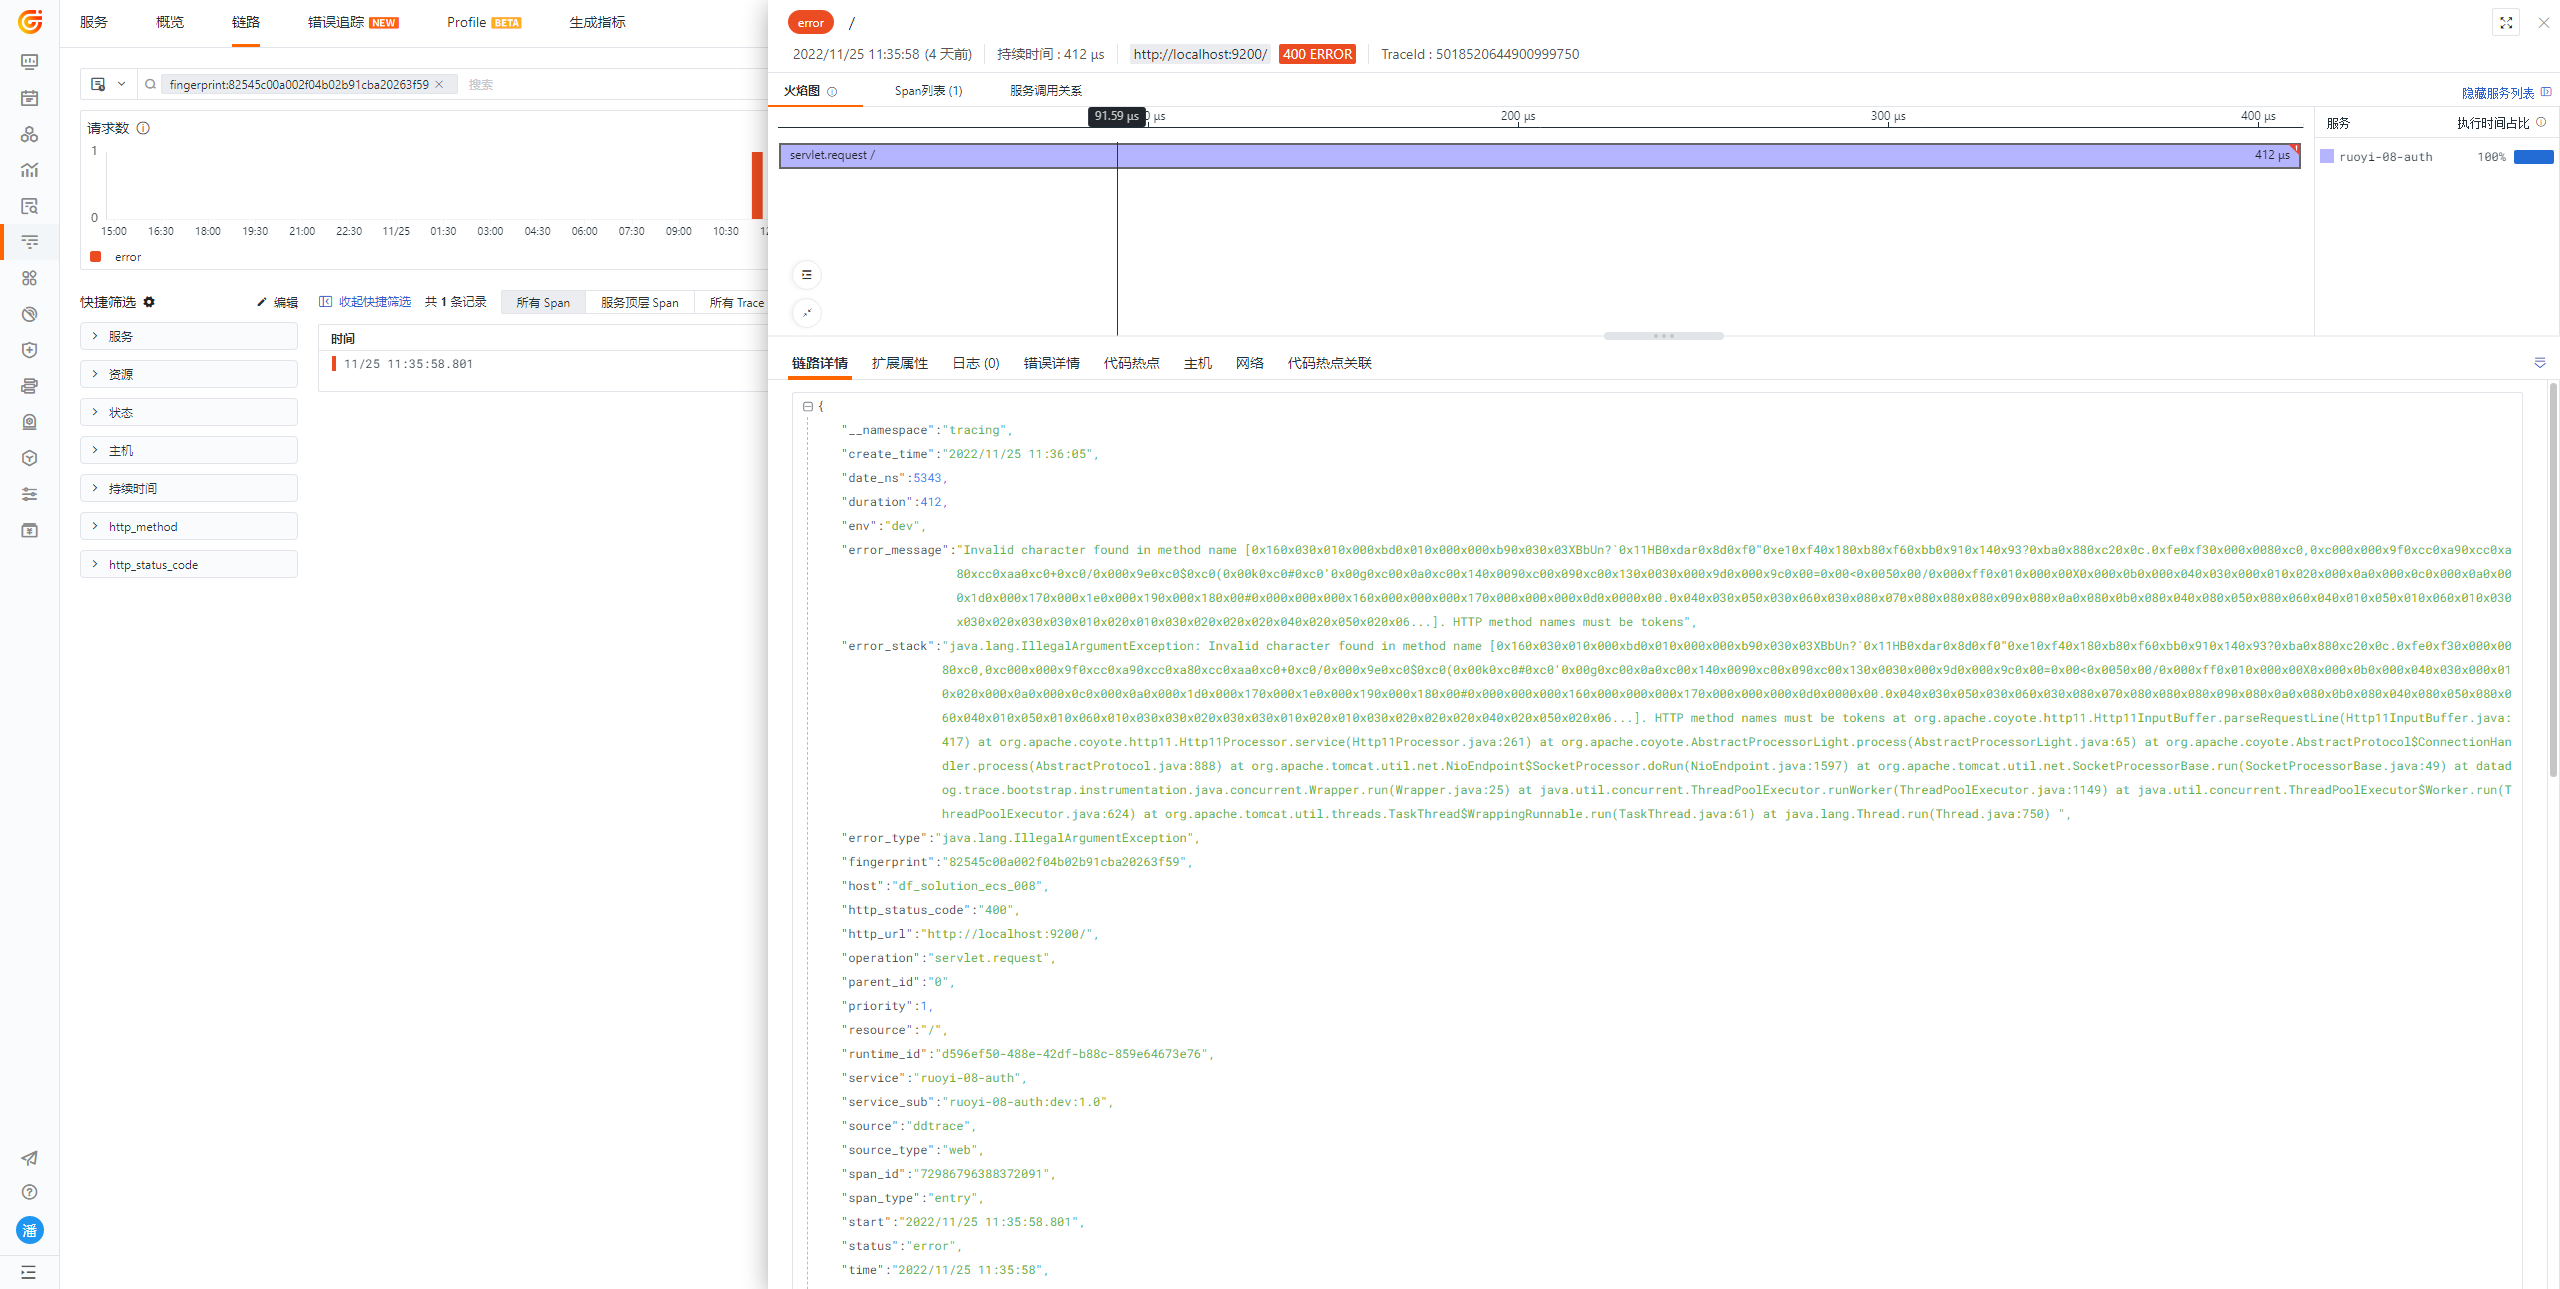
- Error Details: Displays detailed information about new errors and specific error counts for the abnormal application. You can click on specific error messages, error types, and error stacks to navigate to the error detail page.
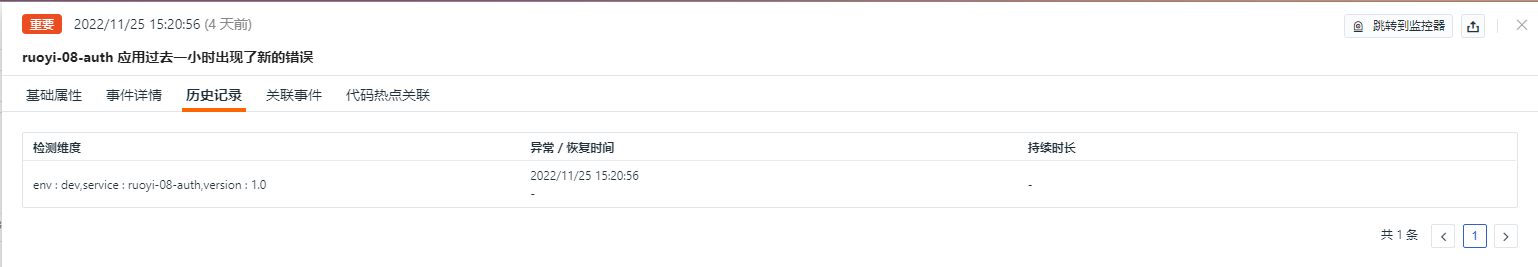
History Records
Supports viewing the detection object, anomaly/recovery times, and duration.
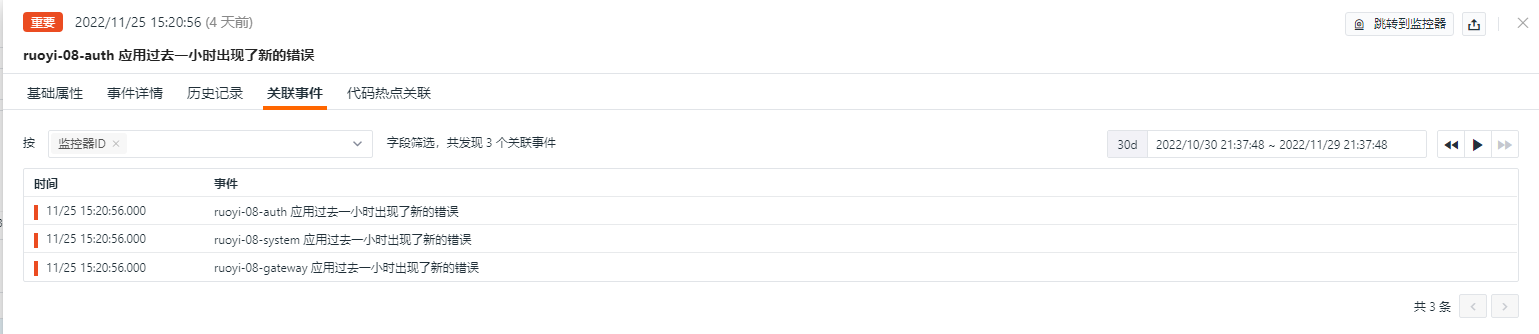
Related Events
Supports viewing related events through selected filtering fields and time component information.
Common Issues
1. How to configure the detection frequency of server application error inspections
- In the self-hosted DataFlux Func, add
fixed_crontab='0 * * * *', timeout=1800to the decorator when writing custom inspection processing functions, then configure it in "Management / Automatic Trigger Configuration."
2. Why might there be no anomaly analysis when the server application error inspection triggers
If there is no anomaly analysis in the inspection report, please check the data collection status of the current datakit.
3. Under what circumstances does a server application error inspection event get triggered
Server application error inspections scan for new application errors in the last hour. When a new error type occurs, the intelligent inspection generates a corresponding event.
4. What should be done if a previously normal script throws an exception during inspection
Please update the referenced script set in the DataFlux Func Script Market. You can review the update records of the script market through the Change Log to facilitate immediate updates of the script.
5. Why does the corresponding script set in Startup not change during the upgrade of the inspection script
First delete the corresponding script set, then click the Upgrade button and configure the corresponding Guance API key to complete the upgrade.
6. How to determine if the inspection is effective after enabling
In "Management / Automatic Trigger Configuration," view the status of the corresponding inspection. First, the status should be Enabled, then verify if the inspection script works by clicking Execute. If the message shows successful execution minutes ago, the inspection is running effectively.