InfluxDB 时间线简析
软件简介
InfluxDB 是一个开源分布式时序和指标数据库,使用 Go 语言编写。
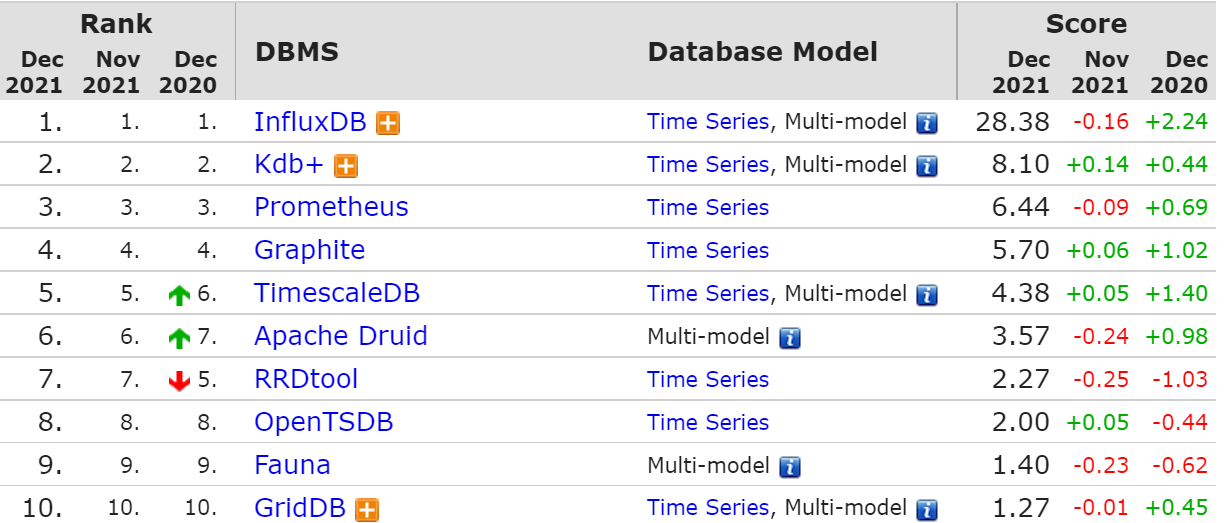
行业地位
InfluxDB 常年霸占榜一位置,最新的时序数据库排行,InfluxDB 甩了第二名 Kdb+ 三个 Prometheus 的距离。
基本概念
-
Database:数据库
-
Measurement:数据表,可以理解为 mysql 里的 table
- Field:InfluxDB 中记录真实数据的键值对 (在 Influxdb 中是必须的,不会被索引)
- Field Set:Field 键值对的集合
- Field Key:组成 Field 键值对里的键
- Field Value:组成 Field 键值对里的值 (真正的数据)
- Tag:用来描述 Field 的键值对 (在 Influxdb 中是可选的,会被索引)
- Tag Set:Tag 键值对的集合
- Tag Key:组成 Tag 键值对里的键
- Tag Value:组成 Tag 键值对里的值
- TimeStamp:数据点关联的日期和时间
高级概念
-
Retention Policy:数据存储时间 (默认是 autogen,永久保存)
-
Series:时间线由 Retention Policy、Measurement、Tag Set 三部分组成
| Series Number | Retention Policy | Measurement | Tag Set |
|---|---|---|---|
| 时间线 1 | autogen | 天气 | 省份=浙江,城市=温州 |
| 时间线 2 | autogen | 天气 | 省份=浙江,城市=绍兴 |
| 时间线 3 | autogen | 天气 | 省份=江苏,城市=常州 |
| 时间线 4 | autogen | 天气 | 省份=江苏,城市=无锡 |
- Point:在一个 Series 中有相同 TimeStamp 的 Field Set,也可以理解为表里的一行数据
| TimeStamp | Measurement | Tag Set | Field Set | |
|---|---|---|---|---|
| 2021-12-12T00:00:00Z | disk | host=a,path=/ | free = 40836976 | used = 20836976 |
- Line Protocol:一种写入数据点到 InfluxDB 的文本格式
实践操作
1. 软件安装
添加 Influxdata 的 yum 源
cat <<EOF | tee /etc/yum.repos.d/influxdb.repo
[influxdb]
name = InfluxDB Repository - RHEL \$releasever
baseurl = https://repos.influxdata.com/rhel/\$releasever/\$basearch/stable
enabled = 1
gpgcheck = 1
gpgkey = https://repos.influxdata.com/influxdb.key
EOF
2. 数据查询
由于本地安装,使用 influx 命令直接进入数据库 (更多参数详见 influx -h)
选择数据表 telegraf ,使用 select 命令查询数据 (查询语言为 InfluxQL)
图中可以看到 3 个 Point,由 4 部分组成 (measurement,timeStamp,tag set,field set)
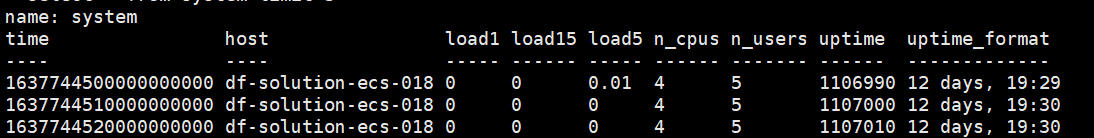
Measurement** **
- name = system
TimeStamp
- time = 1637744500000000000 (纳秒)
Tag Set
- host = df-solution-ecs-018
Field Set
- load = 0,load15 = 0,load5 = 0.01,n_cpus = 4,n_users = 5,uptime = 1106990,uptime_format = 12days,19:29
3. 查看时间线
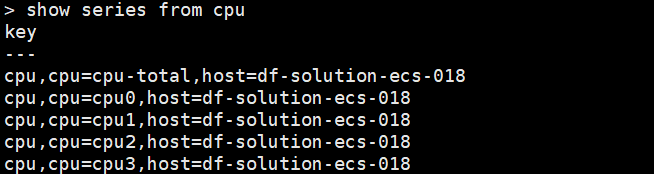
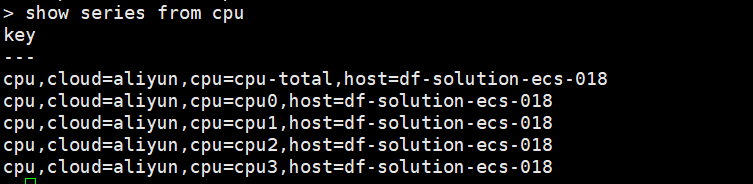
使用 show series 命令查看时间线
可以看到 measurement 为 cpu 的时间线为 5 条 (cpu-total,cpu0,cpu1,cpu2,cpu3,host 都一样)
4. 时间线测试
4.1 添加 inputs.tags (插件标签)
主配置文件 /etc/telegraf/telegraf.conf,添加 inputs.cpu.tags
[[inputs.cpu]]
  percpu = true
  totalcpu = true
  collect_cpu_time = false
  report_active = false
[inputs.cpu.tags]
  cloud = 'aliyun'
4.2 删除 measurement
使用 drop 命令删除 measurement
再次使用 show series 命令查看时间线
可以看到 measurement 为 cpu 的时间线变为 5 条 (cpu-total,cpu0,cpu1,cpu2,cpu3,host/cloud 都一样)
4.3 添加 global_tags (全局标签)
主配置文件 /etc/telegraf/telegraf.conf,添加 global_tags
重启 telegraf
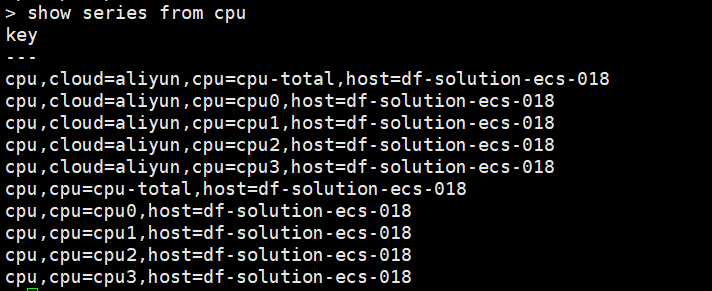
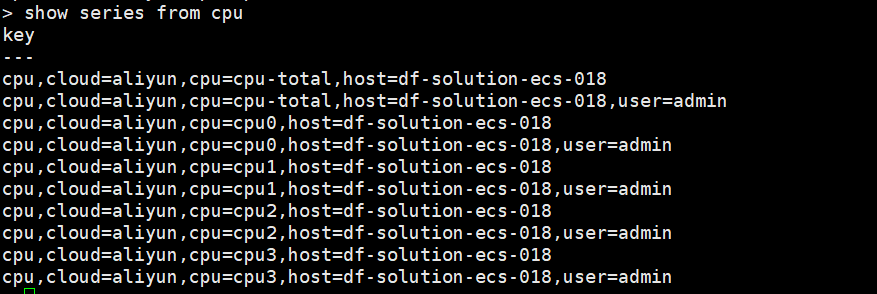
使用 show series 命令查看时间线
可以看到 measurement 为 cpu 的时间线又由 5 => 10 条
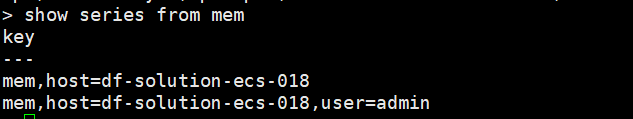
使用 show series 命令查看其他 measurement 的时间线
可以看到 measurement 为 mem 的时间线由 1 => 2 条
简单解析
- retention policy 不变
- 使用插件标签,该 measurement 的时间线会翻倍
- 使用全局标签,该 database 的时间线会翻倍
-
如果 measurement 也不变,tag 排列组合越多,时间线越多
-
measurement
-
一旦被删除,会清理该 measurement 下的所有时间线
-
tag
- 通常是可以被枚举的,例如 hostname,status
- 不能为随机数,否则会造成大量时间线,例如 container id,source ip