使用 Rancher 部署和管理 DataKit,快速构建 Kubernetes 生态的可观测
简介
企业有一定规模后,服务器、Kubernetes 环境、微服务应用会越来越多,如何高效地对这些资源进行可观测,节省人力、资源成本是企业面临的问题。通过一键部署 Rancher 应用商店内的 Datakit,观测云对 Rancher 管控的 K8s 集群,提供了大量开箱即用的可观测功能。
本文通过一个耳熟能详的 service mesh 微服务架构 Bookinfo 案例,详细解释下如何利用观测云一键提升 K8s、istio、持续集成、金丝雀发布等微服务端到端全链路的可观测性。
观测云是一家致力于云原生领域可观测的头部企业,使用一个平台、部署 DataKit Agent 即可把主机、应用的指标、链路、日志串联起来。用户登录观测云,即可实时主动观测自己的 K8s 运行时与微服务应用健康状态。
案例假设
假设一公司拥有若干台云服务器,两套 Kubernetes 集群,一套生产环境、一套测试环境,测试环境有一台 Master 节点,两台 Node 节点。在云服务器上部署了 Harbor、Gitlab、在 Kubernetes 测试环境部署了 Istio 项目 bookinfo。
现在使用观测云进行主机、Kubernetes 集群、Gitlab CI、金丝雀发布、RUM、APM、Istio 等做可观测。
前置条件
- 安装 Kubernetes 1.18+。
- 安装 Rancher,并有操作 Kubernetes 集群的权限。
- 安装 Gitlab。
- 安装 Helm 3.0+。
- 部署 harbor 仓库或其它镜像仓库。
操作步骤
Warning
本次示例使用版本信息如下:DataKit 1.4.0、Kubernetes 1.22.6、Rancher 2.6.3、Gitlab 14.9.4、Istio 1.13.2。版本不同,配置可能存在差异。
步骤 1 使用 Rancher 安装 DataKit
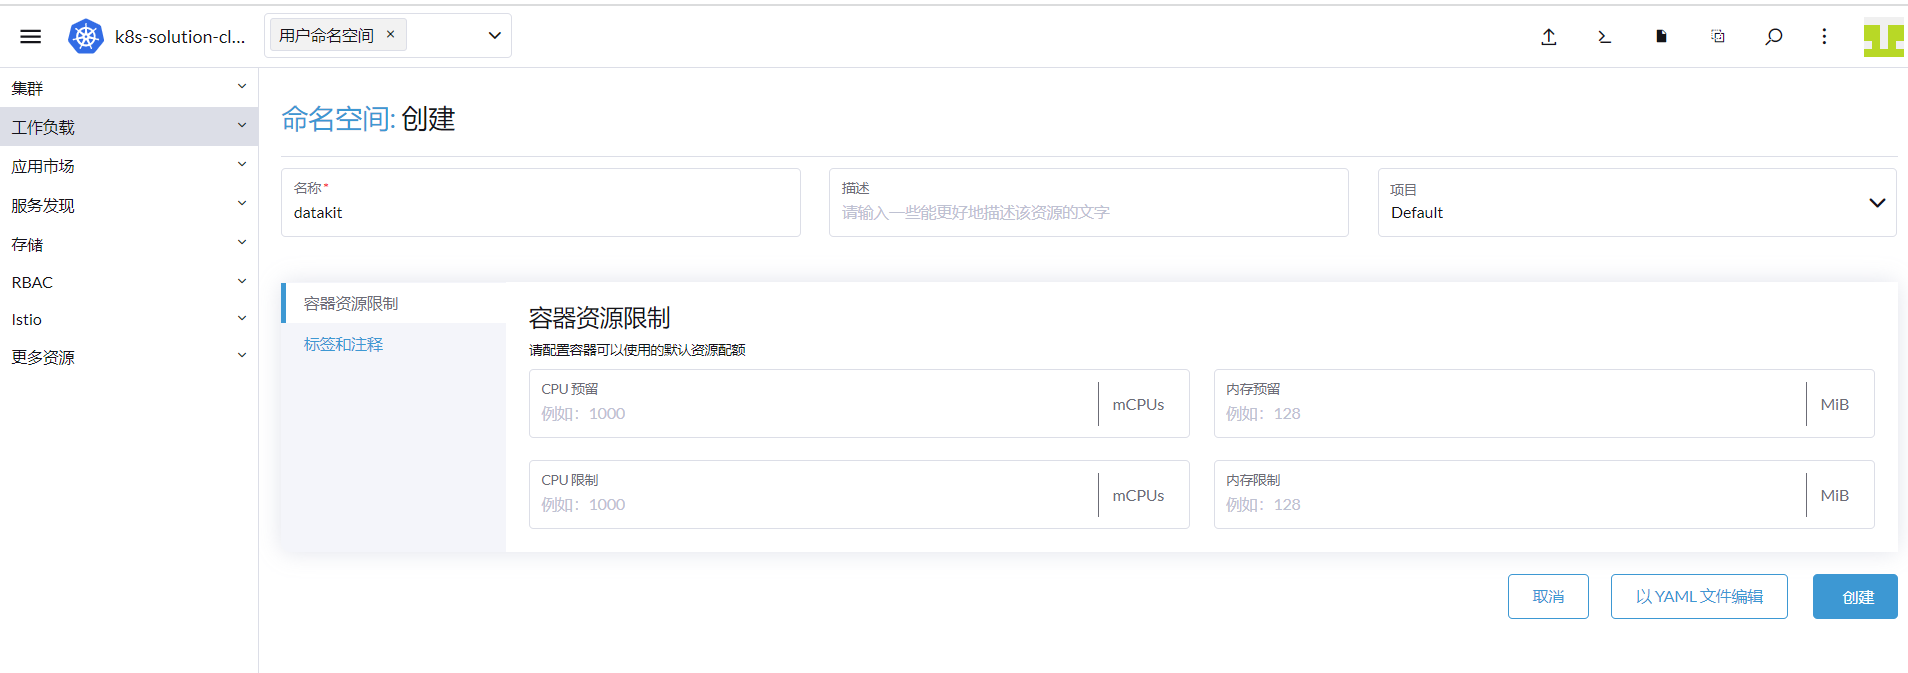
为方便管理,DataKit 安装到 datakit 命名空间。
登录「Rancher」 - 「集群」 - 「项目/命名空间」,点击「创建命名空间」。

名称输入「datakit」,点击「创建」。
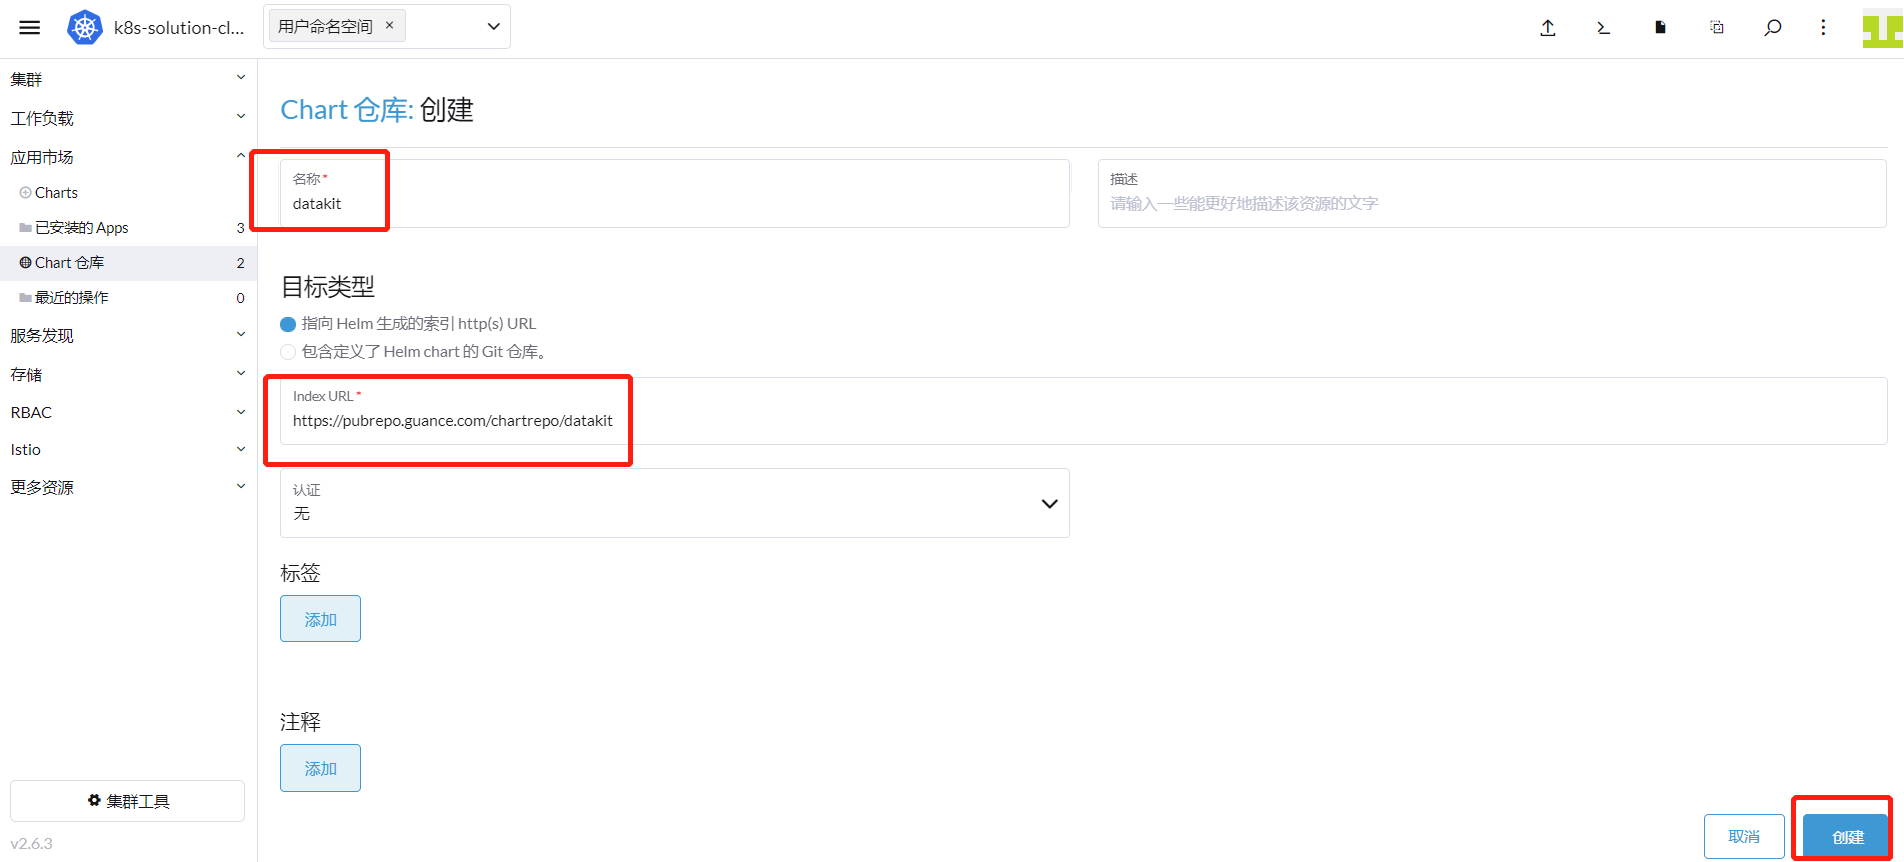
「集群」 - 「应用市场」 - 「Chart 仓库」,点击「创建」。
名称输入 「datakit」,URL 输入 [https://pubrepo.guance.com/chartrepo/datakit](https://pubrepo.guance.com/chartrepo/datakit),点击「创建」。
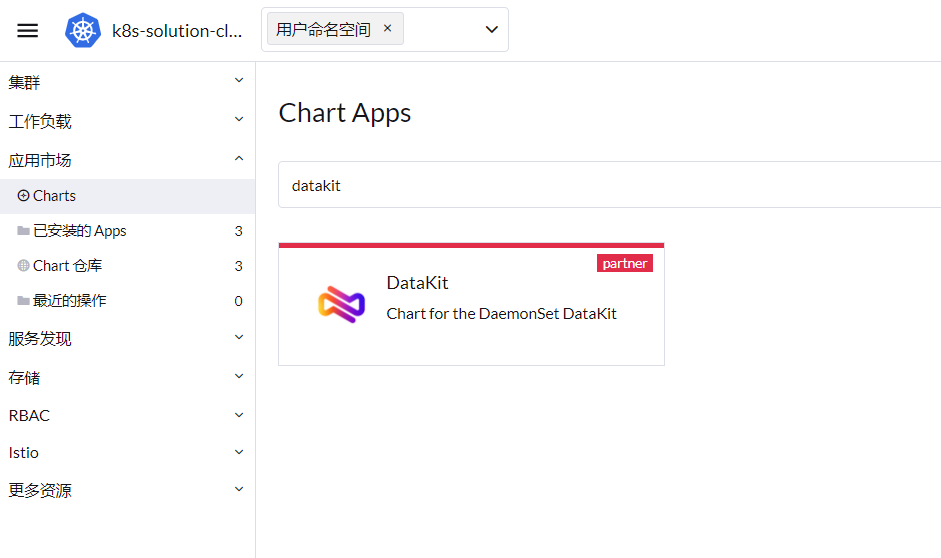
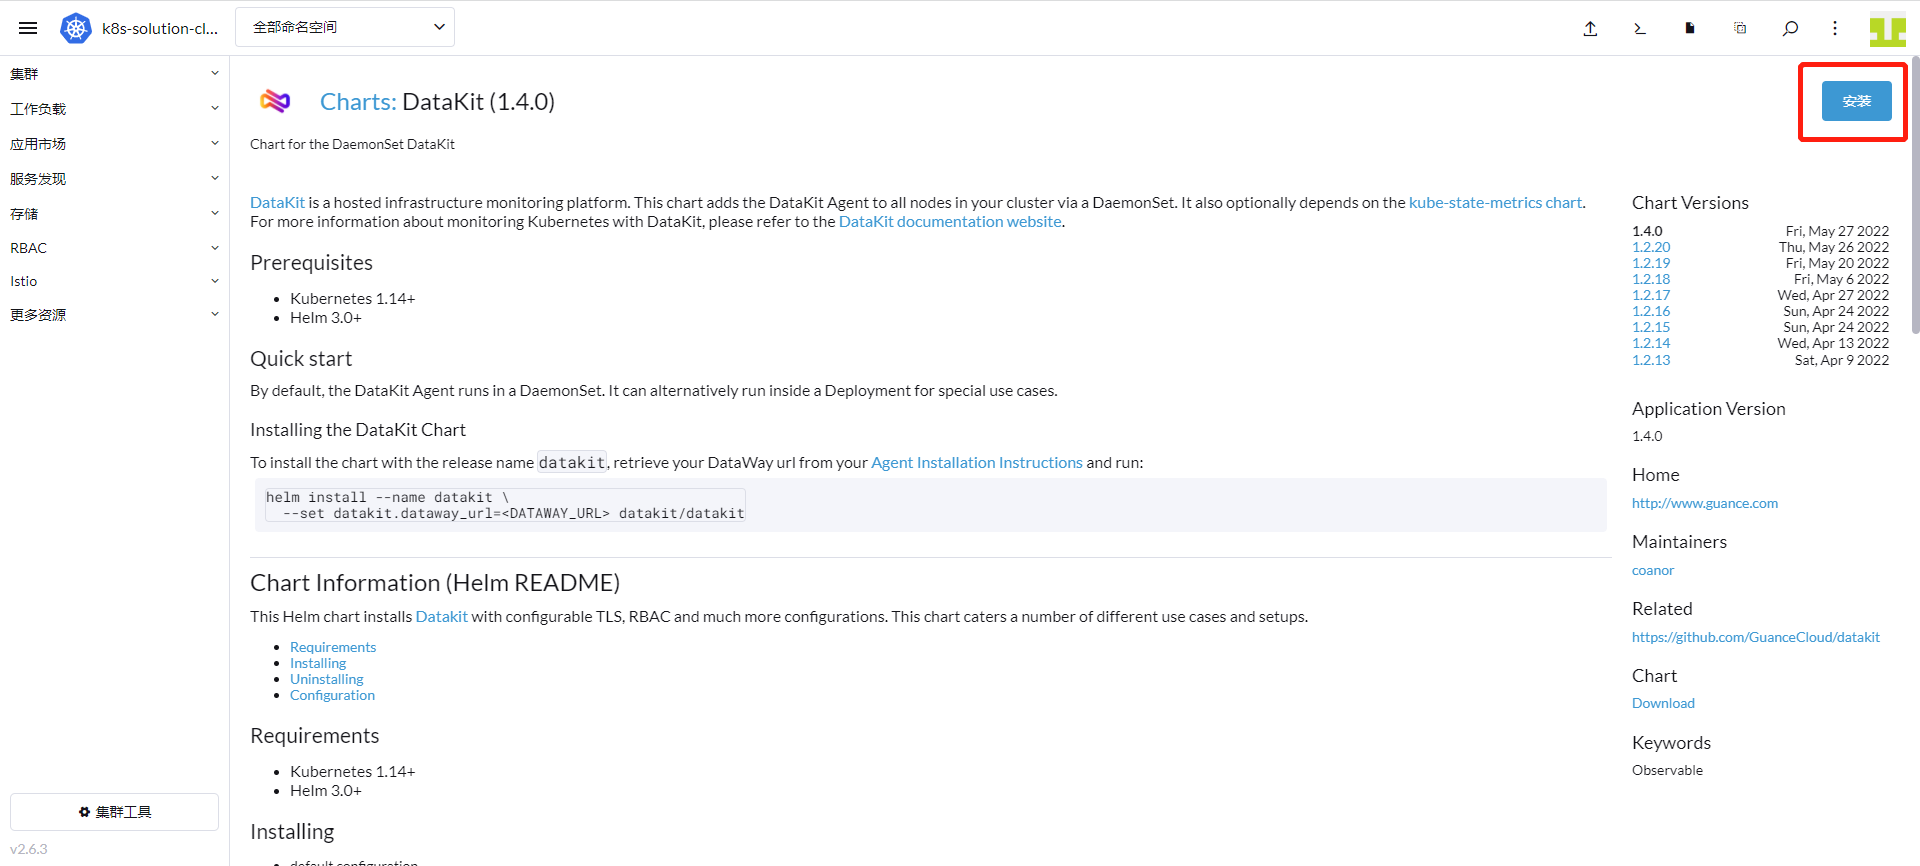
「集群」 - 「应用市场」 - 「Charts」,选择「datakit」,出现下图带 DataKit 的图表,点击进去。
点击「安装」。
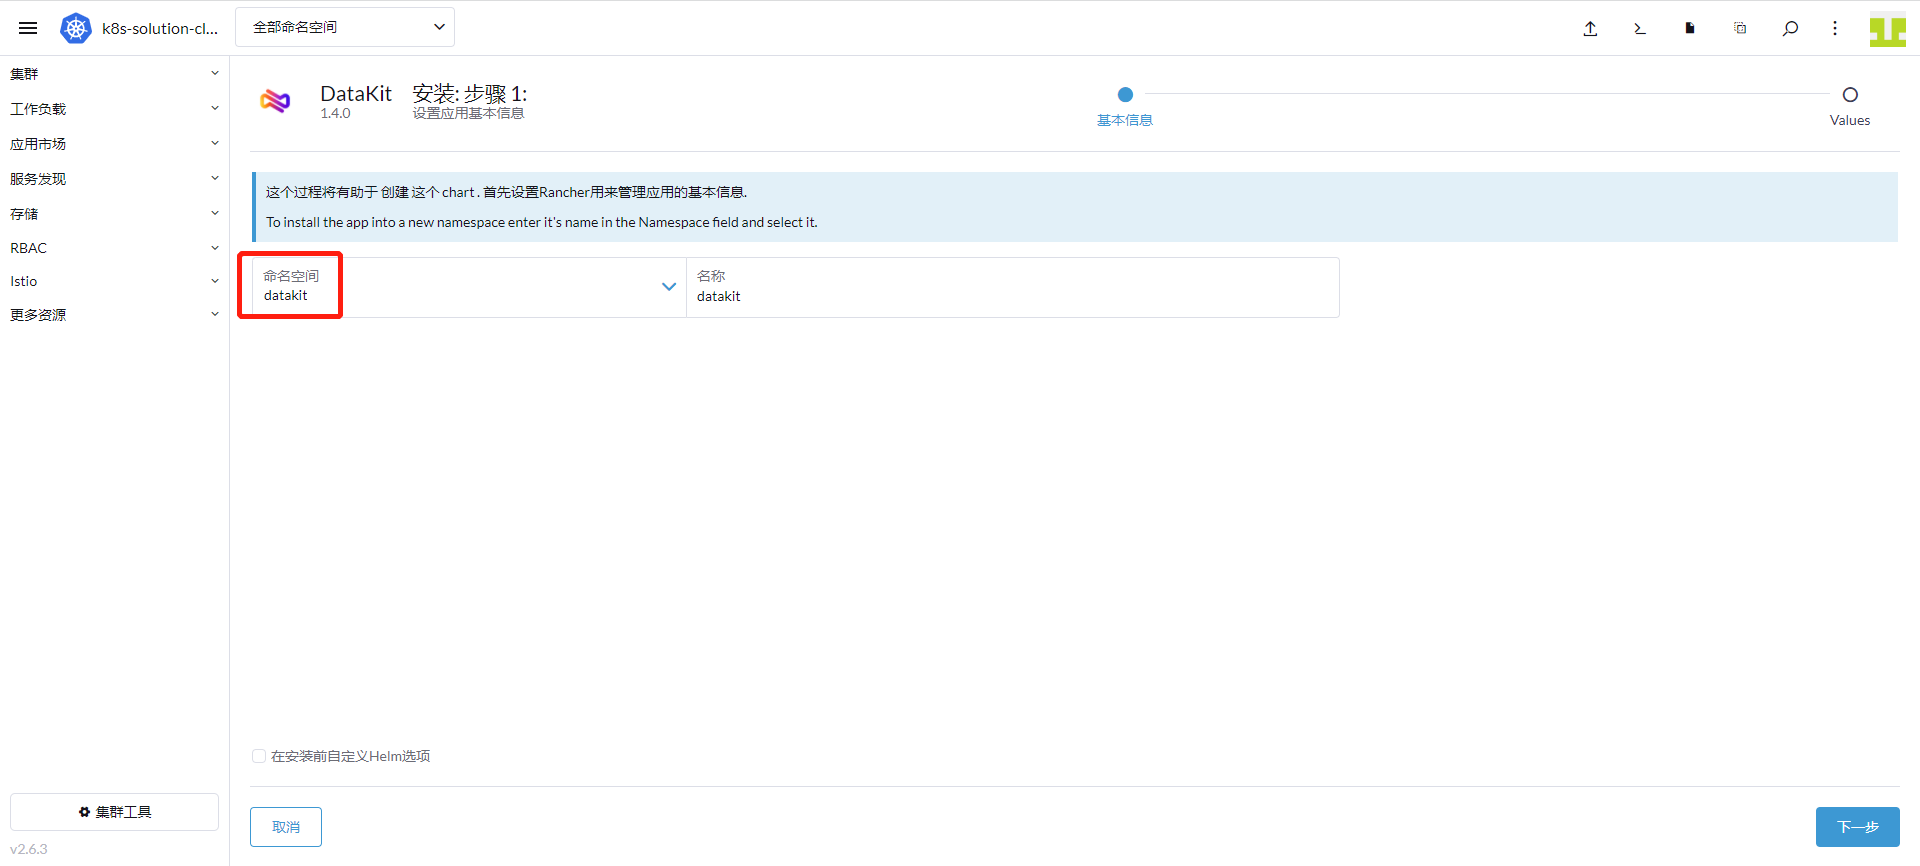
命名空间选择「datakit」,点击「下一步」。
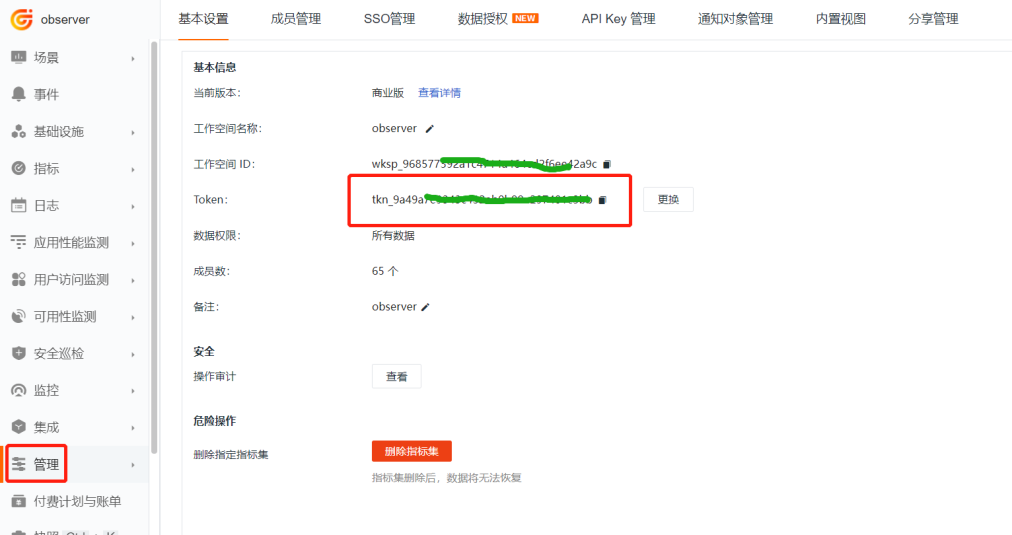
登录「观测云」,进入「管理」模块,找到下图中 token,点击旁边的「复制图标」。
切换到 Rancher 界面:
- 替换下图中的 token 为刚刚复制的 token
- 「Enable The Default Inputs」增加「ebpf 采集器」,即在最后增加 “
,ebpf”(注意是以逗号做分割) - 「DataKit Global Tags」最后增加 “
,cluster_name_k8s=k8s-prod”。(其中 k8s-prod 为您的集群名称,可以自己定义,为集群采集到的指标设置全局 tag。)
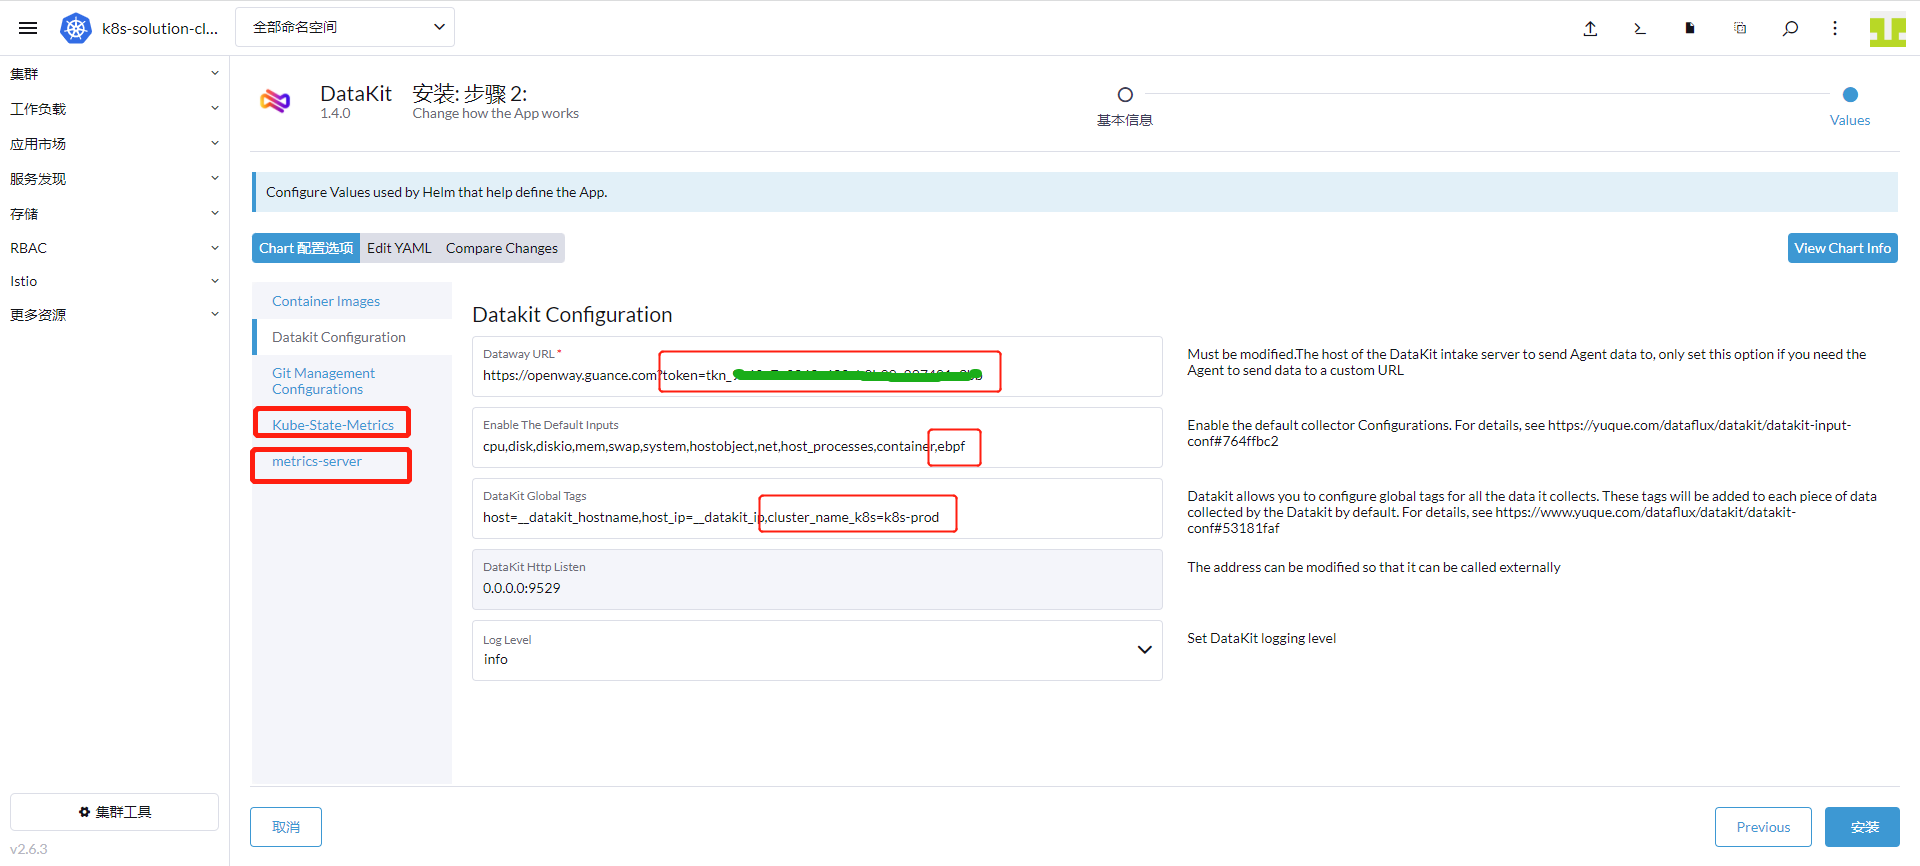
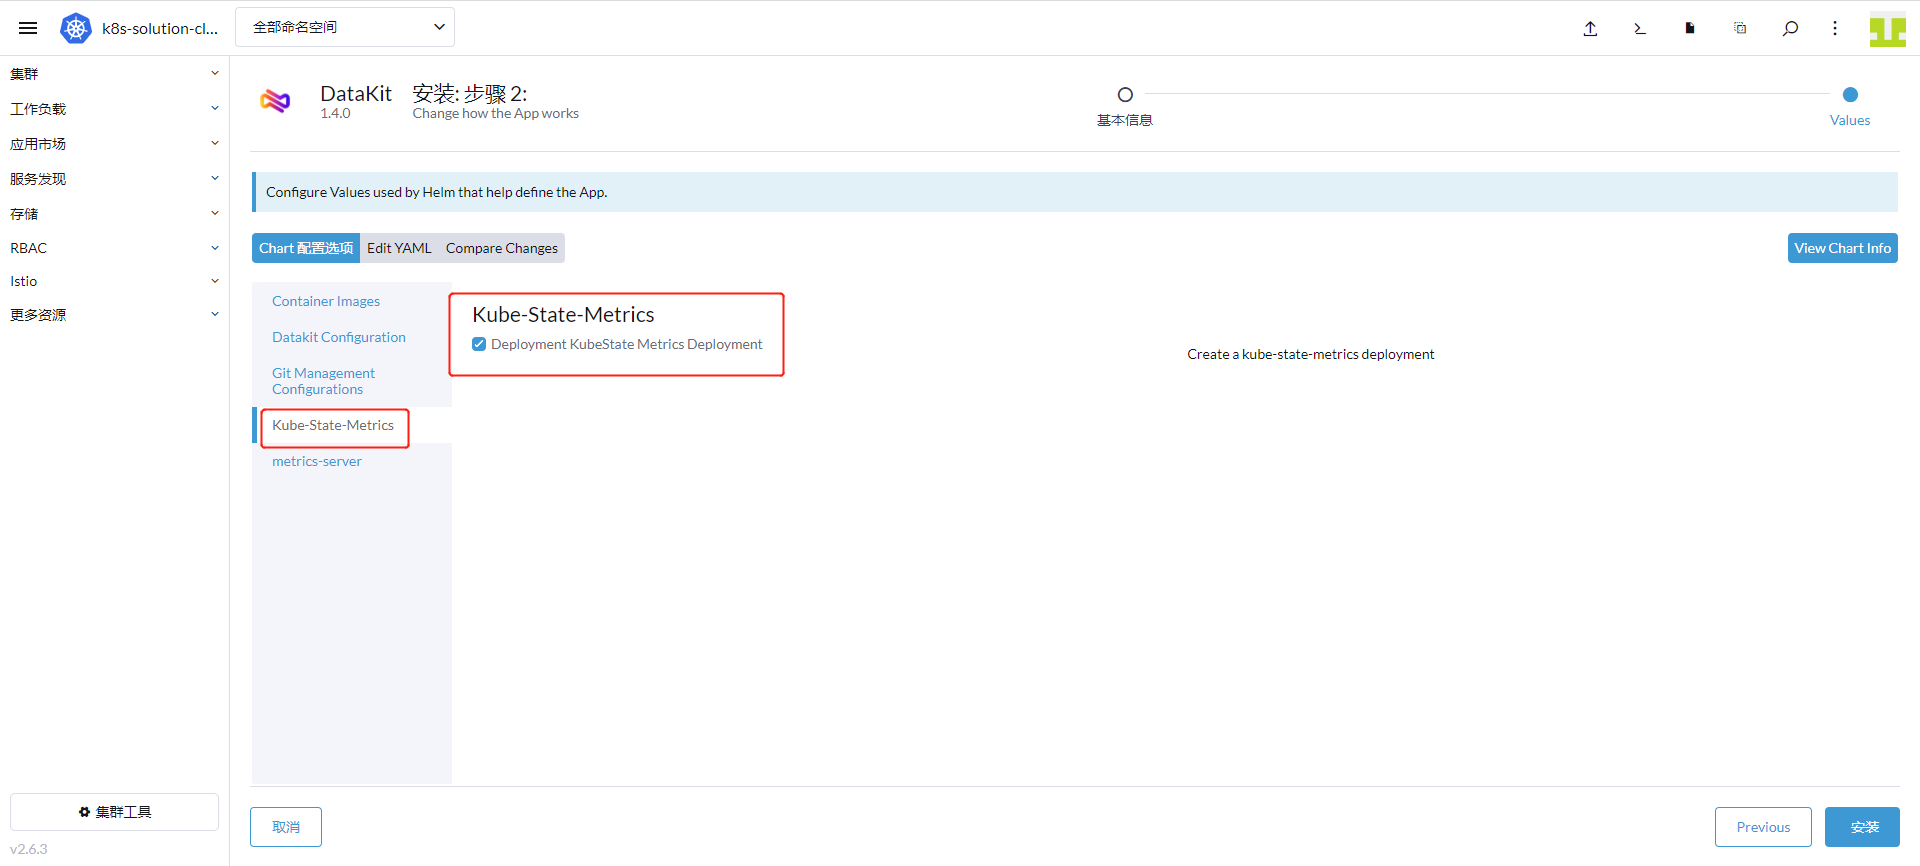
点击「Kube-State-Metrics」,选择「安装」。
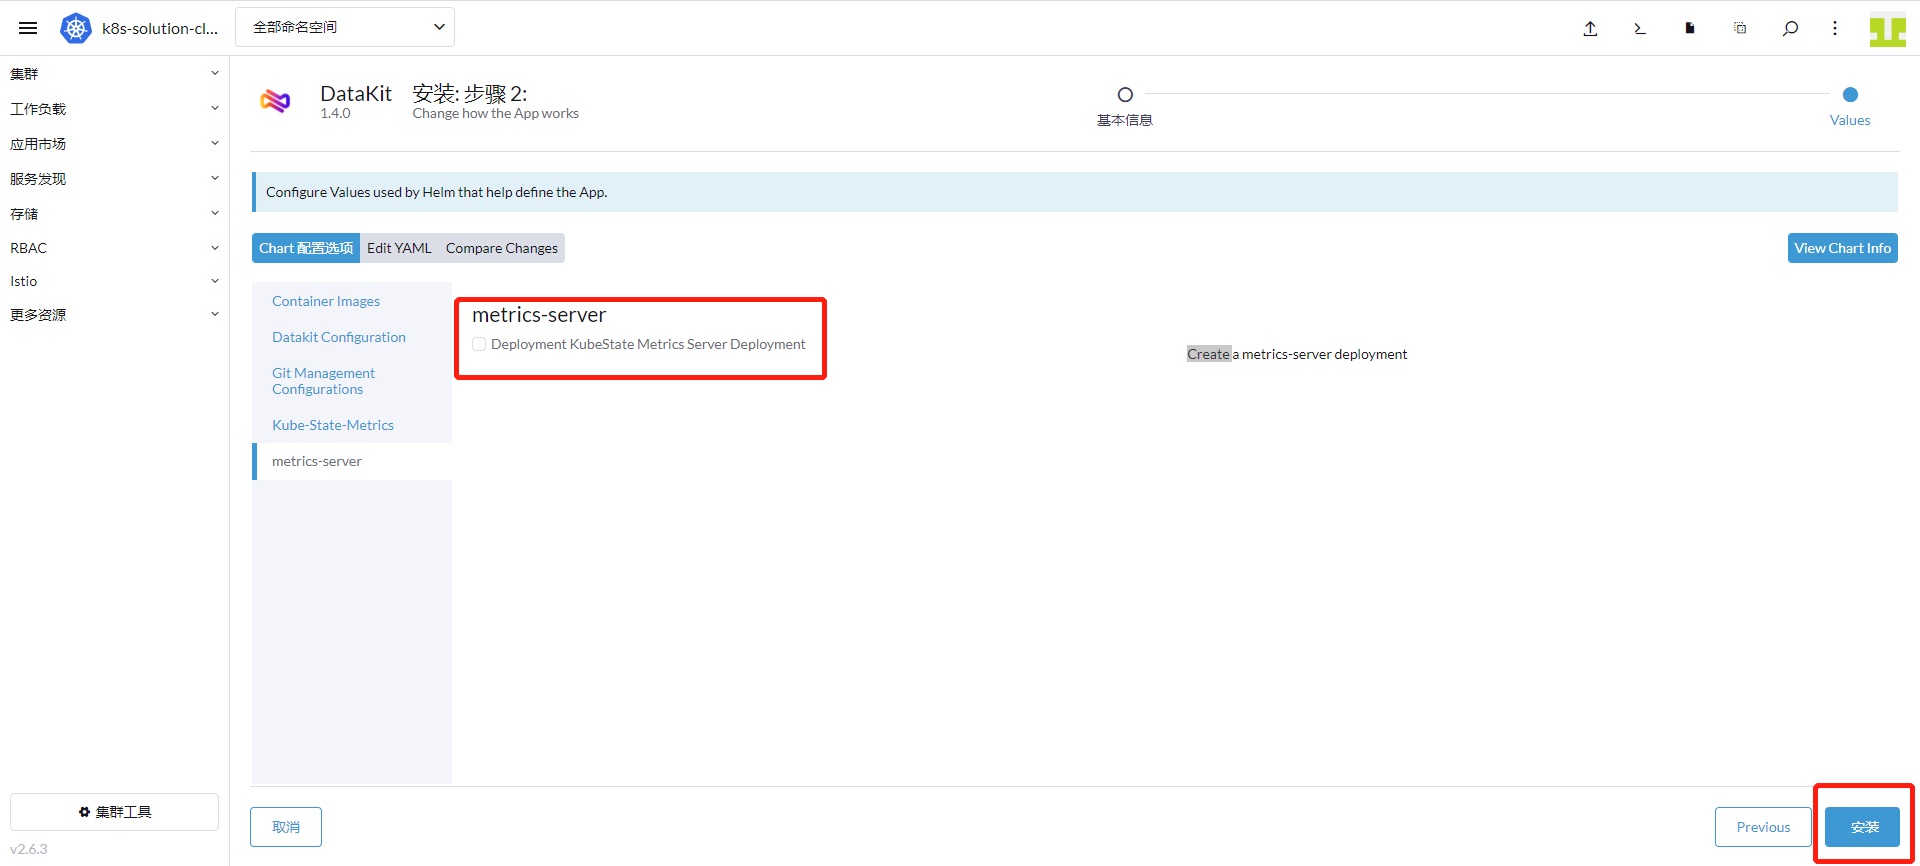
点击「metrics-server」,选择「安装」,点击下发「安装」按钮。
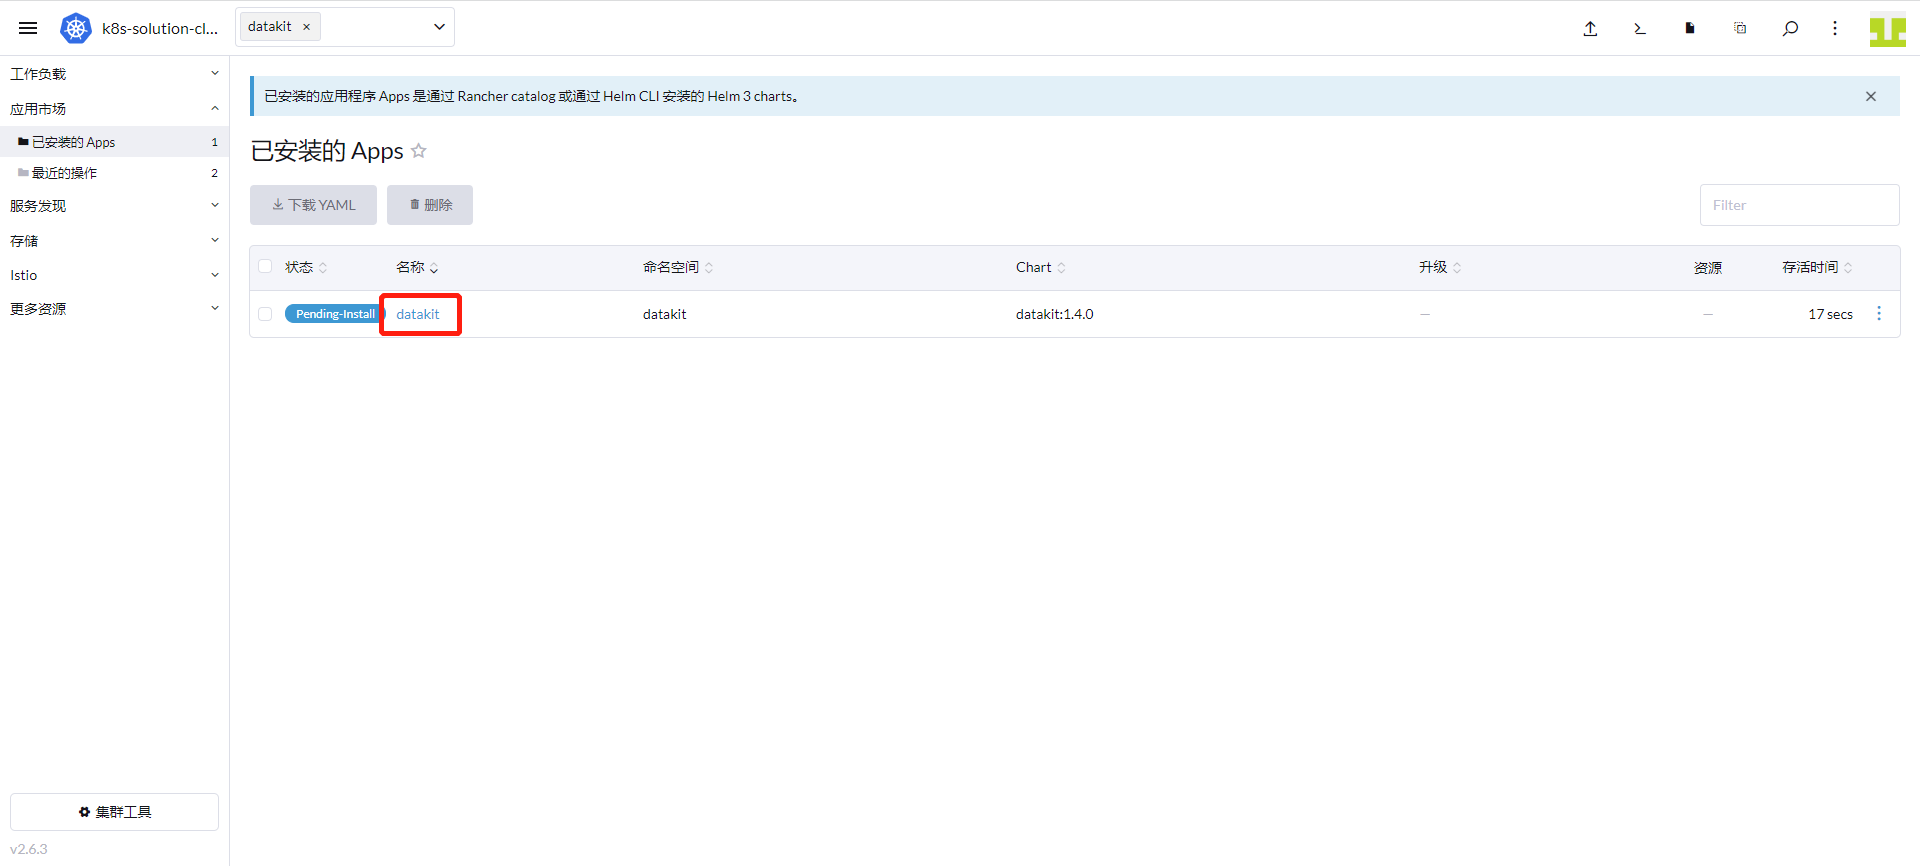
进入「集群」 - 「应用市场」 - 「已安装的 Apps」,查看到 DataKit 已经安装成功。
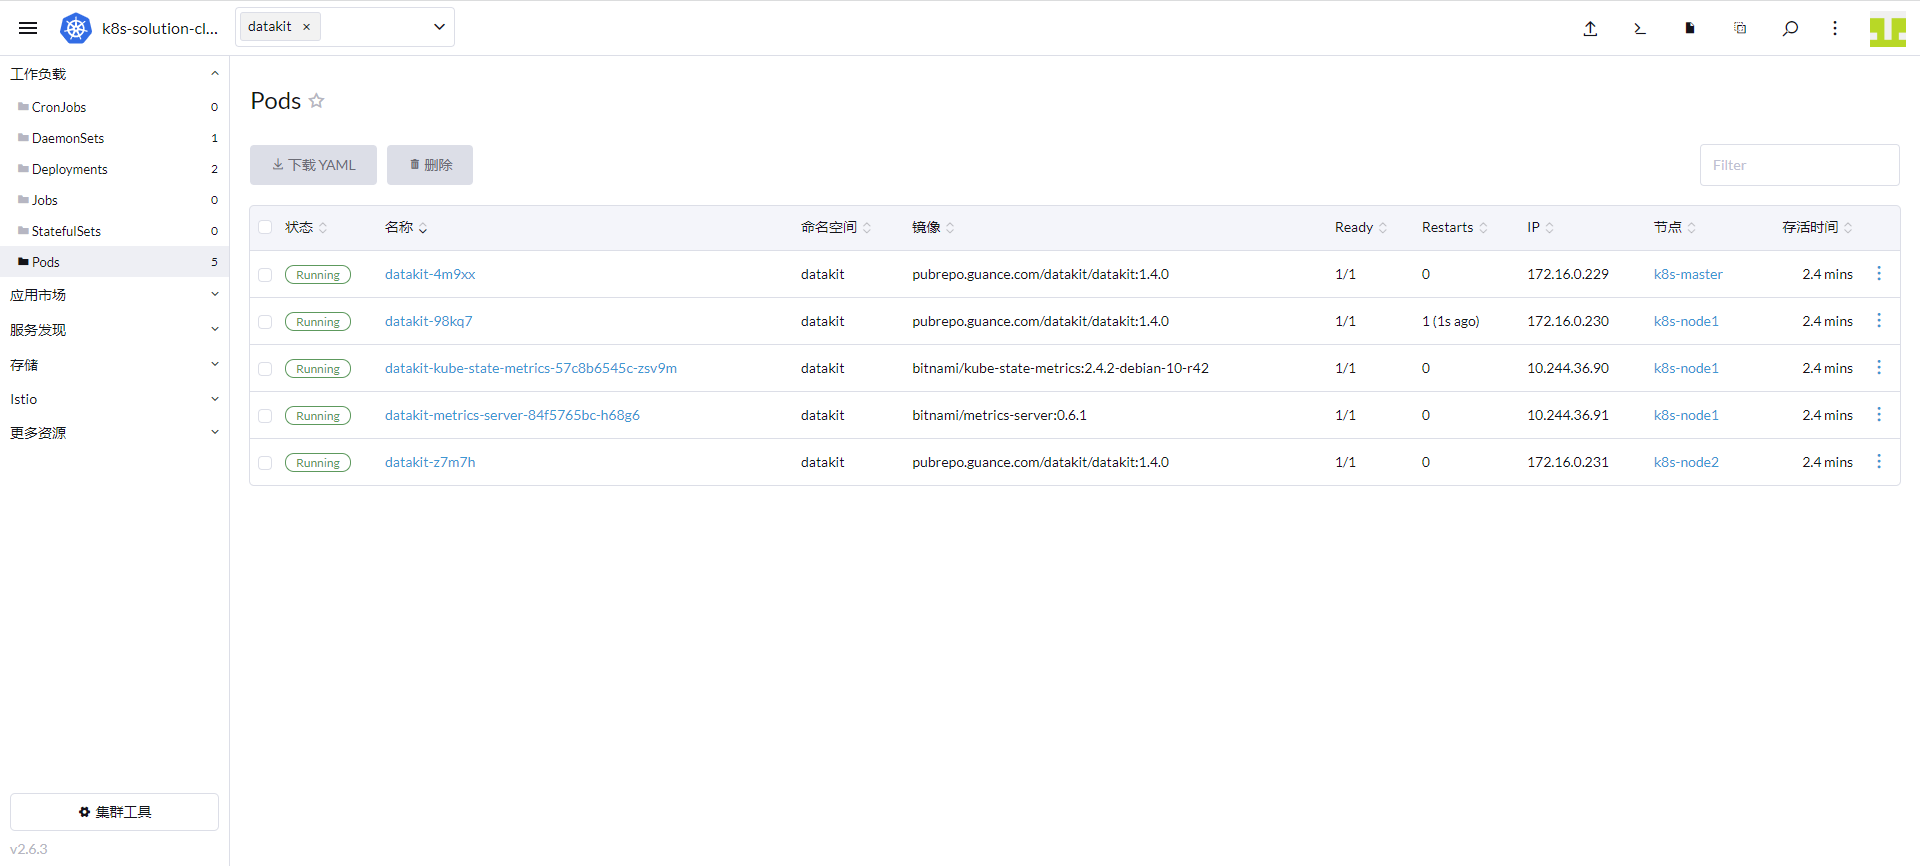
进入「集群」 - 「工作负载」 - 「Pods」,可以查看到 datakit 命名空间已经运行了 3 个 Datakit 、1 个 kube-state-metrics 和 1 个 metrics-server。
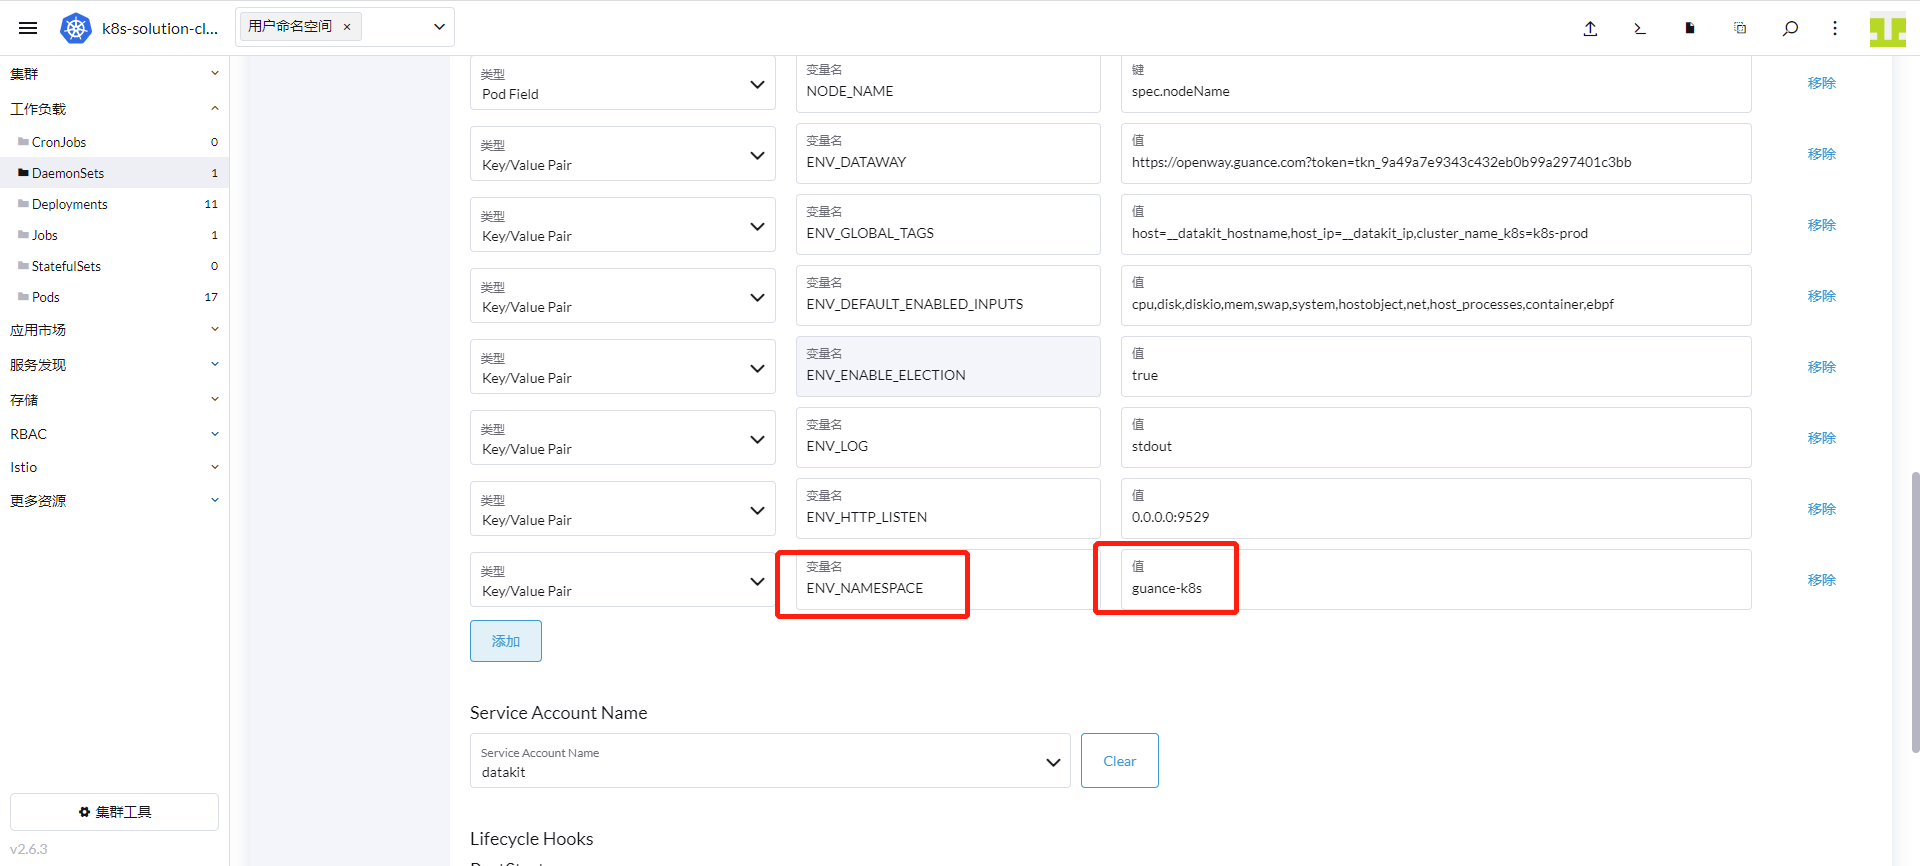
由于公司有多个集群,需要增加 ENV_NAMESPACE 环境变量,这个环境变量是为了区分不同集群的选举,多个集群 value 值不能相同。
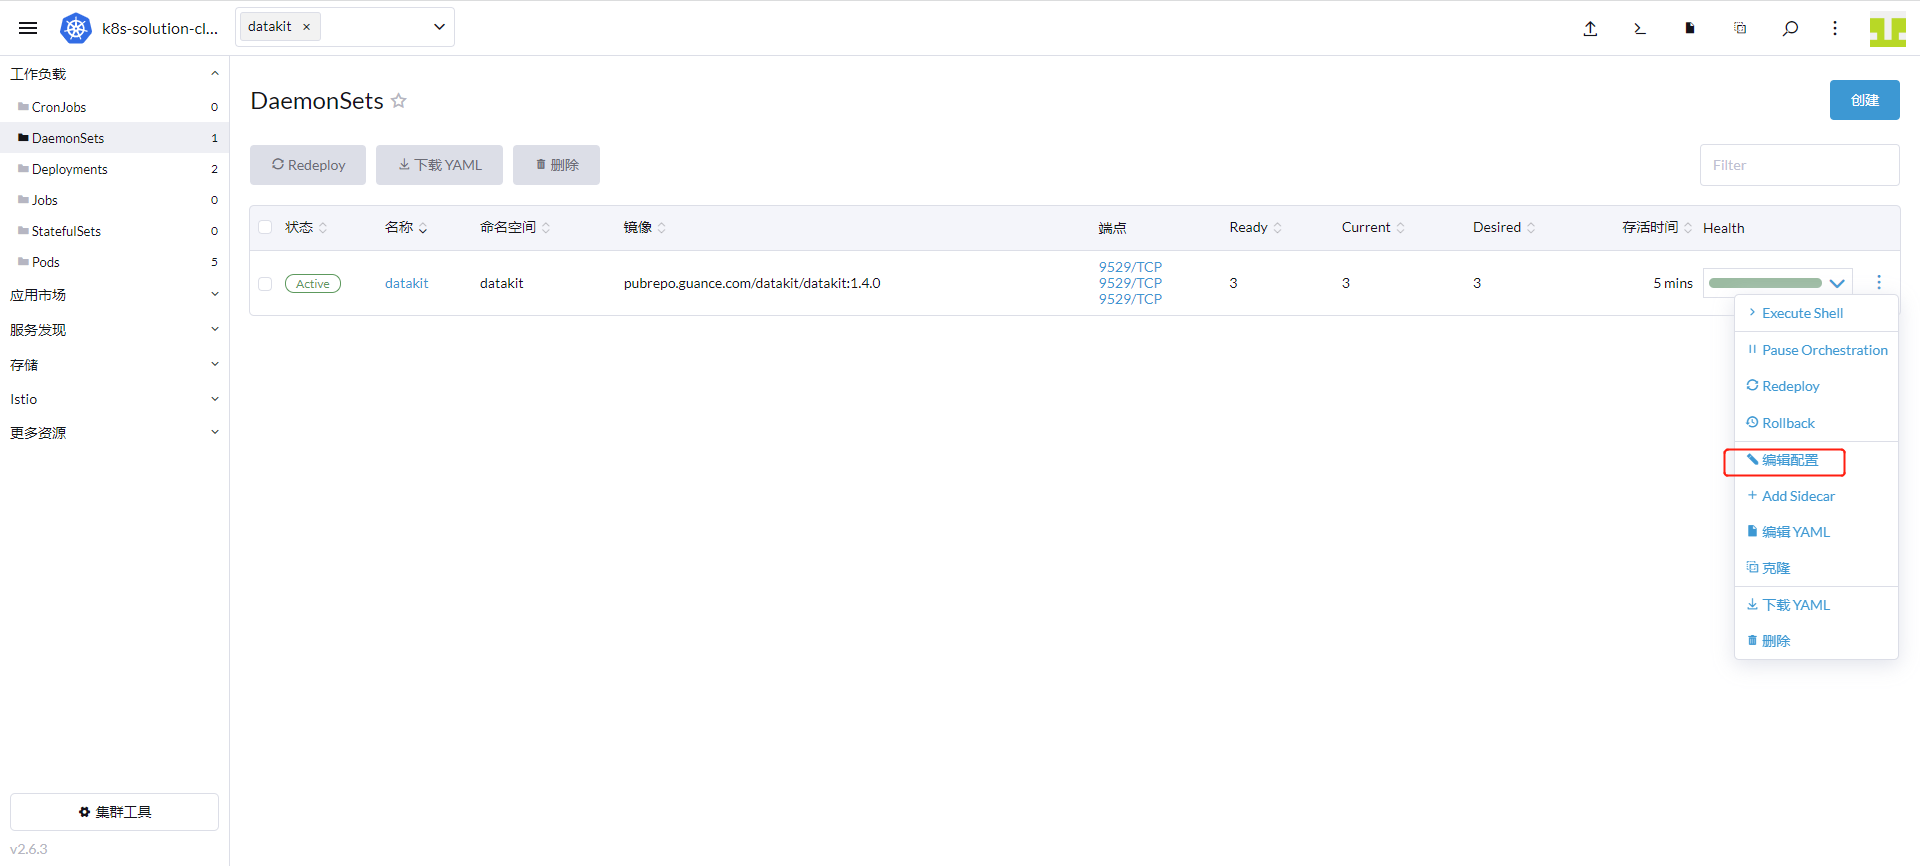
进入「集群」 - 「工作负载」 - 「DaemonSets」,点击 datakit 行的右边,选择「编辑配置」。

这里变量名输入 ENV_NAMESPACE ,值是 guance-k8s ,点击「保存」。
步骤 2 开启 Kubernetes 可观测
2.1 ebpf 可观测
1、 开启采集器
在部署 DataKit 时已经开启了 ebpf 采集器
2、 ebpf 视图
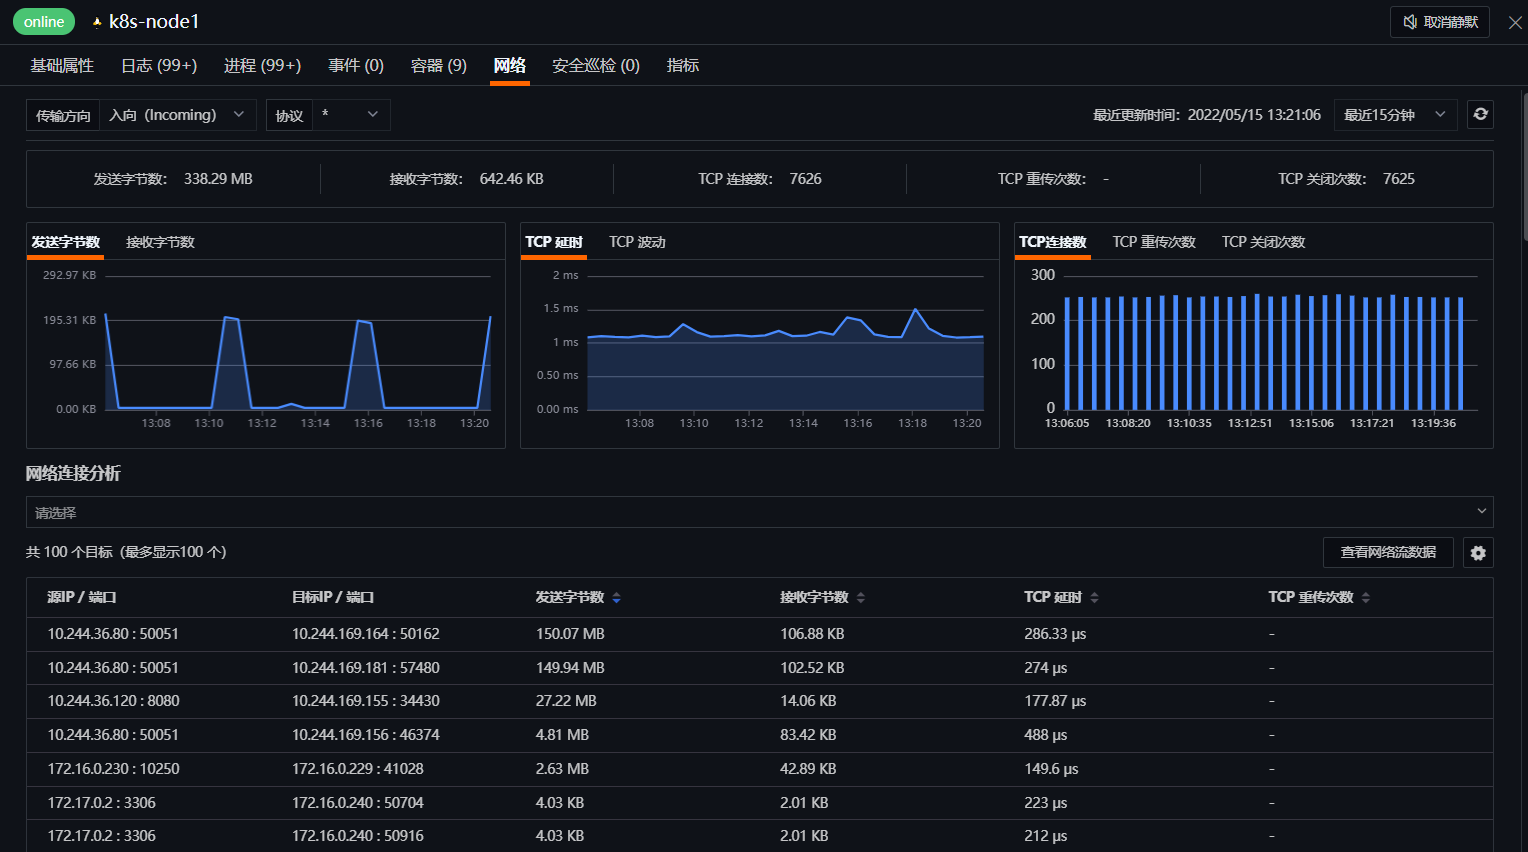
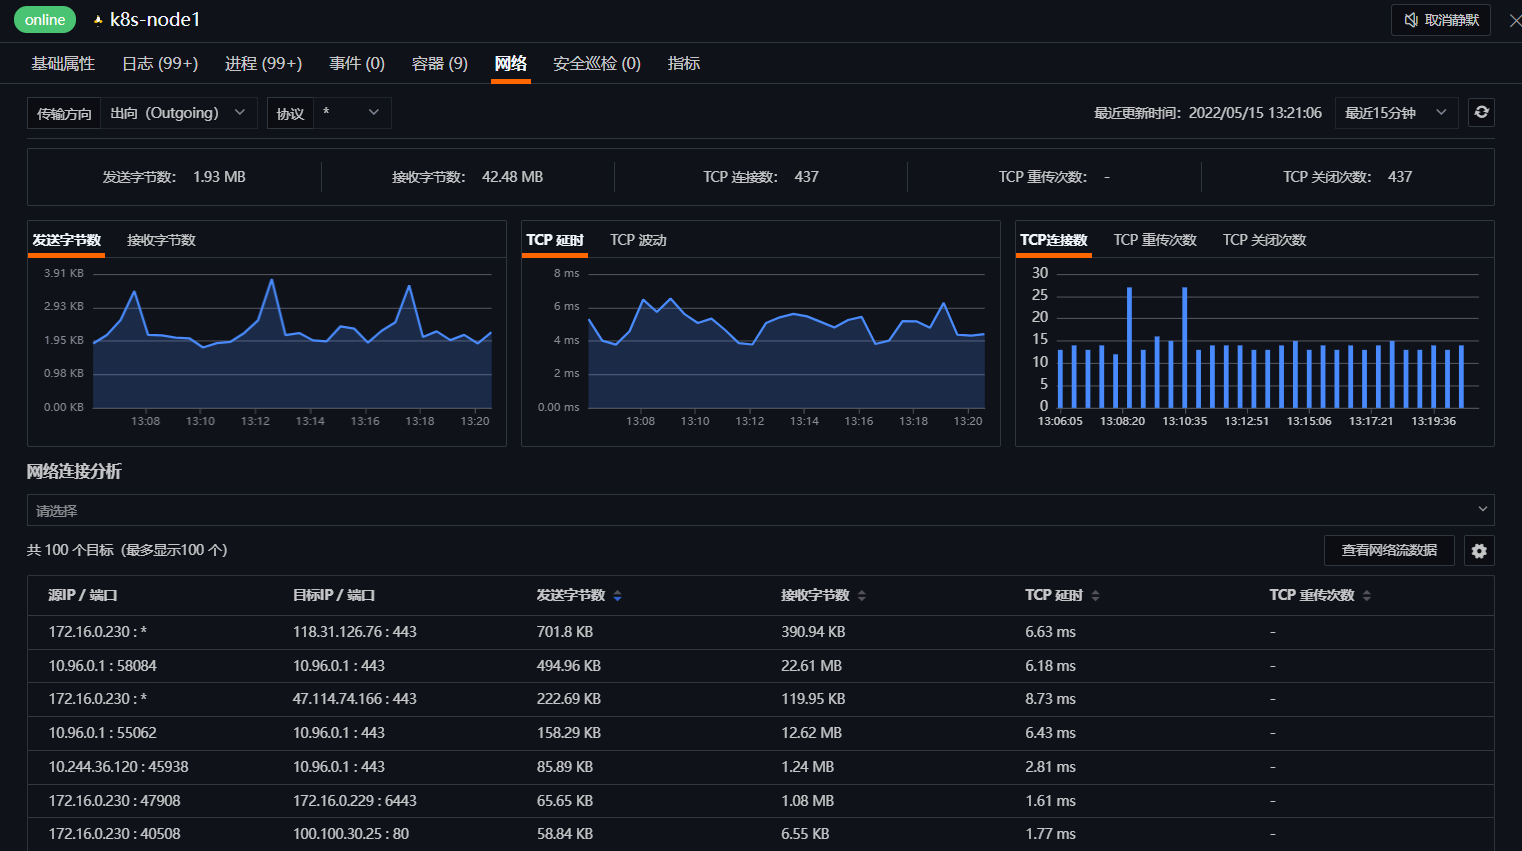
登录「观测云」 - 「基础设施」,点击「k8s-node1」。
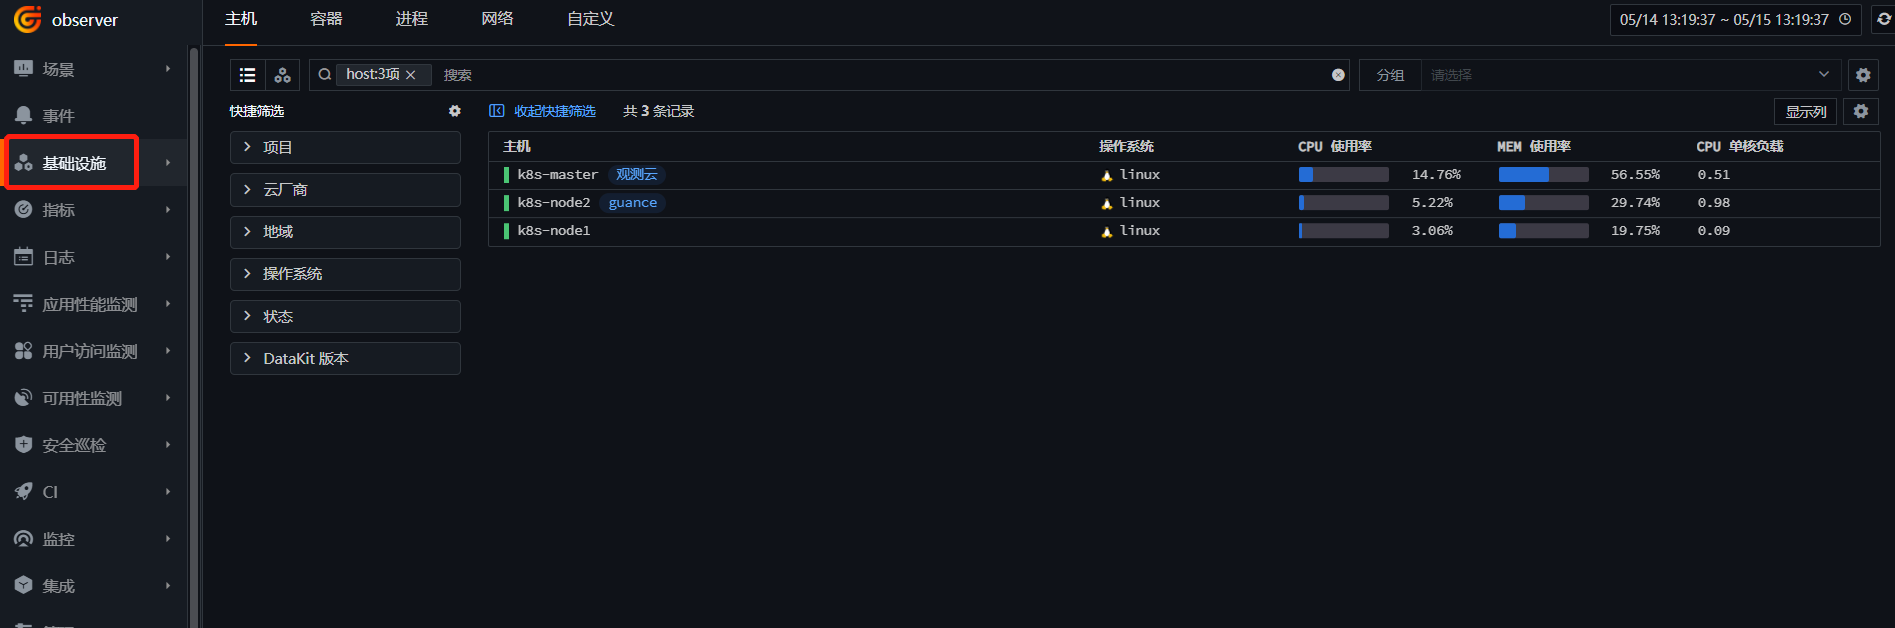
点击 「网络」,查看 ebpf 的监控视图。
2.2 容器可观测
1、 开启采集器
DataKit 默认已开启 Container 采集器,这里介绍一下自定义采集器配置。
登录「Rancher」 - 「集群」 - 「存储」 - 「ConfigMaps」,点击「创建」。
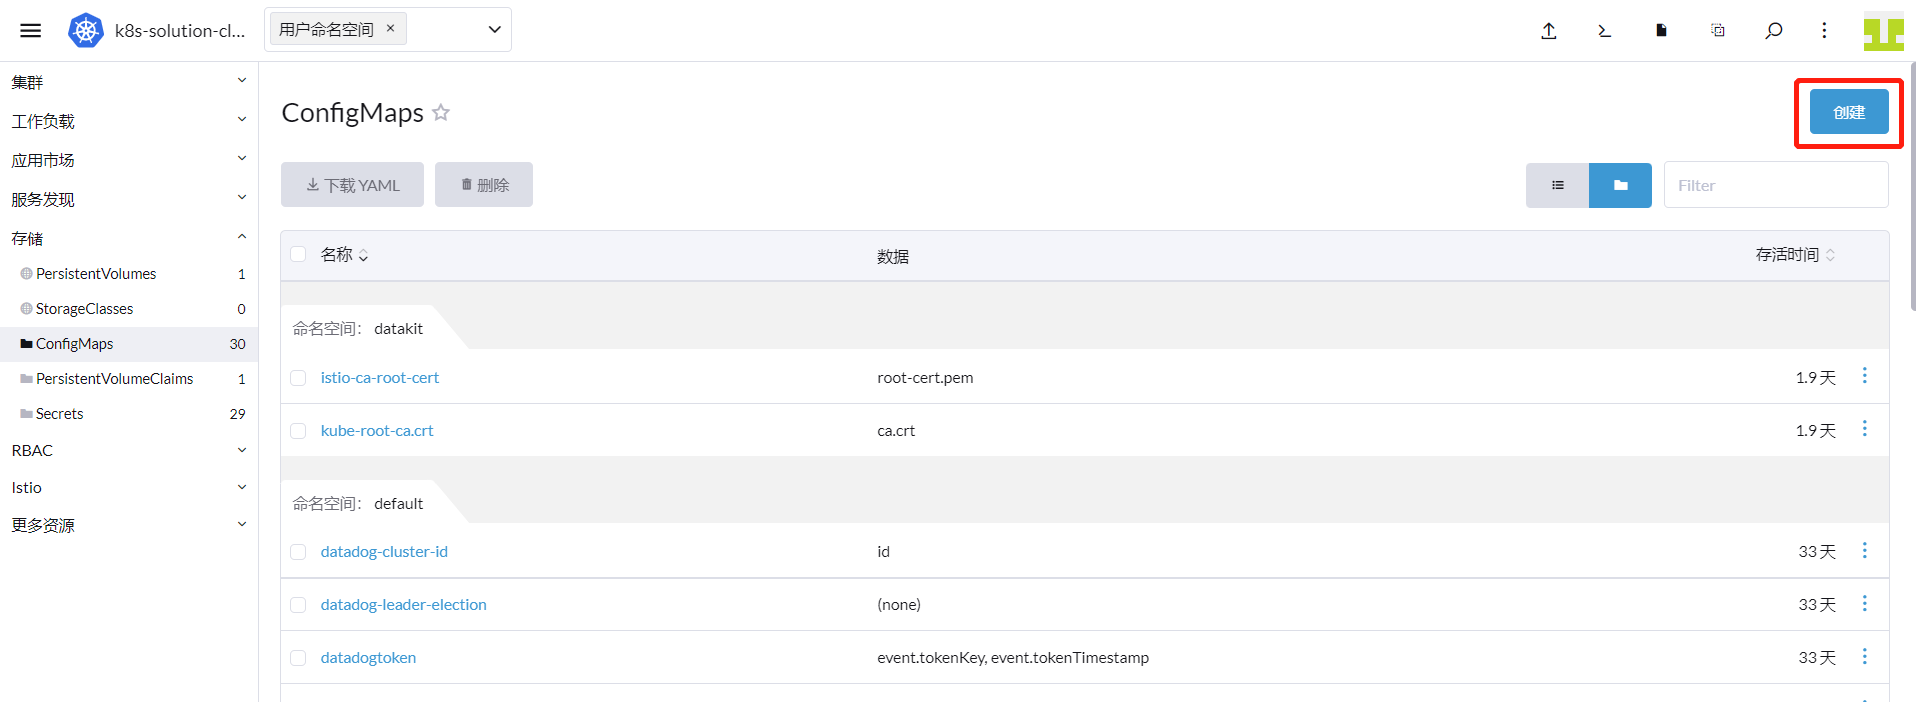
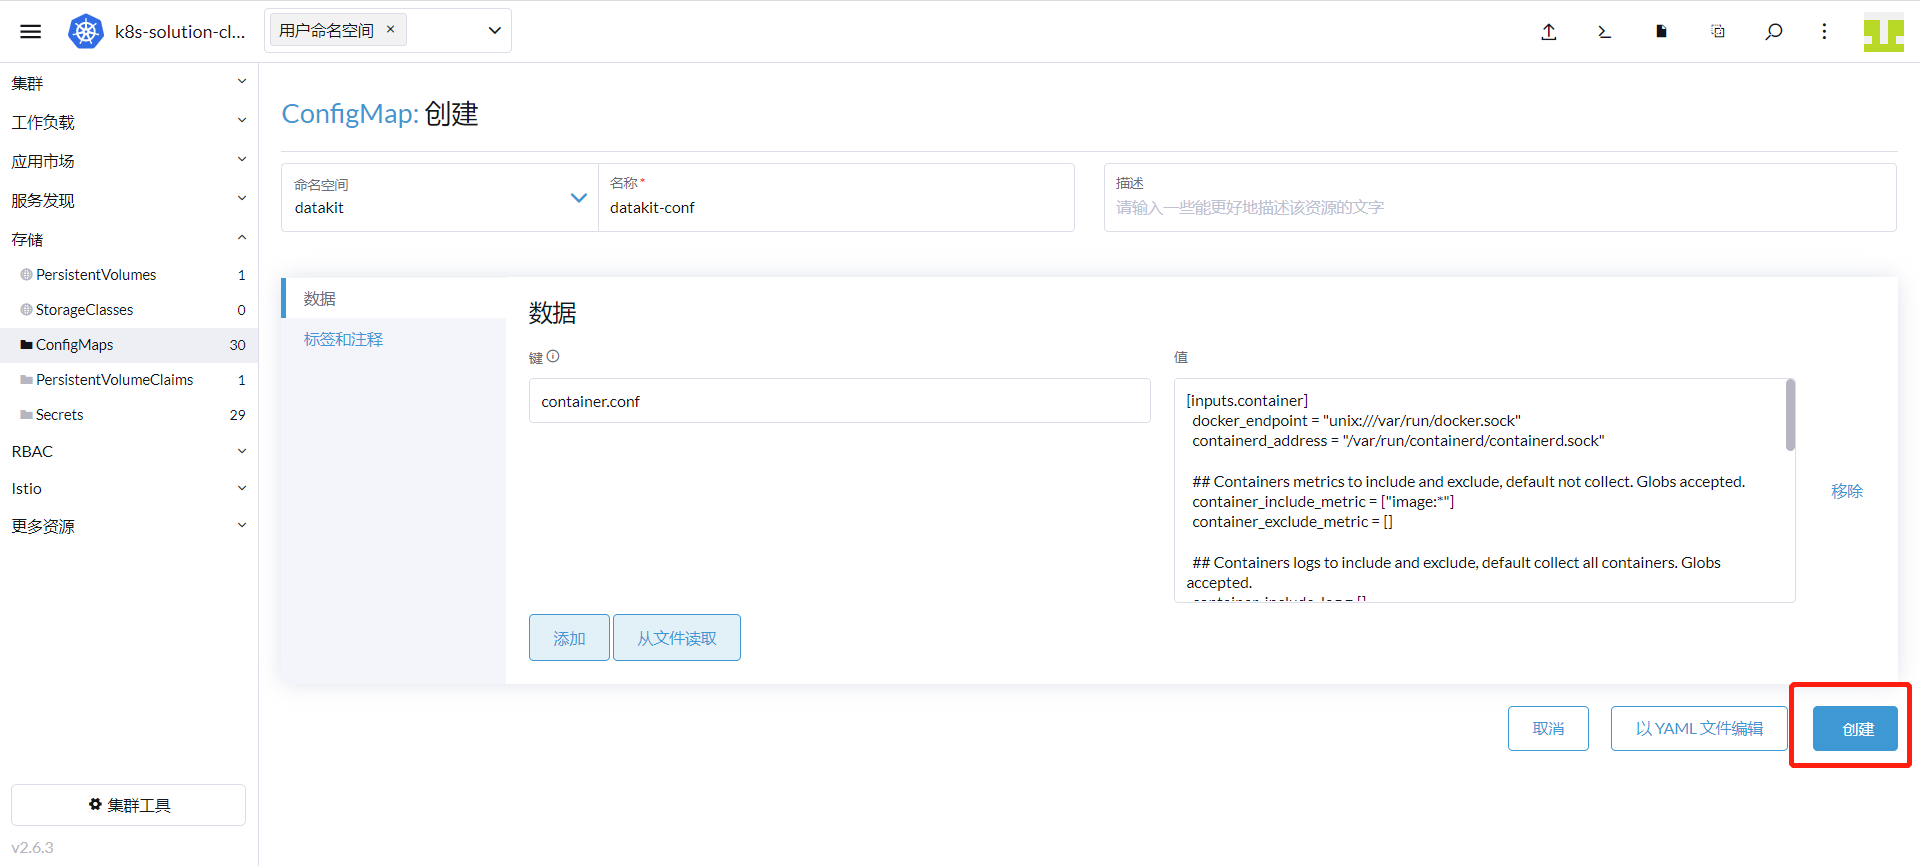
命名空间输入「datakit」,名称输入「datakit-conf」,键输入「container.conf」,值输入如下内容。
注意:生产环境建议设置
container_include_log = []且container_exclude_log = ["image:*"],然后在需要采集 log 的 Pod 上增加 annotations 来采集指定 container 的日志。
      [inputs.container]
        docker_endpoint = "unix:///var/run/docker.sock"
        containerd_address = "/var/run/containerd/containerd.sock"

        enable_container_metric = true
        enable_k8s_metric = true
        enable_pod_metric = true

        ## Containers logs to include and exclude, default collect all containers. Globs accepted.
        container_include_log = []
        container_exclude_log = ["image:pubrepo.guance.com/datakit/logfwd*", "image:pubrepo.guance.com/datakit/datakit*"]

        exclude_pause_container = true

        ## Removes ANSI escape codes from text strings
        logging_remove_ansi_escape_codes = false

        kubernetes_url = "https://kubernetes.default:443"

        ## Authorization level:
        ##   bearer_token  - bearer_token_string  - TLS
        ## Use bearer token for authorization. ('bearer_token' takes priority)
        ## linux at:   /run/secrets/kubernetes.io/serviceaccount/token
        ## windows at: C:\var\run\secrets\kubernetes.io\serviceaccount\token
        bearer_token = "/run/secrets/kubernetes.io/serviceaccount/token"
        # bearer_token_string = "<your-token-string>"

        [inputs.container.tags]
          # some_tag = "some_value"
          # more_tag = "some_other_value"
填写内容如下图,点击「创建」。
「集群」 - 「工作负载」 - 「DaemonSets」,找到 datakit,点击「编辑配置」。
点击「存储」。
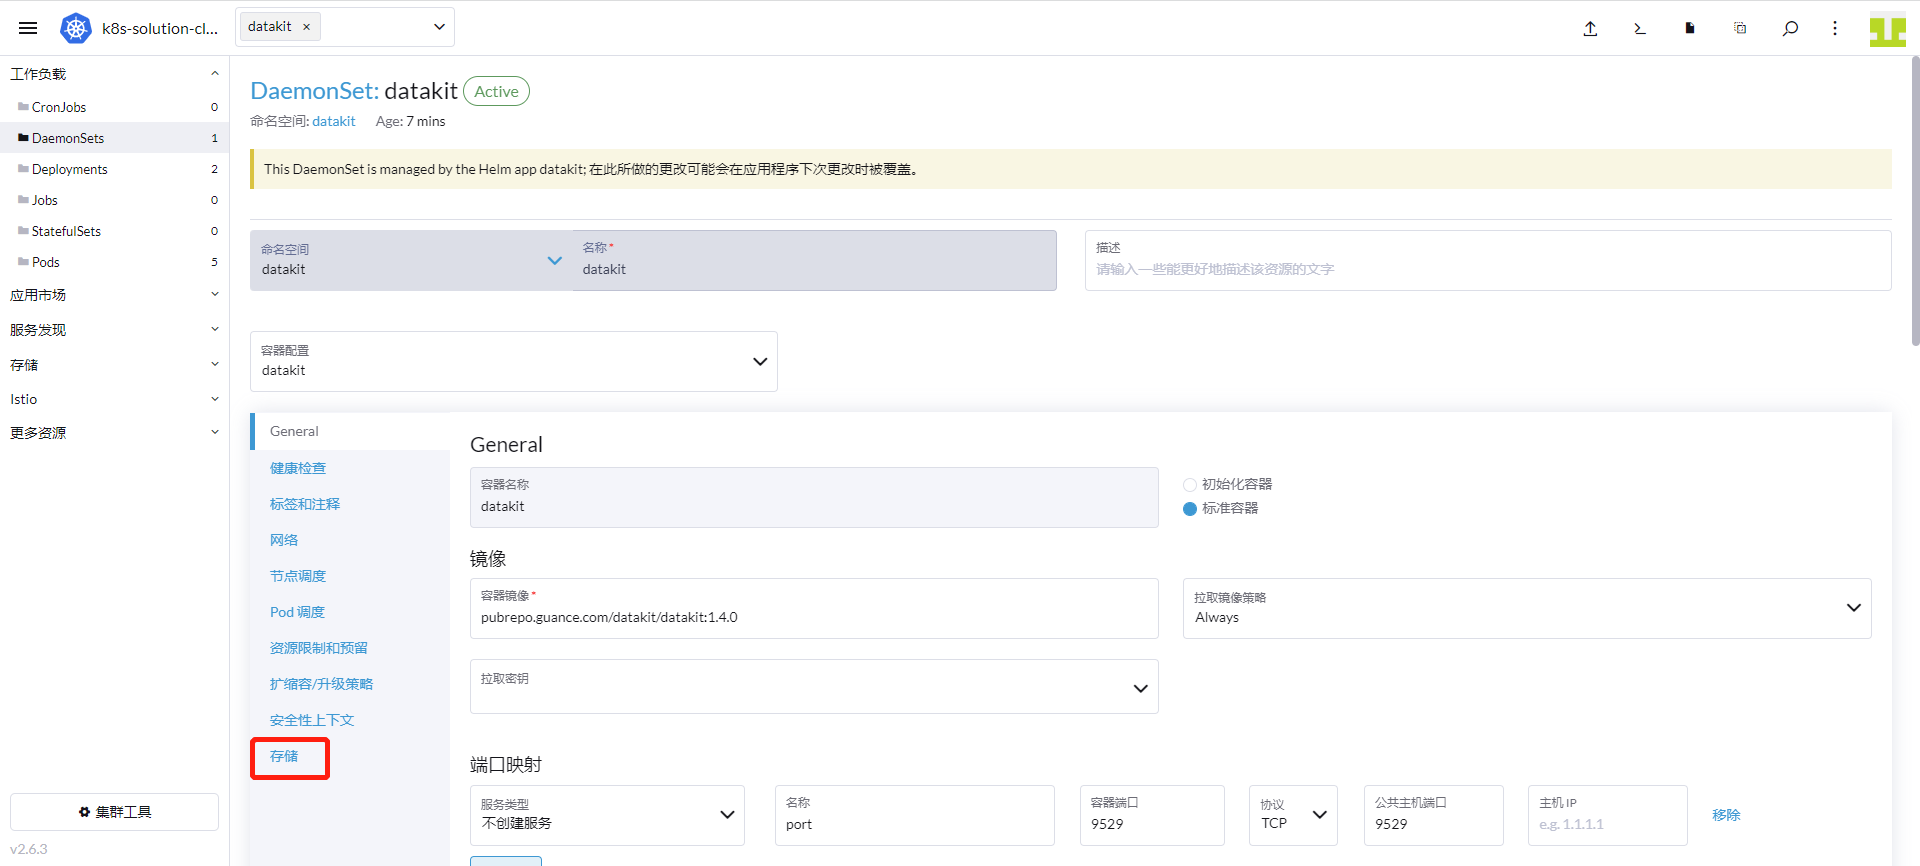
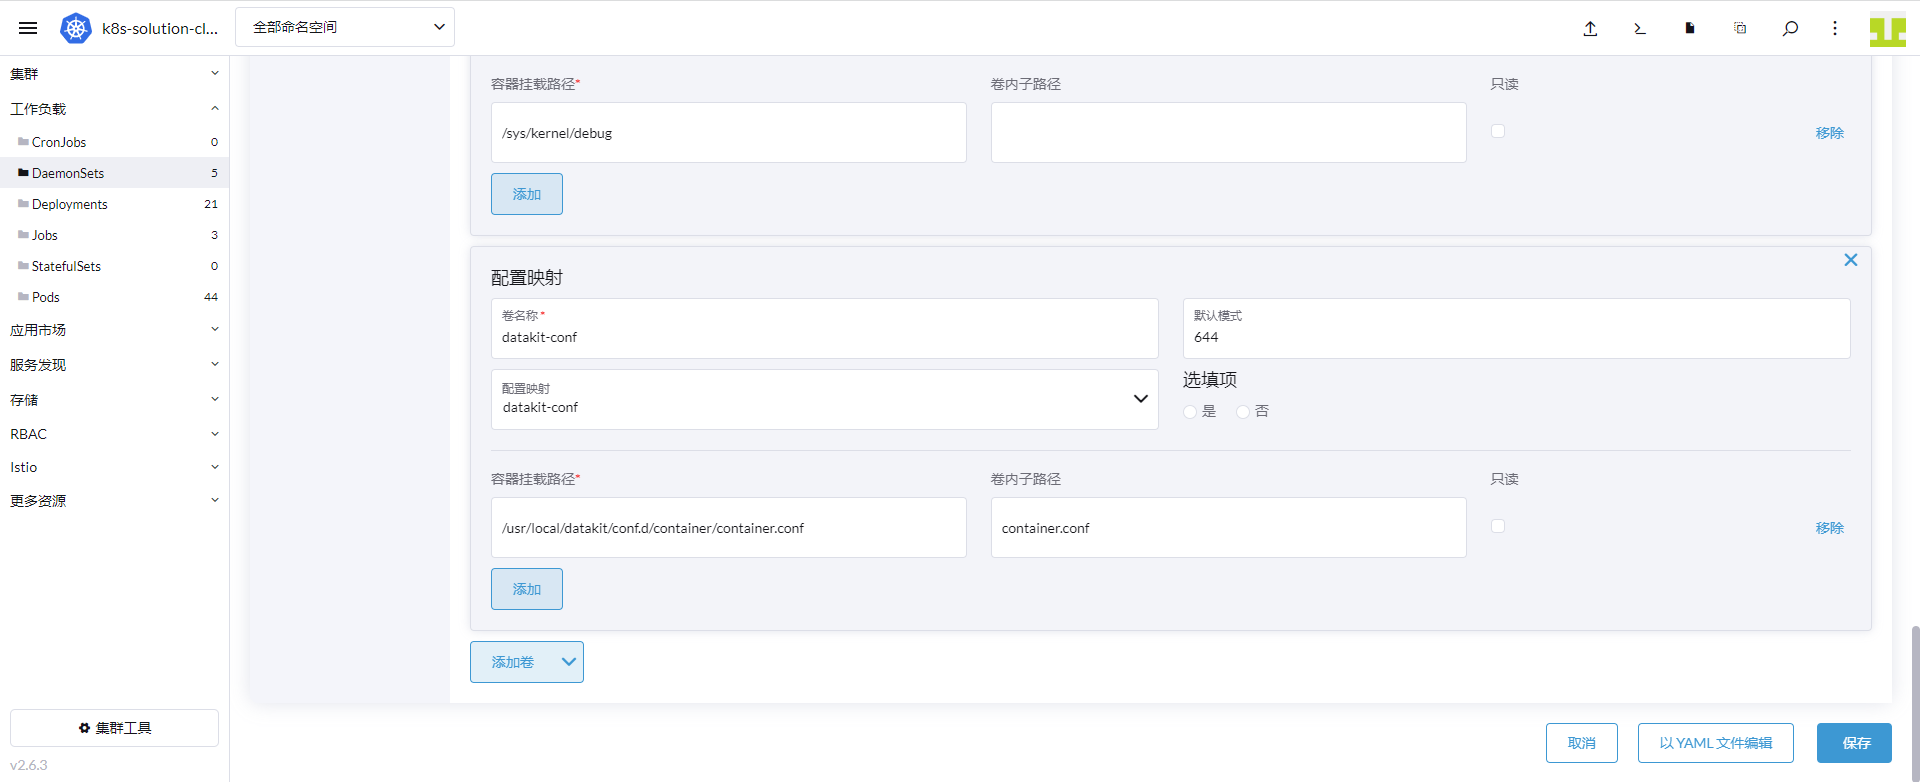
点击「添加卷」 - 「配置映射」。
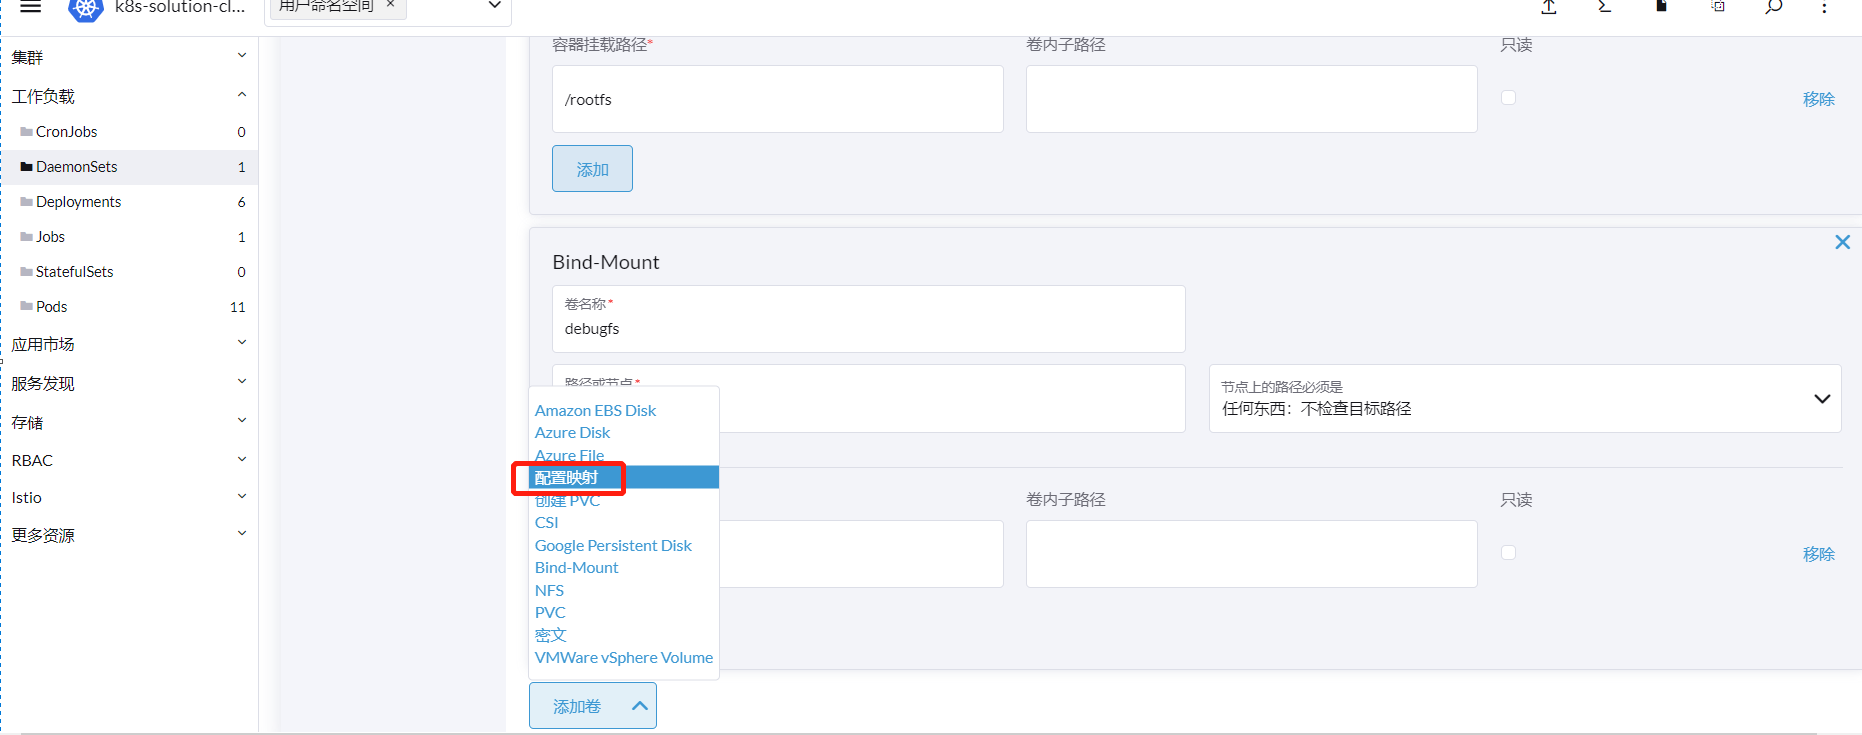
卷名称这里输入「datakit-conf」,配置映射选择「datakit.conf」,卷内子路径输入「container.conf」,容器挂载路径输入 /usr/local/datakit/conf.d/container/container.conf ,点击「保存」。
2、 Container 监控视图
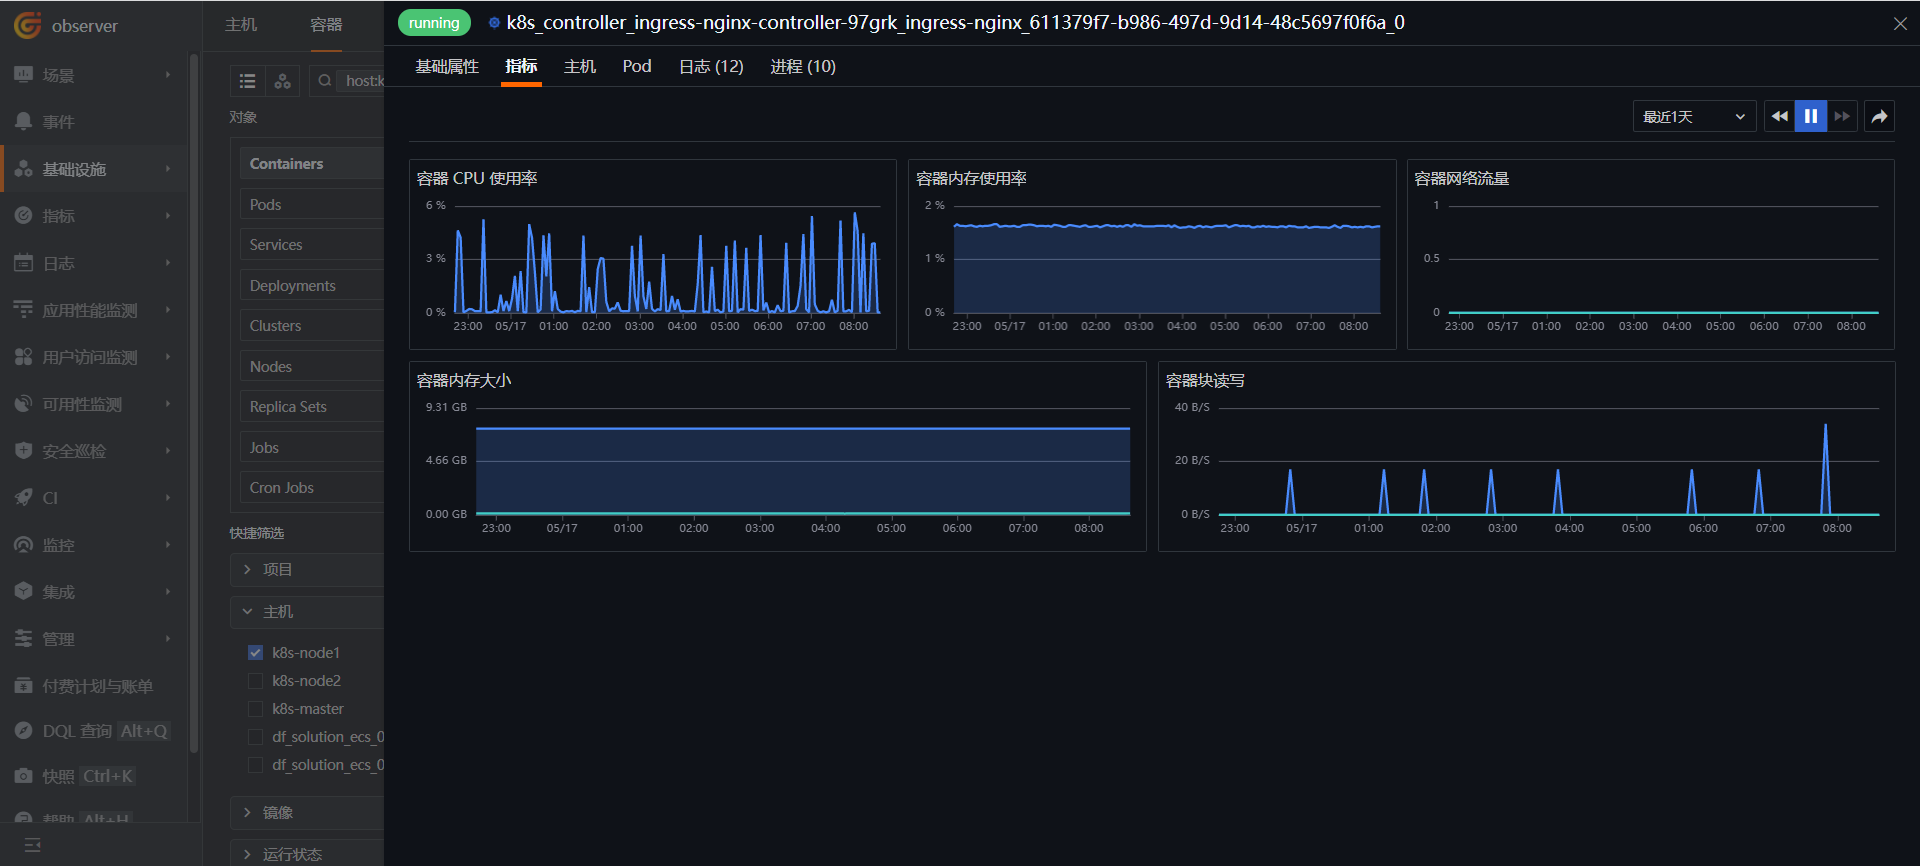
登录「观测云」 - 「基础设施」 - 「容器」,输入「host:k8s-node1」 ,显示 k8s-node1 节点的容器,点击「ingress」。
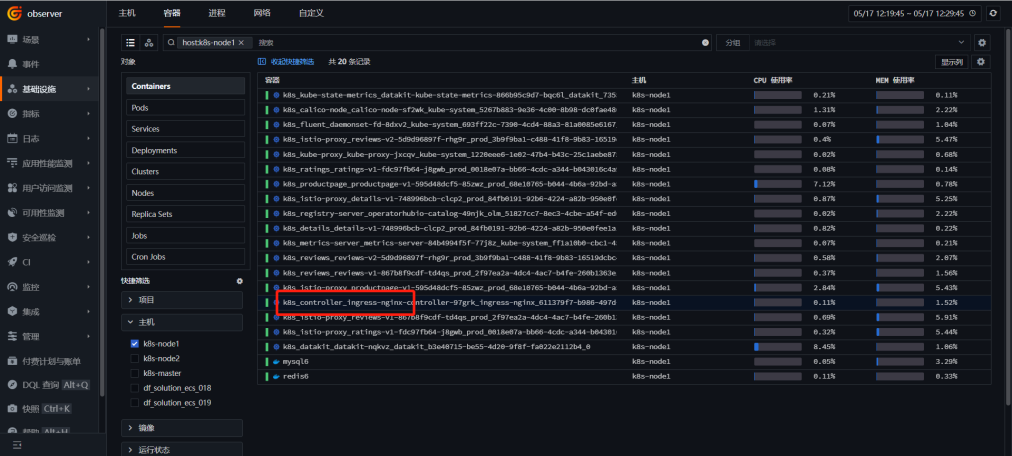
点击「指标」,查看 DataKit Container 的监控视图。
2.3 Kubernetes 监控视图
1、 部署采集器
在安装 DataKit 时已经安装了 metric-server 和 Kube-State-Metrics。
2、 部署 Kubernetes 监控视图
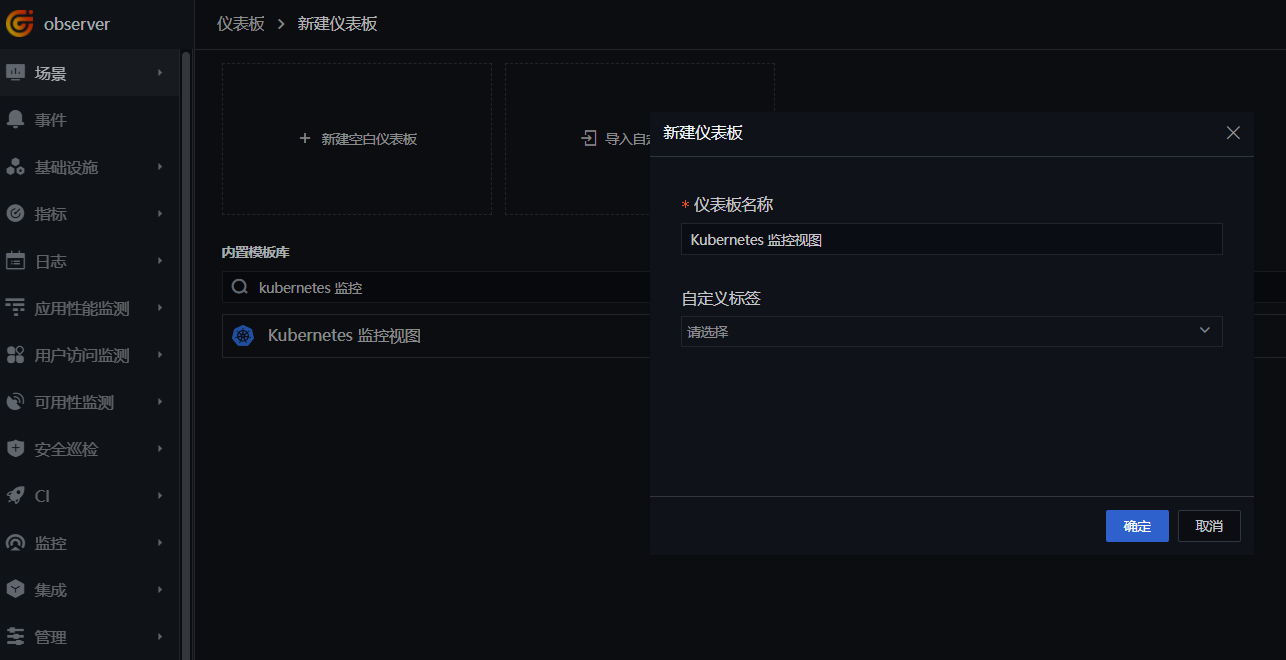
登录「观测云」,进入「场景」模块,点击「新建仪表板」,输入「kubernetes 监控」,选择 「Kubernetes 监控视图」,点击「确定」。
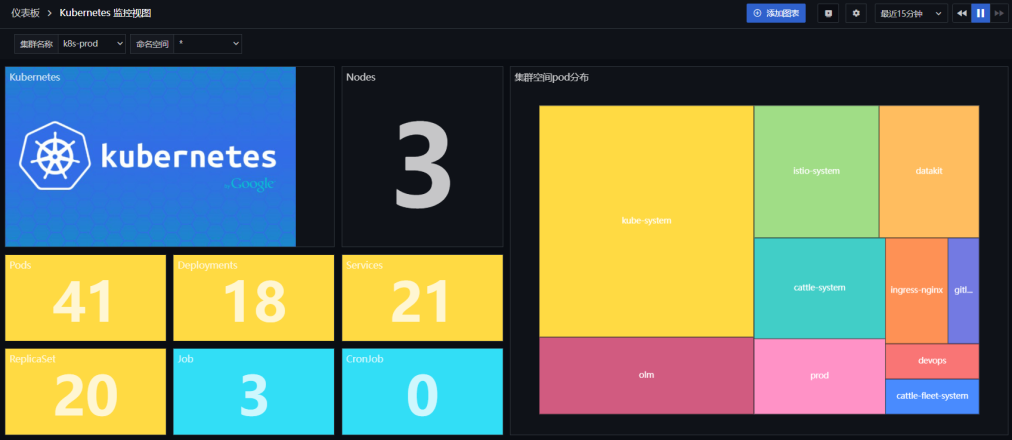
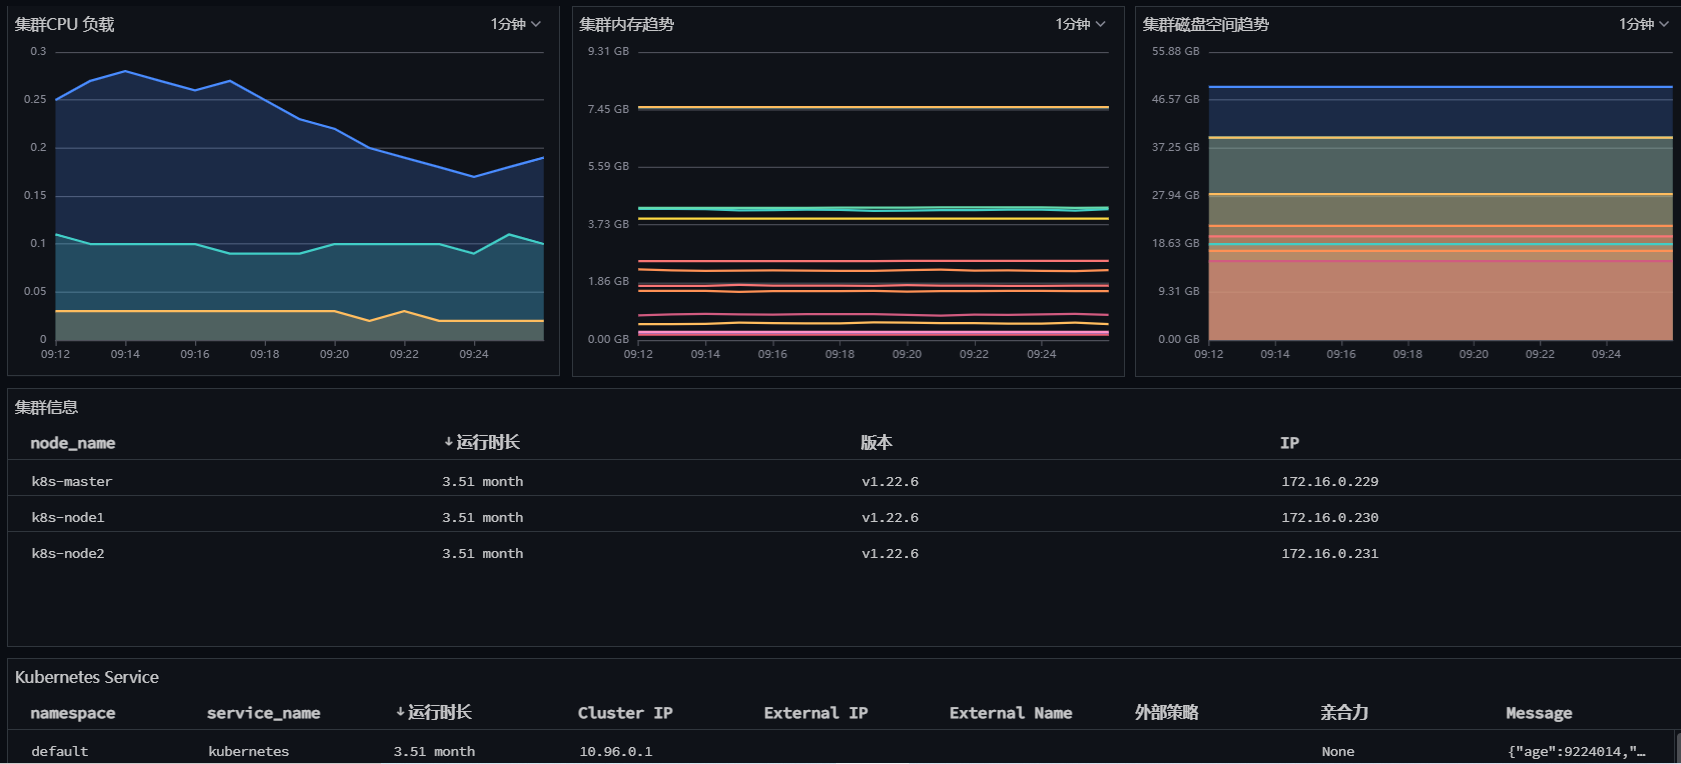
点击新建的「Kubernetes 监控视图」,查看集群信息。
2.4 Kubernetes Overview with Kube State Metrics 监控视图
1、 开启采集器
登录「Rancher」 - 「集群」 - 「存储」 - 「ConfigMaps」,找到 datakit-conf,点击「编辑配置」。
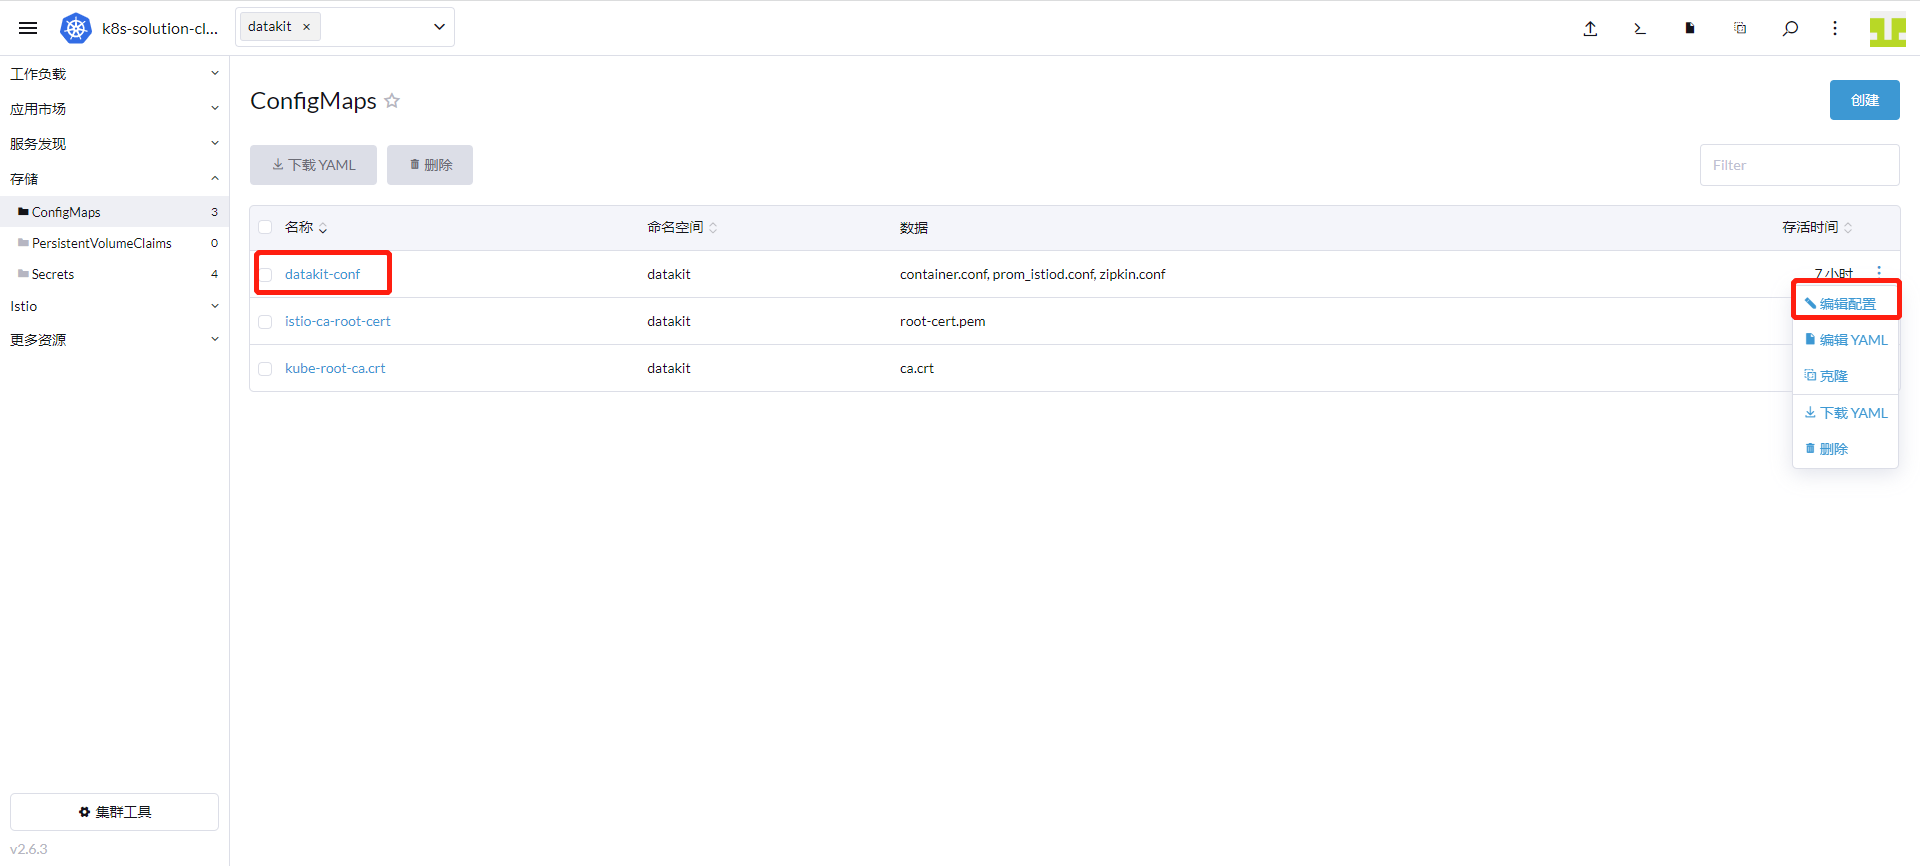
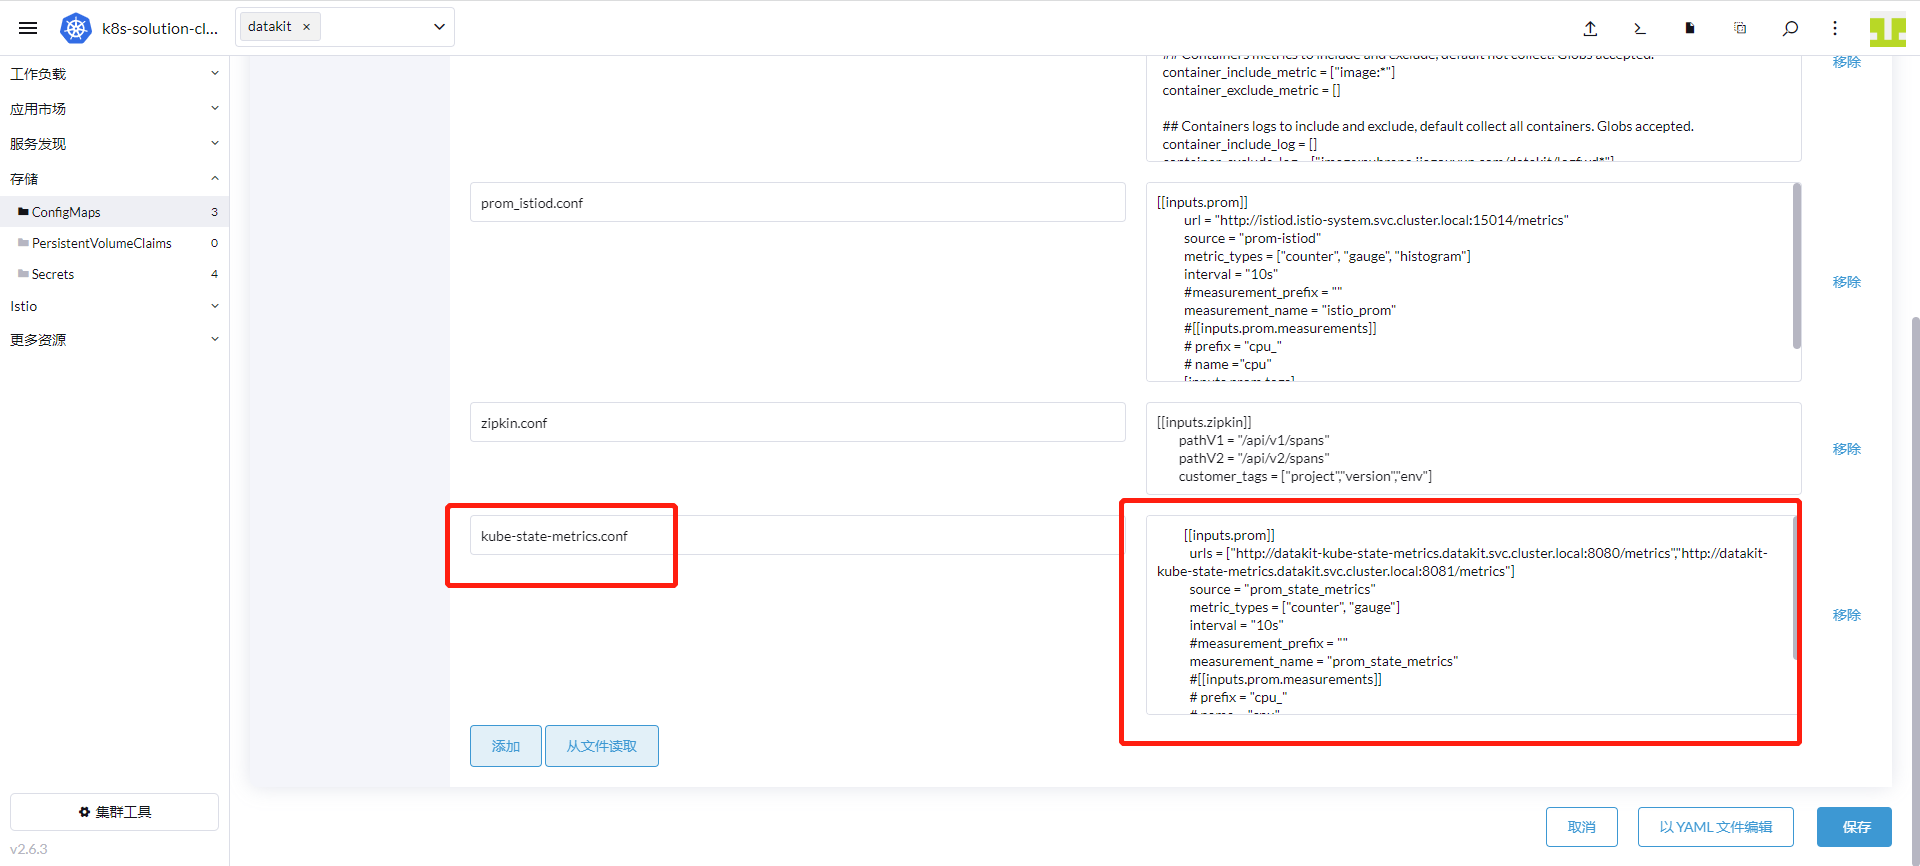
点击「添加」,键输入「kube-state-metrics.conf」,值输入如下内容,点击「保存」。
          [[inputs.prom]]
            urls = ["http://datakit-kube-state-metrics.datakit.svc.cluster.local:8080/metrics","http://datakit-kube-state-metrics.datakit.svc.cluster.local:8081/metrics"]
            source = "prom_state_metrics"
            metric_types = ["counter", "gauge"]
            interval = "60s"
            tags_ignore = ["access_mode","branch","claim_namespace","cluster_ip","condition","configmap","container","container_id","container_runtime_version","created_by_kind","created_by_name","effect","endpoint","external_name","goversion","host_network","image","image_id","image_spec","ingress","ingressclass","internal_ip","job_name","kernel_version","key","kubelet_version","kubeproxy_version","lease","mutatingwebhookconfiguration","name","networkpolicy","node","node_name","os_image","owner_is_controller","owner_kind","owner_name","path","persistentvolume","persistentvolumeclaim","pod_cidr","pod_ip","poddisruptionbudget","port_name","port_number","port_protocol","priority_class","reason","resource","result","revision","role","secret","service","service_name","service_port","shard_ordinal","status","storageclass","system_uuid","type","uid","unit","version","volume","volumename"]
            metric_name_filter = ["kube_pod_status_phase","kube_pod_container_status_restarts_total","kube_daemonset_status_desired_number_scheduled","kube_daemonset_status_number_ready","kube_deployment_spec_replicas","kube_deployment_status_replicas_available","kube_deployment_status_replicas_unavailable","kube_replicaset_status_ready_replicas","kube_replicaset_spec_replicas","kube_pod_container_status_running","kube_pod_container_status_waiting","kube_pod_container_status_terminated","kube_pod_container_status_ready"]
            #measurement_prefix = ""
            measurement_name = "prom_state_metrics"
            #[[inputs.prom.measurements]]
            # prefix = "cpu_"
            # name = "cpu"
            [inputs.prom.tags]
            namespace = "$NAMESPACE"
            pod_name = "$PODNAME"
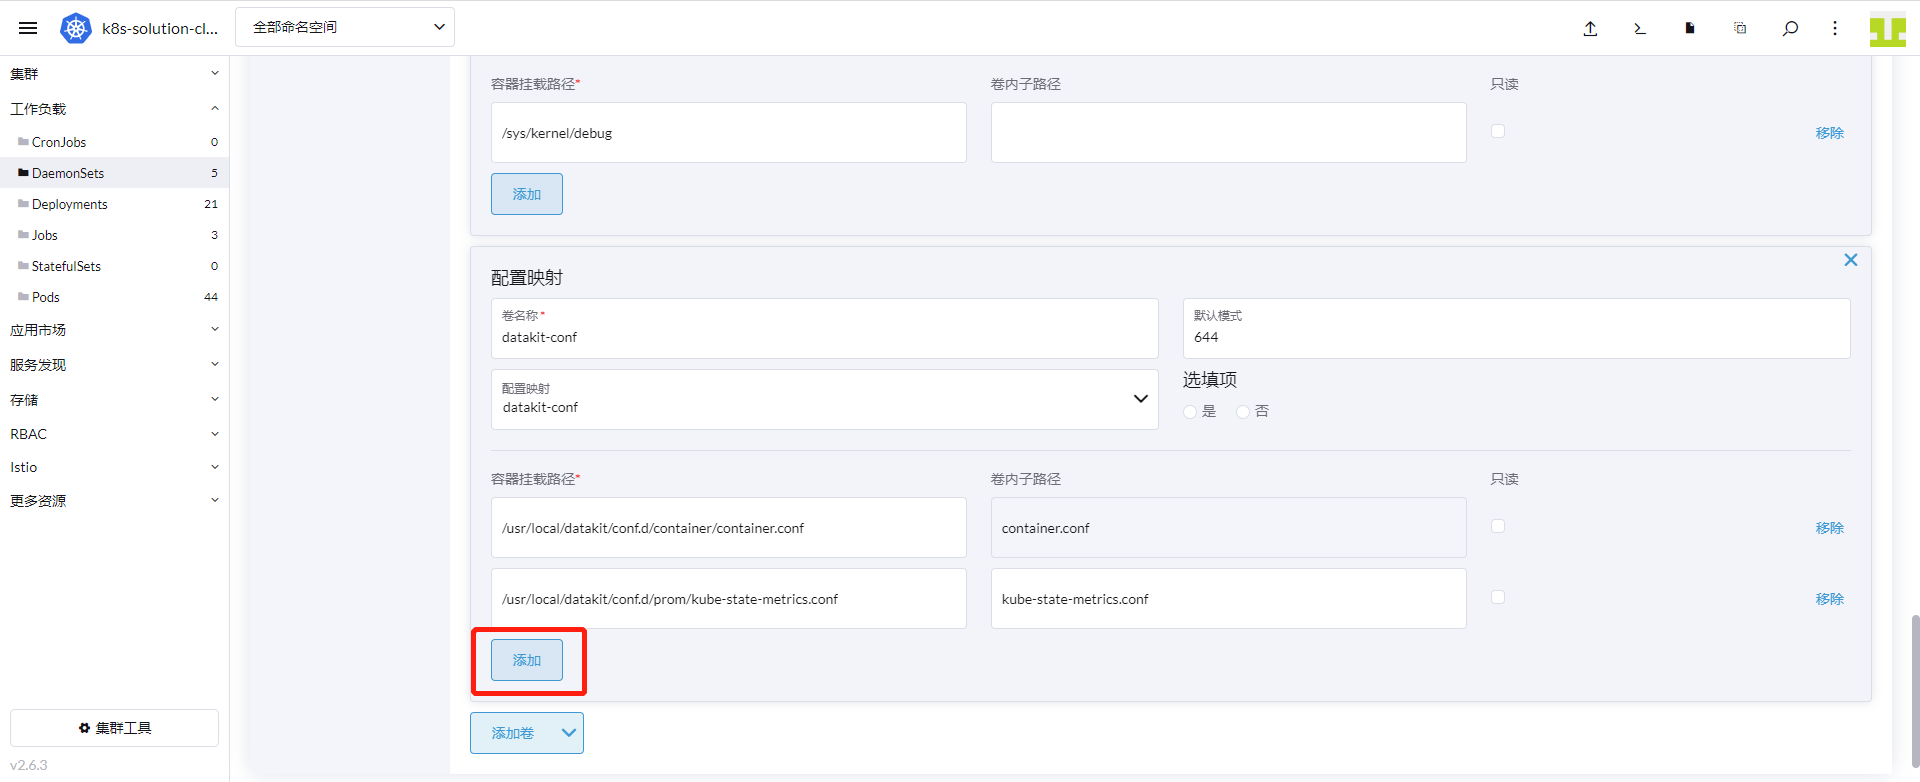
进入「集群」 - 「工作负载」 - 「DaemonSets」,点击 datakit 行的右边,选择「编辑配置」。
点击「存储」,找到卷名称是「datakit-conf」的配置映射,点击「添加」,容器挂载路径填「/usr/local/datakit/conf.d/prom/kube-state-metrics.conf」,卷内子路径输入「kube-state-metrics.conf」,点击「保存」。
2、 Kubernetes Overview with Kube State Metrics 监控视图
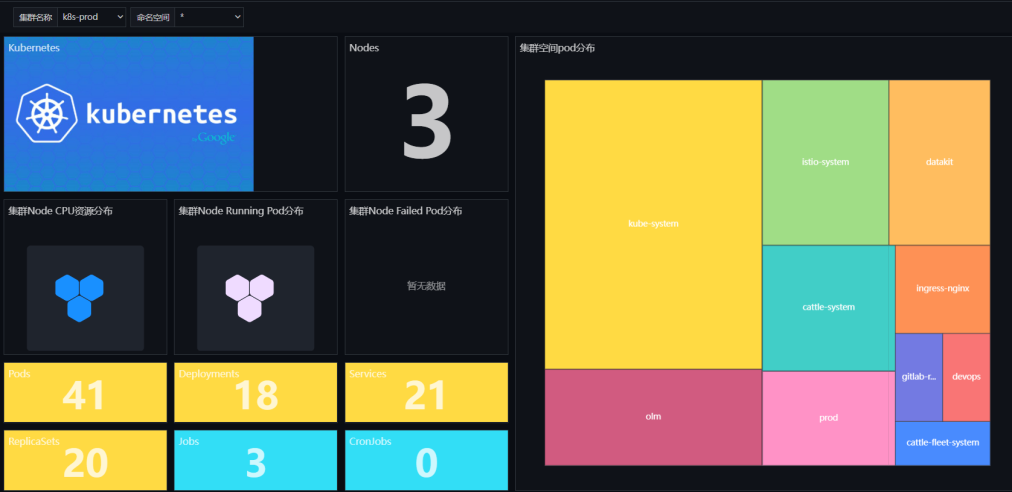
登录「观测云」,进入「场景」模块,点击「新建仪表板」,输入「kubernetes Overview」,选择 「Kubernetes Overview with Kube State Metrics 监控视图」,点击「确定」。
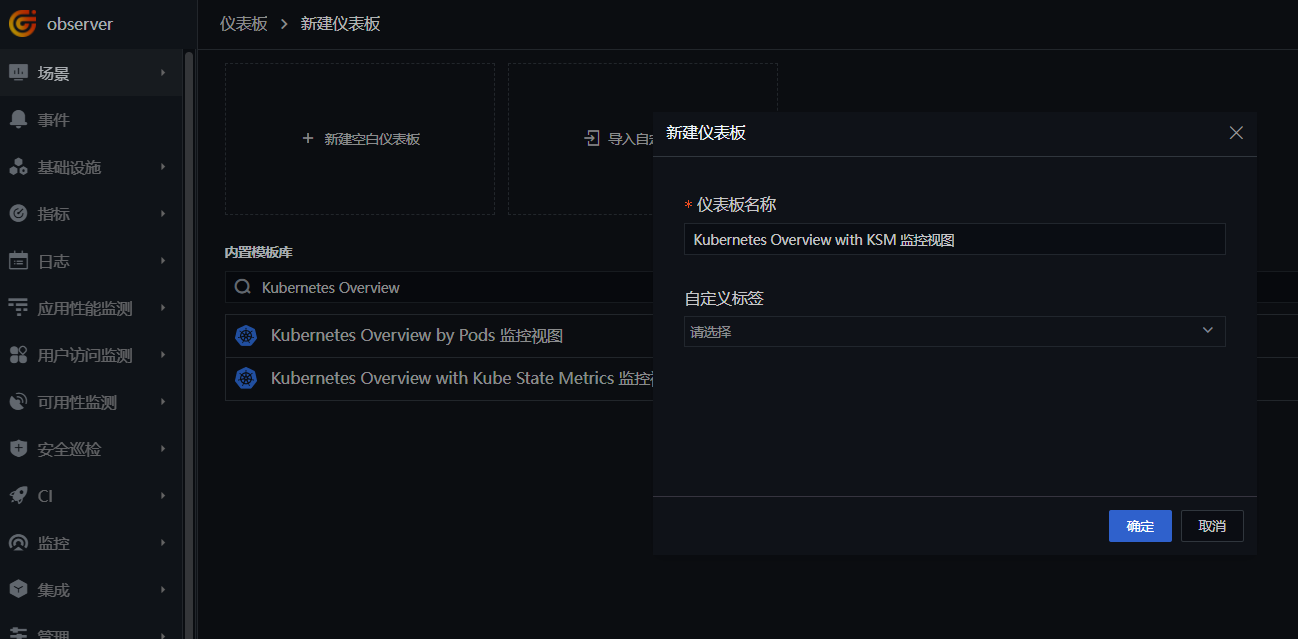
点击新建的「Kubernetes Overview with KSM 监控视图」,查看集群信息。
2.5 Kubernetes Overview by Pods 监控视图
登录「观测云」,进入「场景」模块,点击「新建仪表板」,输入「kubernetes Overview by」,选择 「Kubernetes Overview by Pods 监控视图」,点击「确定」。
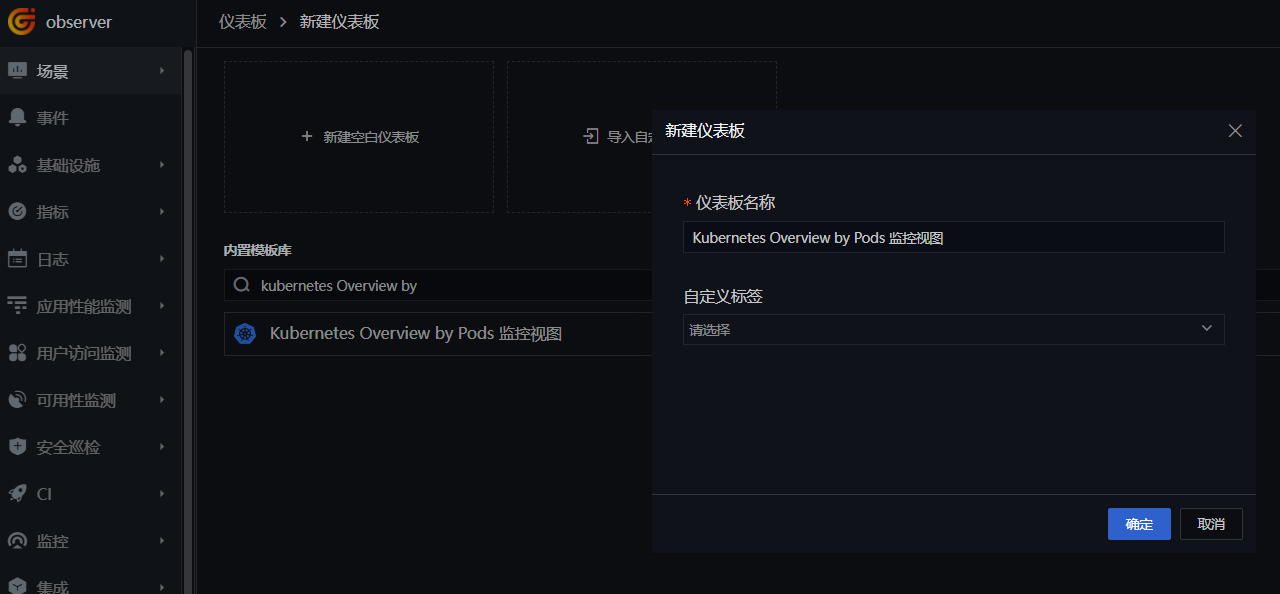
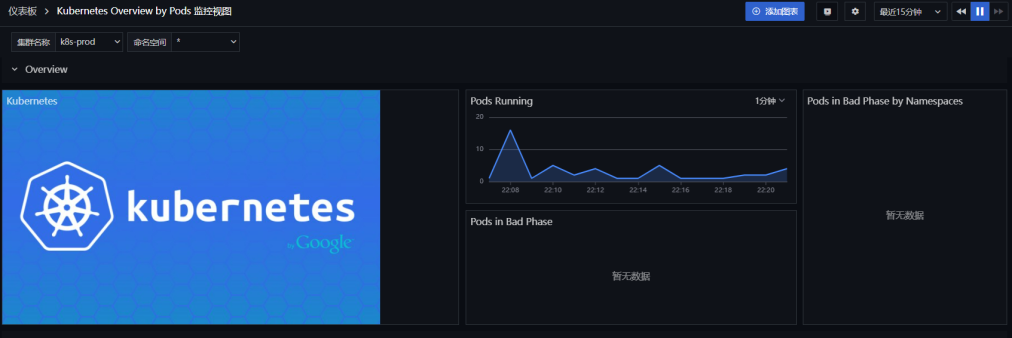
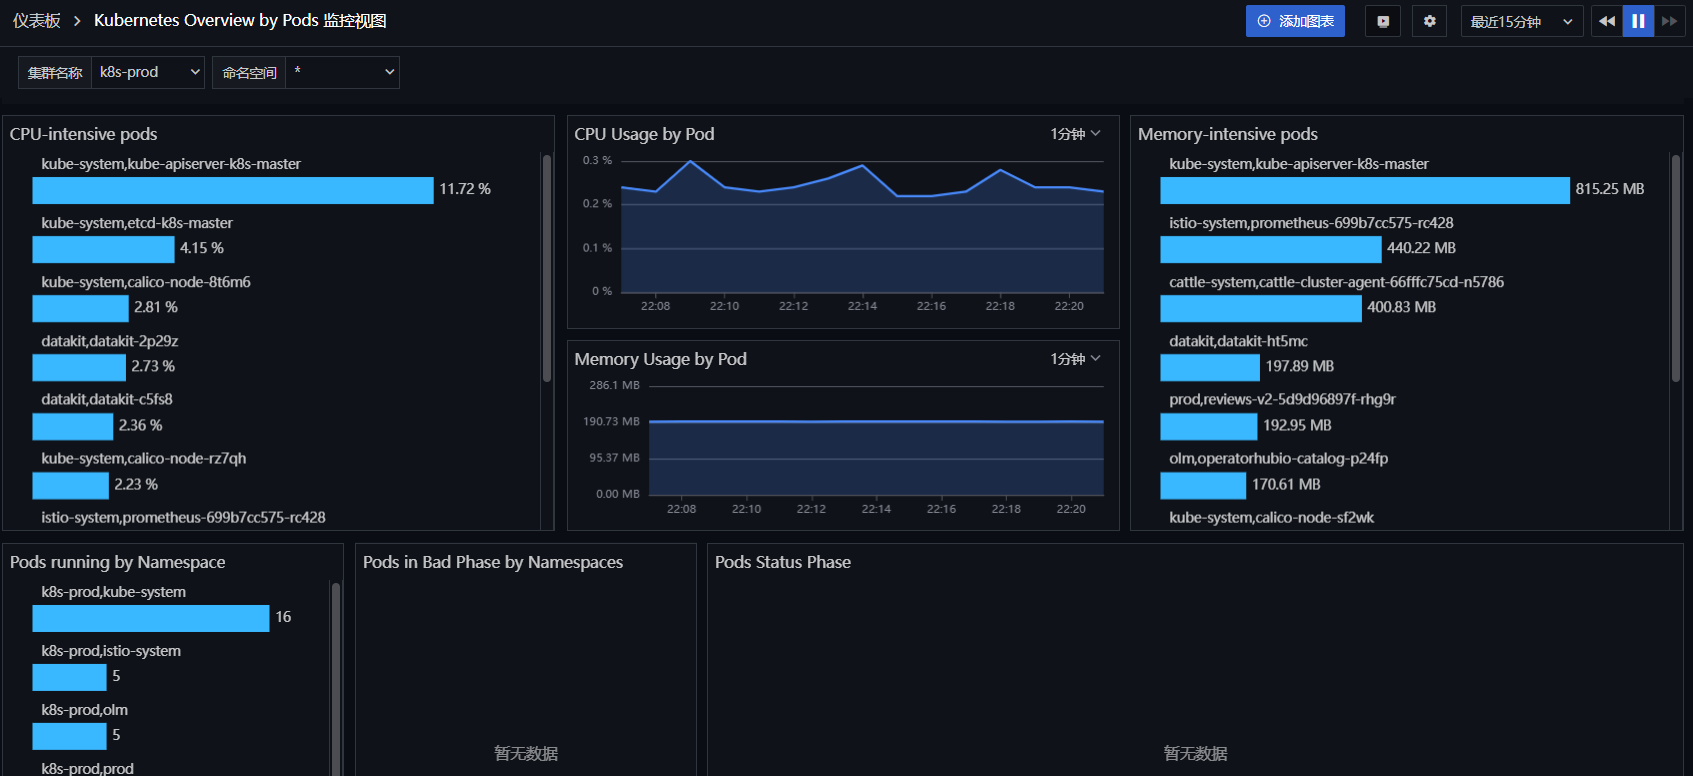
点击新建的「Kubernetes Overview by Pods 监控视图」,查看集群信息。
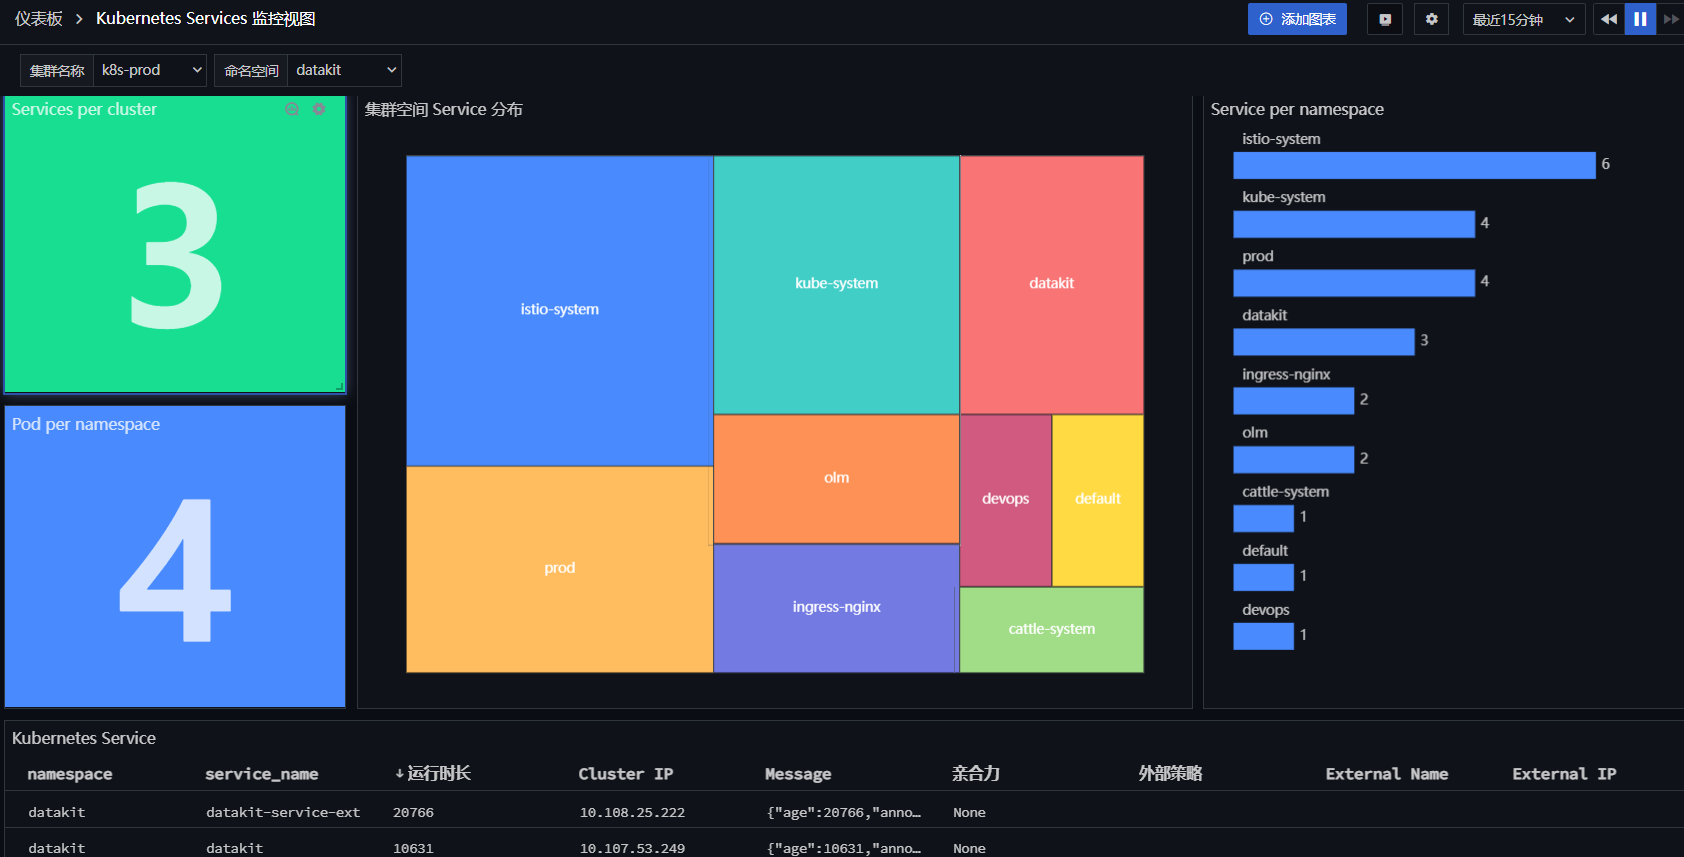
2.6 Kubernetes Services 监控视图
登录「观测云」,进入「场景」模块,点击「新建仪表板」,输入「kubernetes Services」,选择 「Kubernetes Services 监控视图」,点击「确定」。
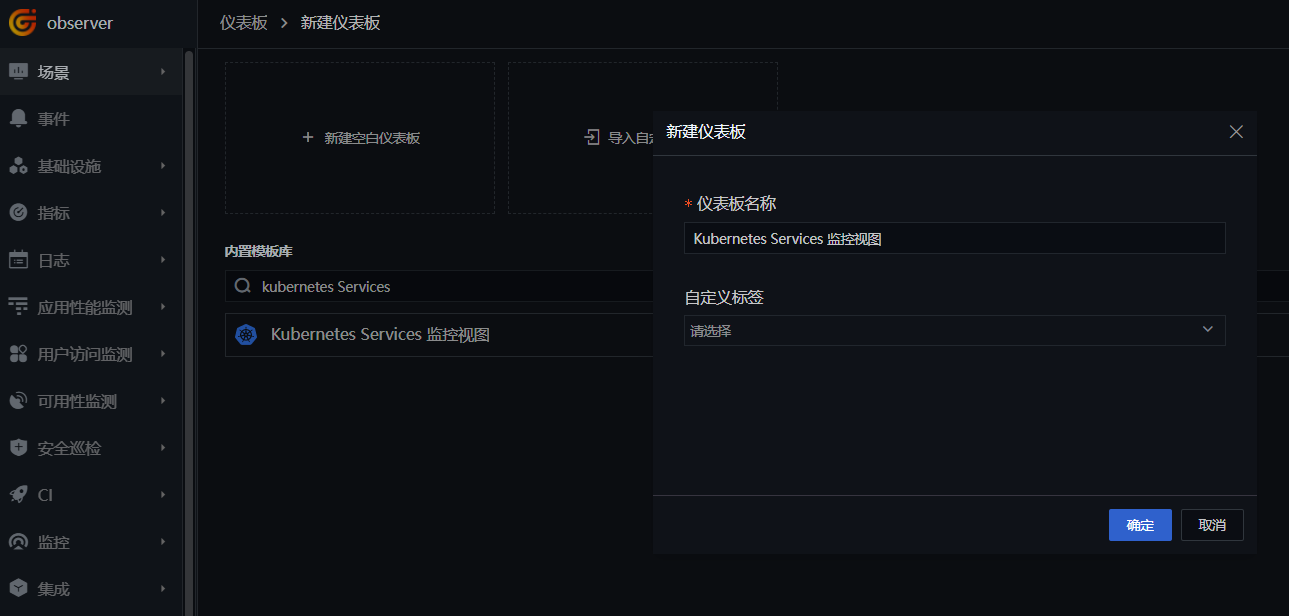
点击新建的「Kubernetes Services 监控视图」,查看集群信息。
步骤 3 部署 Istio 及应用
3.1 部署 Istio
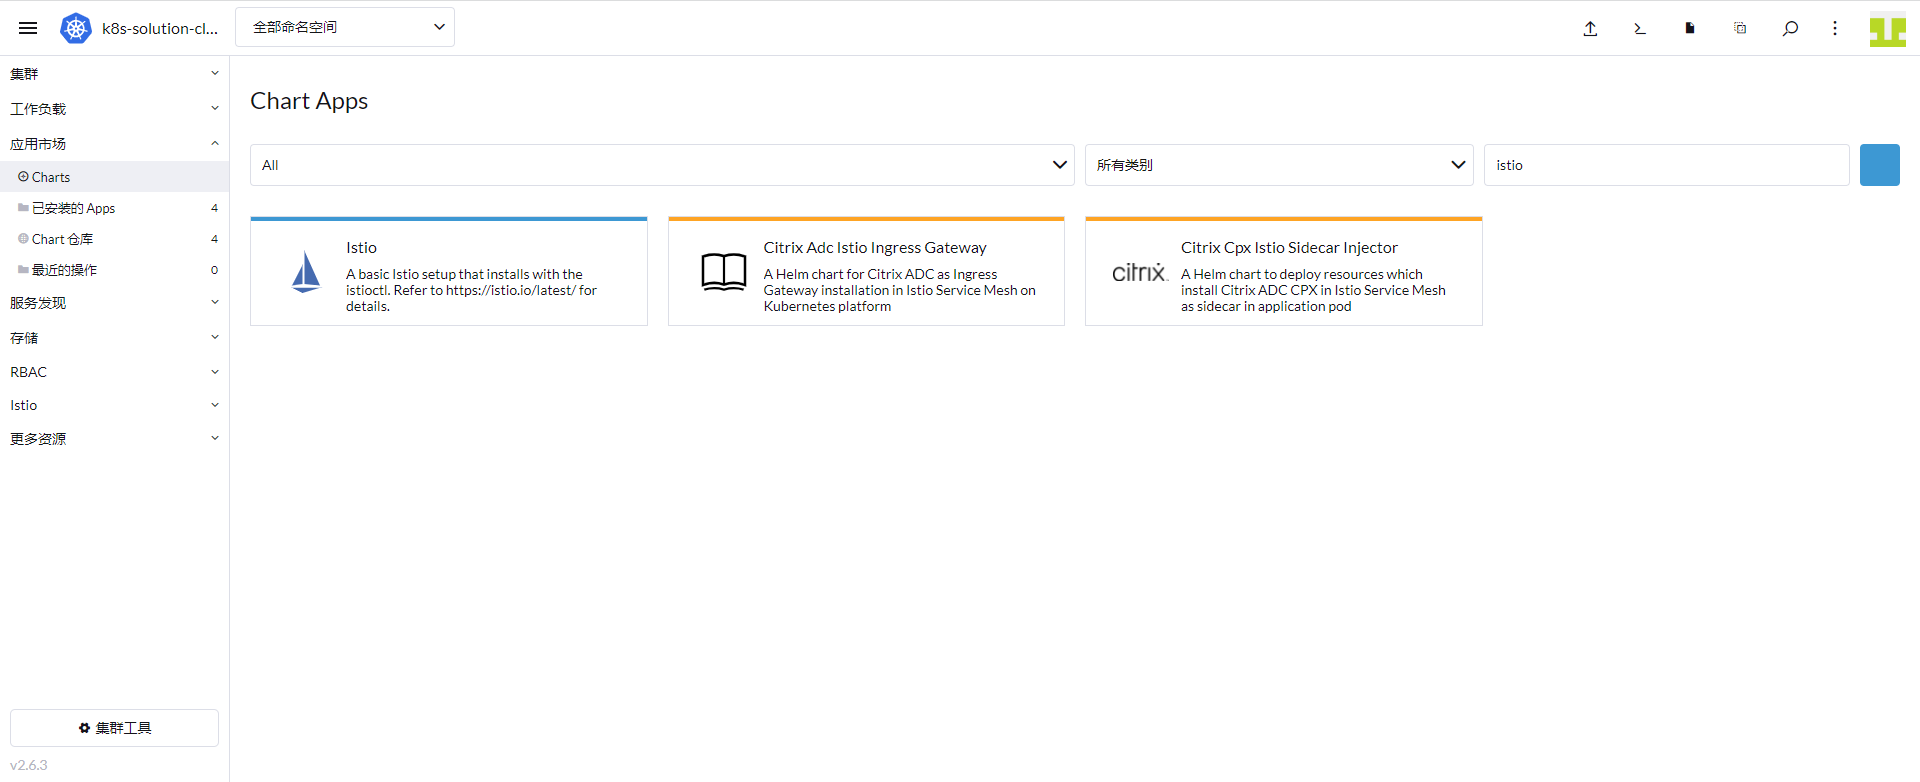
登录「Rancher」 - 「应用市场」 - 「Charts」,选择 Istio 进行安装。
3.2 开通 Sidecar 注入
新建 prod 命名空间,开启该空间下创建 Pod 时自动注入 Sidecar,让 Pod 的出入流量都转由 Sidecar 进行处理。
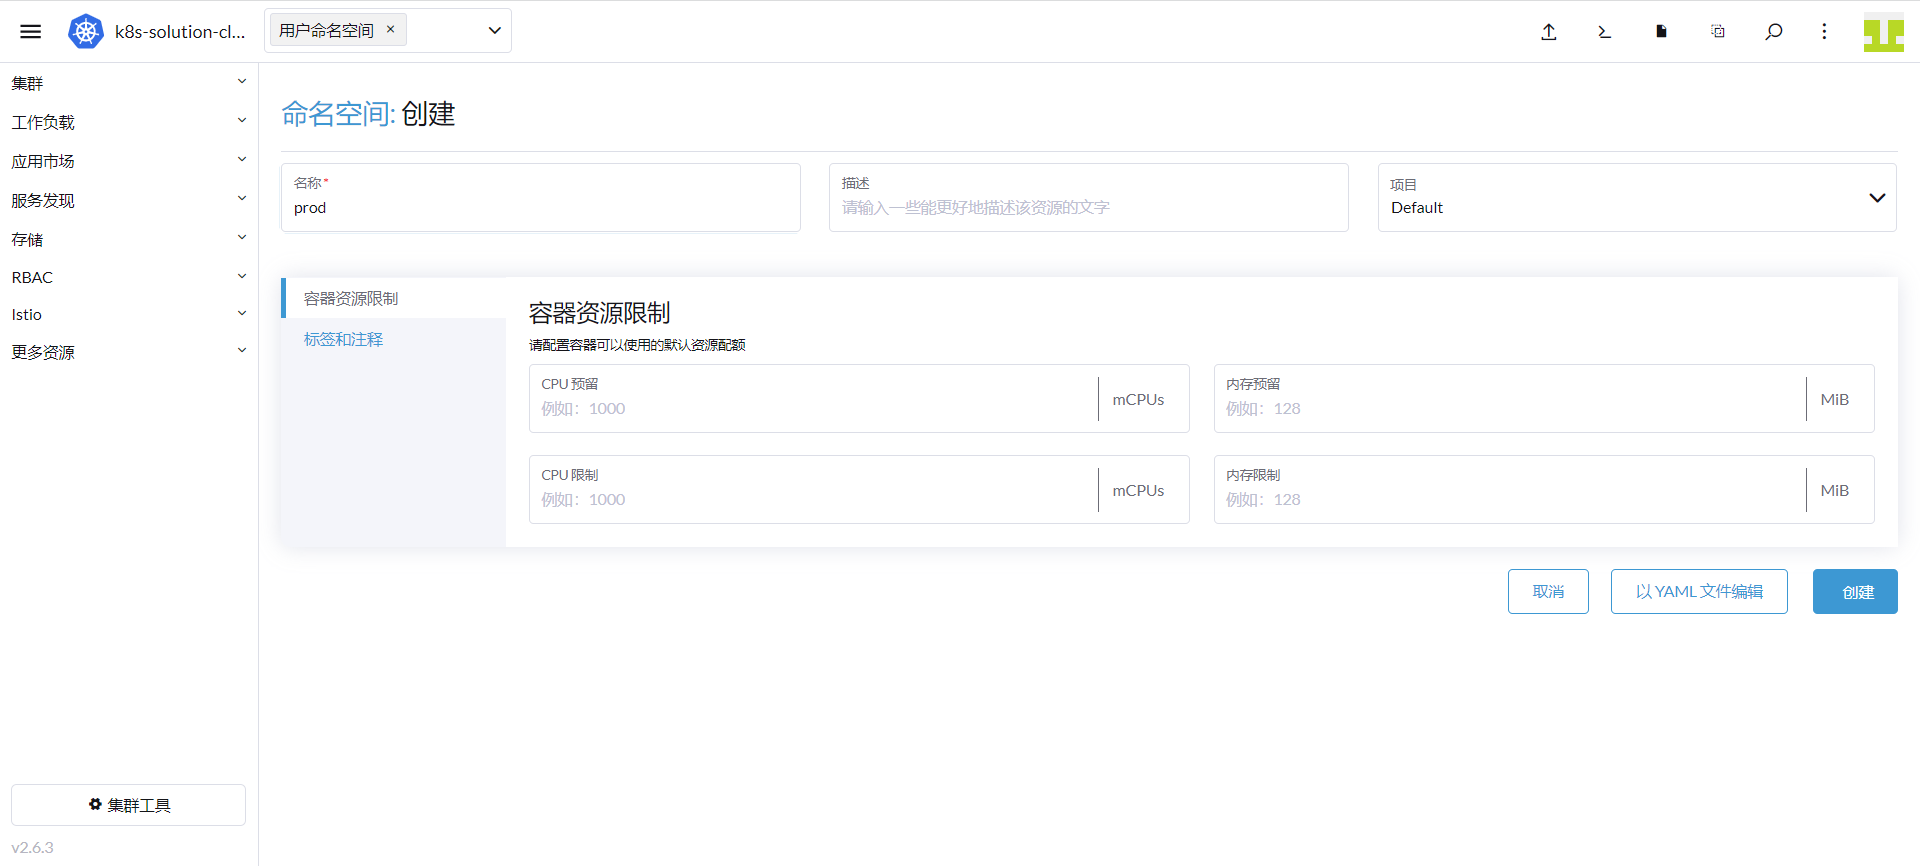
登录「Rancher」 - 「集群」 - 「项目/命名空间」,点击「创建命名空间」。
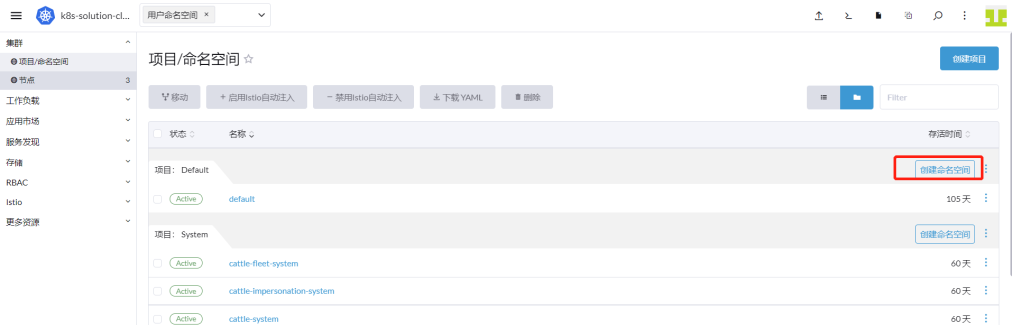
名称输入「prod」,点击「创建」。
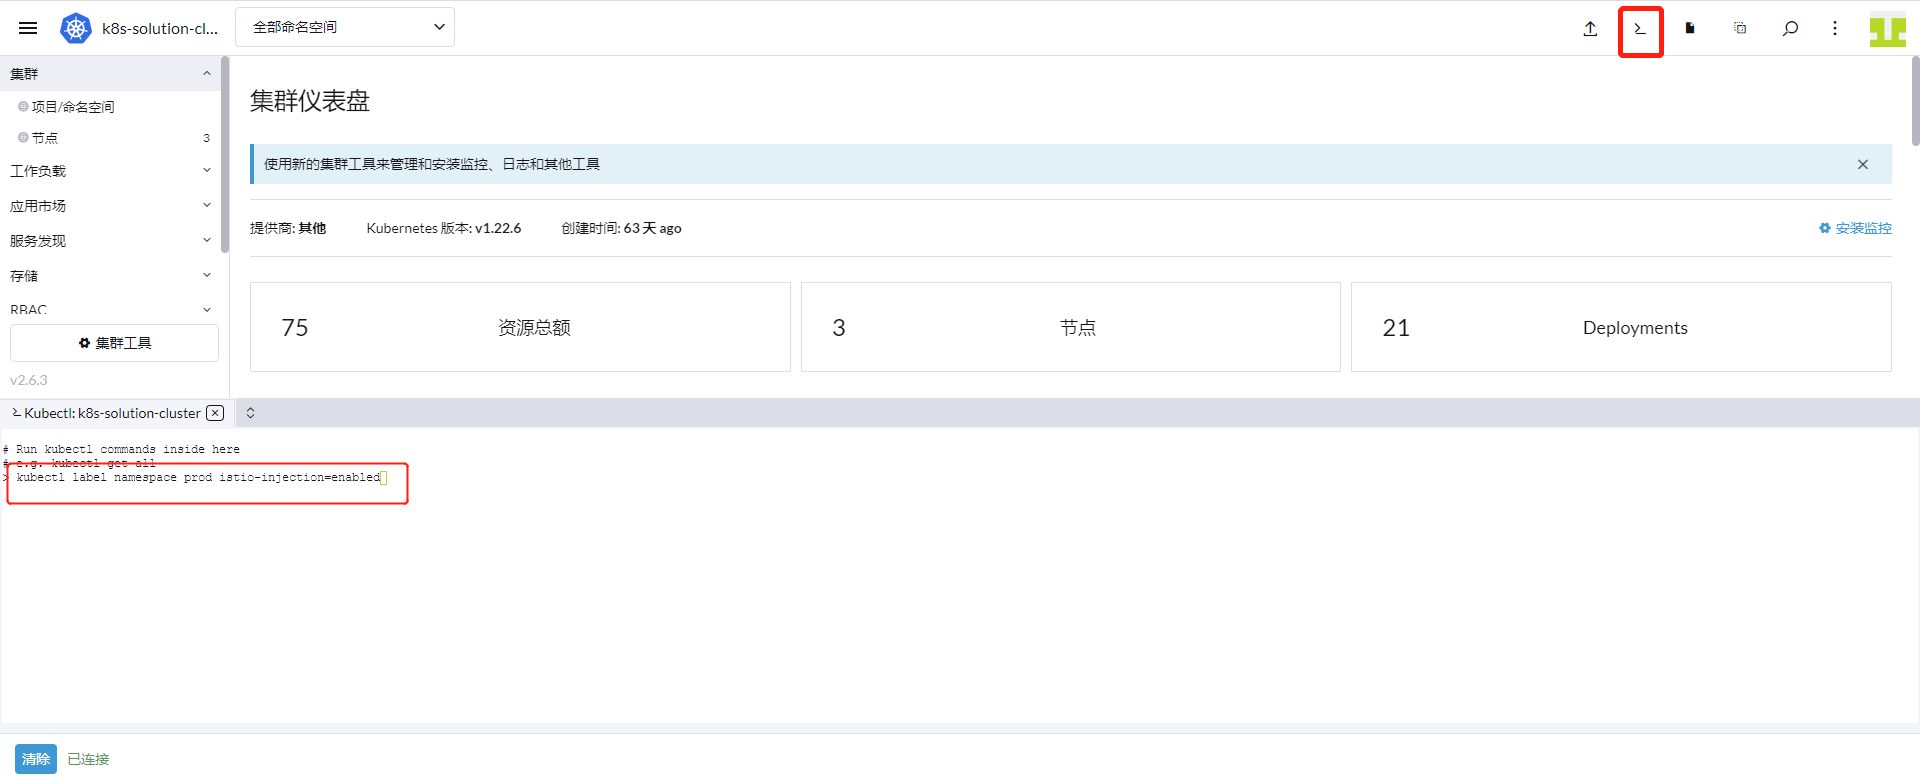
点击 Rancher 上方的「命令行」图标,输入「kubectl label namespace prod istio-injection=enabled」,回车。
3.3 开启 Istiod 采集器
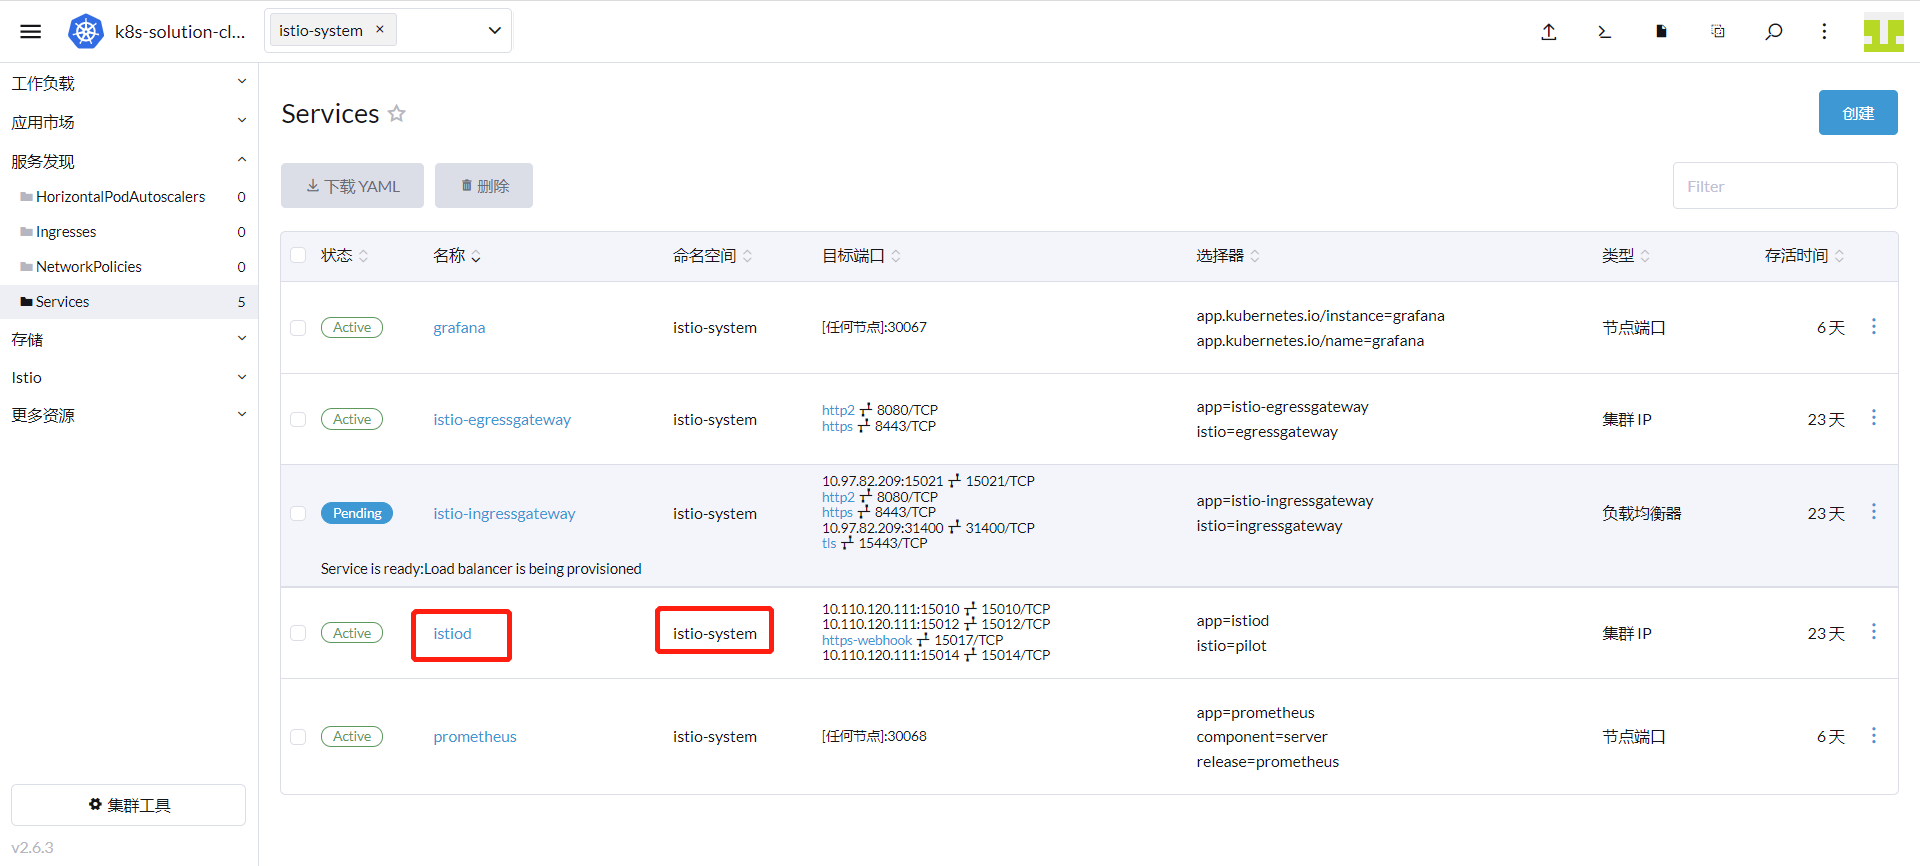
登录「Rancher」 - 「集群」 - 「服务发现」 - 「Service」,查看 Service 名称是 istiod,空间是 istio-system。
登录「Rancher」 - 「集群」 - 「存储」 - 「ConfigMaps」,找到 datakit-conf,点击「编辑配置」。

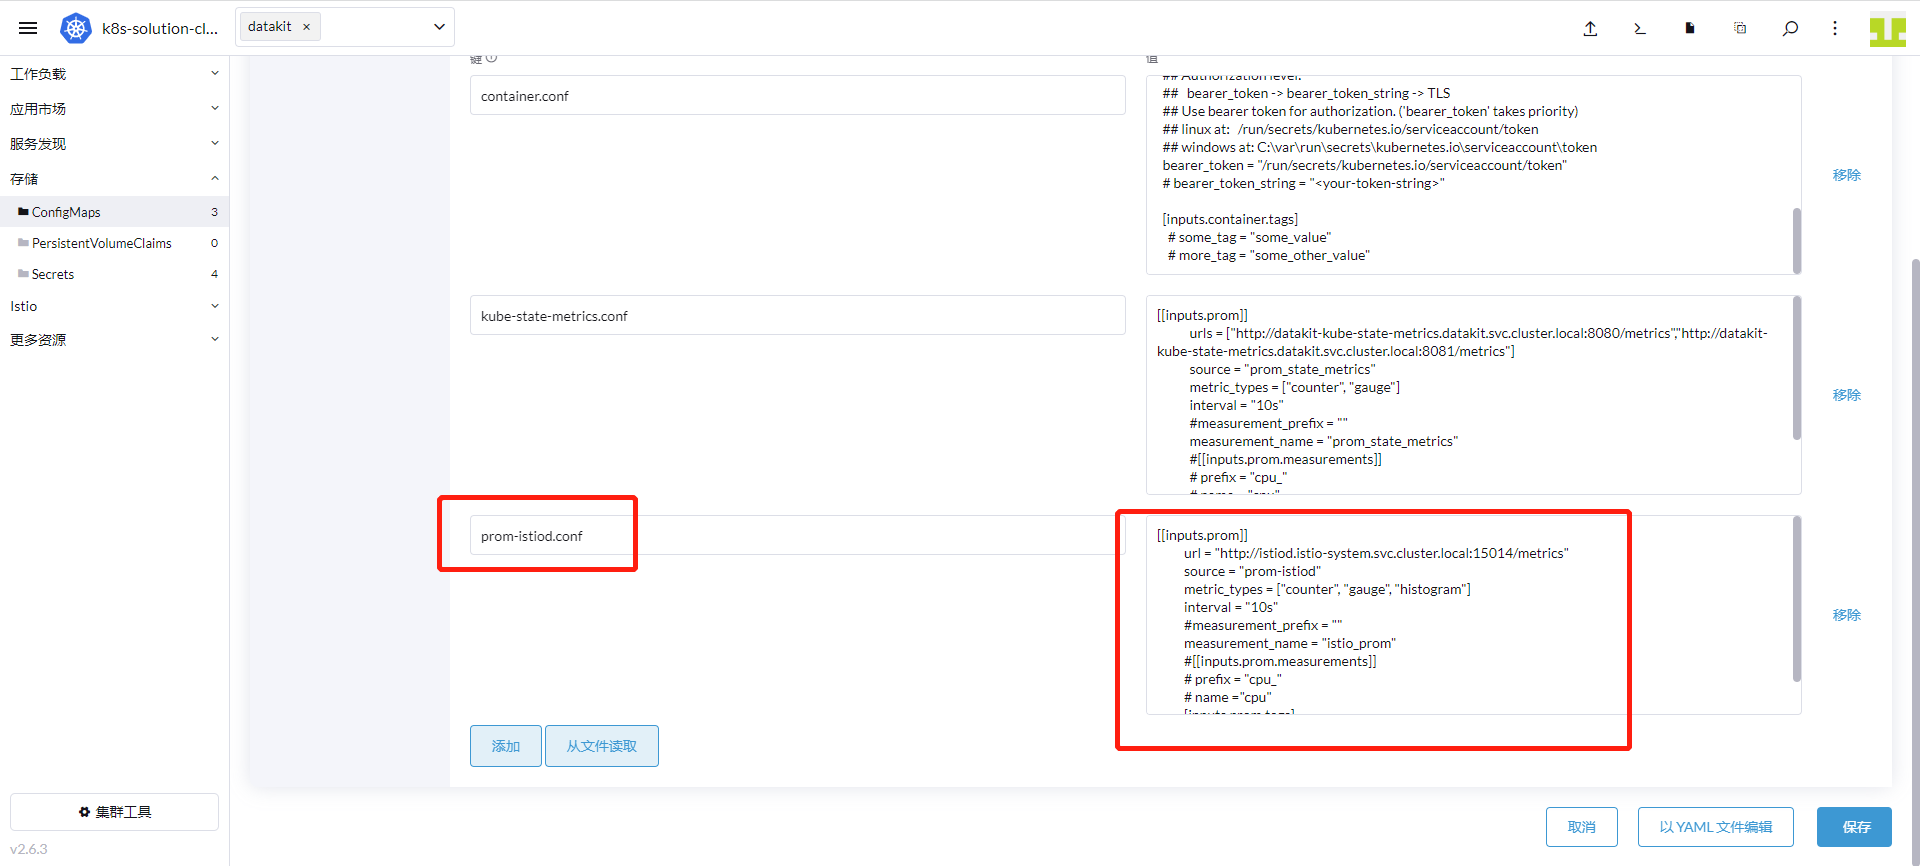
点击「添加」,键输入「prom-istiod.conf」,值输入如下内容。点击「保存」。
        [[inputs.prom]]
          url = "http://istiod.istio-system.svc.cluster.local:15014/metrics"
          source = "prom-istiod"
          metric_types = ["counter", "gauge"]
          interval = "60s"
          tags_ignore = ["cache","cluster_type","component","destination_app","destination_canonical_revision","destination_canonical_service","destination_cluster","destination_principal","group","grpc_code","grpc_method","grpc_service","grpc_type","reason","request_protocol","request_type","resource","responce_code_class","response_flags","source_app","source_canonical_revision","source_canonical-service","source_cluster","source_principal","source_version","wasm_filter"]
          #measurement_prefix = ""
          metric_name_filter = ["istio_requests_total","pilot_k8s_cfg_events","istio_build","process_virtual_memory_bytes","process_resident_memory_bytes","process_cpu_seconds_total","envoy_cluster_assignment_stale","go_goroutines","pilot_xds_pushes","pilot_proxy_convergence_time_bucket","citadel_server_root_cert_expiry_timestamp","pilot_conflict_inbound_listener","pilot_conflict_outbound_listener_http_over_current_tcp","pilot_conflict_outbound_listener_tcp_over_current_tcp","pilot_conflict_outbound_listener_tcp_over_current_http","pilot_virt_services","galley_validation_failed","pilot_services","envoy_cluster_upstream_cx_total","envoy_cluster_upstream_cx_connect_fail","envoy_cluster_upstream_cx_active","envoy_cluster_upstream_cx_rx_bytes_total","envoy_cluster_upstream_cx_tx_bytes_total","istio_request_duration_milliseconds_bucket","istio_request_duration_seconds_bucket","istio_request_bytes_bucket","istio_response_bytes_bucket"]
          measurement_name = "istio_prom"
          #[[inputs.prom.measurements]]
          # prefix = "cpu_"
          # name ="cpu"
          [inputs.prom.tags]
            app_id="istiod"
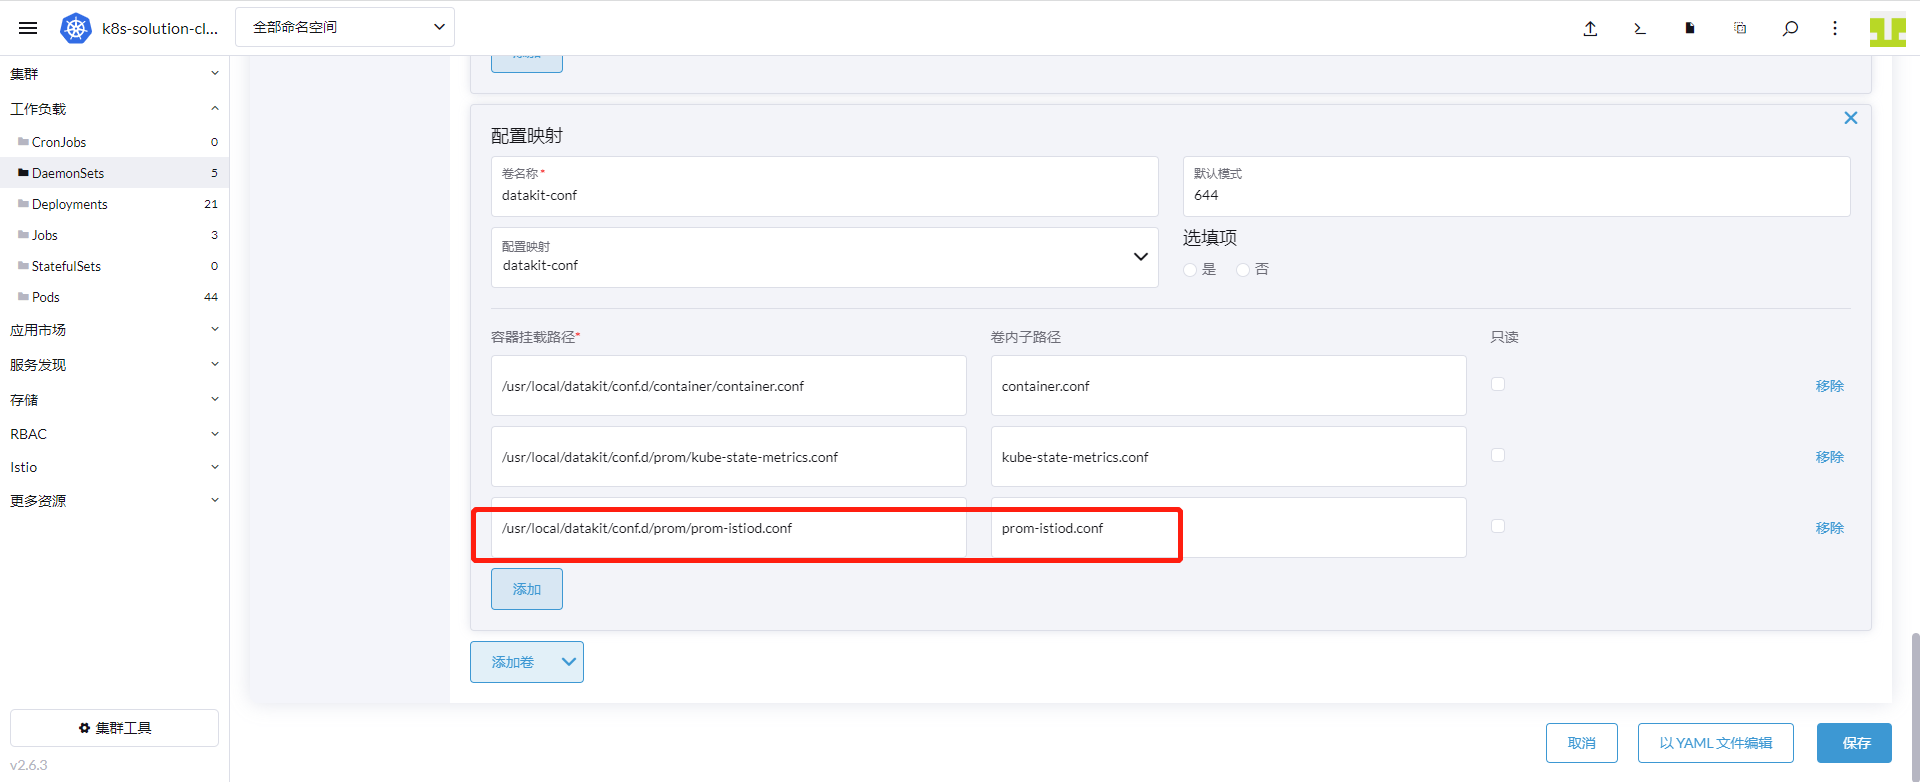
进入「集群」 - 「工作负载」 - 「DaemonSets」,点击 datakit 行的右边,选择「编辑配置」。
点击「存储」,找到卷名称是“datakit-conf”的配置映射,点击「添加」。输入以下内容后,点击「保存」:
- 容器挂载路径填
/usr/local/datakit/conf.d/prom/prom-istiod.conf - 卷内子路径输入
prom-istiod.conf
3.4 开启 ingressgateway 和 egressgateway 采集器
采集 ingressgateway 和 egressgateway 使用 Service 来访问 15020 端口,所以需要新建 ingressgateway 和 egressgateway 的 Service。
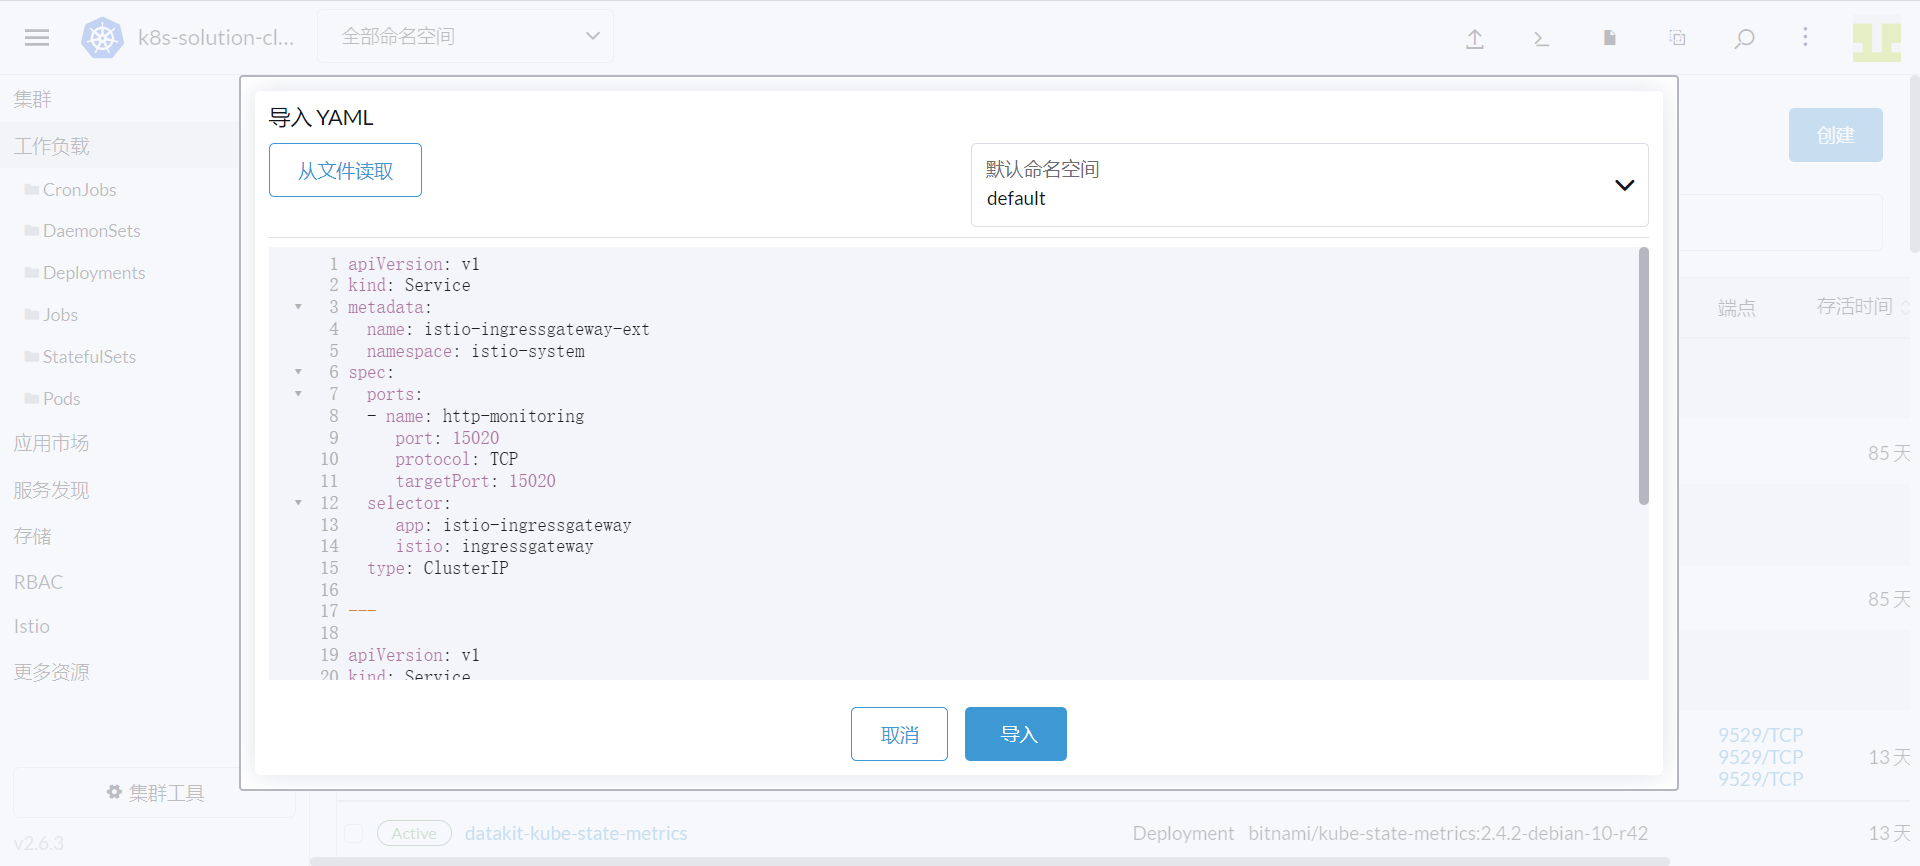
登录「Rancher」 - 「集群」,点击上方的「导入 YAML」图标,输入下面的内容,点击「导入」即完成 Service 的创建。
apiVersion: v1
kind: Service
metadata:
  name: istio-ingressgateway-ext
  namespace: istio-system
spec:
  ports:
    - name: http-monitoring
      port: 15020
      protocol: TCP
      targetPort: 15020
  selector:
    app: istio-ingressgateway
    istio: ingressgateway
  type: ClusterIP

---
apiVersion: v1
kind: Service
metadata:
  name: istio-egressgateway-ext
  namespace: istio-system
spec:
  ports:
    - name: http-monitoring
      port: 15020
      protocol: TCP
      targetPort: 15020
  selector:
    app: istio-egressgateway
    istio: egressgateway
  type: ClusterIP
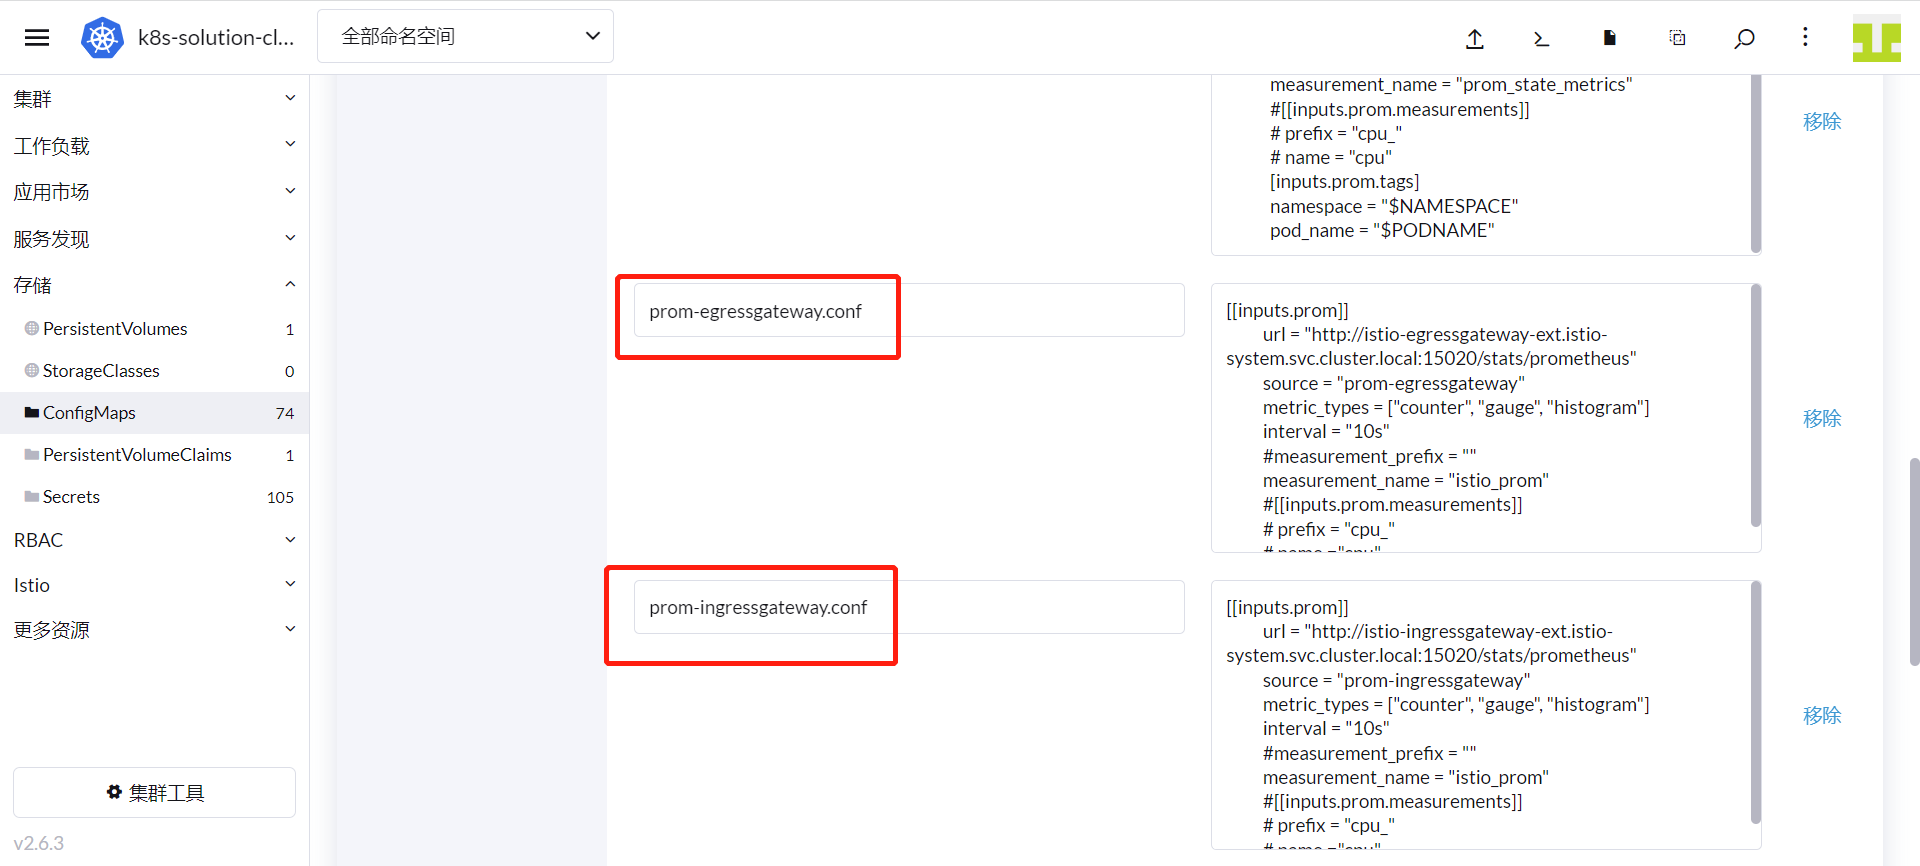
登录「Rancher」 - 「集群」 - 「存储」 - 「ConfigMaps」,找到 datakit-conf,点击「编辑配置」。
点击「添加」,键分别输入「prom-ingressgateway.conf」和 「prom-egressgateway.conf」,值参考如下内容。点击「保存」。
#### ingressgateway
prom-ingressgateway.conf: |-
  [[inputs.prom]]
    url = "http://istio-ingressgateway-ext.istio-system.svc.cluster.local:15020/stats/prometheus"
    source = "prom-ingressgateway"
    metric_types = ["counter", "gauge"]
    interval = "60s"
    tags_ignore = ["cache","cluster_type","component","destination_app","destination_canonical_revision","destination_canonical_service","destination_cluster","destination_principal","group","grpc_code","grpc_method","grpc_service","grpc_type","reason","request_protocol","request_type","resource","responce_code_class","response_flags","source_app","source_canonical_revision","source_canonical-service","source_cluster","source_principal","source_version","wasm_filter"]
    metric_name_filter = ["istio_requests_total","pilot_k8s_cfg_events","istio_build","process_virtual_memory_bytes","process_resident_memory_bytes","process_cpu_seconds_total","envoy_cluster_assignment_stale","go_goroutines","pilot_xds_pushes","pilot_proxy_convergence_time_bucket","citadel_server_root_cert_expiry_timestamp","pilot_conflict_inbound_listener","pilot_conflict_outbound_listener_http_over_current_tcp","pilot_conflict_outbound_listener_tcp_over_current_tcp","pilot_conflict_outbound_listener_tcp_over_current_http","pilot_virt_services","galley_validation_failed","pilot_services","envoy_cluster_upstream_cx_total","envoy_cluster_upstream_cx_connect_fail","envoy_cluster_upstream_cx_active","envoy_cluster_upstream_cx_rx_bytes_total","envoy_cluster_upstream_cx_tx_bytes_total","istio_request_duration_milliseconds_bucket","istio_request_duration_seconds_bucket","istio_request_bytes_bucket","istio_response_bytes_bucket"]
    #measurement_prefix = ""
    measurement_name = "istio_prom"
    #[[inputs.prom.measurements]]
    # prefix = "cpu_"
    # name ="cpu"
#### egressgateway
prom-egressgateway.conf: |-
  [[inputs.prom]]
    url = "http://istio-egressgateway-ext.istio-system.svc.cluster.local:15020/stats/prometheus"
    source = "prom-egressgateway"
    metric_types = ["counter", "gauge"]
    interval = "60s"
    tags_ignore = ["cache","cluster_type","component","destination_app","destination_canonical_revision","destination_canonical_service","destination_cluster","destination_principal","group","grpc_code","grpc_method","grpc_service","grpc_type","reason","request_protocol","request_type","resource","responce_code_class","response_flags","source_app","source_canonical_revision","source_canonical-service","source_cluster","source_principal","source_version","wasm_filter"]
    metric_name_filter = ["istio_requests_total","pilot_k8s_cfg_events","istio_build","process_virtual_memory_bytes","process_resident_memory_bytes","process_cpu_seconds_total","envoy_cluster_assignment_stale","go_goroutines","pilot_xds_pushes","pilot_proxy_convergence_time_bucket","citadel_server_root_cert_expiry_timestamp","pilot_conflict_inbound_listener","pilot_conflict_outbound_listener_http_over_current_tcp","pilot_conflict_outbound_listener_tcp_over_current_tcp","pilot_conflict_outbound_listener_tcp_over_current_http","pilot_virt_services","galley_validation_failed","pilot_services","envoy_cluster_upstream_cx_total","envoy_cluster_upstream_cx_connect_fail","envoy_cluster_upstream_cx_active","envoy_cluster_upstream_cx_rx_bytes_total","envoy_cluster_upstream_cx_tx_bytes_total","istio_request_duration_milliseconds_bucket","istio_request_duration_seconds_bucket","istio_request_bytes_bucket","istio_response_bytes_bucket"]
    #measurement_prefix = ""
    measurement_name = "istio_prom"
    #[[inputs.prom.measurements]]
    # prefix = "cpu_"
    # name ="cpu"
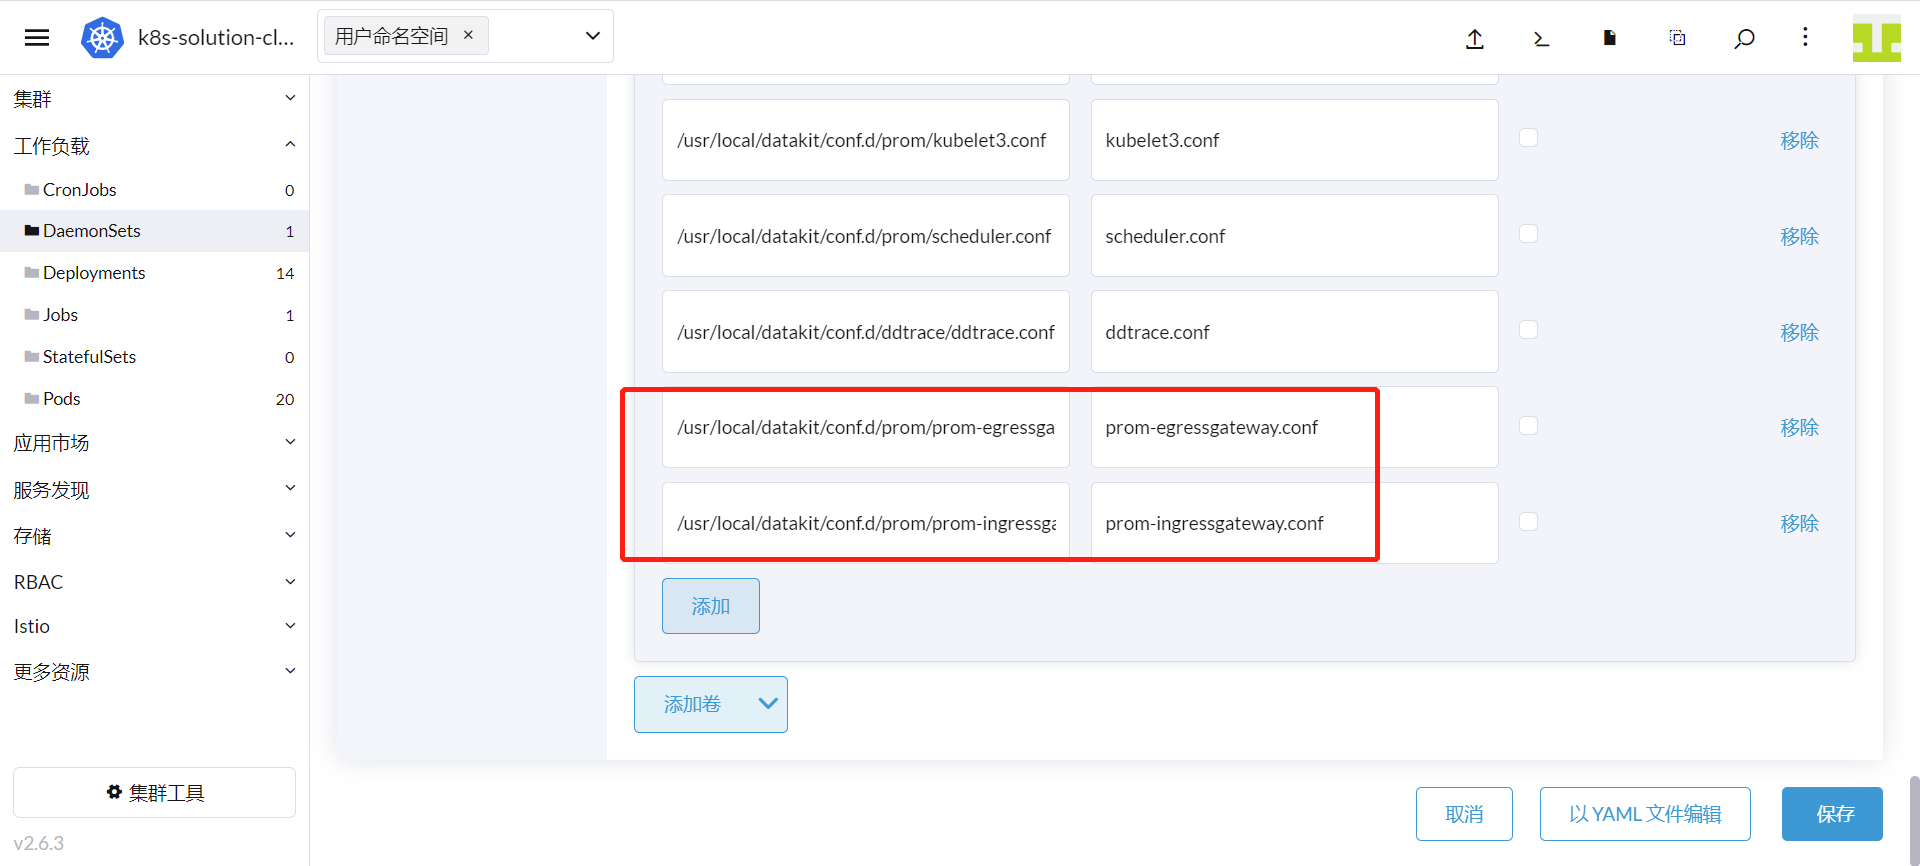
进入「集群」 - 「工作负载」 - 「DaemonSets」,点击 datakit 行的右边,选择「编辑配置」。
点击「存储」,找到卷名称是“datakit-conf”的配置映射,添加2次内容并保存:
第1次点击「添加」,输入以下内容后,点击「保存」:
- 容器挂载路径填
/usr/local/datakit/conf.d/prom/prom-ingressgateway.conf - 卷内子路径输入
prom-ingressgateway.conf
第2次点击「添加」,输入以下内容后,点击「保存」:
- 容器挂载路径填
/usr/local/datakit/conf.d/prom/prom-egressgateway.conf - 卷内子路径输入
prom-egressgateway.conf
3.5 开启 Zipkin 采集器
登录「Rancher」 - 「集群」 - 「存储」 - 「ConfigMaps」,找到 datakit-conf,点击「编辑配置」。

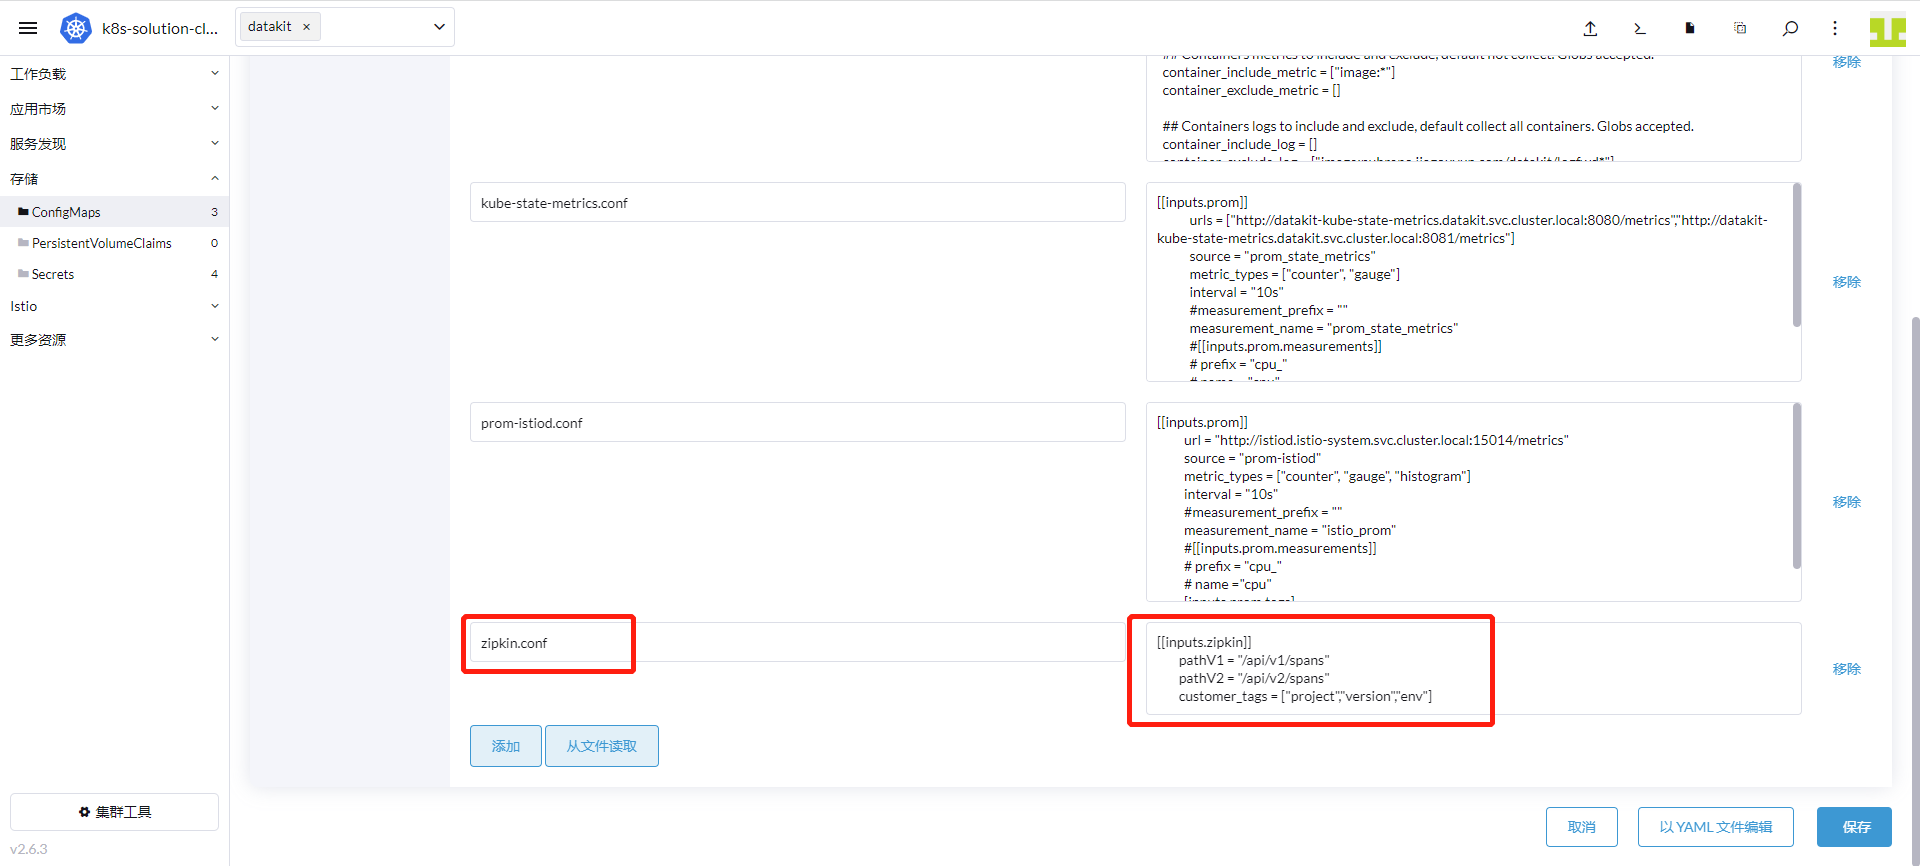
点击「添加」,键输入「zipkin.conf」,值输入如下内容。点击「保存」。
      [[inputs.zipkin]]
        pathV1 = "/api/v1/spans"
        pathV2 = "/api/v2/spans"
        customer_tags = ["project","version","env"]
进入「集群」 - 「工作负载」 - 「DaemonSets」,点击 datakit 行的右边,选择「编辑配置」。 点击「存储」,找到卷名称是“datakit-conf”的配置映射,点击「添加」,输入以下内容后,点击「保存」:
- 容器挂载路径填
/usr/local/datakit/conf.d/zipkin/zipkin.conf - 卷内子路径输入
zipkin.conf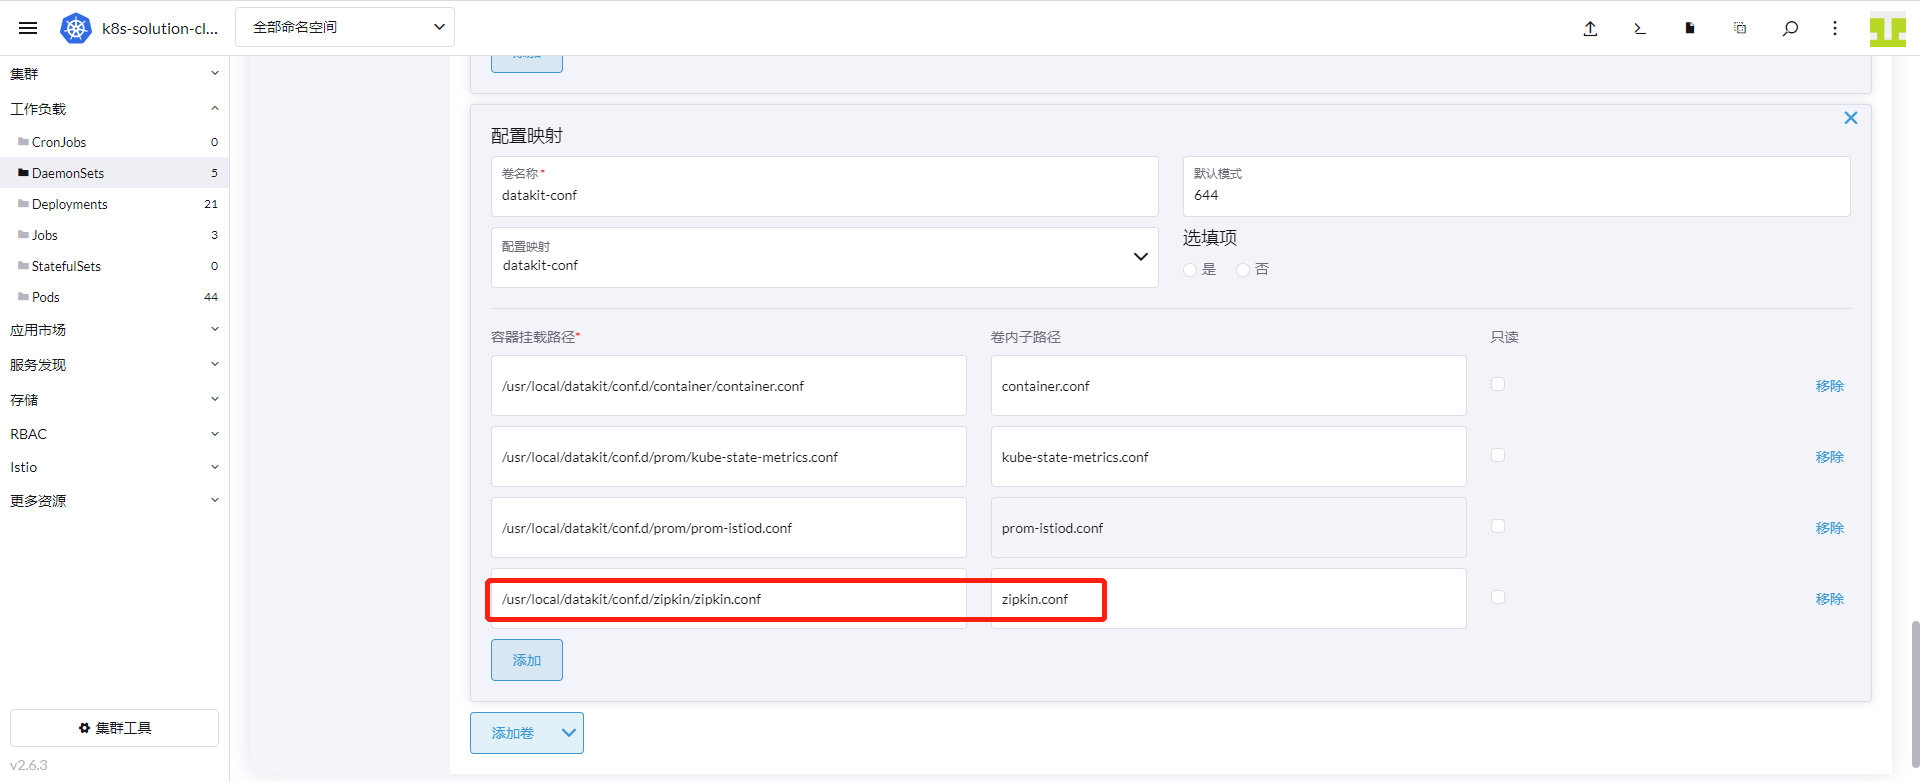
3.6 映射 DataKit 服务
在 Kubernets 集群中,以 DaemonSet 方式部署 DataKit 后,如果存在部署的某一应用以前是推送链路数据到 istio-system 名称空间的 zipkin 服务,端口是 9411,即访问地址是 zipkin.istio-system.svc.cluster.local:9411,这时就需要用到了 Kubernetes 的 ExternalName 服务类型。
先定义一个 ClusterIP 的 服务类型,把 9529 端口转成 9411,然后使用 ExternalName 的服务将 ClusterIP 的服务映射成 DNS 的名称。通过这两步转换,应用就可以与 DataKit 打通了。
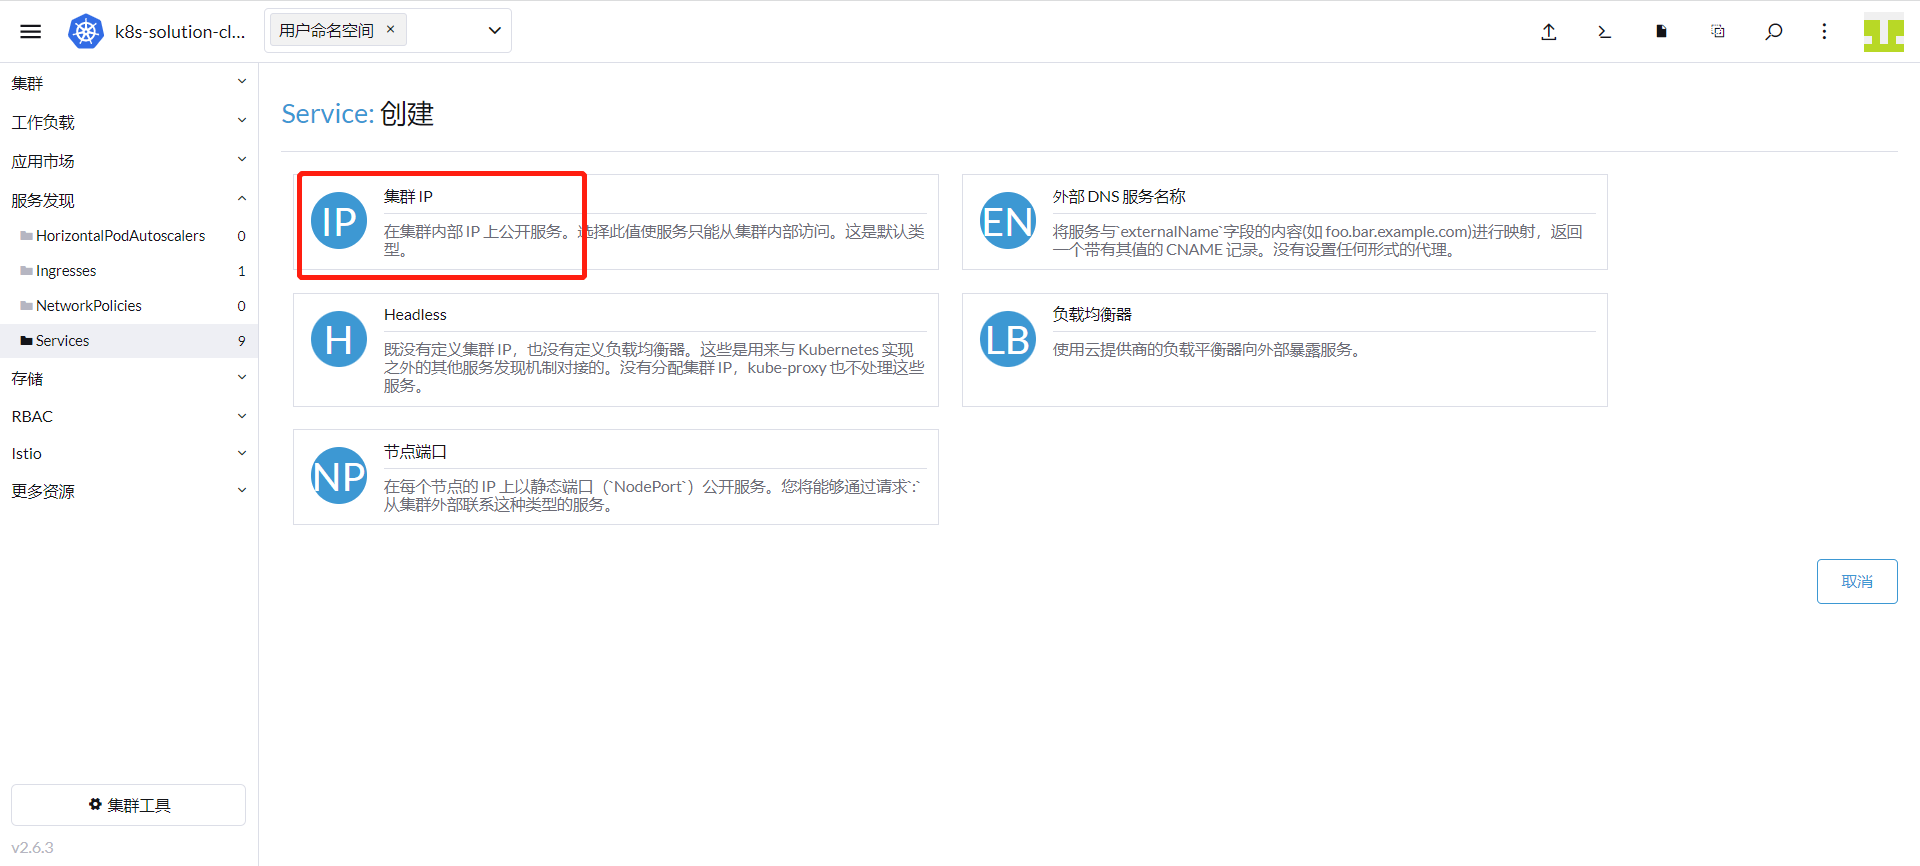
1、 定义 Cluster IP 服务
登录「Rancher」 - 「集群」 - 「服务发现」 - 「Service」,点击「创建」- 选择「集群 IP」。
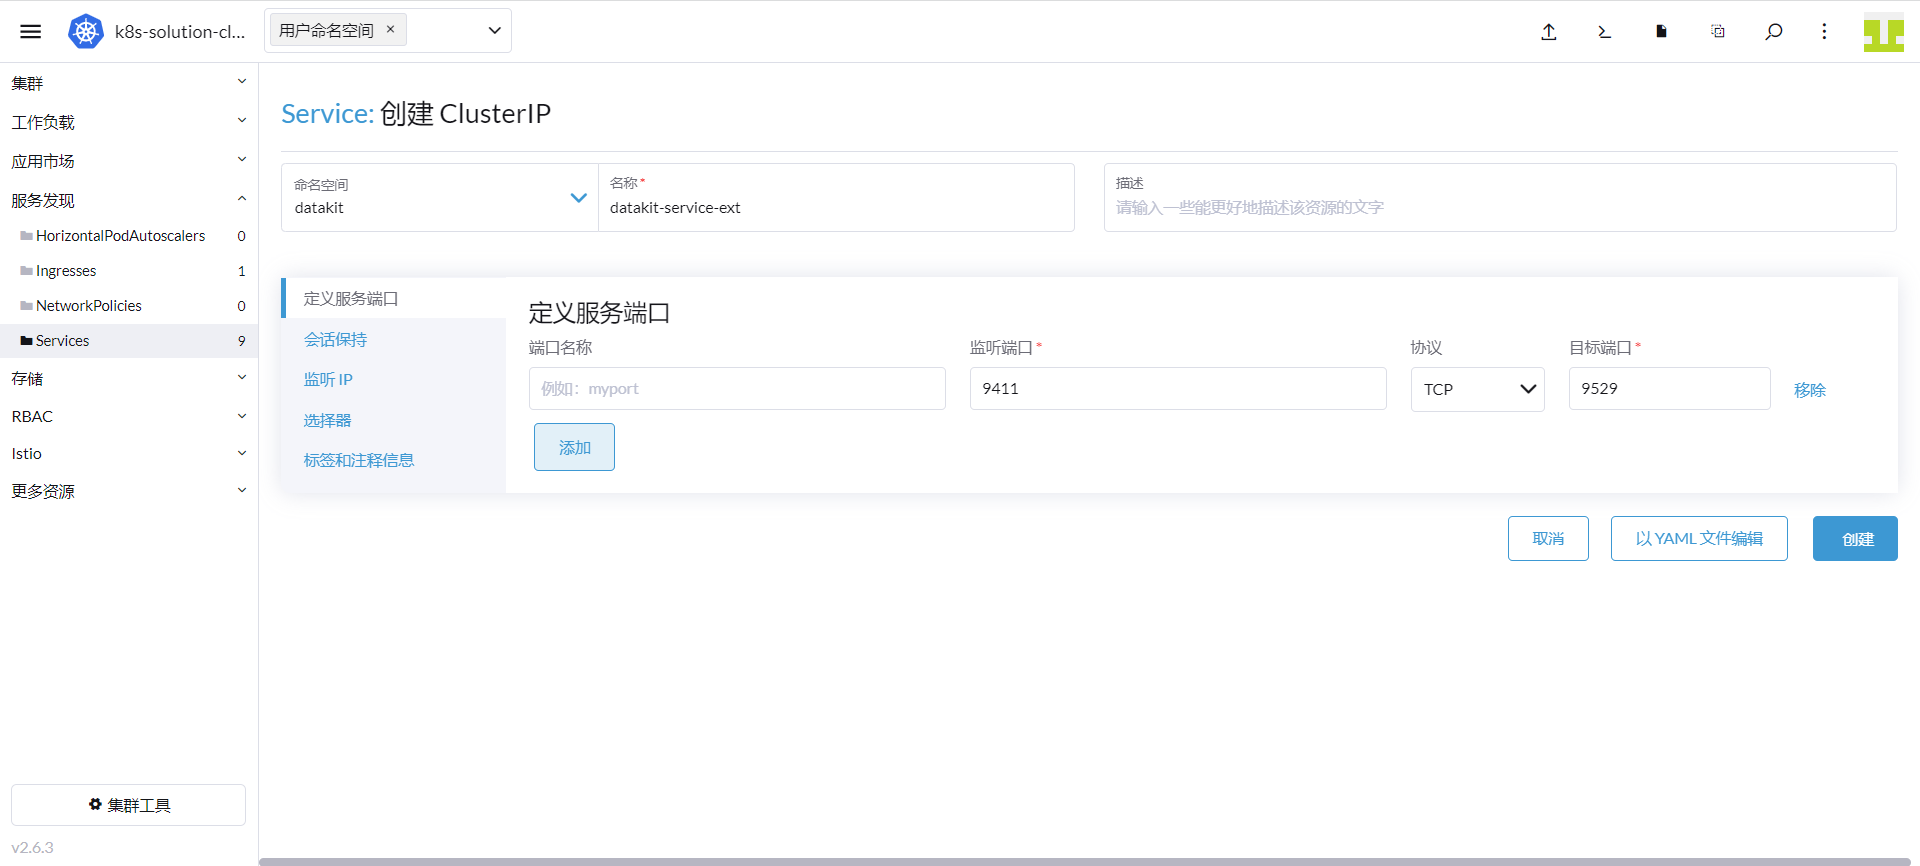
命名空间输入「datakit」,名称输入「datakit-service-ext」,监听端口输入「9411」,目标端口输入「9529」。
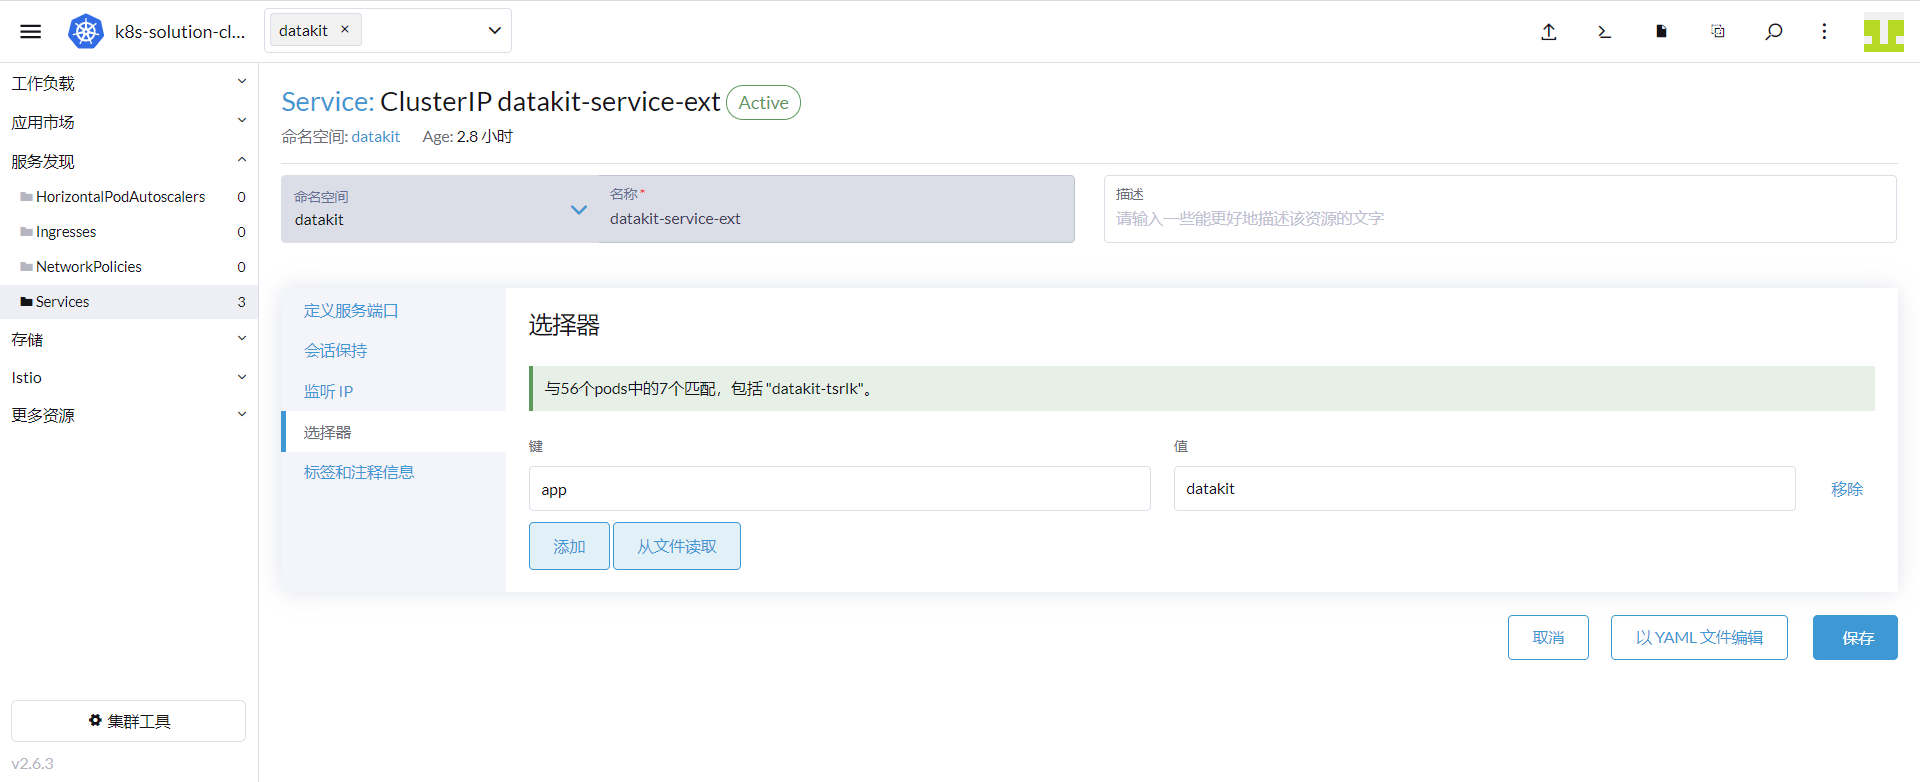
点击「选择器」,键输入「app」,值输入「datakit」,点击「保存」。
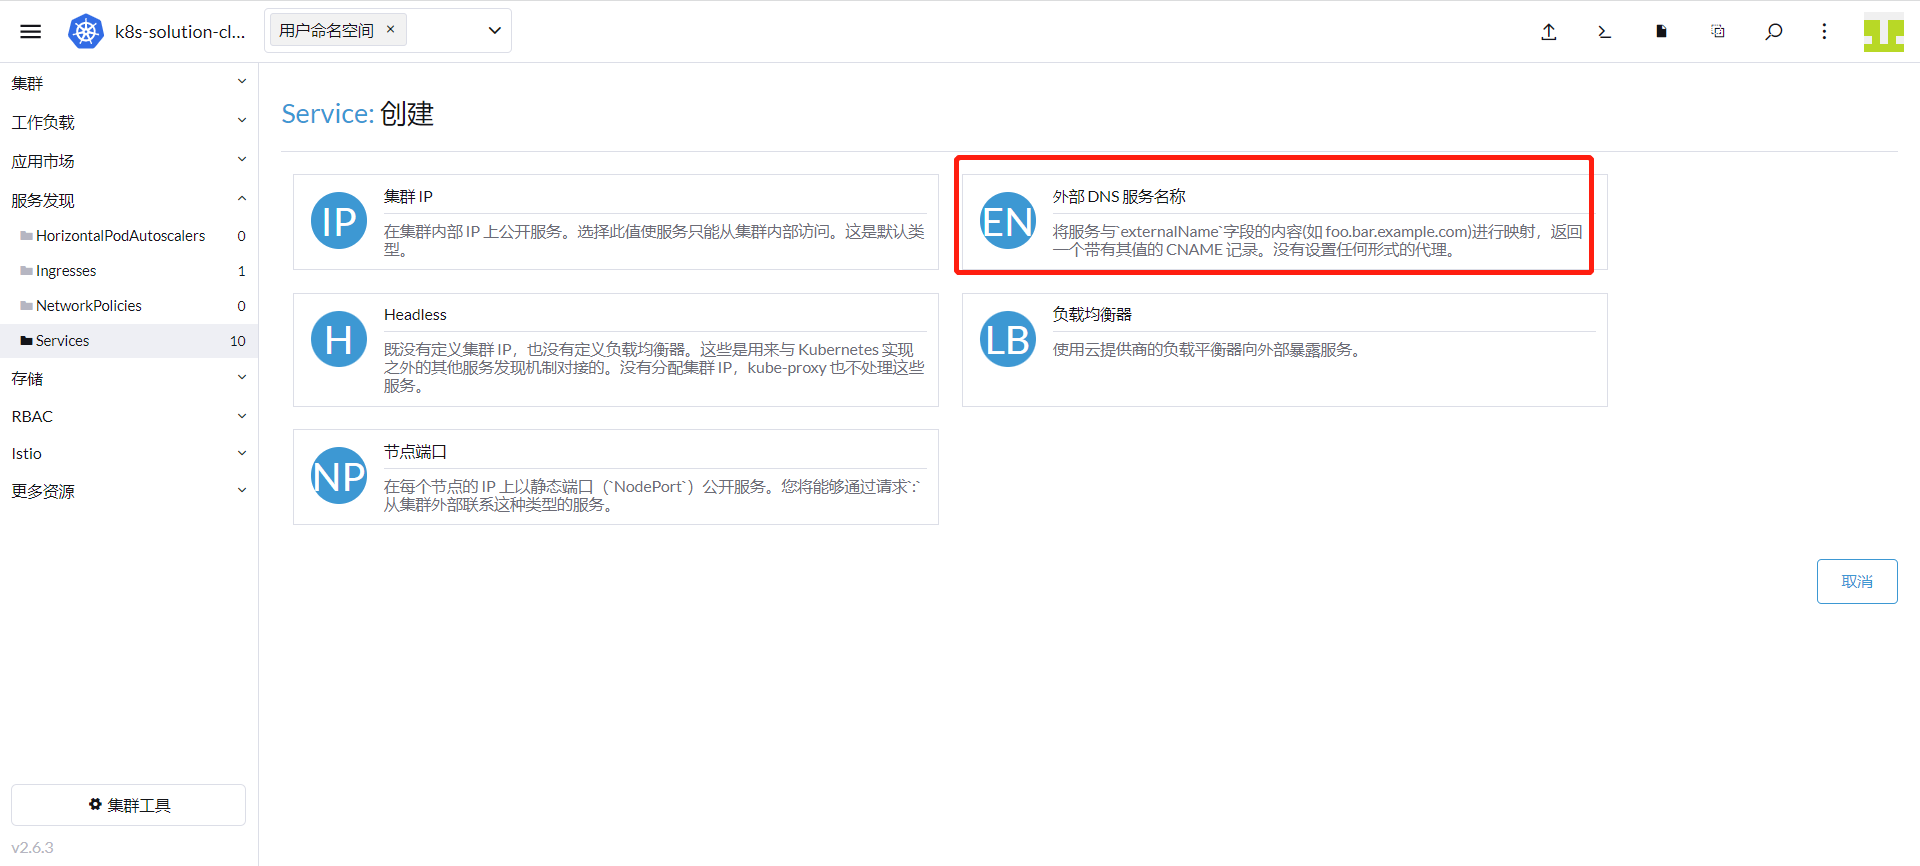
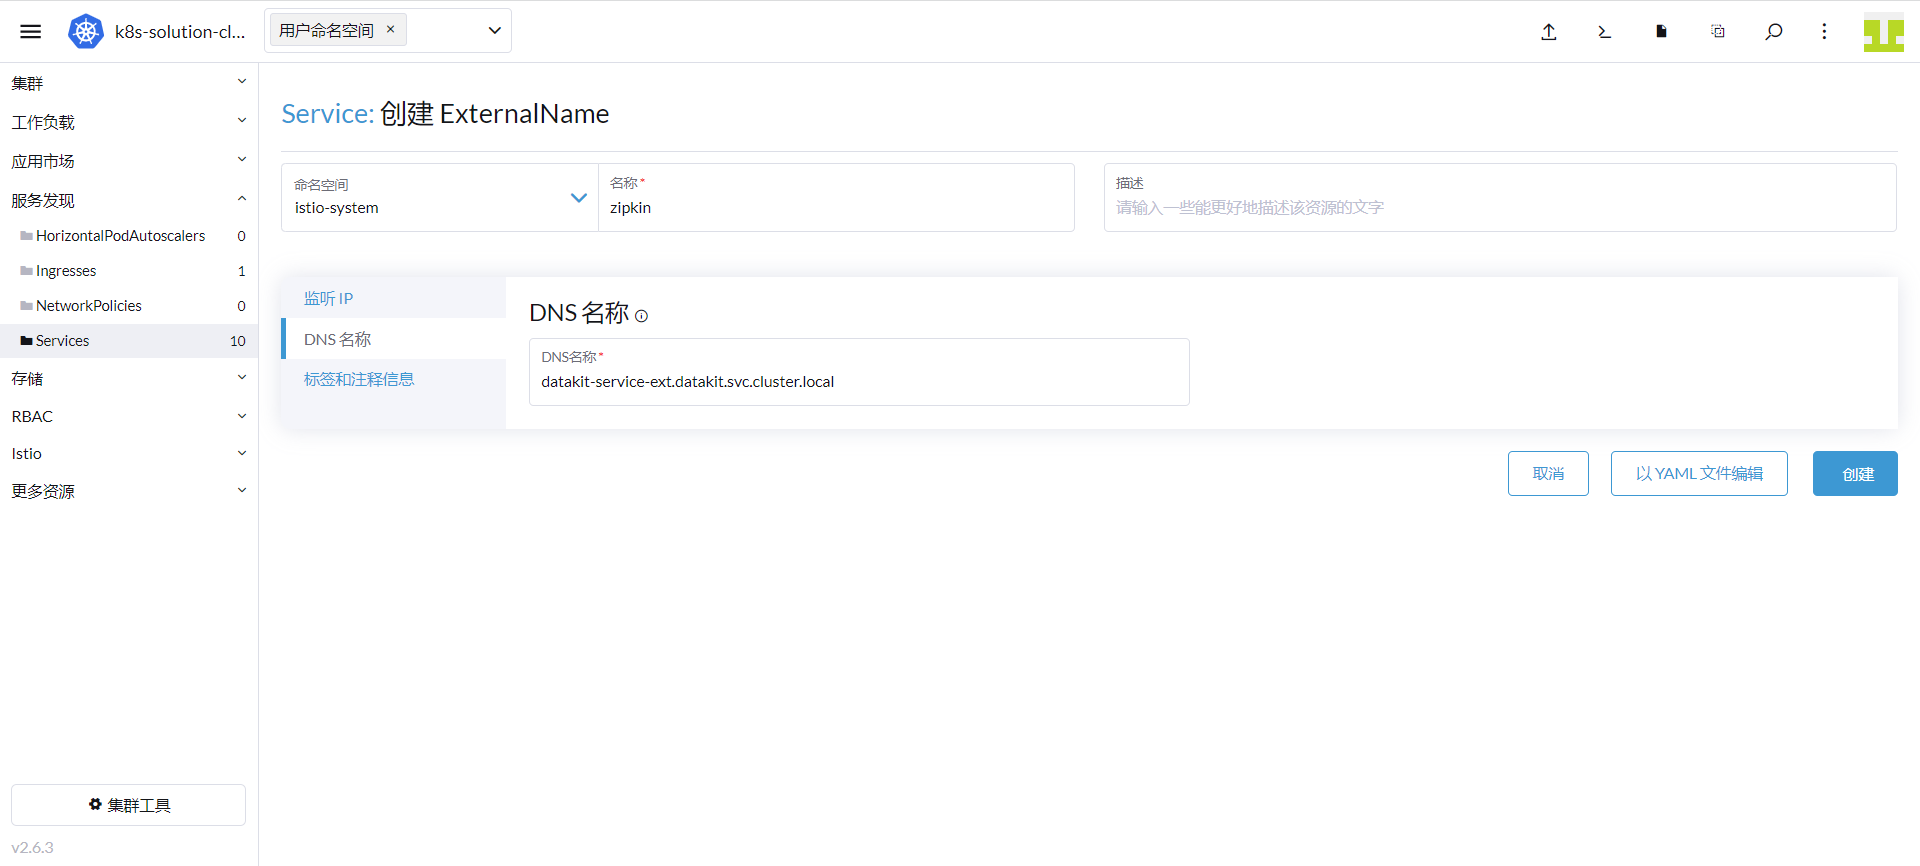
2、 定义 ExternalName 的服务
「集群」 - 「服务发现」 - 「Service」,点击「创建」- 选择「外部 DNS 服务名称」。
名称空间输入「istio-system」,名称输入「zipkin」,DNS 名称输入「datakit-service-ext.datakit.svc.cluster.local」,点击「创建」。
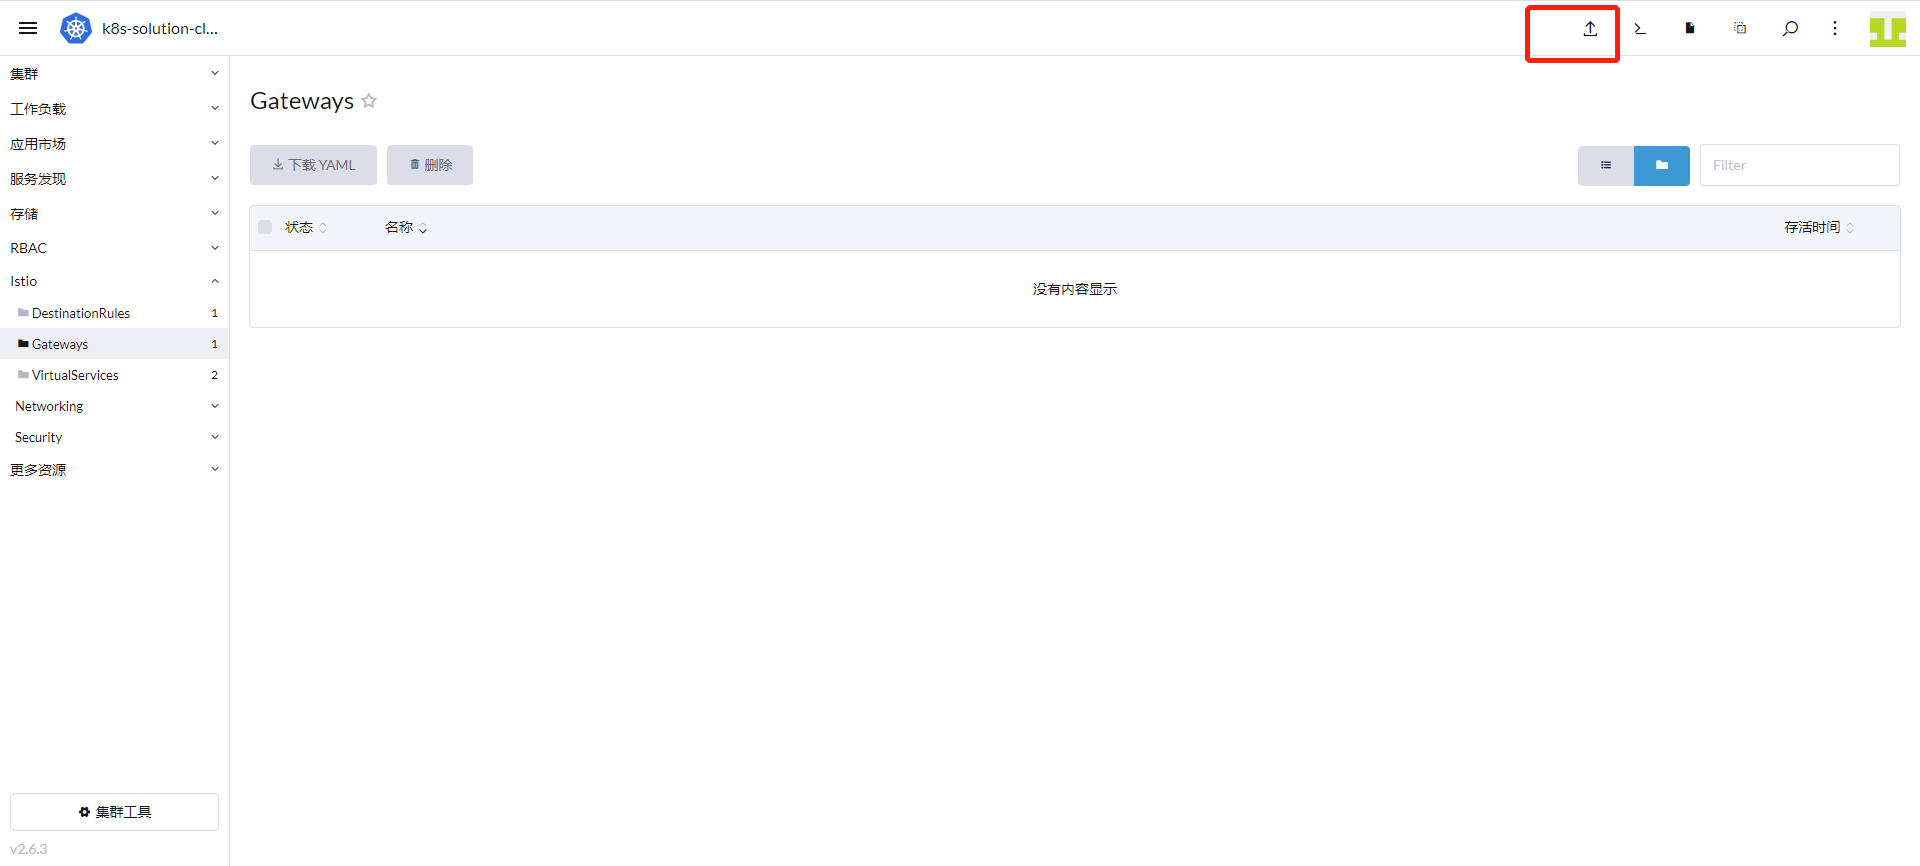
3.7 创建 Gateway 资源
登录「Rancher」 - 「集群」 - 「Istio」 - 「Gateways」,点击上方的「导入 YAML」图标。
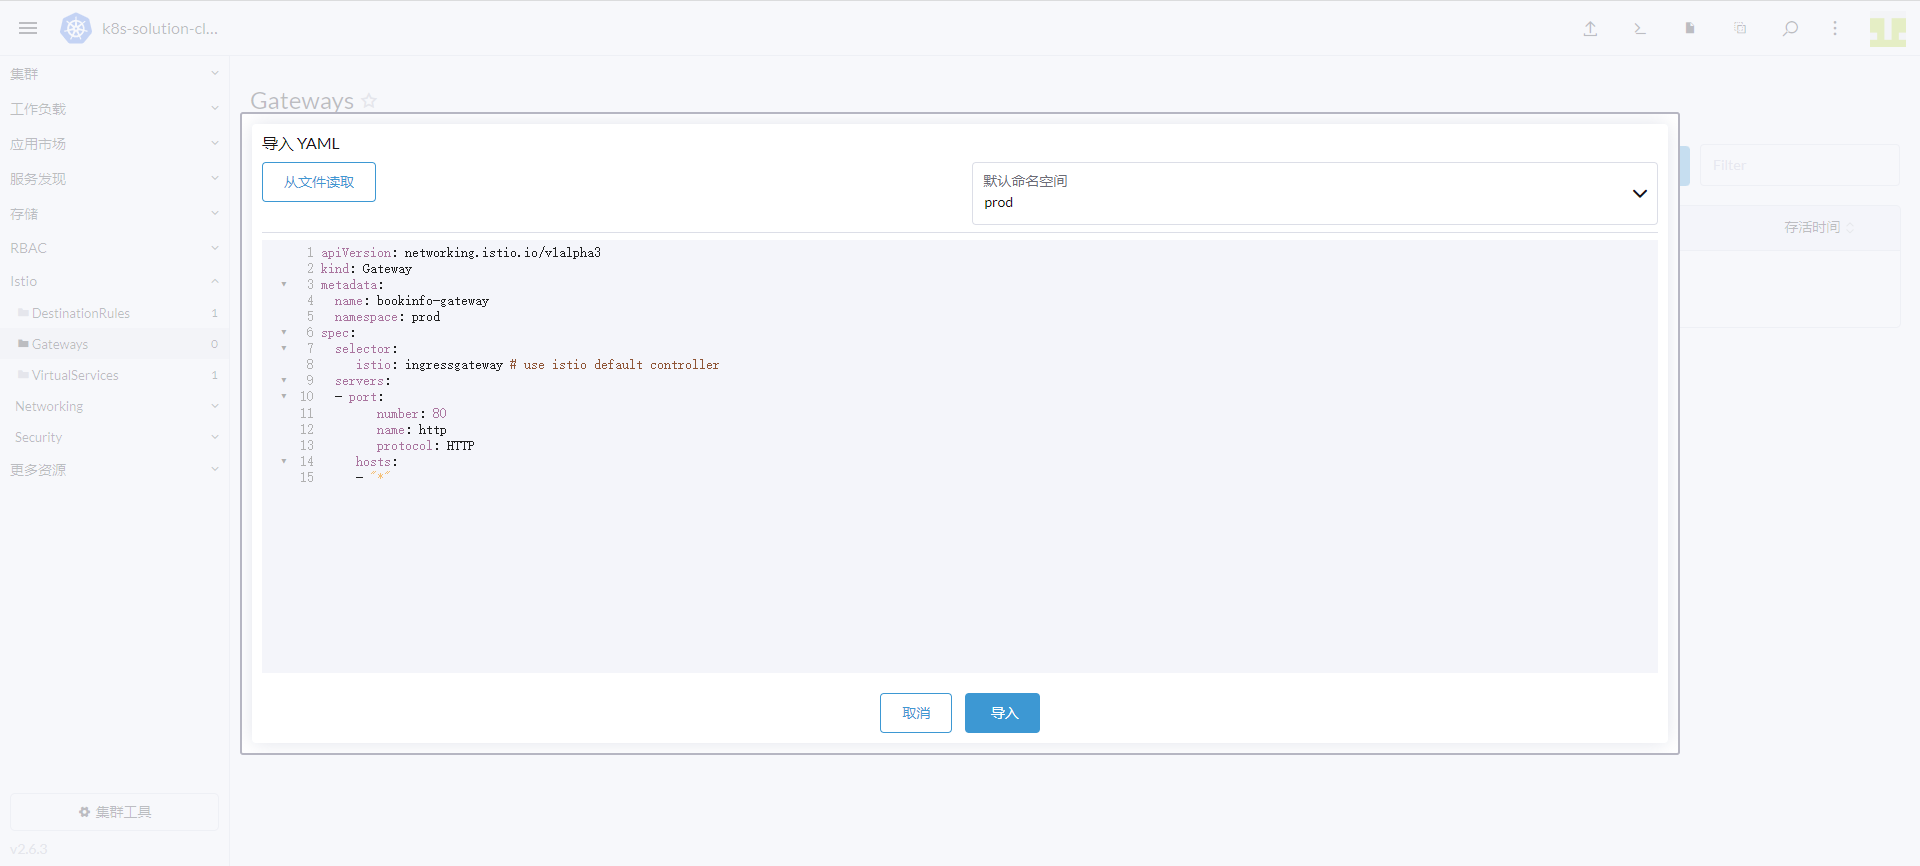
命名空间输入「prod」,输入如下内容,点击「导入」。
apiVersion: networking.istio.io/v1alpha3
kind: Gateway
metadata:
  name: bookinfo-gateway
  namespace: prod
spec:
  selector:
    istio: ingressgateway # use istio default controller
  servers:
    - port:
        number: 80
        name: http
        protocol: HTTP
      hosts:
        - "*"
3.8 创建虚拟服务
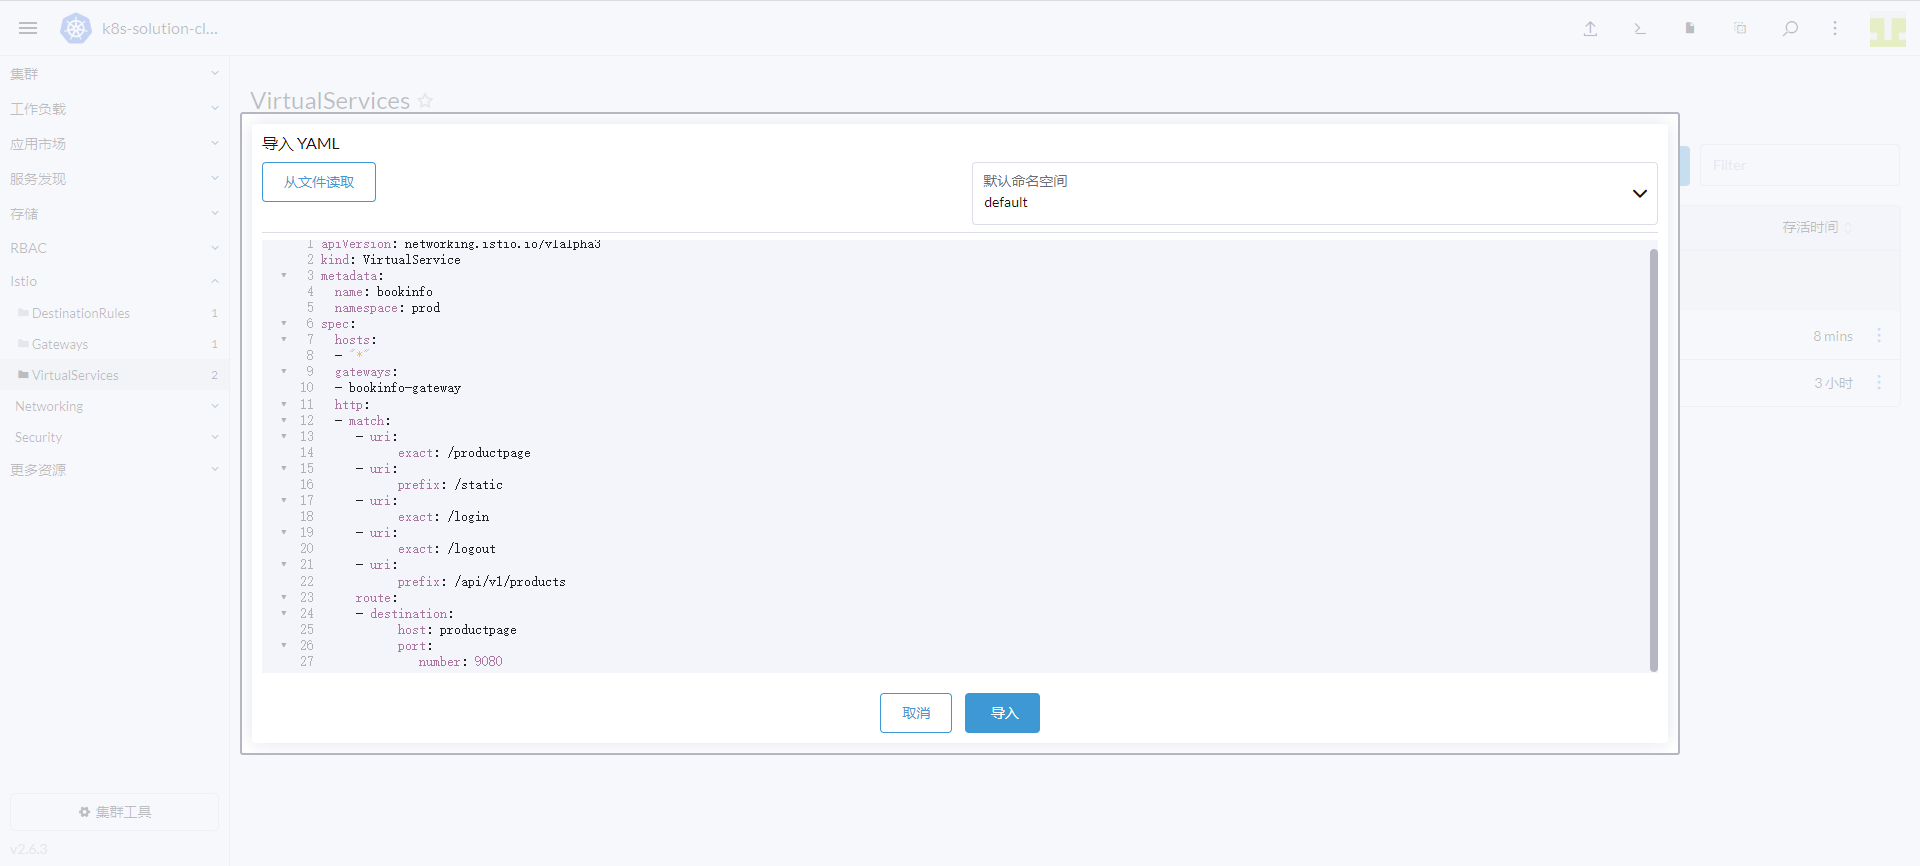
登录「Rancher」 - 「集群」 - 「Istio」 - 「VirtualServices」,点击上方的「导入 YAML」图标。
命名空间输入「prod」,输入如下内容,点击「导入」。
apiVersion: networking.istio.io/v1alpha3
kind: VirtualService
metadata:
  name: bookinfo
  namespace: prod
spec:
  hosts:
    - "*"
  gateways:
    - bookinfo-gateway
  http:
    - match:
        - uri:
            exact: /productpage
        - uri:
            prefix: /static
        - uri:
            exact: /login
        - uri:
            exact: /logout
        - uri:
            prefix: /api/v1/products
      route:
        - destination:
            host: productpage
            port:
              number: 9080
3.9 创建 productpage、details、ratings
这里使用为 Pod 增加 annotations 来采集 Pod 的指标,增加的内容如下所示。
annotations:
  datakit/prom.instances: |
    [[inputs.prom]]
      url = "http://$IP:15020/stats/prometheus"
      source = "bookinfo-istio-product"
      metric_types = ["counter", "gauge"]
      interval = "60s"
      tags_ignore = ["cache","cluster_type","component","destination_app","destination_canonical_revision","destination_canonical_service","destination_cluster","destination_principal","group","grpc_code","grpc_method","grpc_service","grpc_type","reason","request_protocol","request_type","resource","responce_code_class","response_flags","source_app","source_canonical_revision","source_canonical-service","source_cluster","source_principal","source_version","wasm_filter"]
      metric_name_filter = ["istio_requests_total","pilot_k8s_cfg_events","istio_build","process_virtual_memory_bytes","process_resident_memory_bytes","process_cpu_seconds_total","envoy_cluster_assignment_stale","go_goroutines","pilot_xds_pushes","pilot_proxy_convergence_time_bucket","citadel_server_root_cert_expiry_timestamp","pilot_conflict_inbound_listener","pilot_conflict_outbound_listener_http_over_current_tcp","pilot_conflict_outbound_listener_tcp_over_current_tcp","pilot_conflict_outbound_listener_tcp_over_current_http","pilot_virt_services","galley_validation_failed","pilot_services","envoy_cluster_upstream_cx_total","envoy_cluster_upstream_cx_connect_fail","envoy_cluster_upstream_cx_active","envoy_cluster_upstream_cx_rx_bytes_total","envoy_cluster_upstream_cx_tx_bytes_total","istio_request_duration_milliseconds_bucket","istio_request_duration_seconds_bucket","istio_request_bytes_bucket","istio_response_bytes_bucket"]
      #measurement_prefix = ""
      measurement_name = "istio_prom"
      #[[inputs.prom.measurements]]
      # prefix = "cpu_"
      # name = "cpu"
      [inputs.prom.tags]
      namespace = "$NAMESPACE"
  proxy.istio.io/config: |
    tracing:
      zipkin:
        address: zipkin.istio-system:9411
      custom_tags:
        project:
          literal:
            value: "productpage"
        version:
          literal:
            value: "v1"
        env:
          literal:
            value: "test"
参数说明
- url:Exporter 地址
- source:采集器名称
- metric_types:指标类型过滤
- measurement_name:采集后的指标集名称
- interval:采集指标频率,s 秒
- $IP:通配 Pod 的内网 IP
- $NAMESPACE:Pod 所在命名空间
- tags_ignore: 忽略的 tag。
下面是 productpage、details、ratings 的完整部署文件。
完整部署文件
##################################################################################################
# Details service
##################################################################################################
apiVersion: v1
kind: Service
metadata:
  name: details
  namespace: prod
  labels:
    app: details
    service: details
spec:
  ports:
  - port: 9080
    name: http
  selector:
    app: details
---
apiVersion: v1
kind: ServiceAccount
metadata:
  name: bookinfo-details
  namespace: prod
  labels:
    account: details
---
apiVersion: apps/v1
kind: Deployment
metadata:
  name: details-v1
  namespace: prod
  labels:
    app: details
    version: v1
spec:
  replicas: 1
  selector:
    matchLabels:
      app: details
      version: v1
  template:
    metadata:
      labels:
        app: details
        version: v1
      annotations:
        datakit/prom.instances: |
          [[inputs.prom]]
            url = "http://$IP:15020/stats/prometheus"
            source = "bookinfo-istio-details"
            metric_types = ["counter", "gauge"]
            interval = "60s"
      tags_ignore = ["cache","cluster_type","component","destination_app","destination_canonical_revision","destination_canonical_service","destination_cluster","destination_principal","group","grpc_code","grpc_method","grpc_service","grpc_type","reason","request_protocol","request_type","resource","responce_code_class","response_flags","source_app","source_canonical_revision","source_canonical-service","source_cluster","source_principal","source_version","wasm_filter"]
            metric_name_filter = ["istio_requests_total","pilot_k8s_cfg_events","istio_build","process_virtual_memory_bytes","process_resident_memory_bytes","process_cpu_seconds_total","envoy_cluster_assignment_stale","go_goroutines","pilot_xds_pushes","pilot_proxy_convergence_time_bucket","citadel_server_root_cert_expiry_timestamp","pilot_conflict_inbound_listener","pilot_conflict_outbound_listener_http_over_current_tcp","pilot_conflict_outbound_listener_tcp_over_current_tcp","pilot_conflict_outbound_listener_tcp_over_current_http","pilot_virt_services","galley_validation_failed","pilot_services","envoy_cluster_upstream_cx_total","envoy_cluster_upstream_cx_connect_fail","envoy_cluster_upstream_cx_active","envoy_cluster_upstream_cx_rx_bytes_total","envoy_cluster_upstream_cx_tx_bytes_total","istio_request_duration_milliseconds_bucket","istio_request_duration_seconds_bucket","istio_request_bytes_bucket","istio_response_bytes_bucket"]
            #measurement_prefix = ""
            measurement_name = "istio_prom"
            #[[inputs.prom.measurements]]
            # prefix = "cpu_"
            # name = "cpu"
            [inputs.prom.tags]
            namespace = "$NAMESPACE"
        proxy.istio.io/config: |
          tracing:
            zipkin:
              address: zipkin.istio-system:9411
            custom_tags:
              project:
                literal:
                  value: "details"
              version:
                literal:
                  value: "v1"
              env:
                literal:
                  value: "test"
    spec:
      serviceAccountName: bookinfo-details
      containers:
      - name: details
        image: docker.io/istio/examples-bookinfo-details-v1:1.16.2
        imagePullPolicy: IfNotPresent
        ports:
        - containerPort: 9080
        securityContext:
          runAsUser: 1000
---
##################################################################################################
# Ratings service
##################################################################################################
apiVersion: v1
kind: Service
metadata:
  name: ratings
  namespace: prod
  labels:
    app: ratings
    service: ratings
spec:
  ports:
  - port: 9080
    name: http
  selector:
    app: ratings
---
apiVersion: v1
kind: ServiceAccount
metadata:
  name: bookinfo-ratings
  namespace: prod
  labels:
    account: ratings
---
apiVersion: apps/v1
kind: Deployment
metadata:
  name: ratings-v1
  namespace: prod
  labels:
    app: ratings
    version: v1
spec:
  replicas: 1
  selector:
    matchLabels:
      app: ratings
      version: v1
  template:
    metadata:
      labels:
        app: ratings
        version: v1
      annotations:
        datakit/prom.instances: |
          [[inputs.prom]]
            url = "http://$IP:15020/stats/prometheus"
            source = "bookinfo-istio-ratings"
            metric_types = ["counter", "gauge"]
            interval = "60s"
      tags_ignore = ["cache","cluster_type","component","destination_app","destination_canonical_revision","destination_canonical_service","destination_cluster","destination_principal","group","grpc_code","grpc_method","grpc_service","grpc_type","reason","request_protocol","request_type","resource","responce_code_class","response_flags","source_app","source_canonical_revision","source_canonical-service","source_cluster","source_principal","source_version","wasm_filter"]
            metric_name_filter = ["istio_requests_total","pilot_k8s_cfg_events","istio_build","process_virtual_memory_bytes","process_resident_memory_bytes","process_cpu_seconds_total","envoy_cluster_assignment_stale","go_goroutines","pilot_xds_pushes","pilot_proxy_convergence_time_bucket","citadel_server_root_cert_expiry_timestamp","pilot_conflict_inbound_listener","pilot_conflict_outbound_listener_http_over_current_tcp","pilot_conflict_outbound_listener_tcp_over_current_tcp","pilot_conflict_outbound_listener_tcp_over_current_http","pilot_virt_services","galley_validation_failed","pilot_services","envoy_cluster_upstream_cx_total","envoy_cluster_upstream_cx_connect_fail","envoy_cluster_upstream_cx_active","envoy_cluster_upstream_cx_rx_bytes_total","envoy_cluster_upstream_cx_tx_bytes_total","istio_request_duration_milliseconds_bucket","istio_request_duration_seconds_bucket","istio_request_bytes_bucket","istio_response_bytes_bucket"]
            #measurement_prefix = ""
            measurement_name = "istio_prom"
            #[[inputs.prom.measurements]]
            # prefix = "cpu_"
            # name = "cpu"
            [inputs.prom.tags]
            namespace = "$NAMESPACE"
        proxy.istio.io/config: |
          tracing:
            zipkin:
              address: zipkin.istio-system:9411
            custom_tags:
              project:
                literal:
                  value: "ratings"
              version:
                literal:
                  value: "v1"
              env:
                literal:
                  value: "test"
    spec:
      serviceAccountName: bookinfo-ratings
      containers:
      - name: ratings
        image: docker.io/istio/examples-bookinfo-ratings-v1:1.16.2
        imagePullPolicy: IfNotPresent
        ports:
        - containerPort: 9080
        securityContext:
          runAsUser: 1000
---
##################################################################################################
# Productpage services
##################################################################################################
apiVersion: v1
kind: Service
metadata:
  name: productpage
  namespace: prod
  labels:
    app: productpage
    service: productpage
spec:
  ports:
  - port: 9080
    name: http
  selector:
    app: productpage
---
apiVersion: v1
kind: ServiceAccount
metadata:
  name: bookinfo-productpage
  namespace: prod
  labels:
    account: productpage
---
apiVersion: apps/v1
kind: Deployment
metadata:
  name: productpage-v1
  namespace: prod
  labels:
    app: productpage
    version: v1
spec:
  replicas: 1
  selector:
    matchLabels:
      app: productpage
      version: v1
  template:
    metadata:
      labels:
        app: productpage
        version: v1
      annotations:
        datakit/prom.instances: |
          [[inputs.prom]]
            url = "http://$IP:15020/stats/prometheus"
            source = "bookinfo-istio-product"
            metric_types = ["counter", "gauge"]
            interval = "60s"
      tags_ignore = ["cache","cluster_type","component","destination_app","destination_canonical_revision","destination_canonical_service","destination_cluster","destination_principal","group","grpc_code","grpc_method","grpc_service","grpc_type","reason","request_protocol","request_type","resource","responce_code_class","response_flags","source_app","source_canonical_revision","source_canonical-service","source_cluster","source_principal","source_version","wasm_filter"]
            metric_name_filter = ["istio_requests_total","pilot_k8s_cfg_events","istio_build","process_virtual_memory_bytes","process_resident_memory_bytes","process_cpu_seconds_total","envoy_cluster_assignment_stale","go_goroutines","pilot_xds_pushes","pilot_proxy_convergence_time_bucket","citadel_server_root_cert_expiry_timestamp","pilot_conflict_inbound_listener","pilot_conflict_outbound_listener_http_over_current_tcp","pilot_conflict_outbound_listener_tcp_over_current_tcp","pilot_conflict_outbound_listener_tcp_over_current_http","pilot_virt_services","galley_validation_failed","pilot_services","envoy_cluster_upstream_cx_total","envoy_cluster_upstream_cx_connect_fail","envoy_cluster_upstream_cx_active","envoy_cluster_upstream_cx_rx_bytes_total","envoy_cluster_upstream_cx_tx_bytes_total","istio_request_duration_milliseconds_bucket","istio_request_duration_seconds_bucket","istio_request_bytes_bucket","istio_response_bytes_bucket"]
            #measurement_prefix = ""
            measurement_name = "istio_prom"
            #[[inputs.prom.measurements]]
            # prefix = "cpu_"
            # name = "cpu"
            [inputs.prom.tags]
            namespace = "$NAMESPACE"
        proxy.istio.io/config: |
          tracing:
            zipkin:
              address: zipkin.istio-system:9411
            custom_tags:
              project:
                literal:
                  value: "productpage"
              version:
                literal:
                  value: "v1"
              env:
                literal:
                  value: "test"
    spec:
      serviceAccountName: bookinfo-productpage
      containers:
      - name: productpage
        image: docker.io/istio/examples-bookinfo-productpage-v1:1.16.2
        imagePullPolicy: IfNotPresent
        ports:
        - containerPort: 9080
        volumeMounts:
        - name: tmp
          mountPath: /tmp
        securityContext:
          runAsUser: 1000
      volumes:
      - name: tmp
        emptyDir: {}
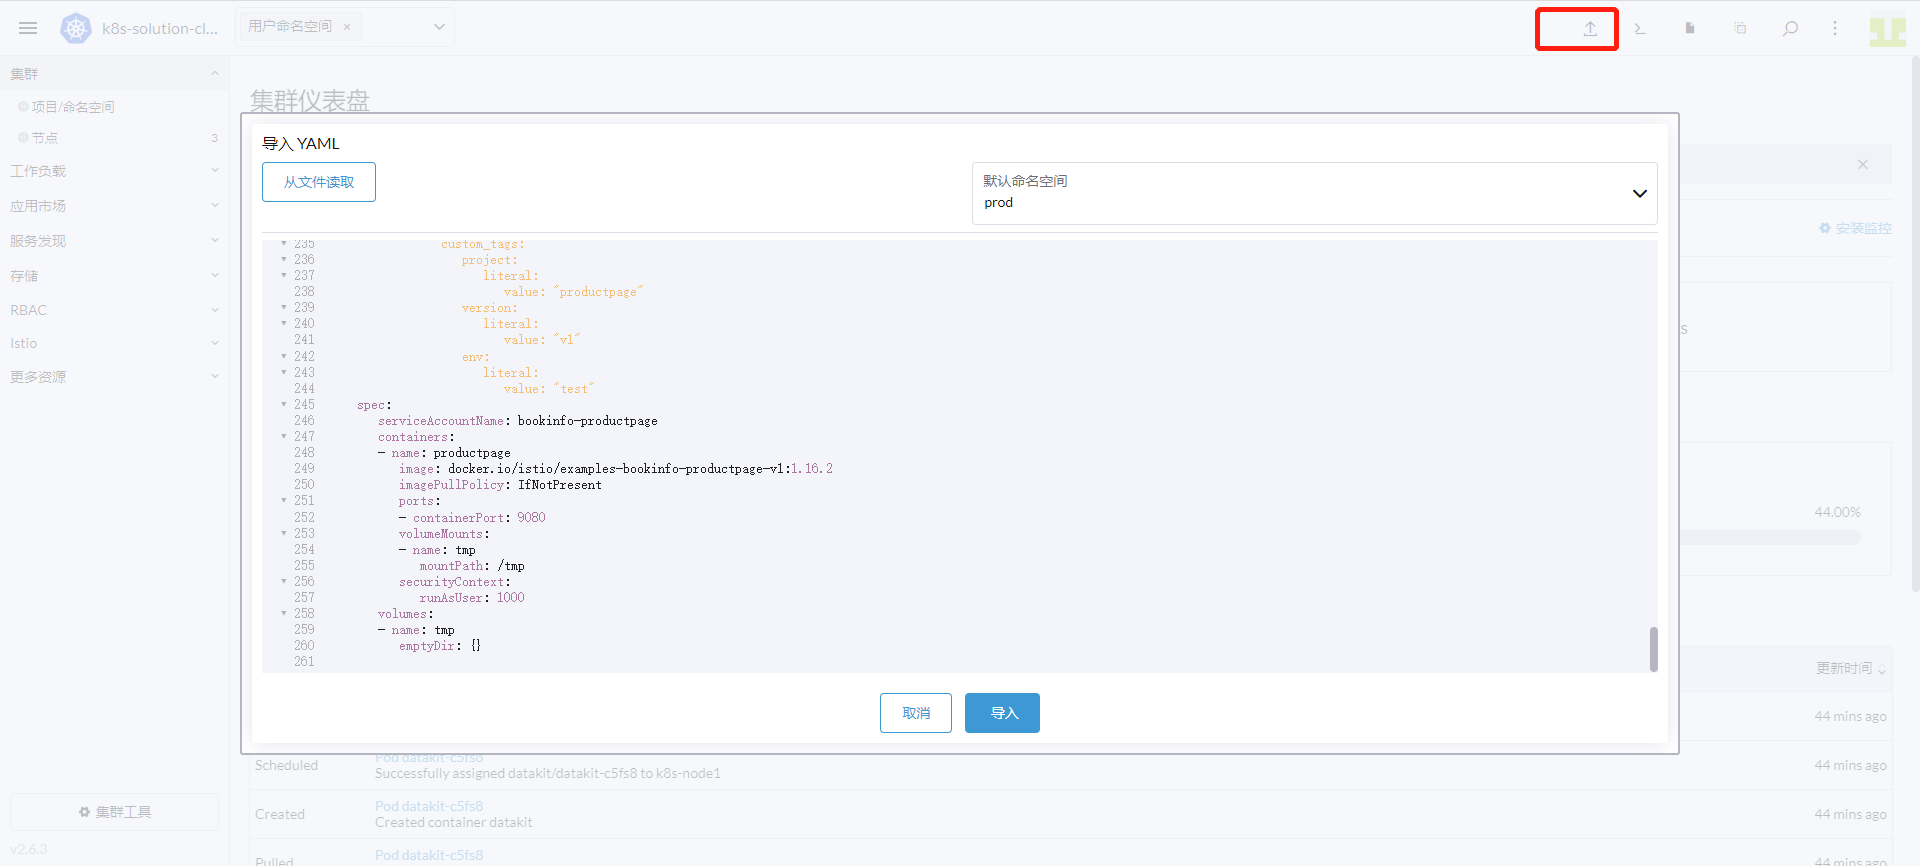
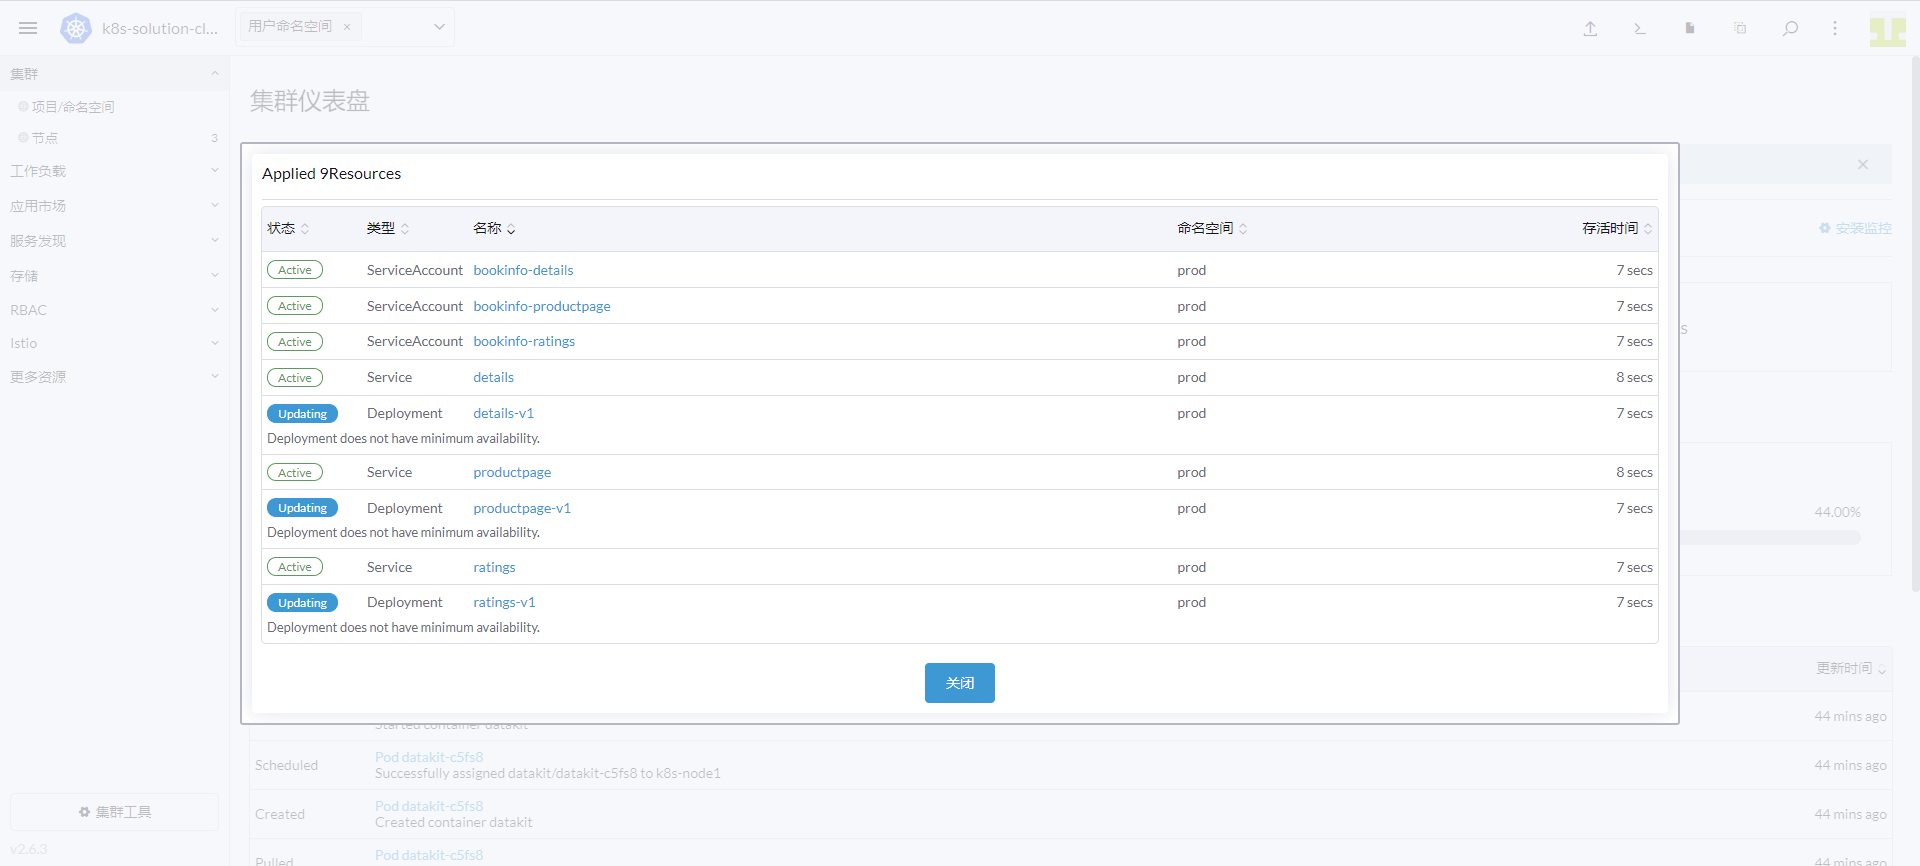
点击上方的「导入 YAML」图标。命名空间输入「prod」,输入上面的内容,点击「导入」。
3.10 部署 reviews 流水线
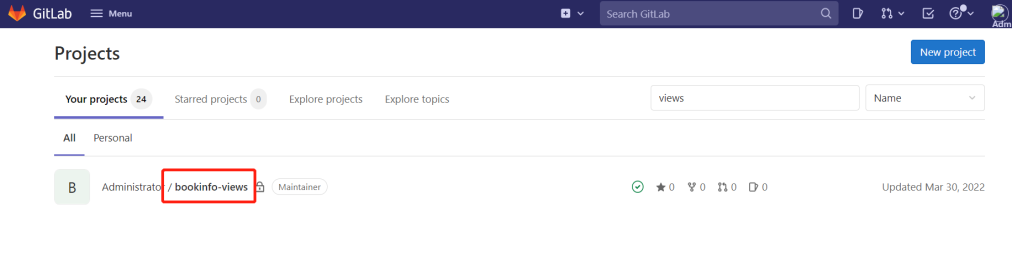
登录 Gitlab,创建 bookinfo-views 项目。
请参考 gitlab 集成文档 打通 Gitlab 和 DataKit,这里只配置 Gitlab CI。
登录「Gitlab」,进入「bookinfo-views」 - 「Settings」 - 「Webhooks」,在 URL 中输入 DataKit 所在的主机 IP 和 DataKit 的 9529 端口,再加 /v1/gitlab。如下图:
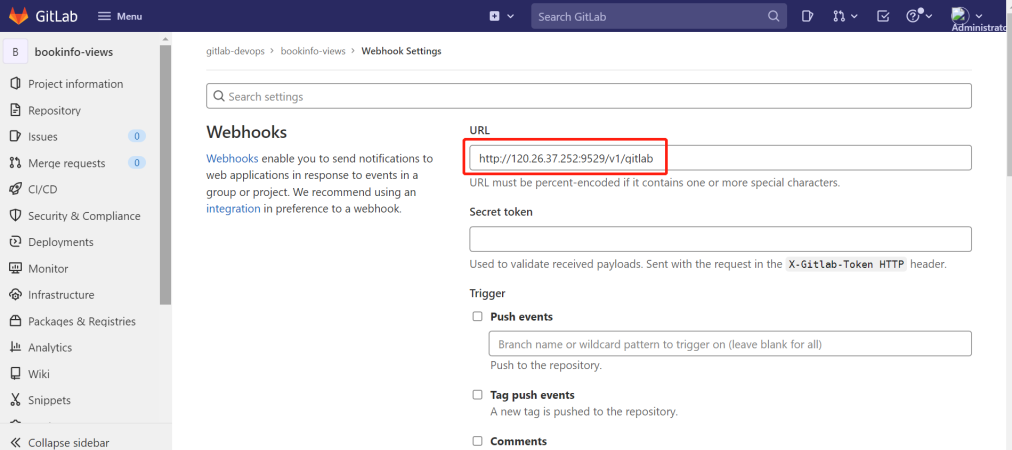
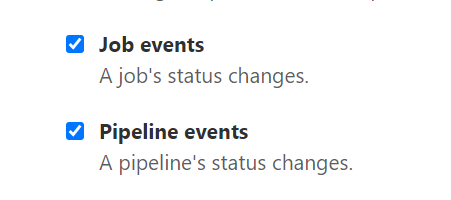
选中 Job events 和 Pipeline events,点击 Add webhook。
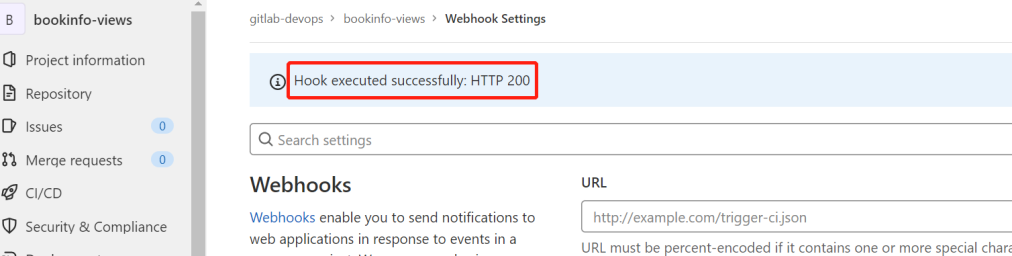
点击刚才创建的 Webhooks 右边的 Test,选择 「Pipeline events」,出现下图的 HTTP 200 说明配置成功。
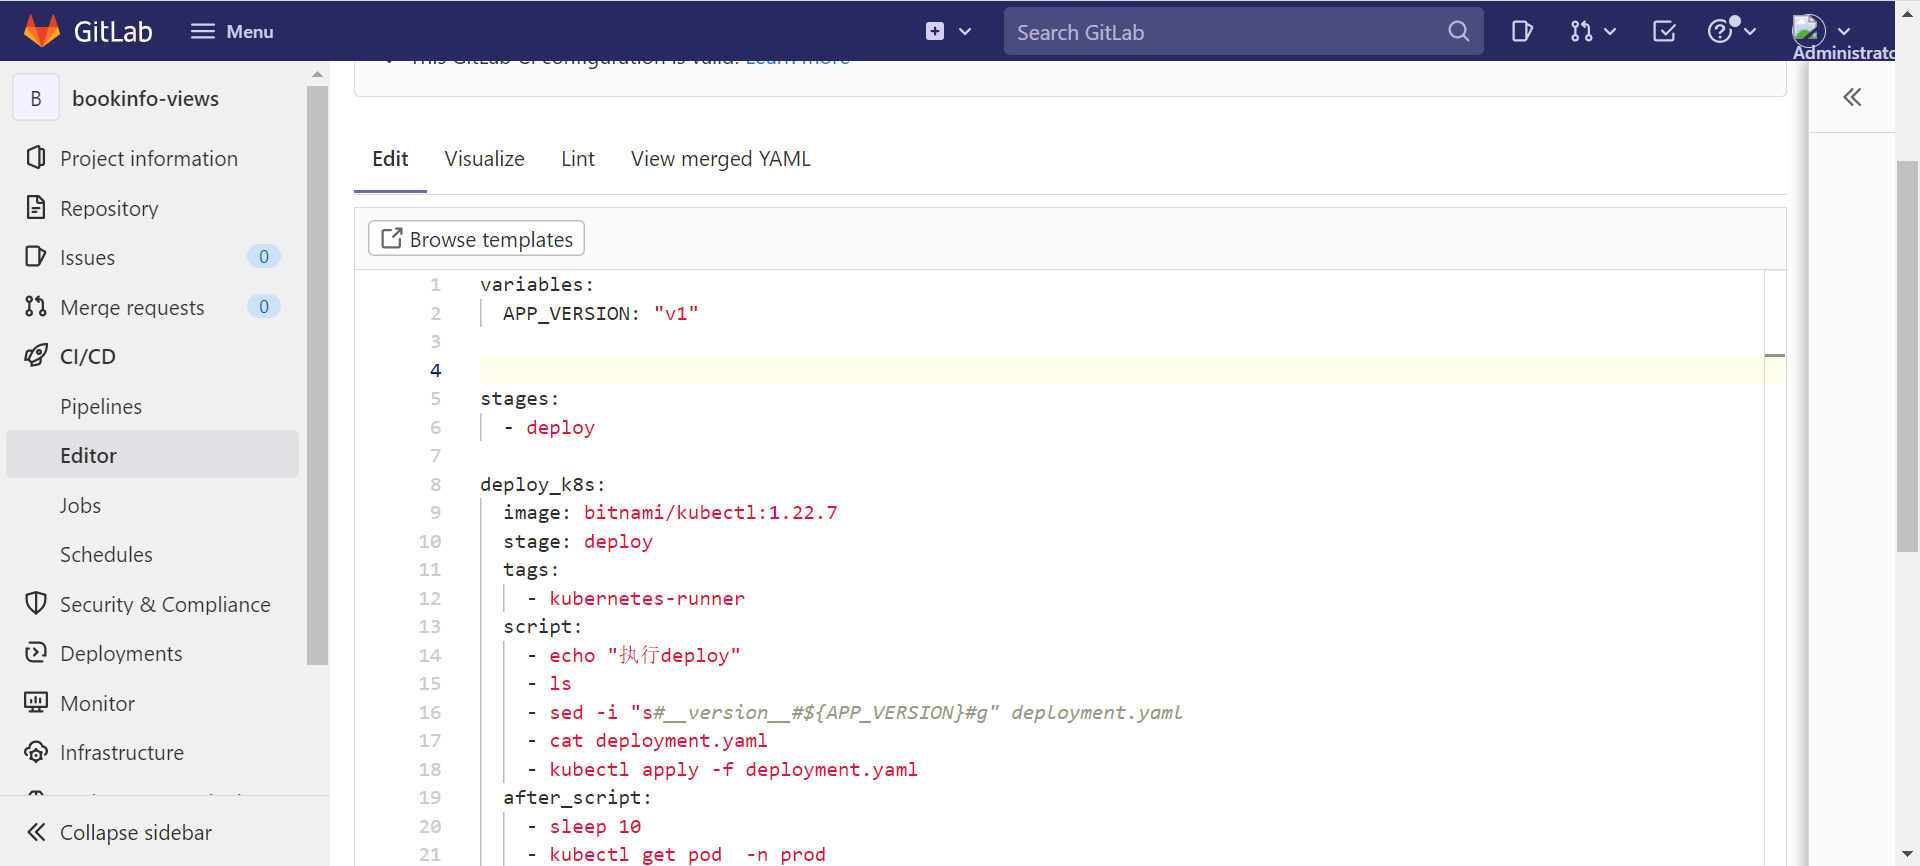
进入「bookinfo-views」项目,根目录新建 deployment.yaml 和 .gitlab-ci.yml 文件。在 annotations 定义了 project、env、version 标签,用于不同项目、不同版本的区分。
配置文件
apiVersion: v1
kind: Service
metadata:
  name: reviews
  namespace: prod
  labels:
    app: reviews
    service: reviews
spec:
  ports:
    - port: 9080
      name: http
  selector:
    app: reviews
---
apiVersion: v1
kind: ServiceAccount
metadata:
  name: bookinfo-reviews
  namespace: prod
  labels:
    account: reviews
---
apiVersion: apps/v1
kind: Deployment
metadata:
  name: reviews-__version__
  namespace: prod
  labels:
    app: reviews
    version: __version__
spec:
  replicas: 1
  selector:
    matchLabels:
      app: reviews
      version: __version__
  template:
    metadata:
      labels:
        app: reviews
        version: __version__
      annotations:
        datakit/prom.instances: |
          [[inputs.prom]]
            url = "http://$IP:15020/stats/prometheus"
            source = "bookinfo-istio-review"
            metric_types = ["counter", "gauge"]
            interval = "60s"
            tags_ignore = ["cache","cluster_type","component","destination_app","destination_canonical_revision","destination_canonical_service","destination_cluster","destination_principal","group","grpc_code","grpc_method","grpc_service","grpc_type","reason","request_protocol","request_type","resource","responce_code_class","response_flags","source_app","source_canonical_revision","source_canonical-service","source_cluster","source_principal","source_version","wasm_filter"]
            metric_name_filter = ["istio_requests_total","pilot_k8s_cfg_events","istio_build","process_virtual_memory_bytes","process_resident_memory_bytes","process_cpu_seconds_total","envoy_cluster_assignment_stale","go_goroutines","pilot_xds_pushes","pilot_proxy_convergence_time_bucket","citadel_server_root_cert_expiry_timestamp","pilot_conflict_inbound_listener","pilot_conflict_outbound_listener_http_over_current_tcp","pilot_conflict_outbound_listener_tcp_over_current_tcp","pilot_conflict_outbound_listener_tcp_over_current_http","pilot_virt_services","galley_validation_failed","pilot_services","envoy_cluster_upstream_cx_total","envoy_cluster_upstream_cx_connect_fail","envoy_cluster_upstream_cx_active","envoy_cluster_upstream_cx_rx_bytes_total","envoy_cluster_upstream_cx_tx_bytes_total","istio_request_duration_milliseconds_bucket","istio_request_duration_seconds_bucket","istio_request_bytes_bucket","istio_response_bytes_bucket"]
            #measurement_prefix = ""
            measurement_name = "istio_prom"
            #[[inputs.prom.measurements]]
            # prefix = "cpu_"
            # name = "cpu"
            [inputs.prom.tags]
            namespace = "$NAMESPACE"
        proxy.istio.io/config: |
          tracing:
            zipkin:
              address: zipkin.istio-system:9411
            custom_tags:
              project:
                literal:
                  value: "reviews"
              version:
                literal:
                  value: __version__
              env:
                literal:
                  value: "test"
    spec:
      serviceAccountName: bookinfo-reviews
      containers:
        - name: reviews
          image: docker.io/istio/examples-bookinfo-reviews-__version__:1.16.2
          imagePullPolicy: IfNotPresent
          env:
            - name: LOG_DIR
              value: "/tmp/logs"
          ports:
            - containerPort: 9080
          volumeMounts:
            - name: tmp
              mountPath: /tmp
            - name: wlp-output
              mountPath: /opt/ibm/wlp/output
          securityContext:
            runAsUser: 1000
      volumes:
        - name: wlp-output
          emptyDir: {}
        - name: tmp
          emptyDir: {}
variables:
  APP_VERSION: "v1"

stages:
  - deploy

deploy_k8s:
  image: bitnami/kubectl:1.22.7
  stage: deploy
  tags:
    - kubernetes-runner
  script:
    - echo "执行deploy"
    - ls
    - sed -i "s#__version__#${APP_VERSION}#g" deployment.yaml
    - cat deployment.yaml
    - kubectl apply -f deployment.yaml
  after_script:
    - sleep 10
    - kubectl get pod  -n prod
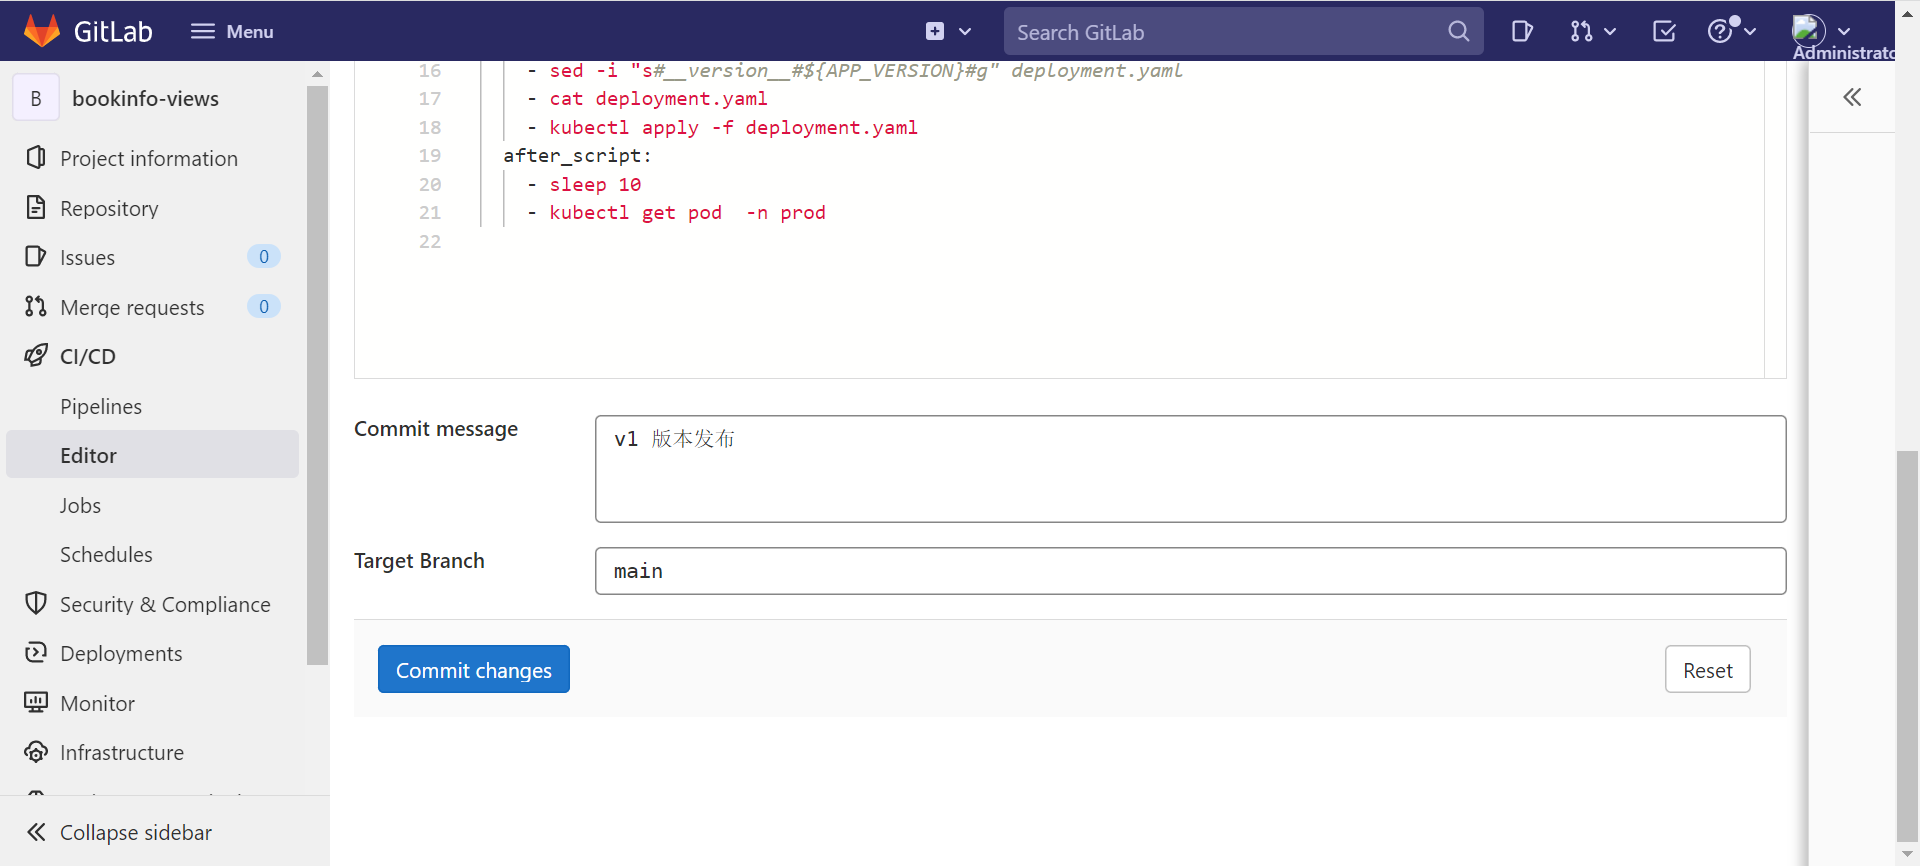
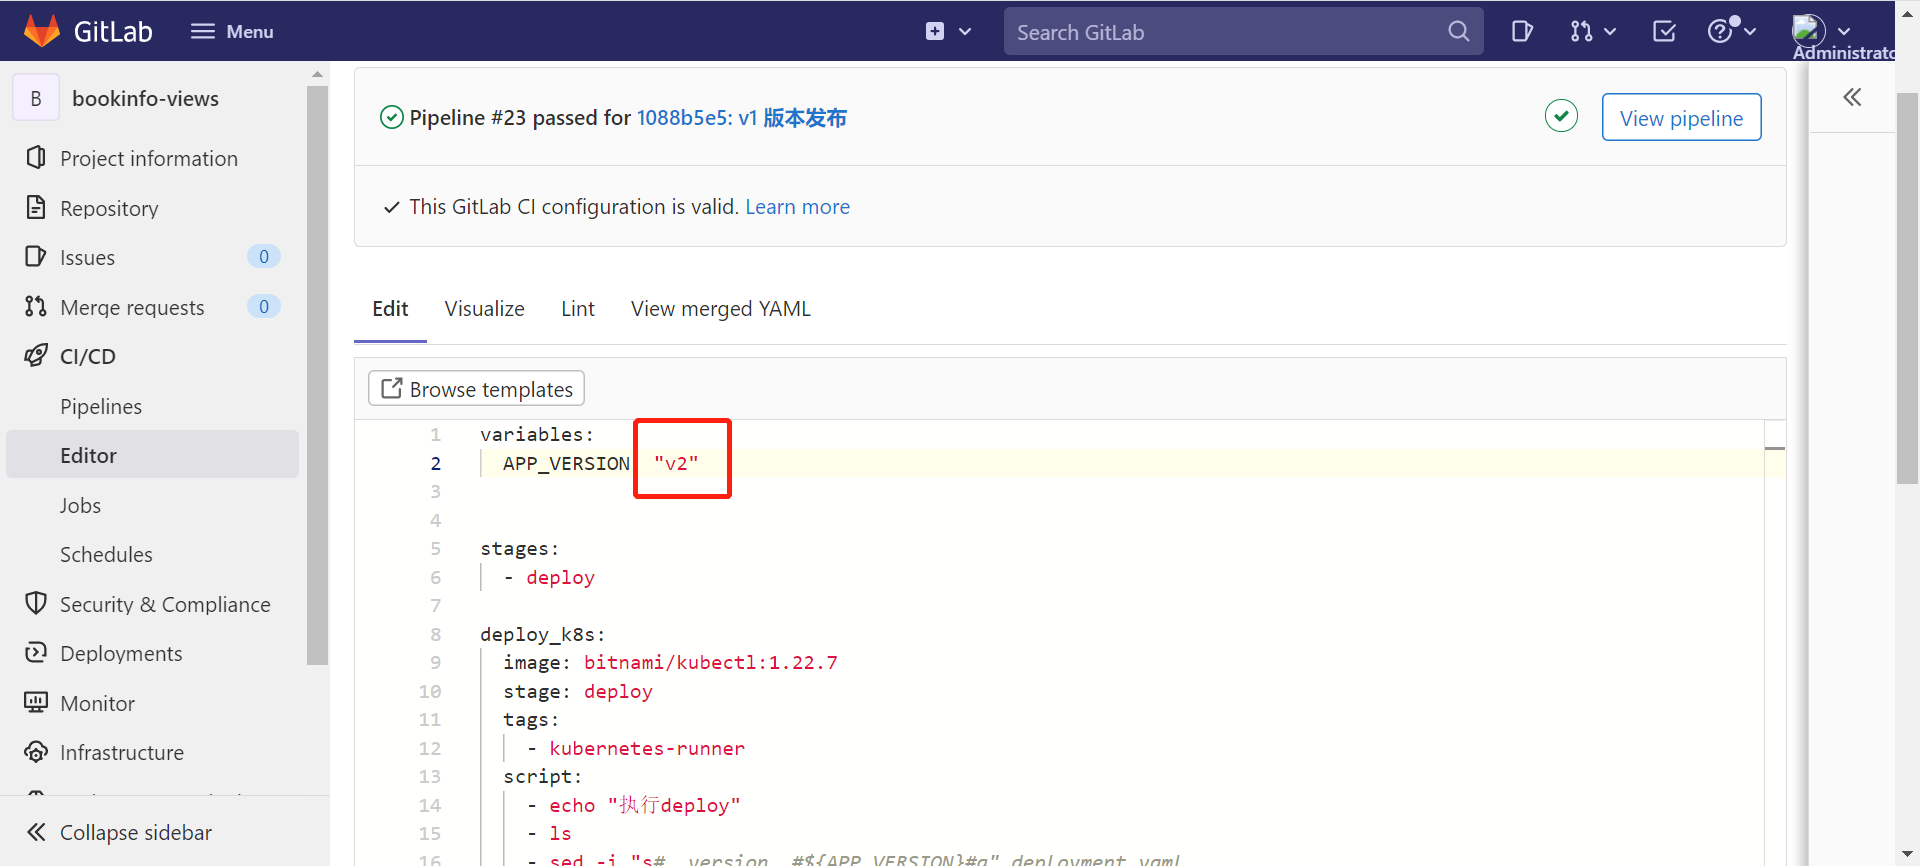
修改 .gitlab-ci.yml 文件中的 APP_VERSION 的值为 "v1",提交一次代码,修改成 "v2",提交一次代码。
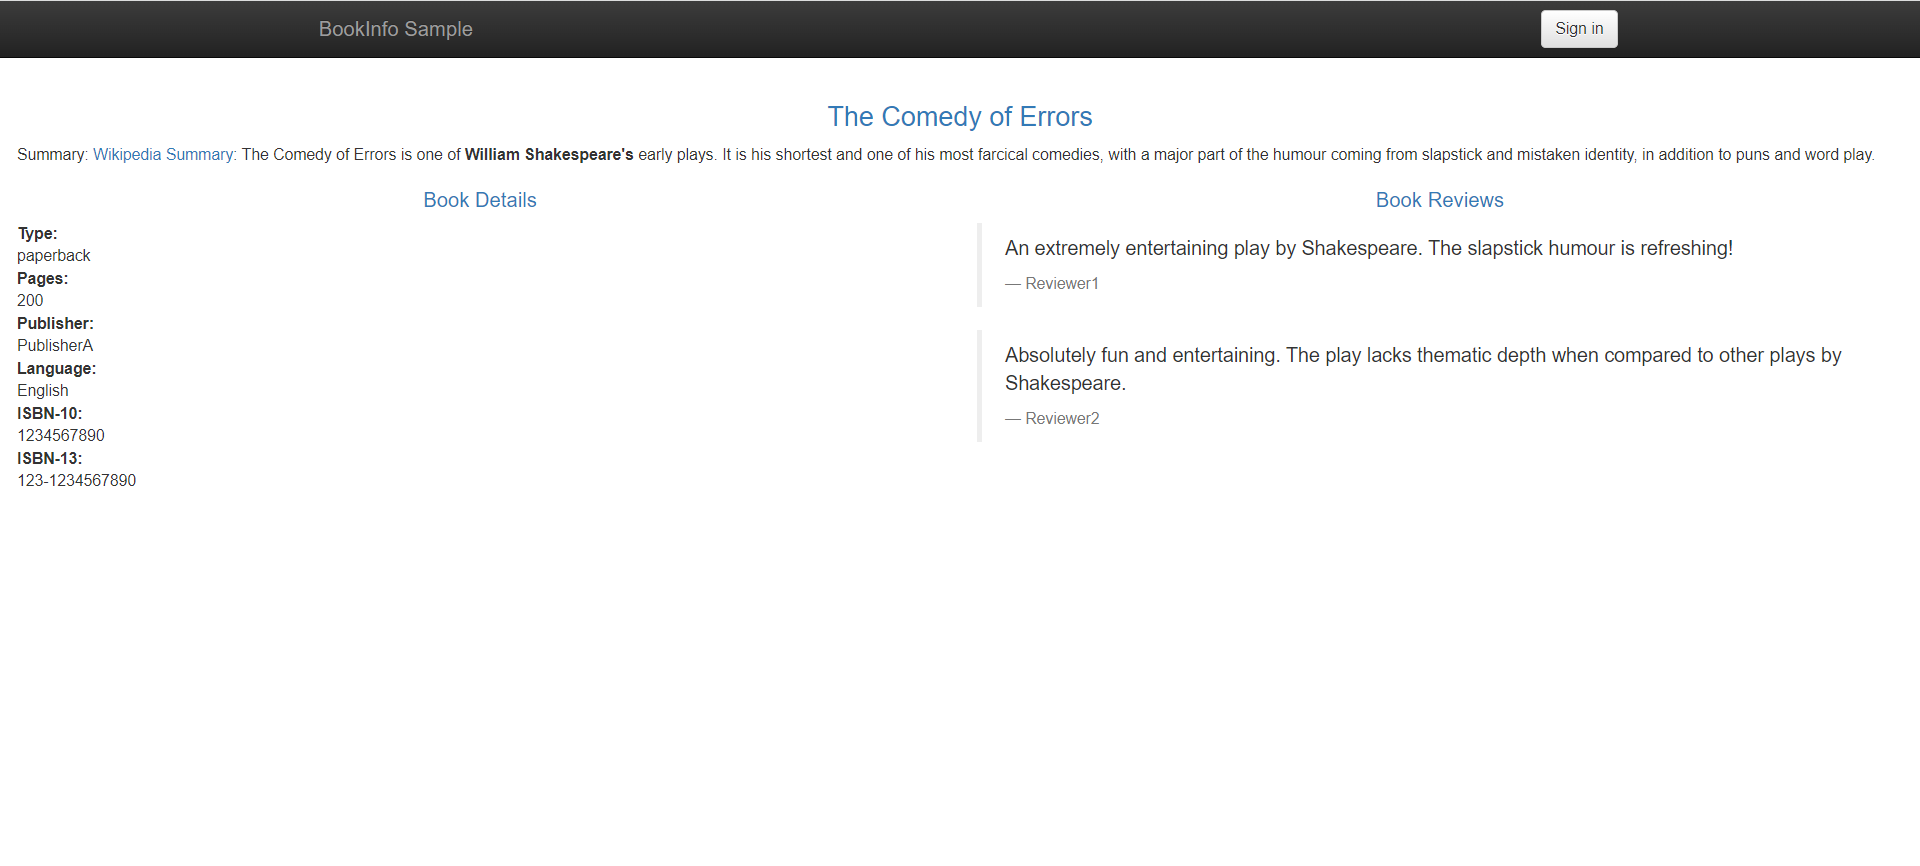
3.11 访问 productpage
点击 Rancher 上方的「命令行」图标,输入「kubectl get svc -n istio-system」回车。
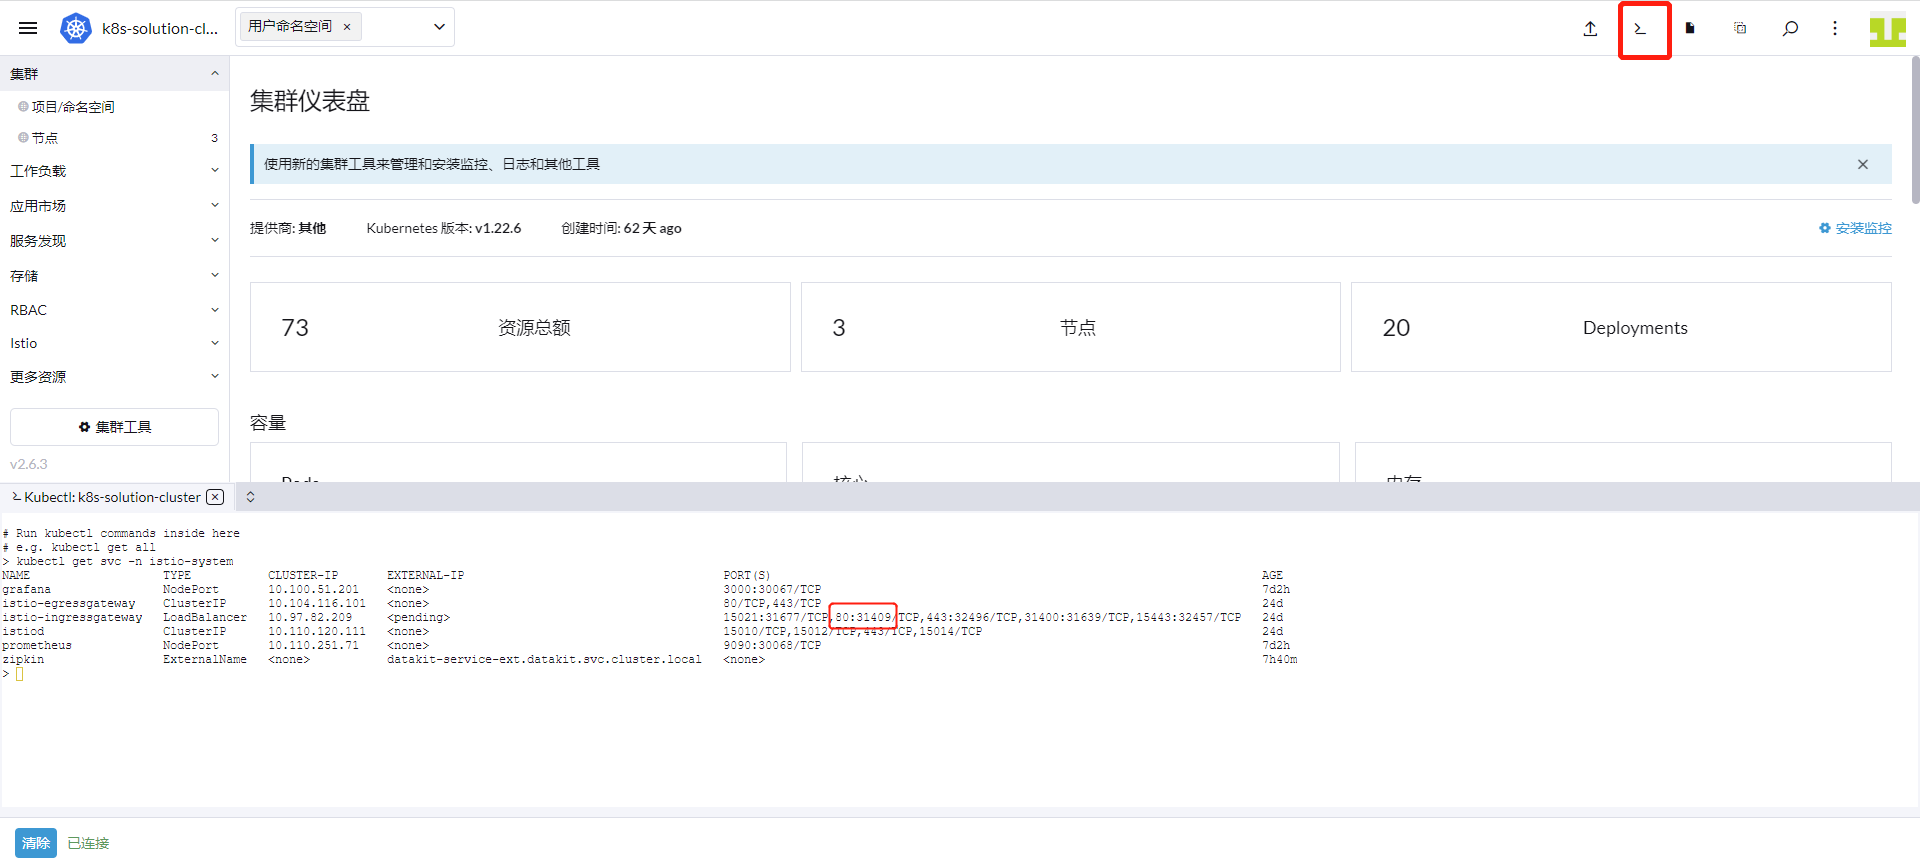
上图可以看到端口是 31409,根据服务器 IP 得到 productpage 访问路径是 http://8.136.193.105:31409/productpage。
步骤 4 Istio 可观测
上述的步骤中,已经对 Istiod 及 bookinfo 应用做了指标采集,观测云默认提供了四个监控视图来观测 Istio 的运行情况。
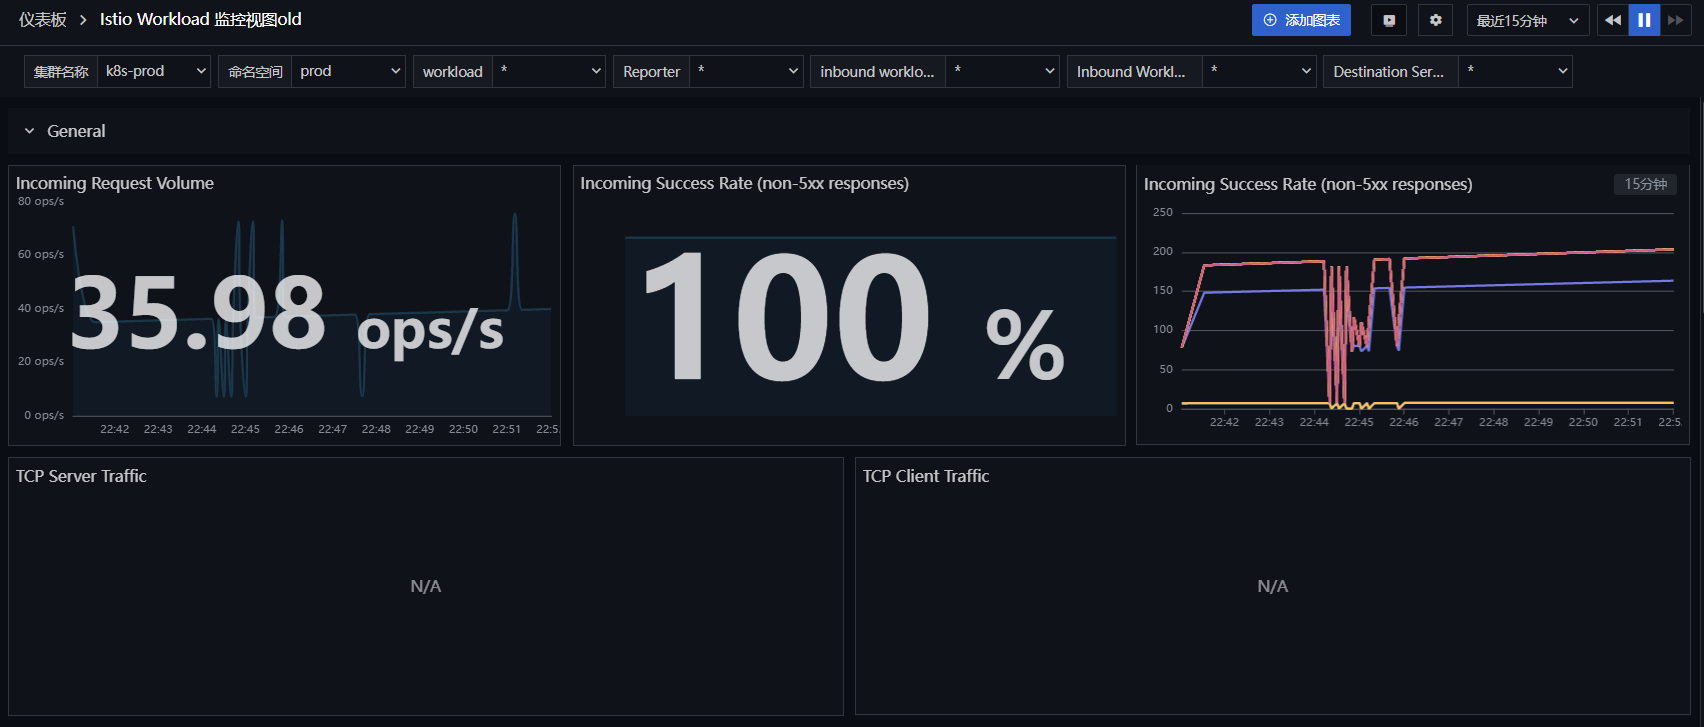
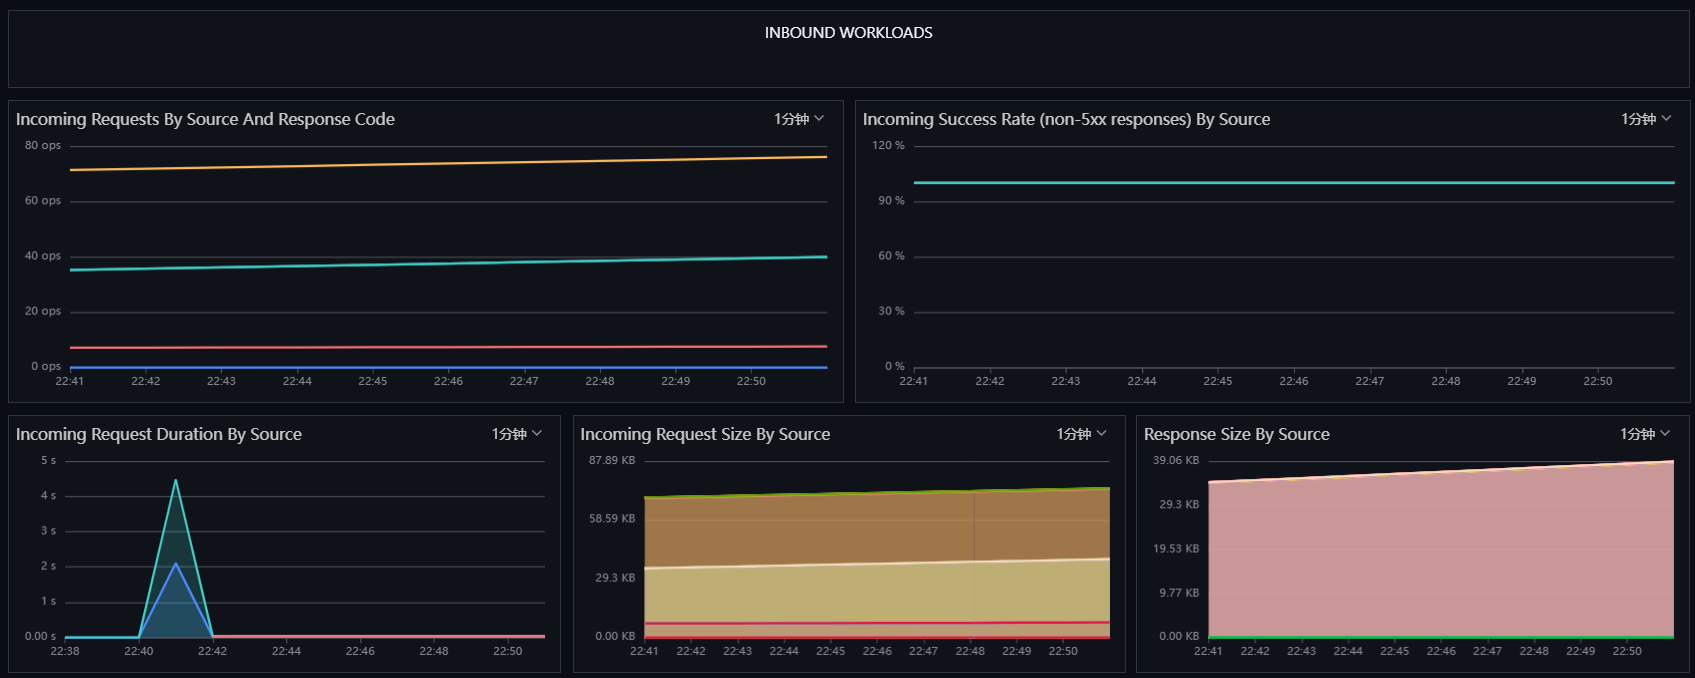
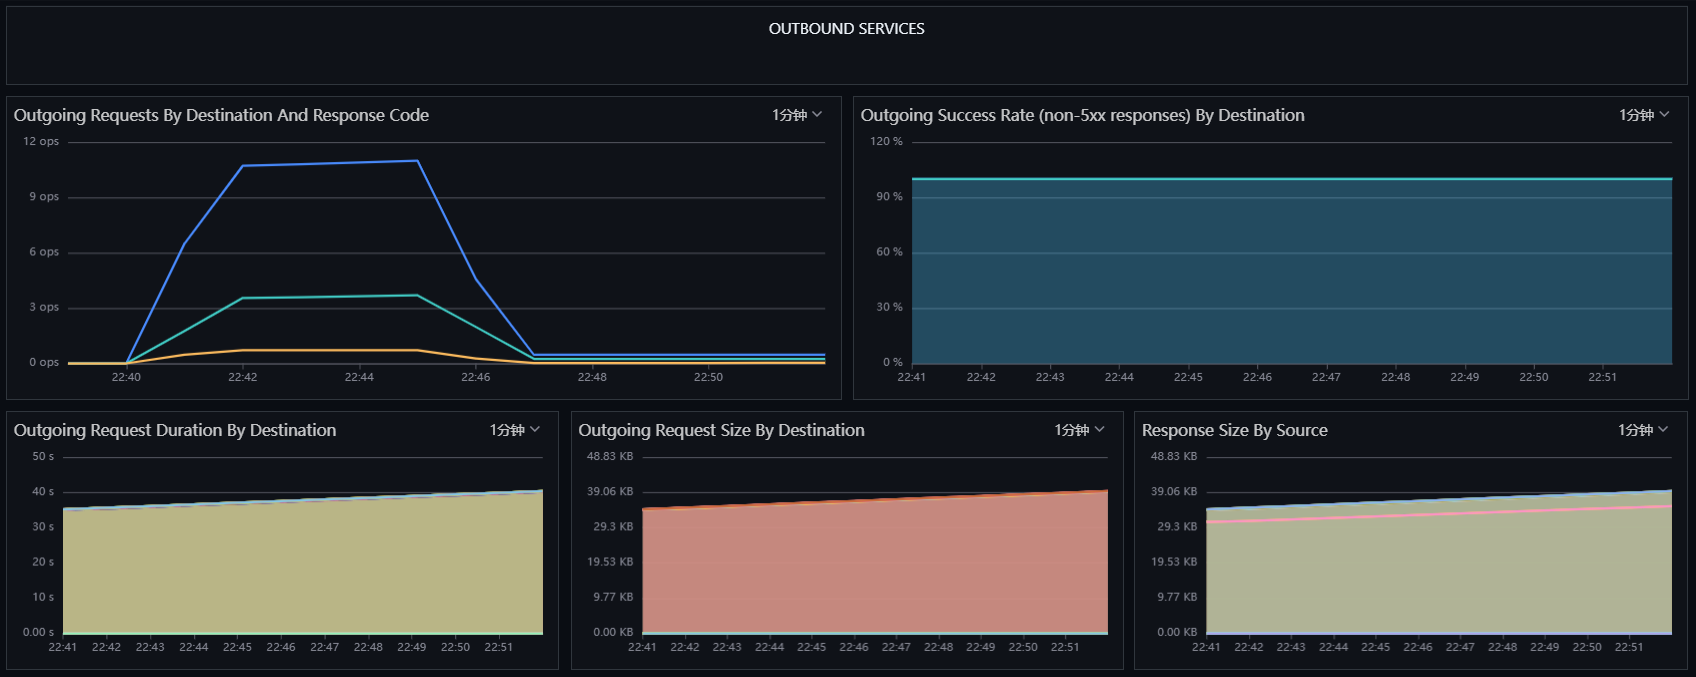
4.1 Istio Workload 监控视图
登录「观测云」,进入「场景」模块,点击「新建仪表板」,输入「Istio」,选择 「Istio Workload 监控视图」,点击「确定」。再点击新建的「Istio Workload 监控视图」进行观测。
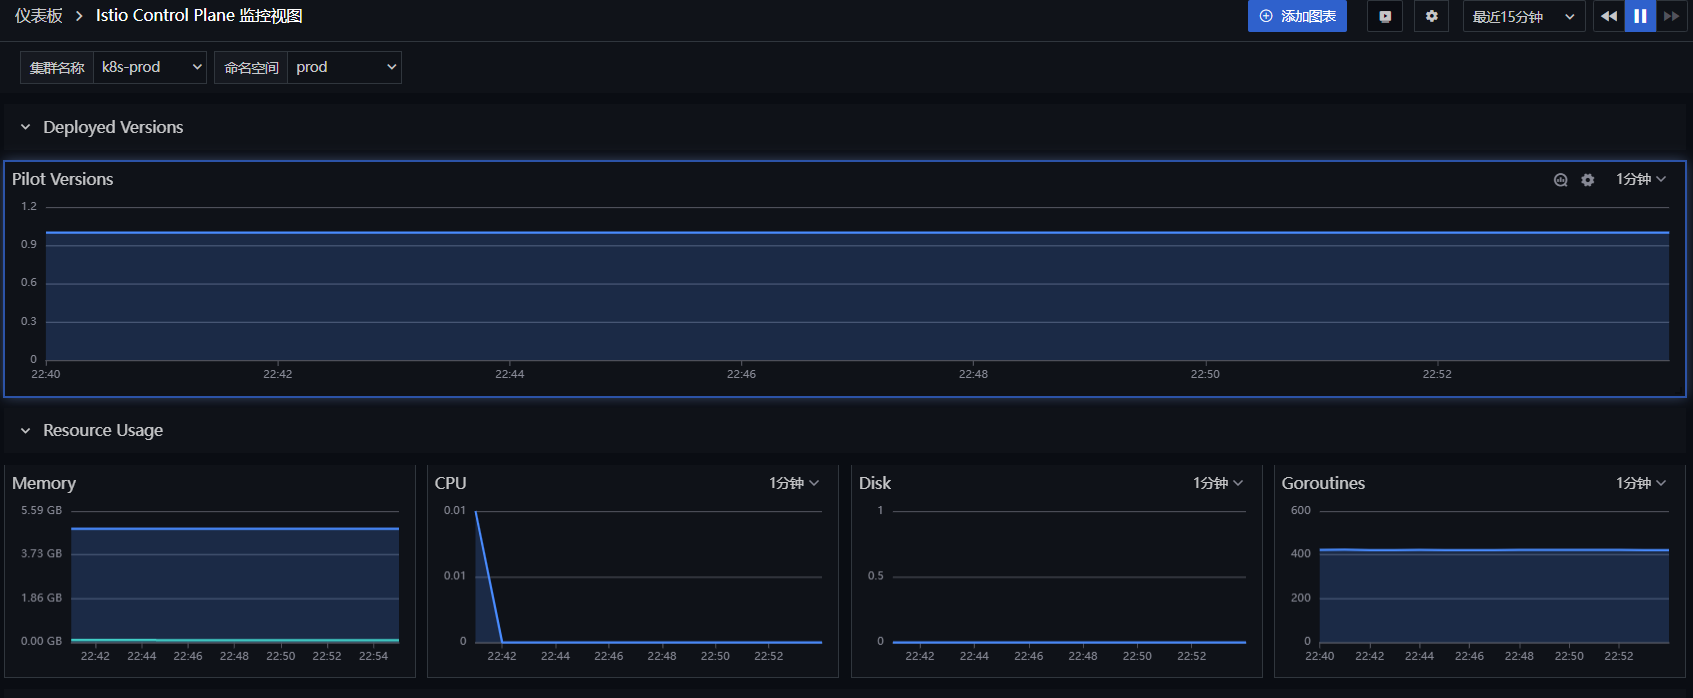
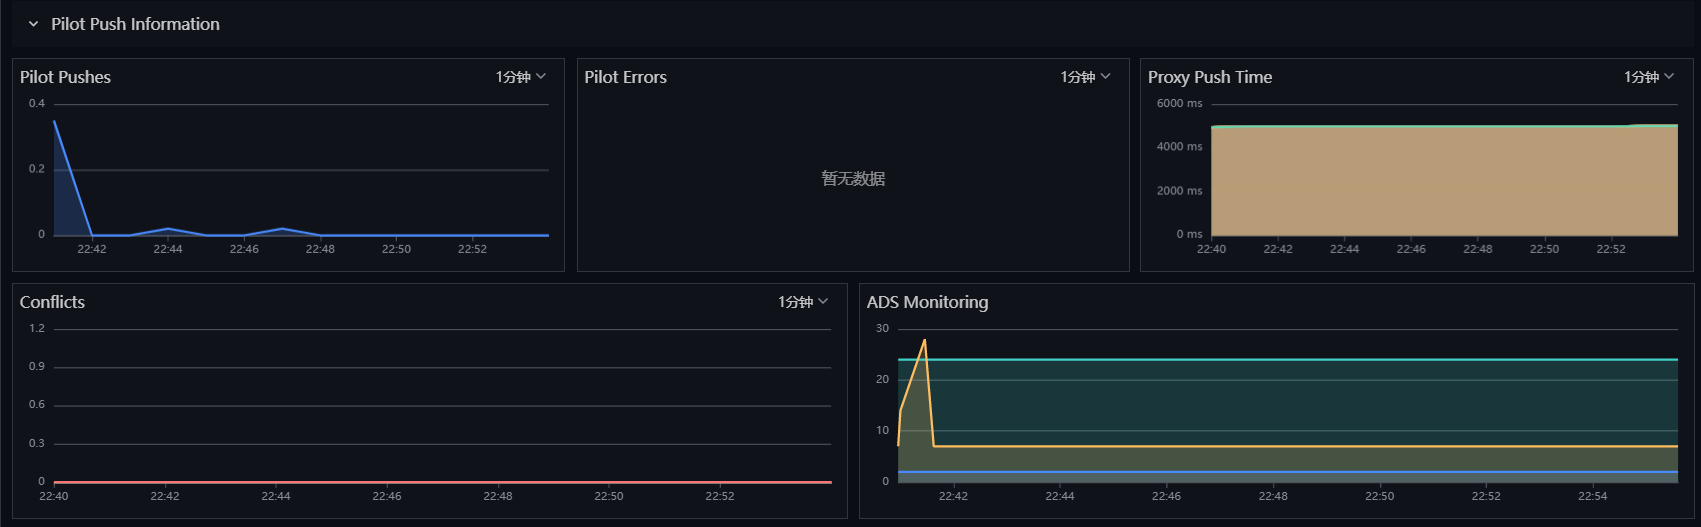
4.2 Istio Control Plane 监控视图
登录「观测云」,进入「场景」模块,点击「新建仪表板」,输入「Istio」,选择「Istio Control Plane 监控视图」,点击「确定」。再点击新建的「Istio Control Plane 监控视图」进行观测 。
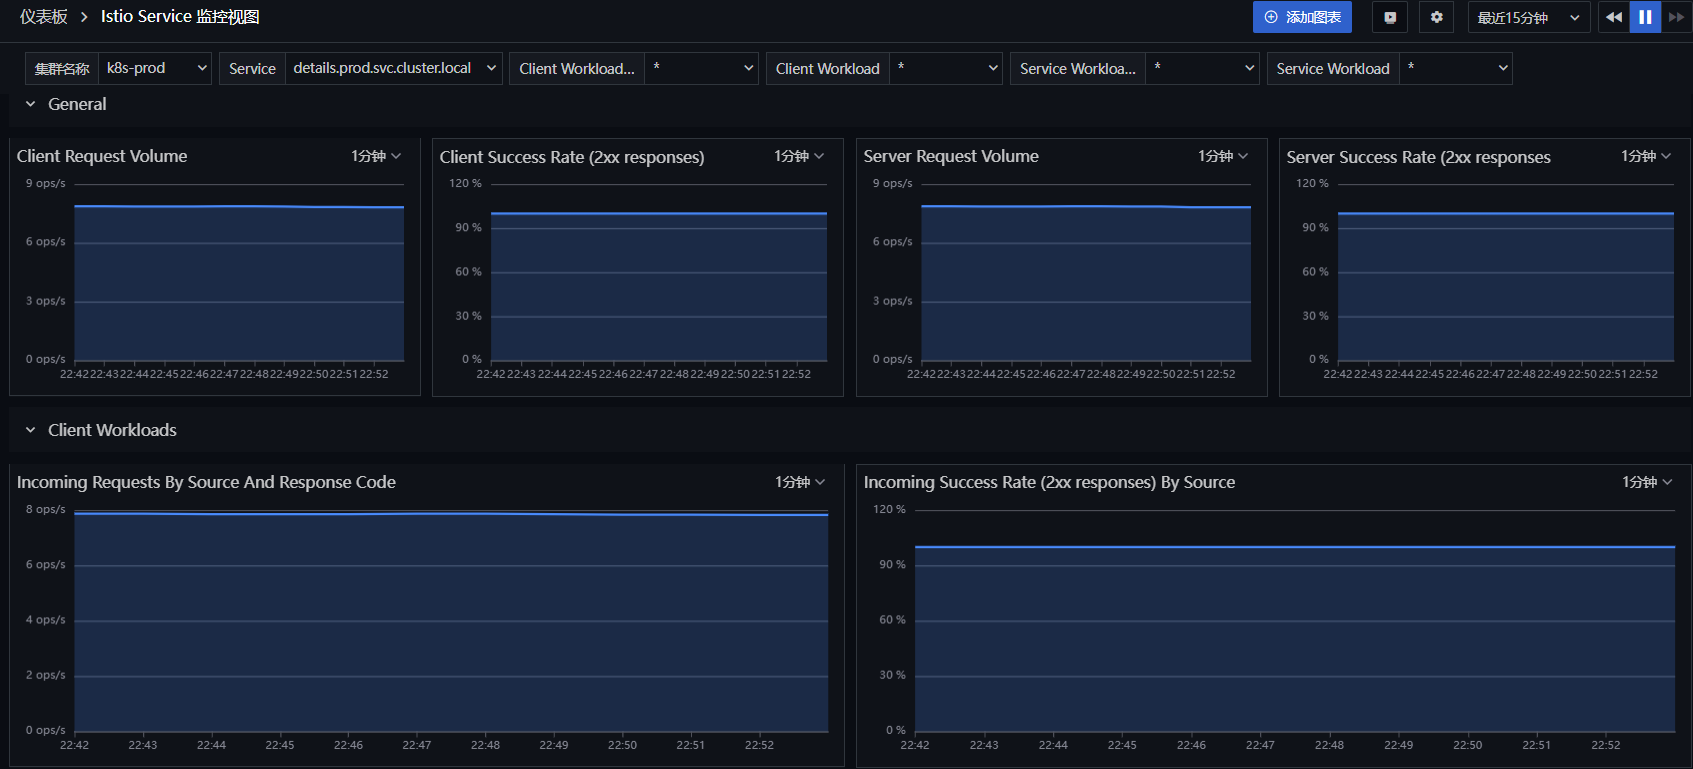
4.3 Istio Service 监控视图
登录「观测云」,进入「场景」模块,点击「新建仪表板」,输入「Istio」,选择「Istio Service 监控视图」,点击「确定」。再点击新建的「Istio Service 监控视图」进行观测 。
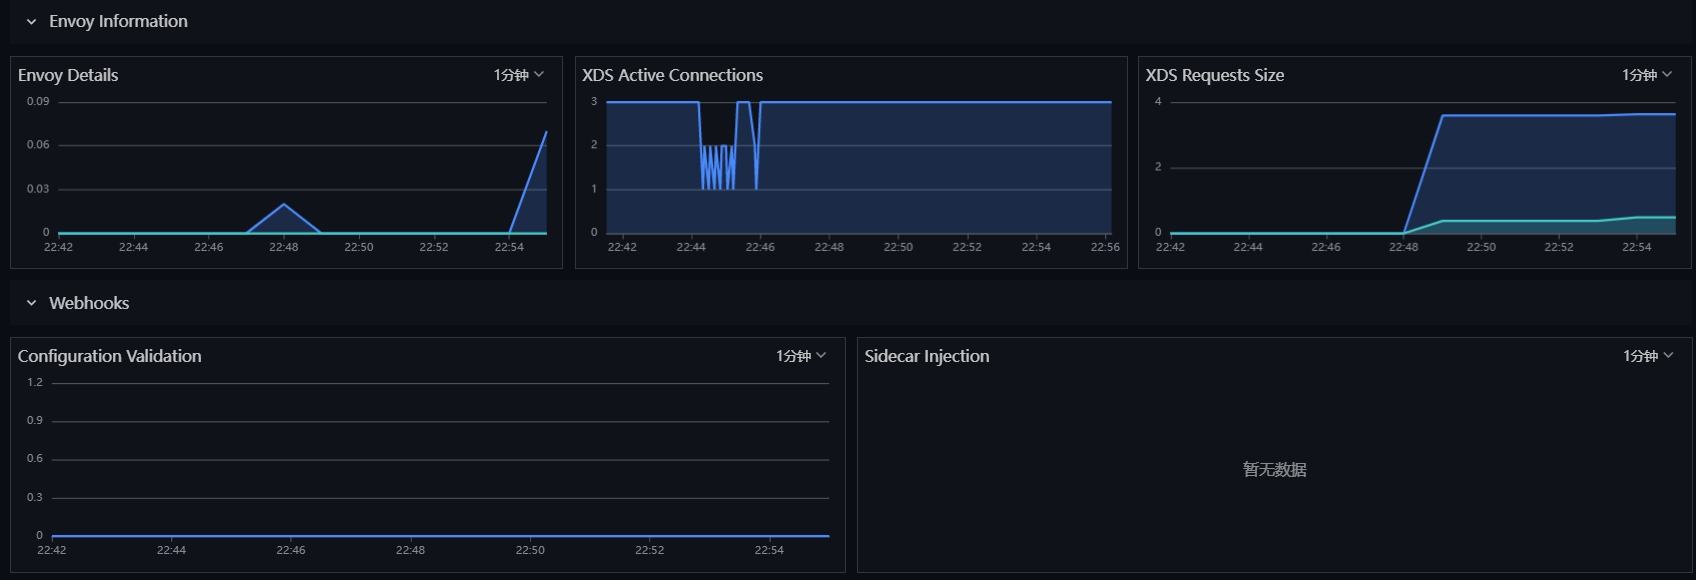
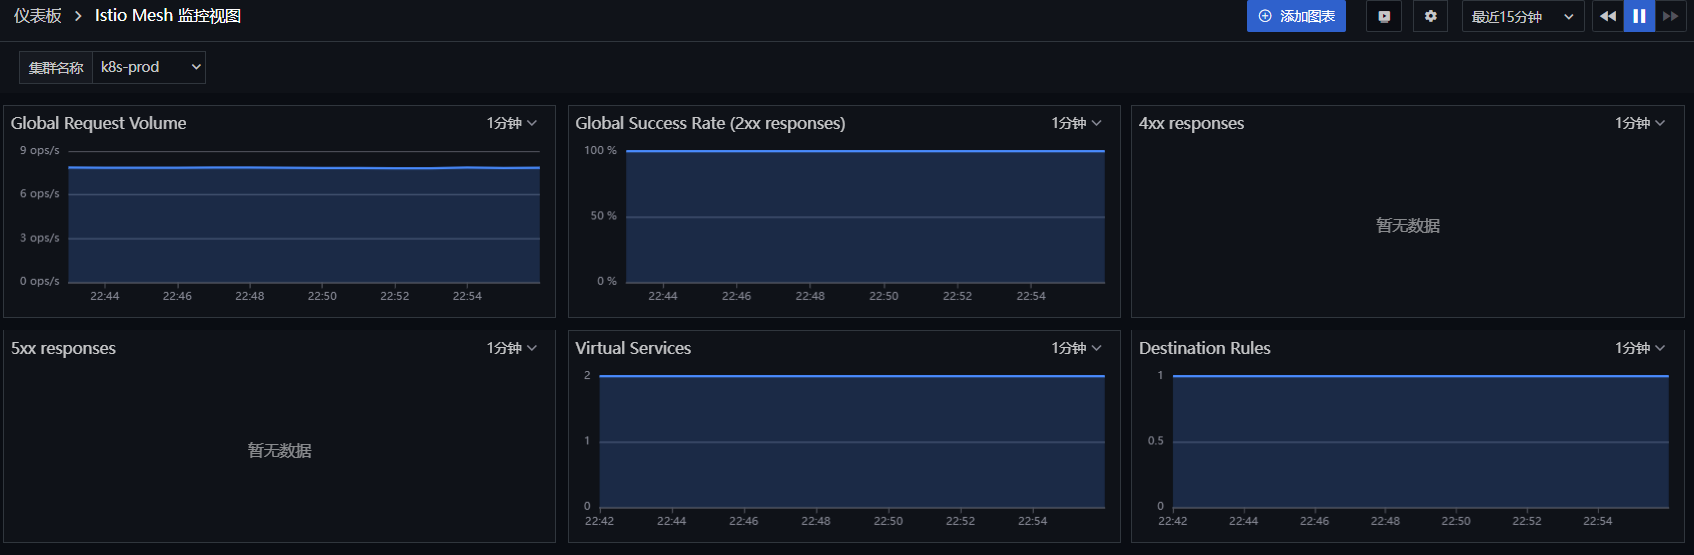
4.4 Istio Mesh 监控视图
登录「观测云」,进入「场景」模块,点击「新建仪表板」,输入「Istio」,选择「Istio Mesh 监控视图」,点击「确定」。再点击新建的「Istio Mesh 监控视图」进行观测 。
步骤 5 RUM 可观测
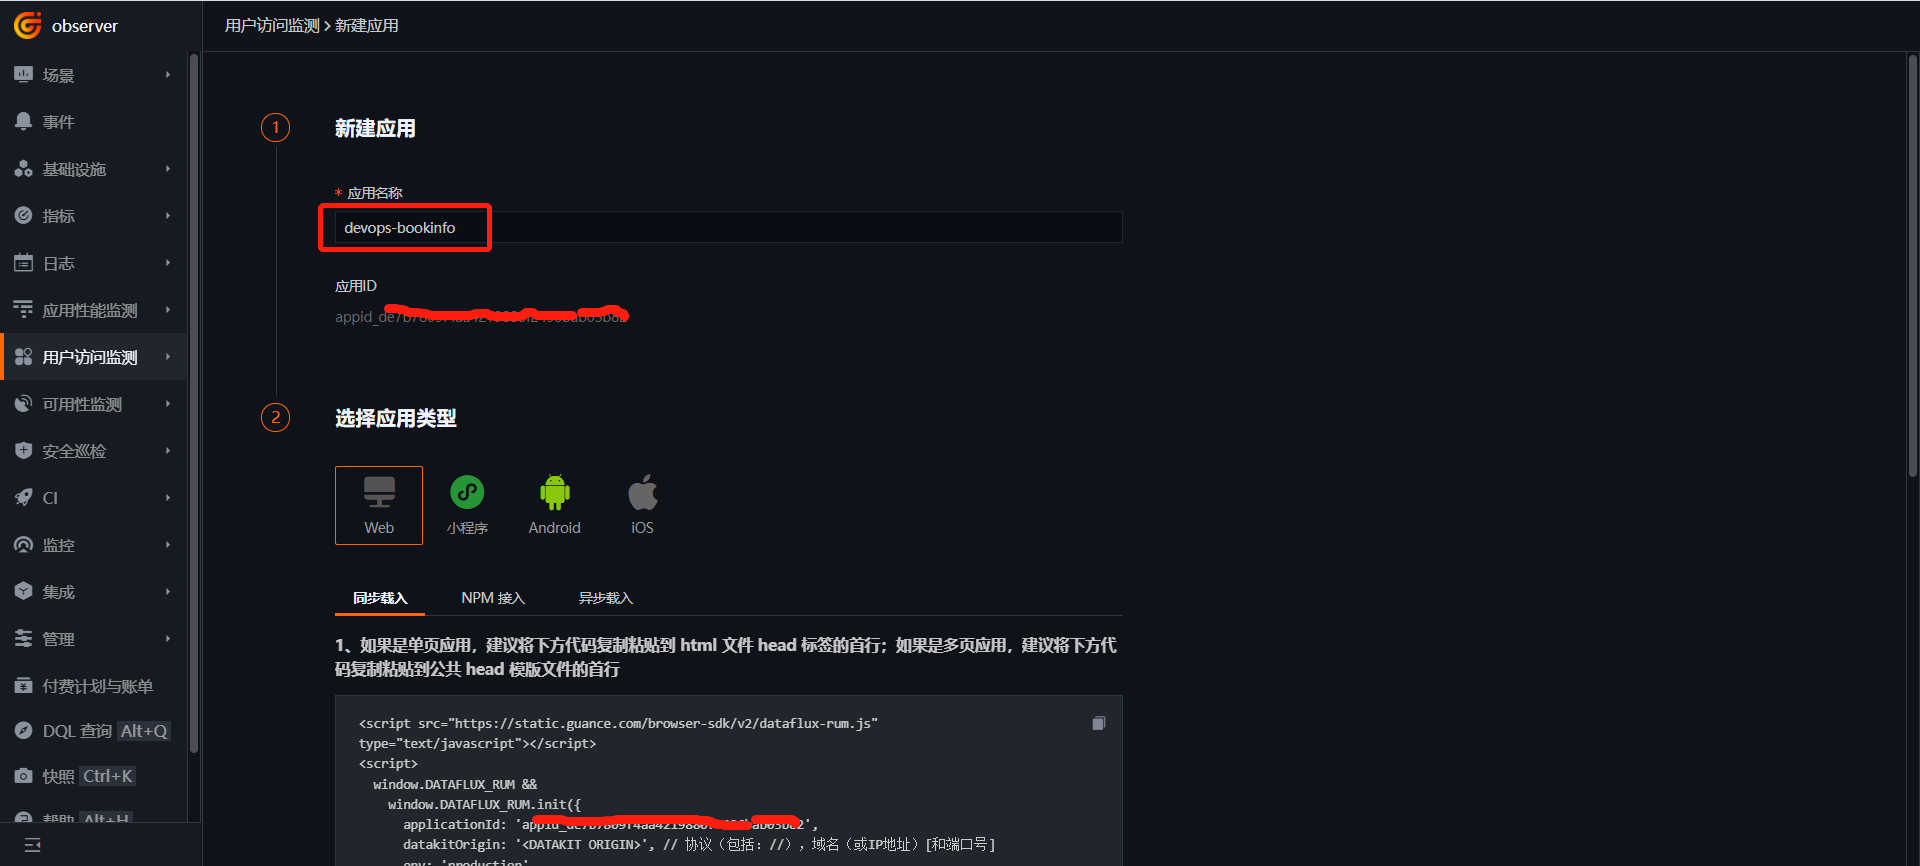
5.1 新建用户访问监测
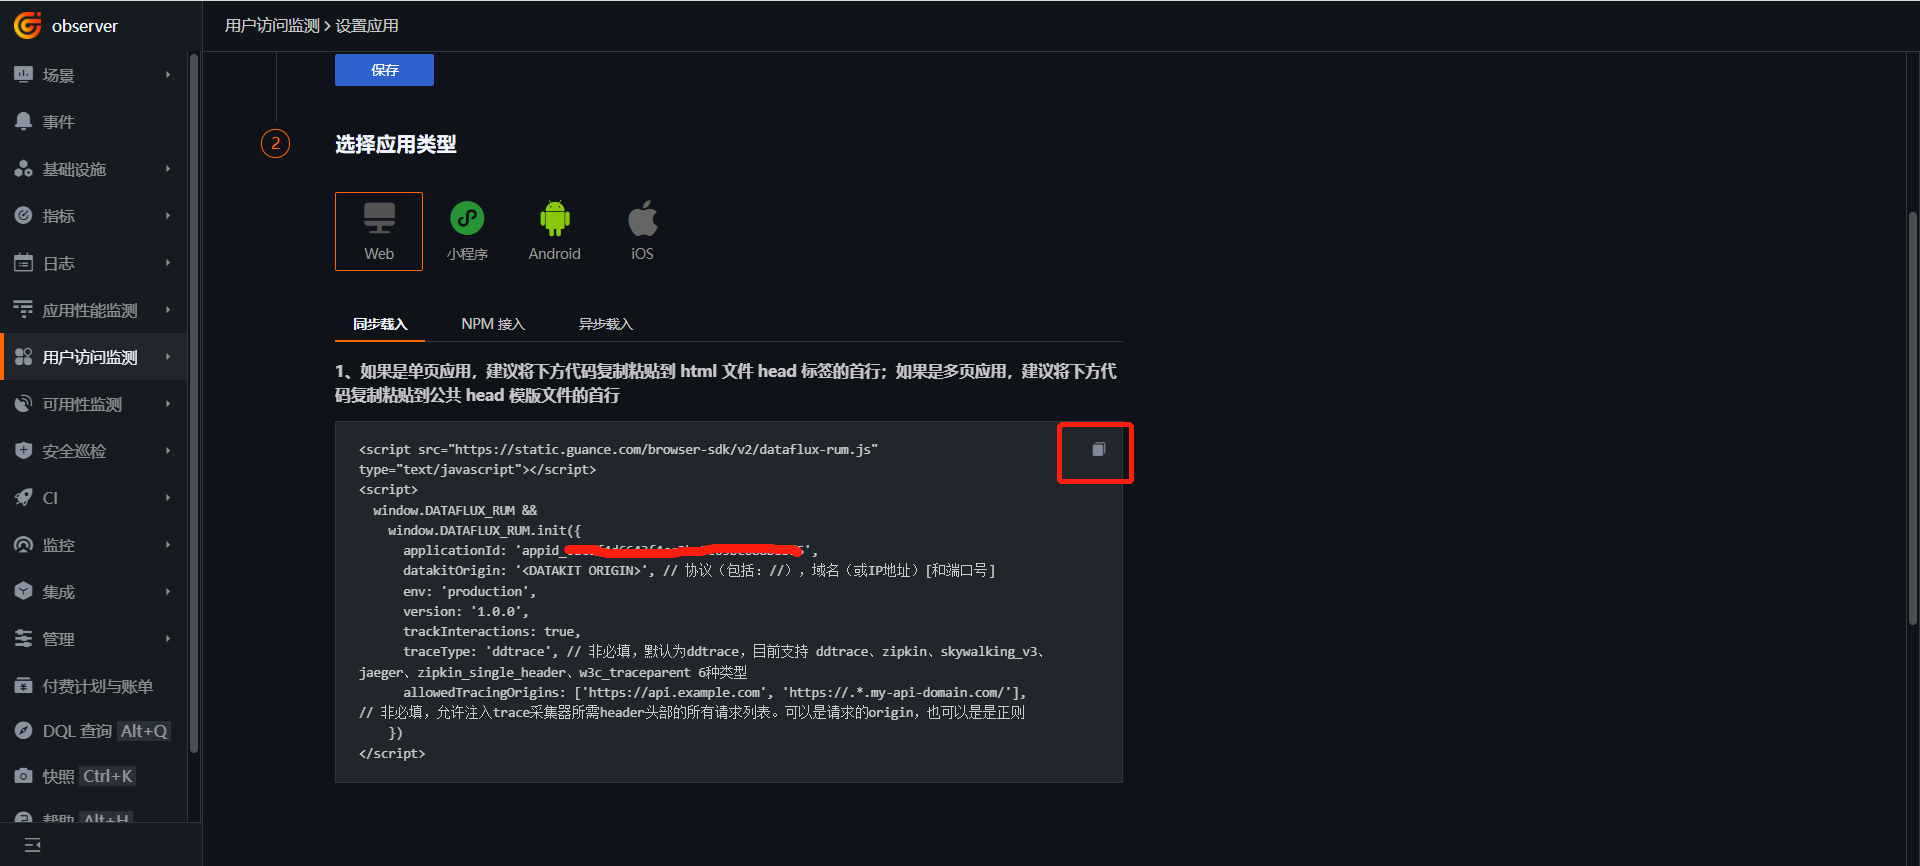
登录「 观测云」,进入「用户访问监测」,新建应用 devops-bookinfo ,复制下方 JS。
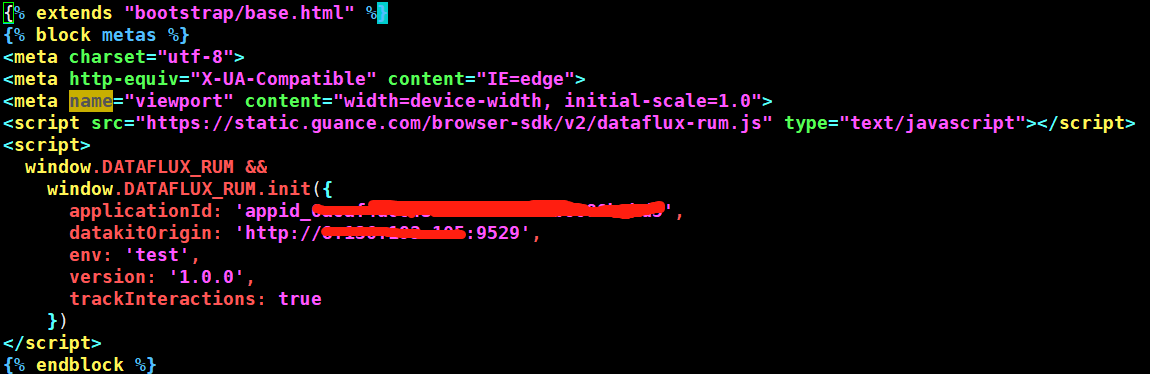
5.2 制作 productpage 镜像
下载 istio-1.13.2-linux-amd64.tar.gz,解压文件。上述的 JS 需要放置到 productpage 项目所有界面都能访问到的地方,本项目把上面的 JS 复制到 istio-1.13.2\samples\bookinfo\src\productpage\templates\productpage.html 文件中,其中 datakitOrigin 值是 DataKit 的地址。
参数说明
- datakitOrigin:数据传输地址,这里是 datakit 的域名或 IP,必填。
- env:应用所属环境,必填。
- version:应用所属版本,必填。
- trackInteractions:是否开启用户行为统计,例如点击按钮、提交信息等动作,必填。
- traceType:trace 类型,默认为 ddtrace,非必填。
- allowedTracingOrigins:实现 APM 与 RUM 链路打通,填写后端服务的域名或 IP ,非必填。
制作镜像,并上传到镜像仓库。
cd istio-1.13.2\samples\bookinfo\src\productpage
docker build -t 172.16.0.238/df-demo/product-page:v1  .
docker push 172.16.0.238/df-demo/product-page:v1
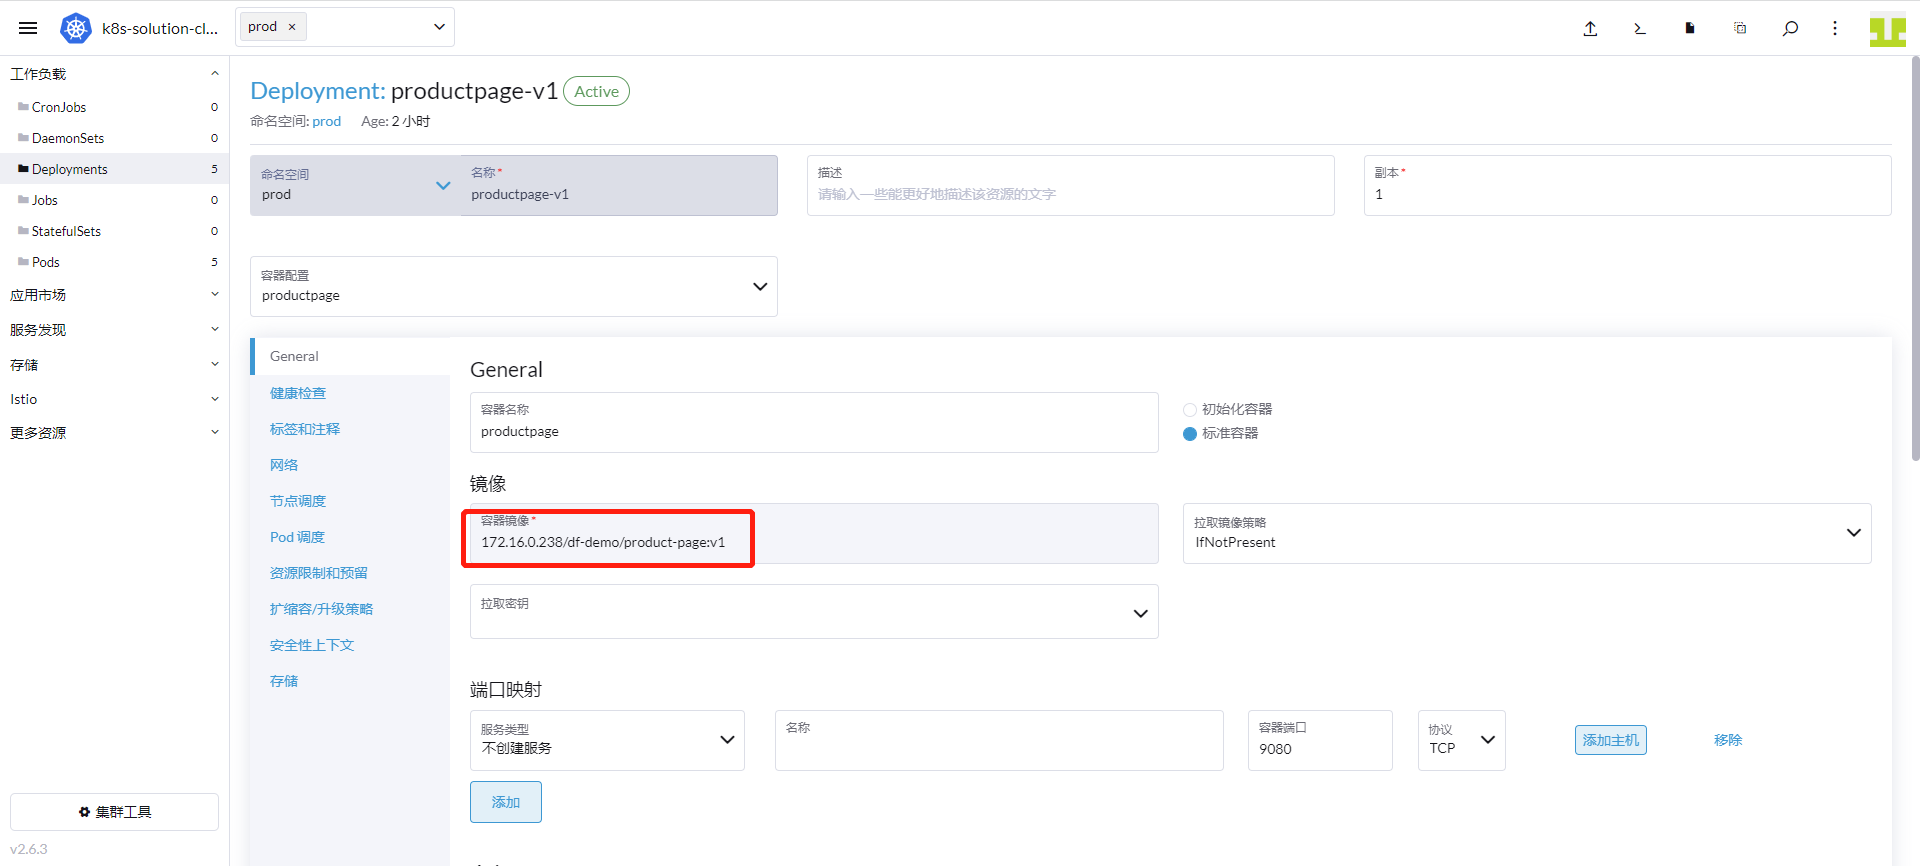
5.3 替换 productpage 镜像
进入「集群」 - 「工作负载」->「Deployments」,找到「productpage-v1」点击「编辑配置」。
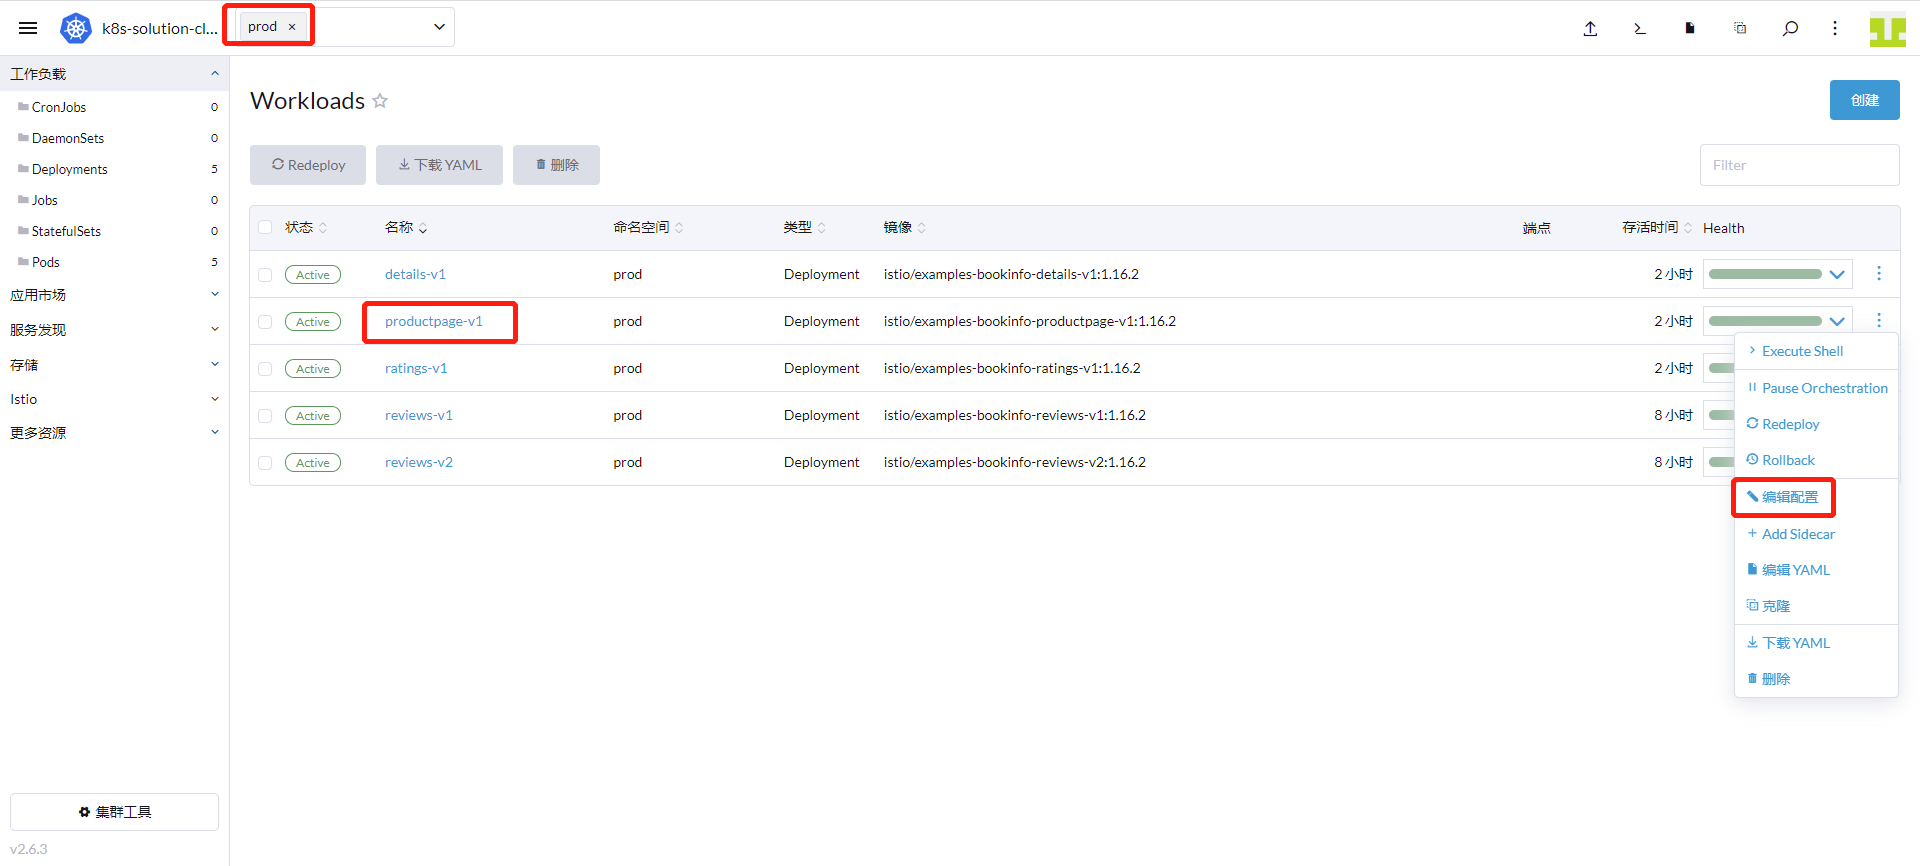
把镜像 image: docker.io/istio/examples-bookinfo-productpage-v1:1.16.2 替换成下面镜像image: 172.16.0.238/df-demo/product-page:v1,点击「保存」。
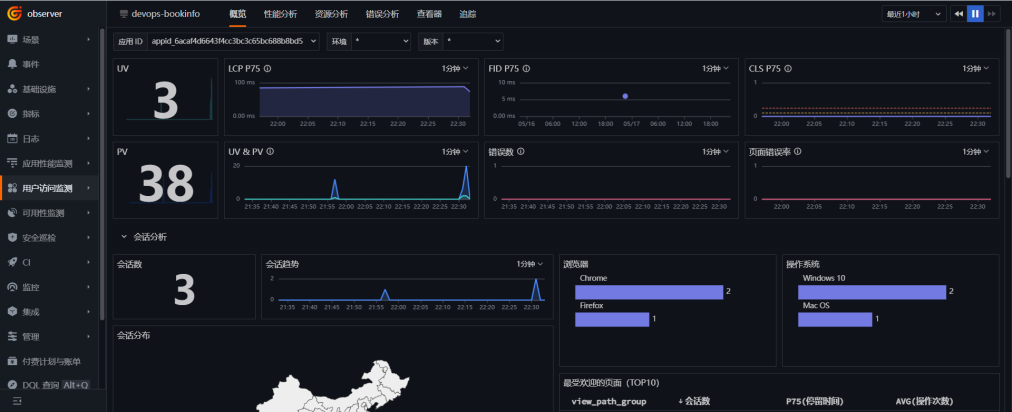
5.4 用户访问监测
登录「 观测云」,进入「用户访问监测」,找到 *devops-bookinfo *应用,点击进入,查看 UV、PV、会话数、访问的页面等信息。
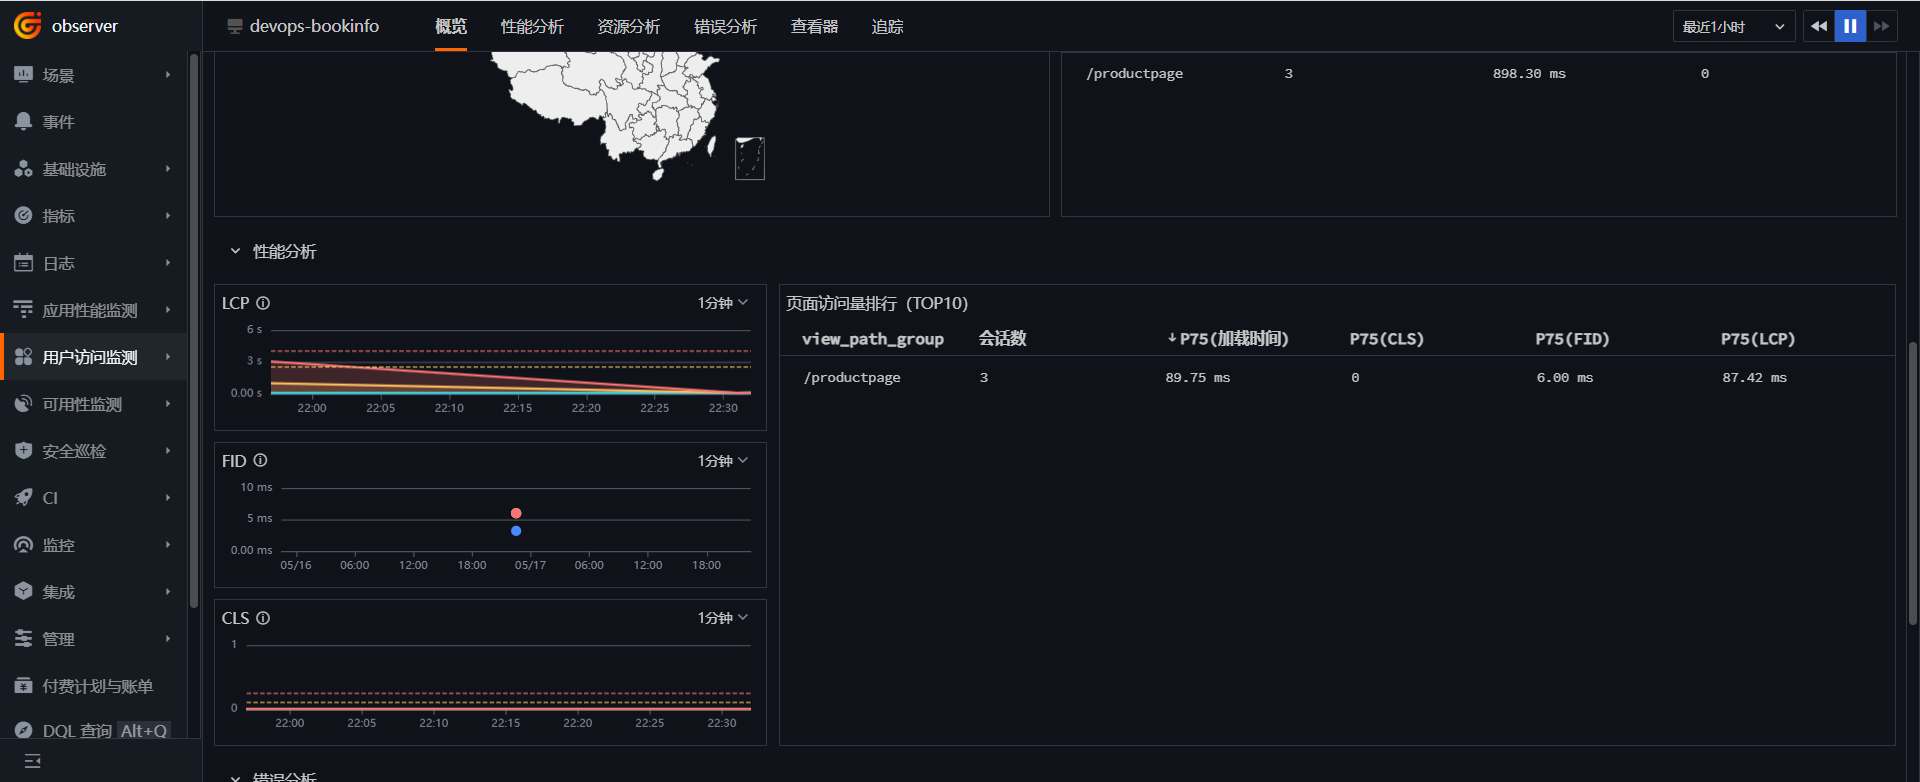
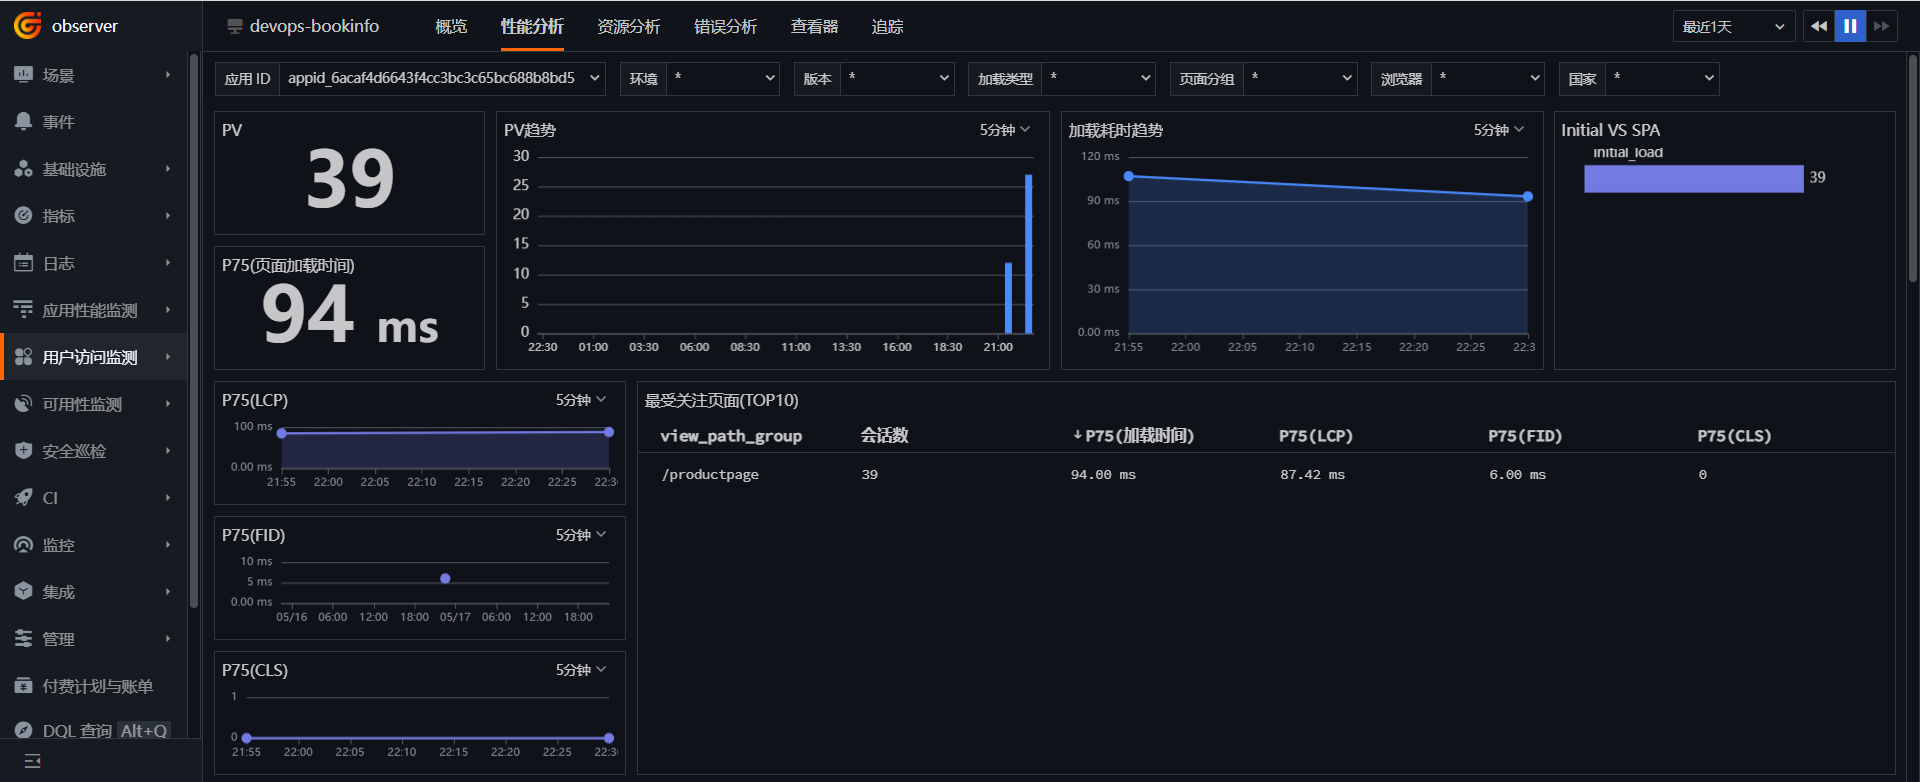
性能分析
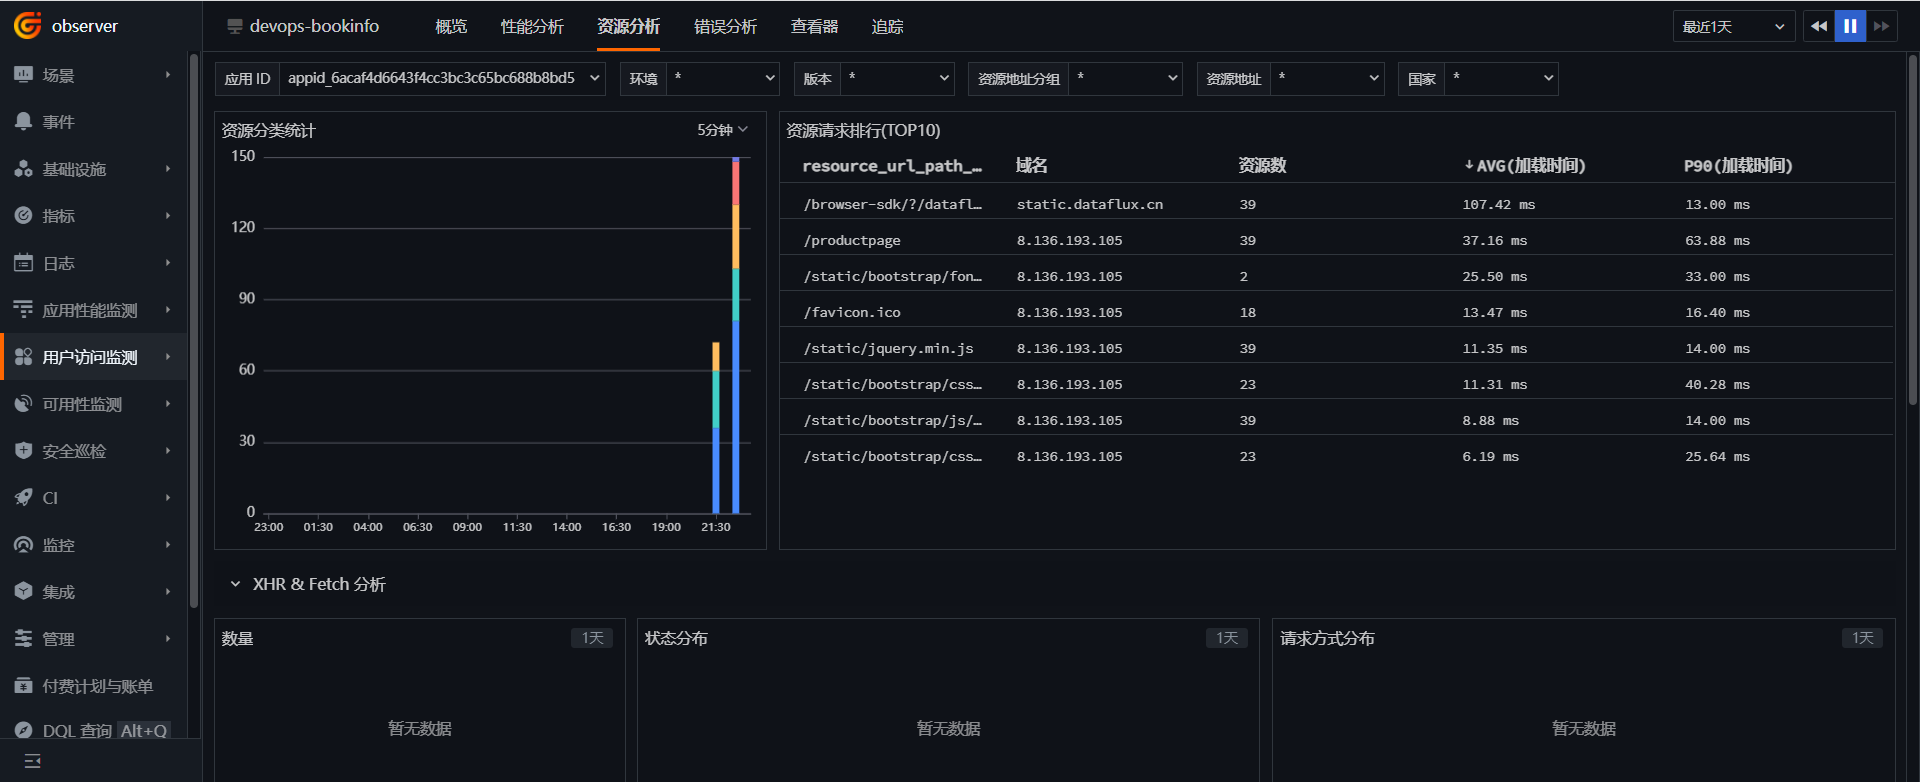
资源分析
步骤 6 日志可观测
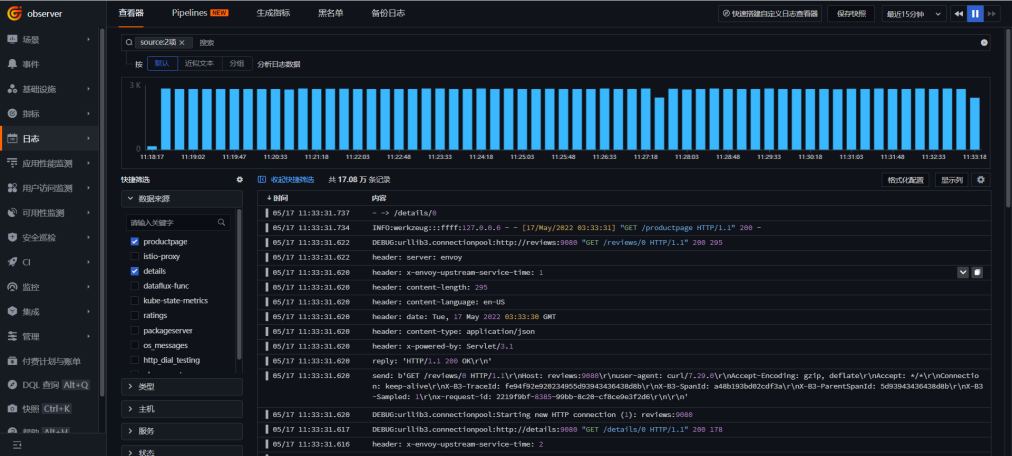
根据部署 datakit 时的配置,默认采集输出到 /dev/stdout 的日志。 登录「 观测云」,进入「日志」,查看日志信息。此外观测云还提供了 RUM、APM 和日志直接的联动功能,请参考官方文档做相应的配置。
步骤 7 Gitlab CI 可观测
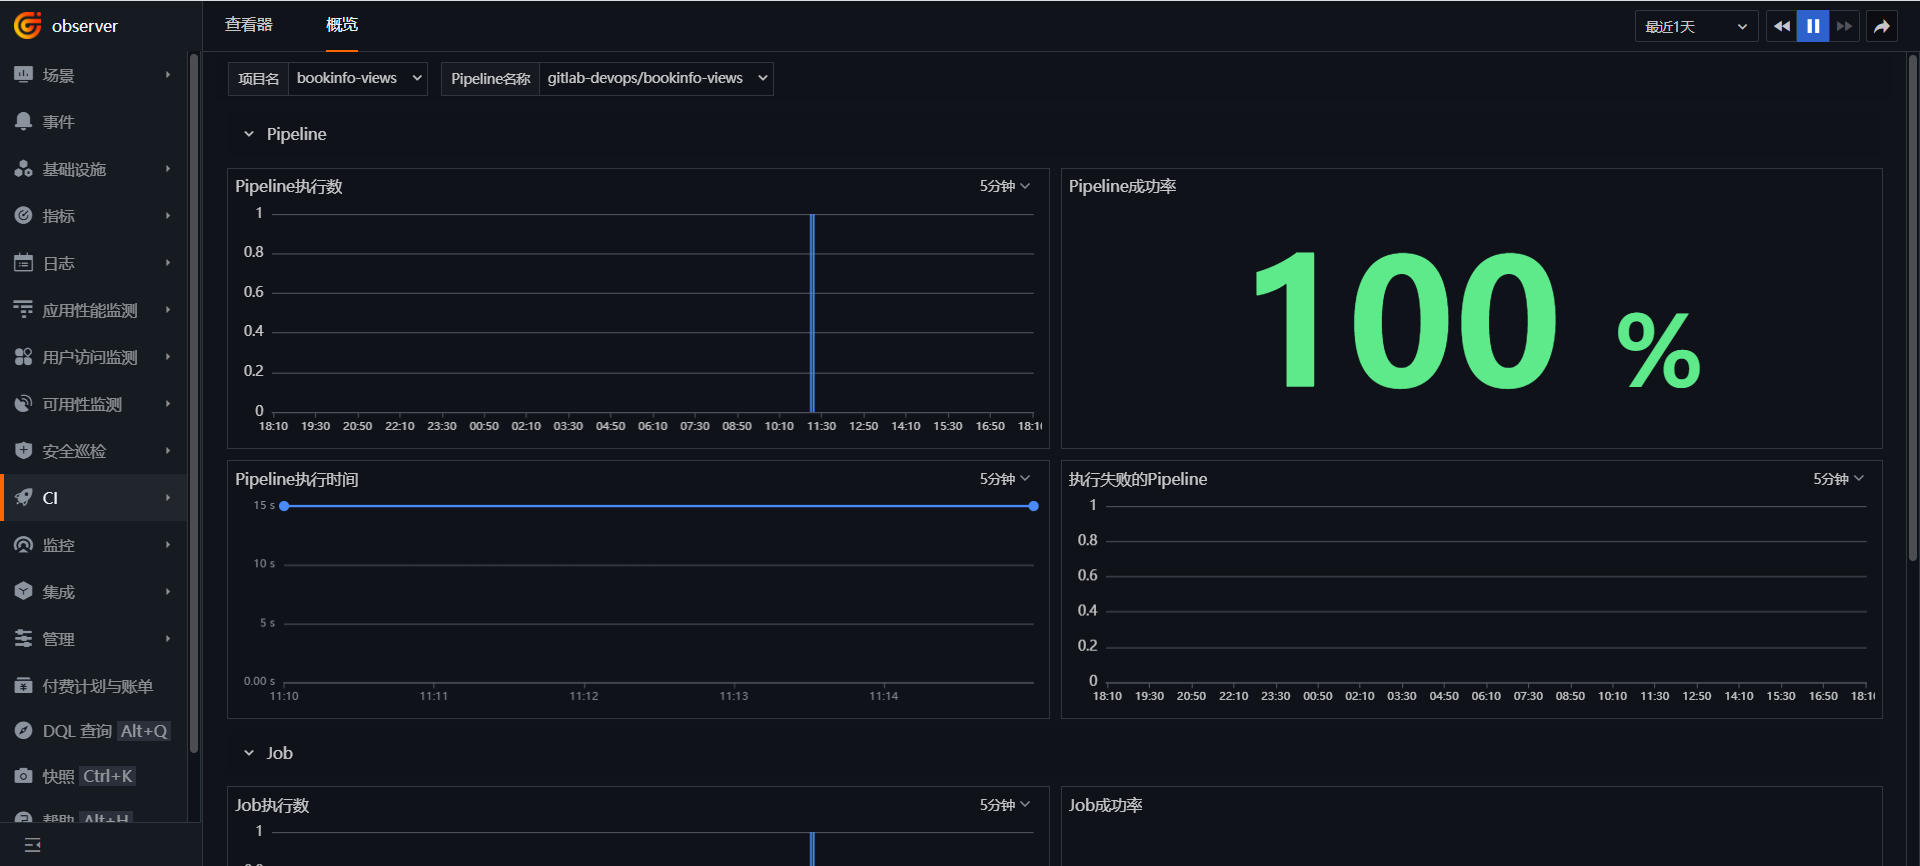
登录「观测云」,进入「CI」,点击「概览」选择 bookinfo-views 项目,查看 Pipeline 和 Job 的执行情况。
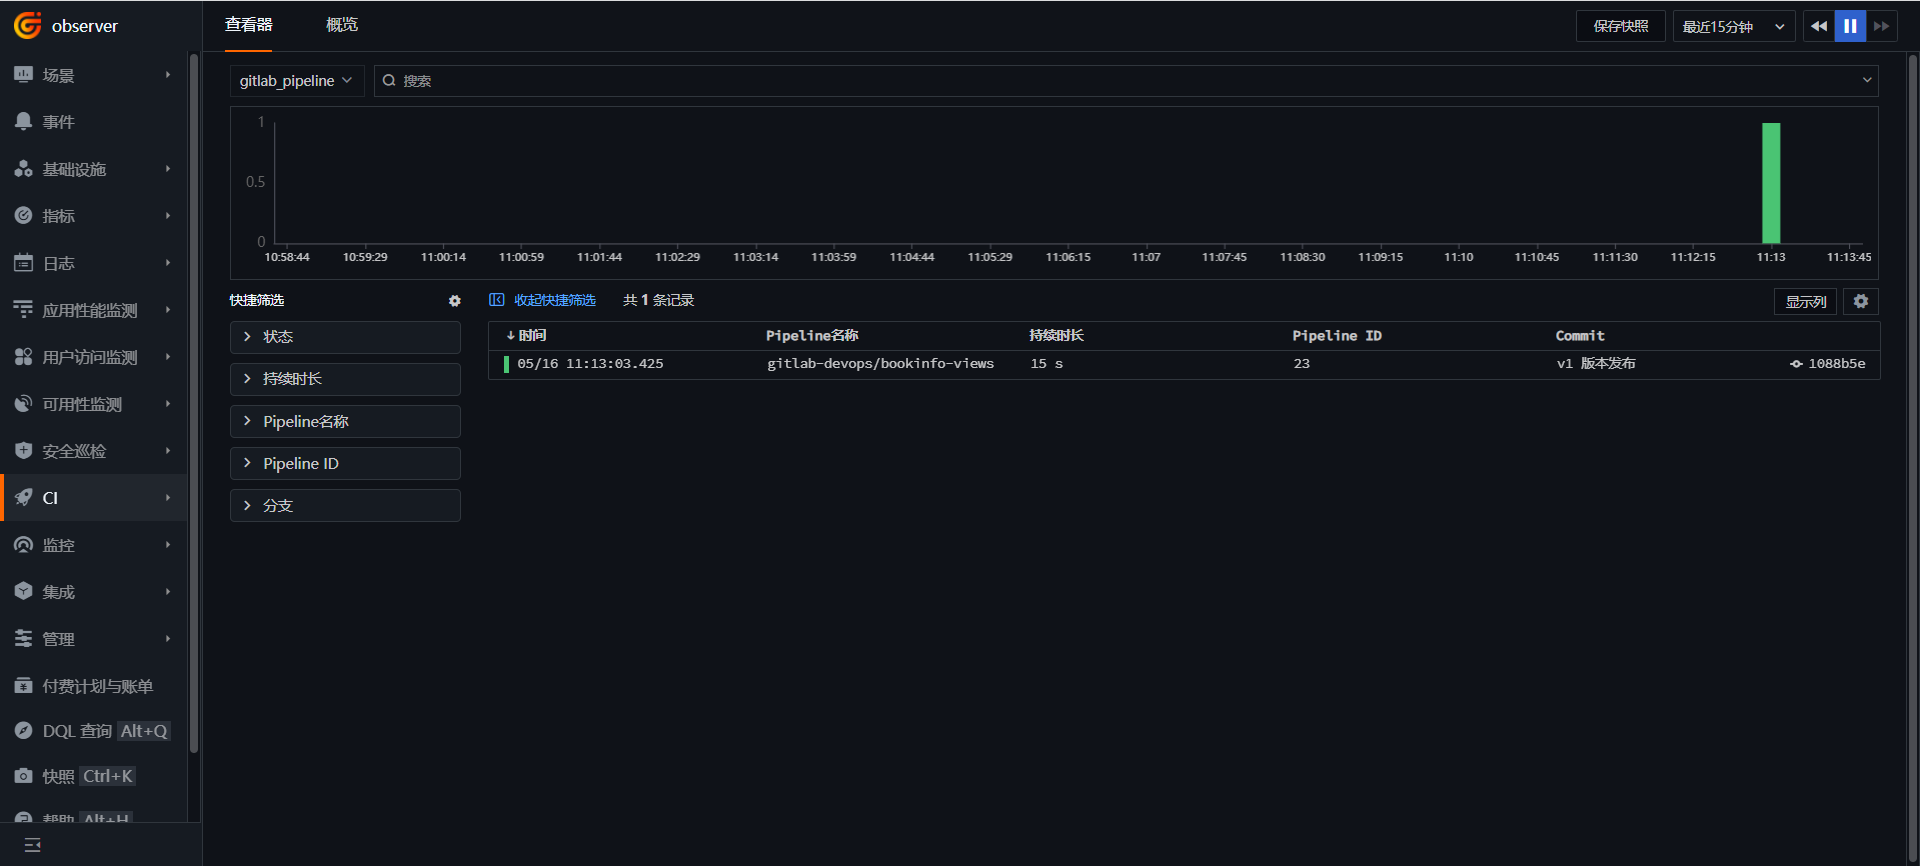
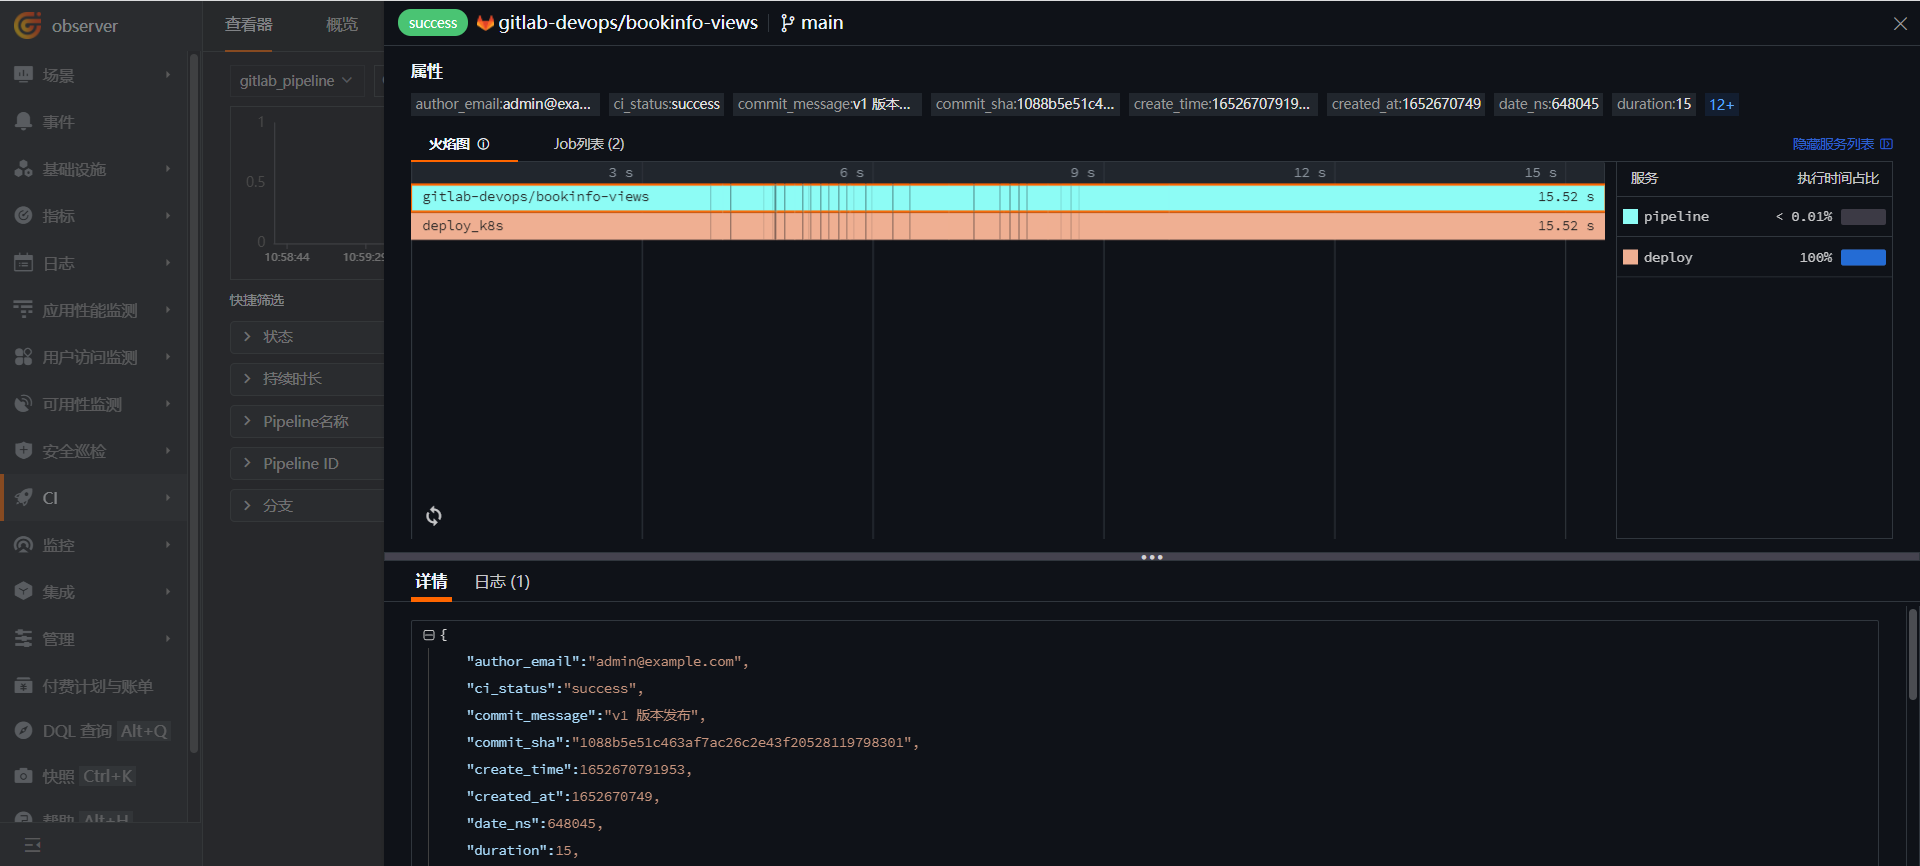
进入「CI」,点击「查看器」,选择 gitlab_pipeline。
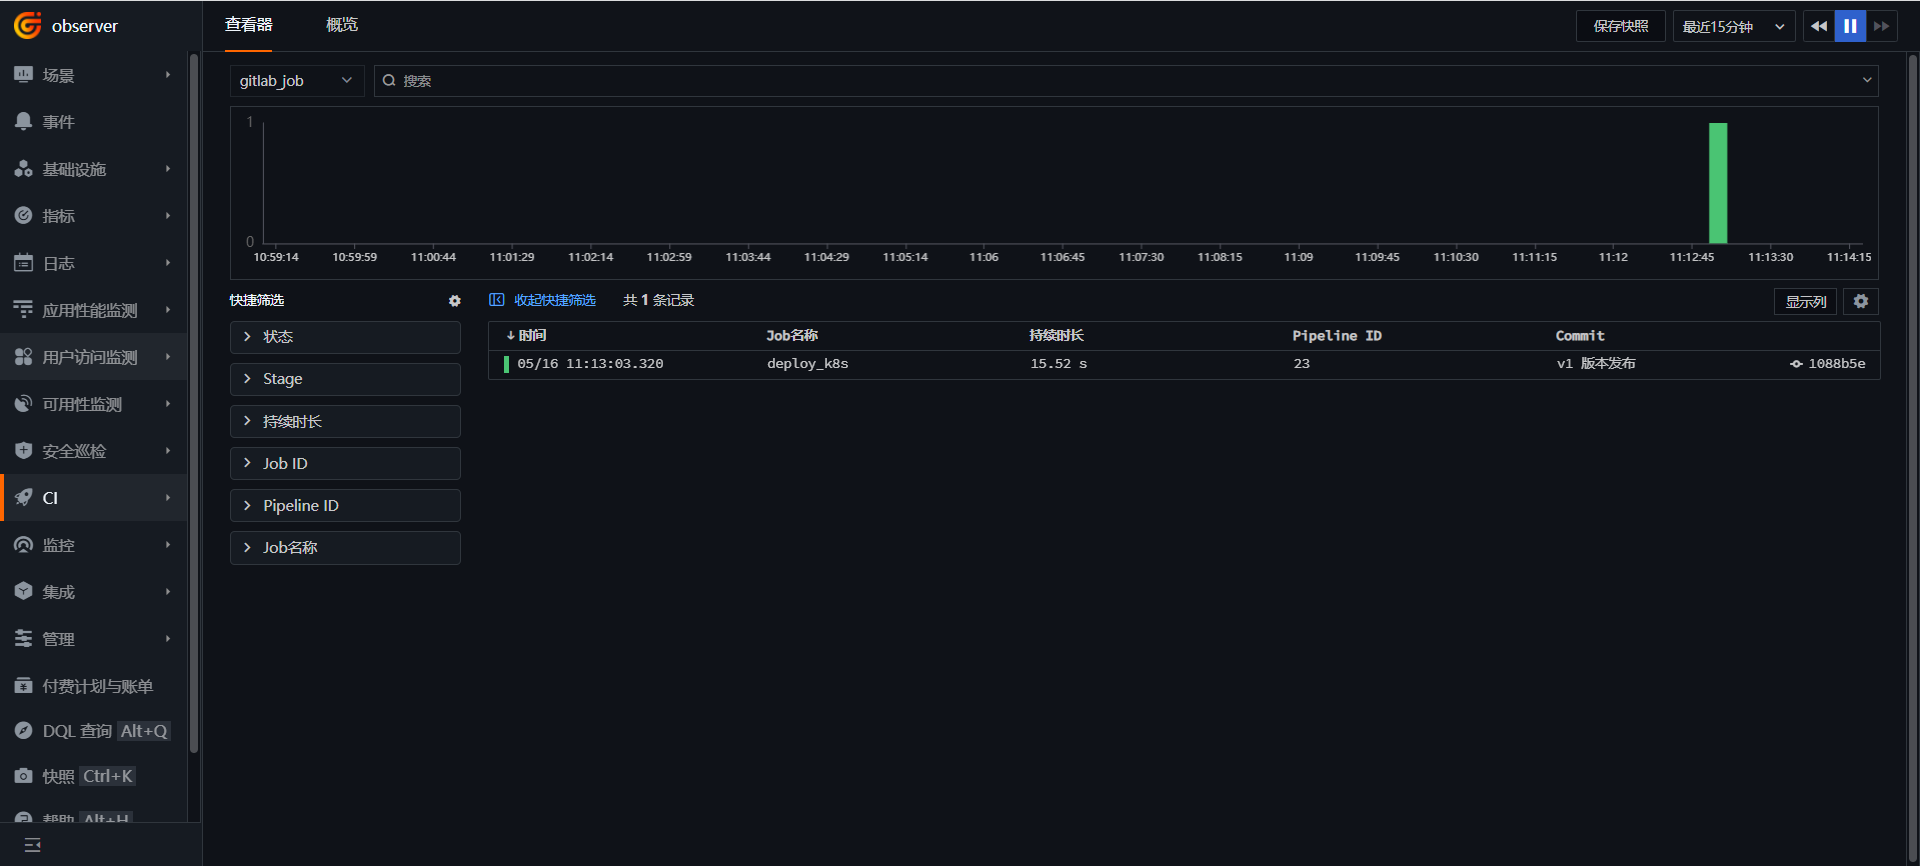
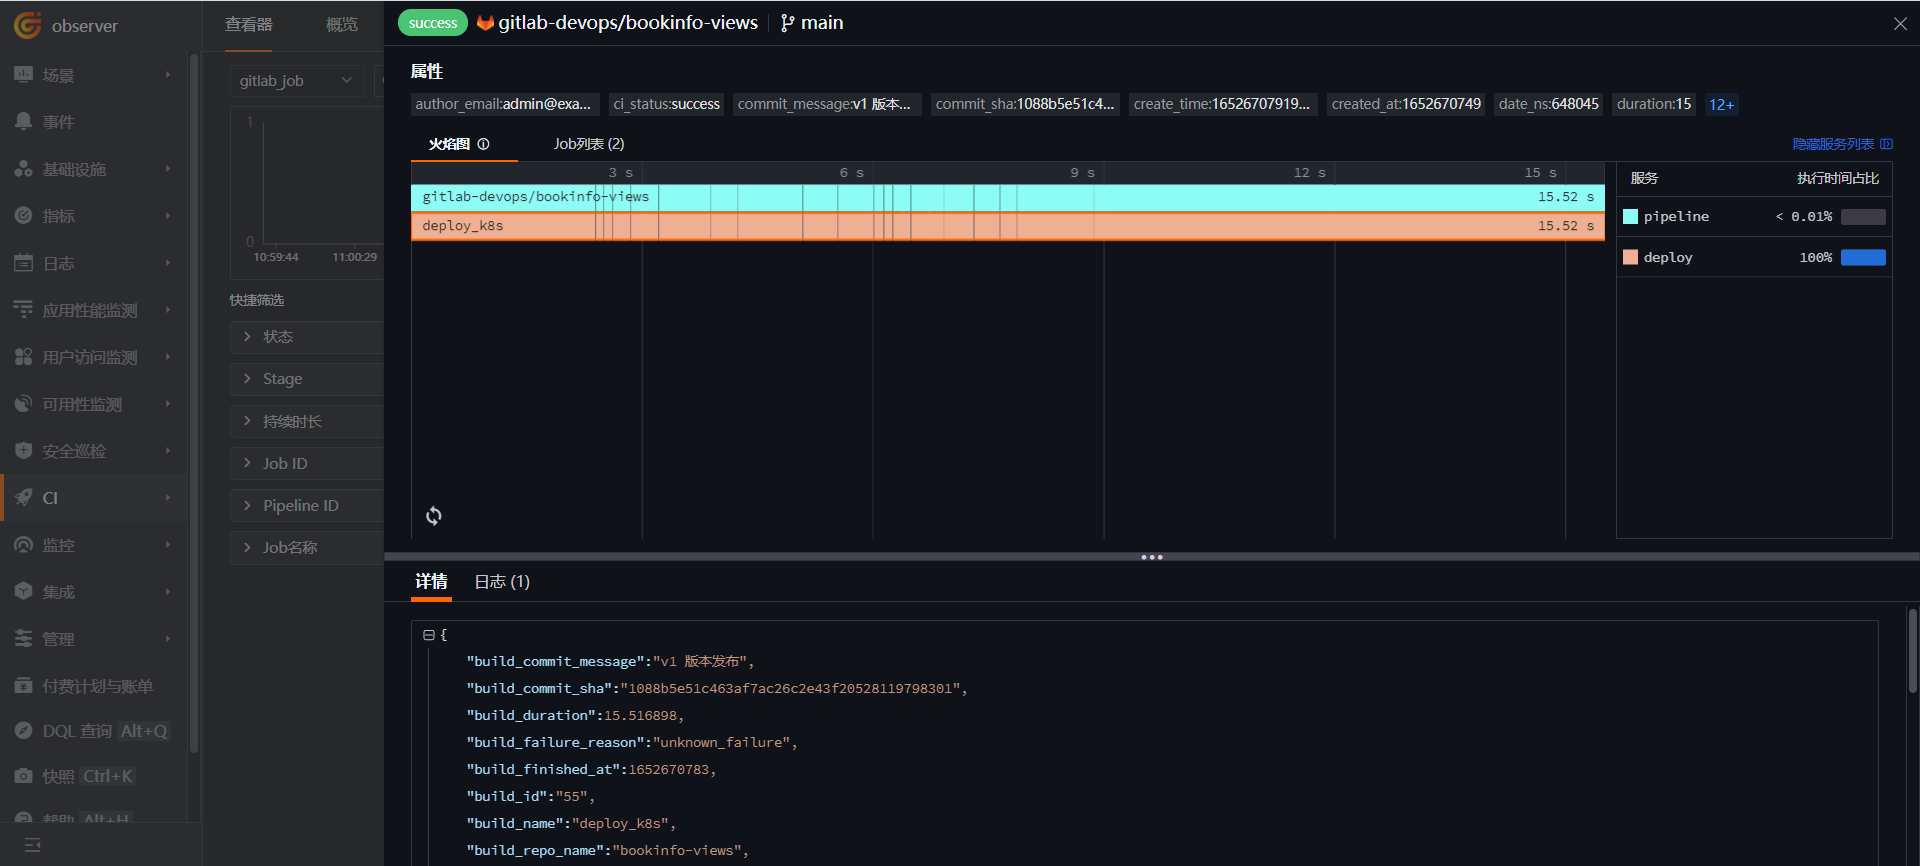
进入「CI」,点击「查看器」,选择 gitlab_job。
步骤 8: 金丝雀发布可观测
操作步骤是先创建 DestinationRule 和 VirtualService,把流量只流向 reviews-v1 版本,发布 reviews-v2,切 10% 流量到 reviews-v2,通过观测云验证通过后,把流量完全切到 reviews-v2,下线 reviews-v1。
8.1 创建 DestinationRule
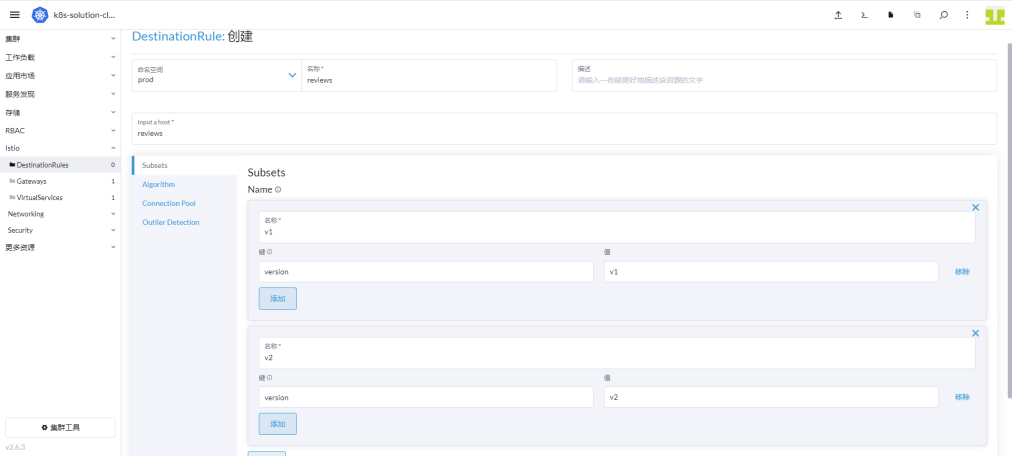
登录「Rancher」 - 「集群」 - 「Istio」 - 「DestinationRule」,点击「创建」。
命名空间天「prod」,名称填「reviews」,Input a host 填「reviews」,添加 「Subset v1」 和 「Subset v2」,详细信息如下图,最后点击「创建」。
8.2 创建 VirtualService
登录「Rancher」 - 「集群」 - 「Istio」 - 「VirtualServices」,点击上方的「导入 YAML」图标,输入如下内容后,点击「导入」。
apiVersion: networking.istio.io/v1alpha3
kind: VirtualService
metadata:
  name: reviews
  namespace: prod
spec:
  hosts:
    - reviews
  http:
    - route:
        - destination:
            host: reviews
            subset: v1
8.3 发布 reviews-v2 版本
登录「gitlab」,找到 bookinfo-views 项目, 修改 .gitlab-ci.yml 文件中的 APP_VERSION 的值为 v2,提交一次代码。
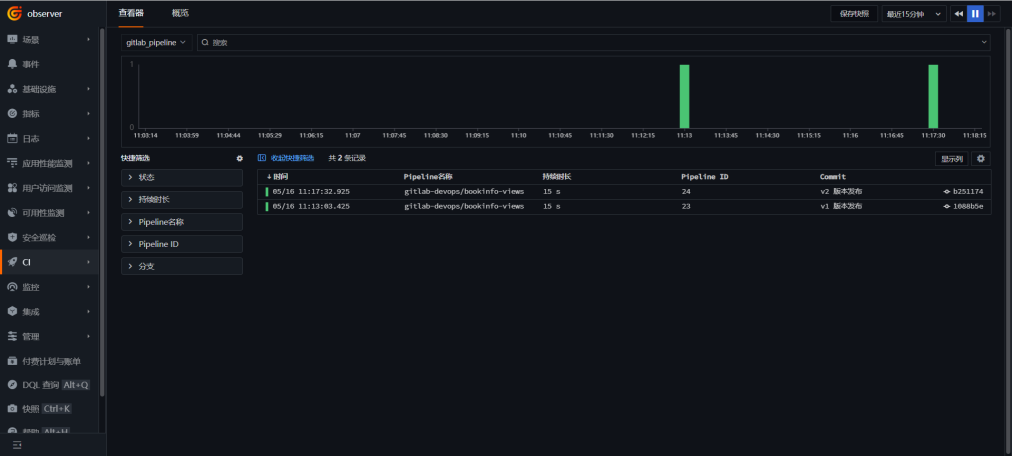
登录「观测云」,进入「CI」->「查看器」,可以看到 v2 版本已发布。
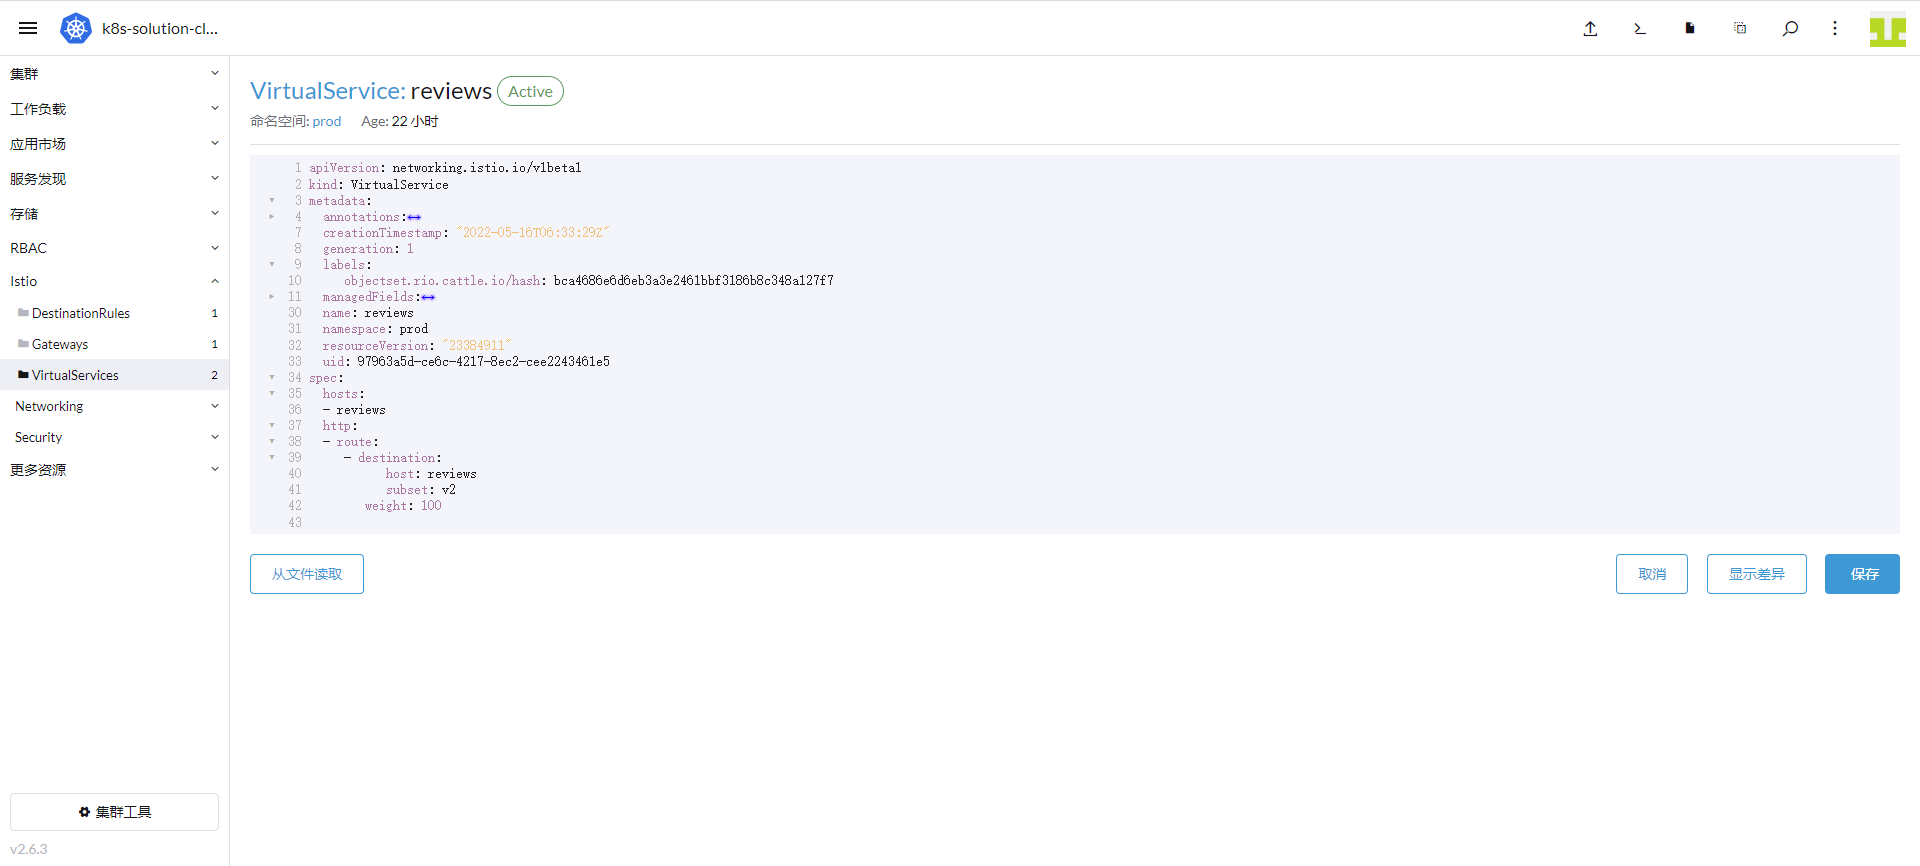
8.4 切换流量到 reviews-v2 版本
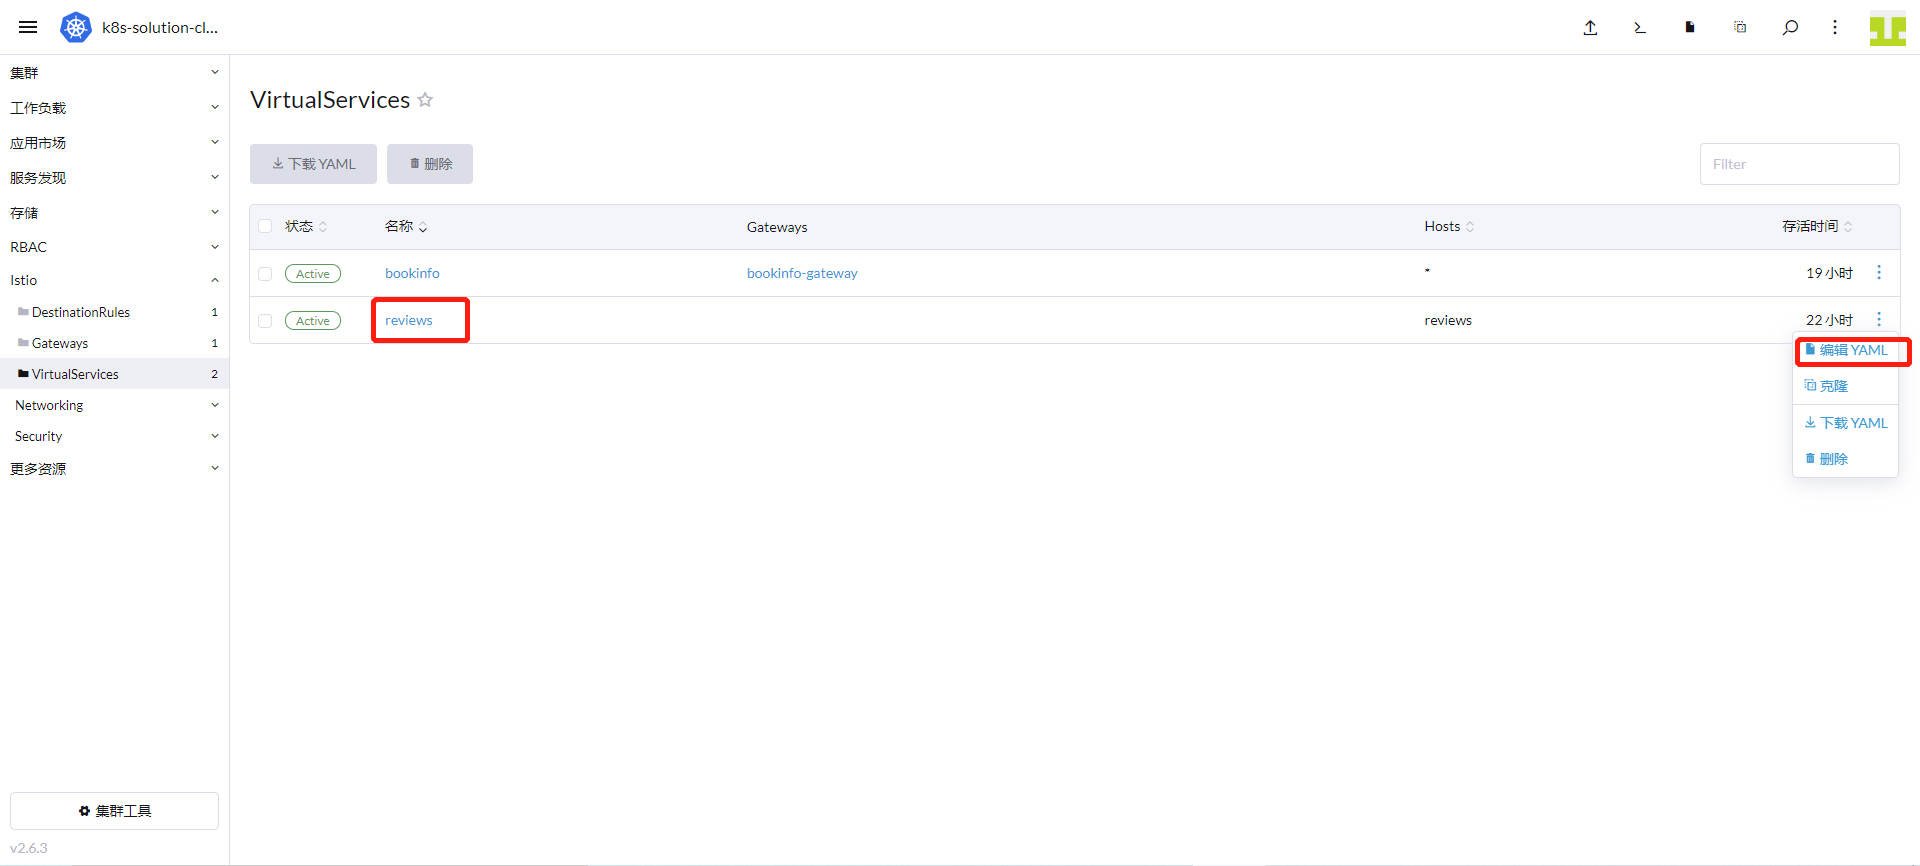
「Rancher」 - 「集群」 - 「Istio」 - 「VirtualServices」,点击 reviews 右边的「编辑 YAML」。
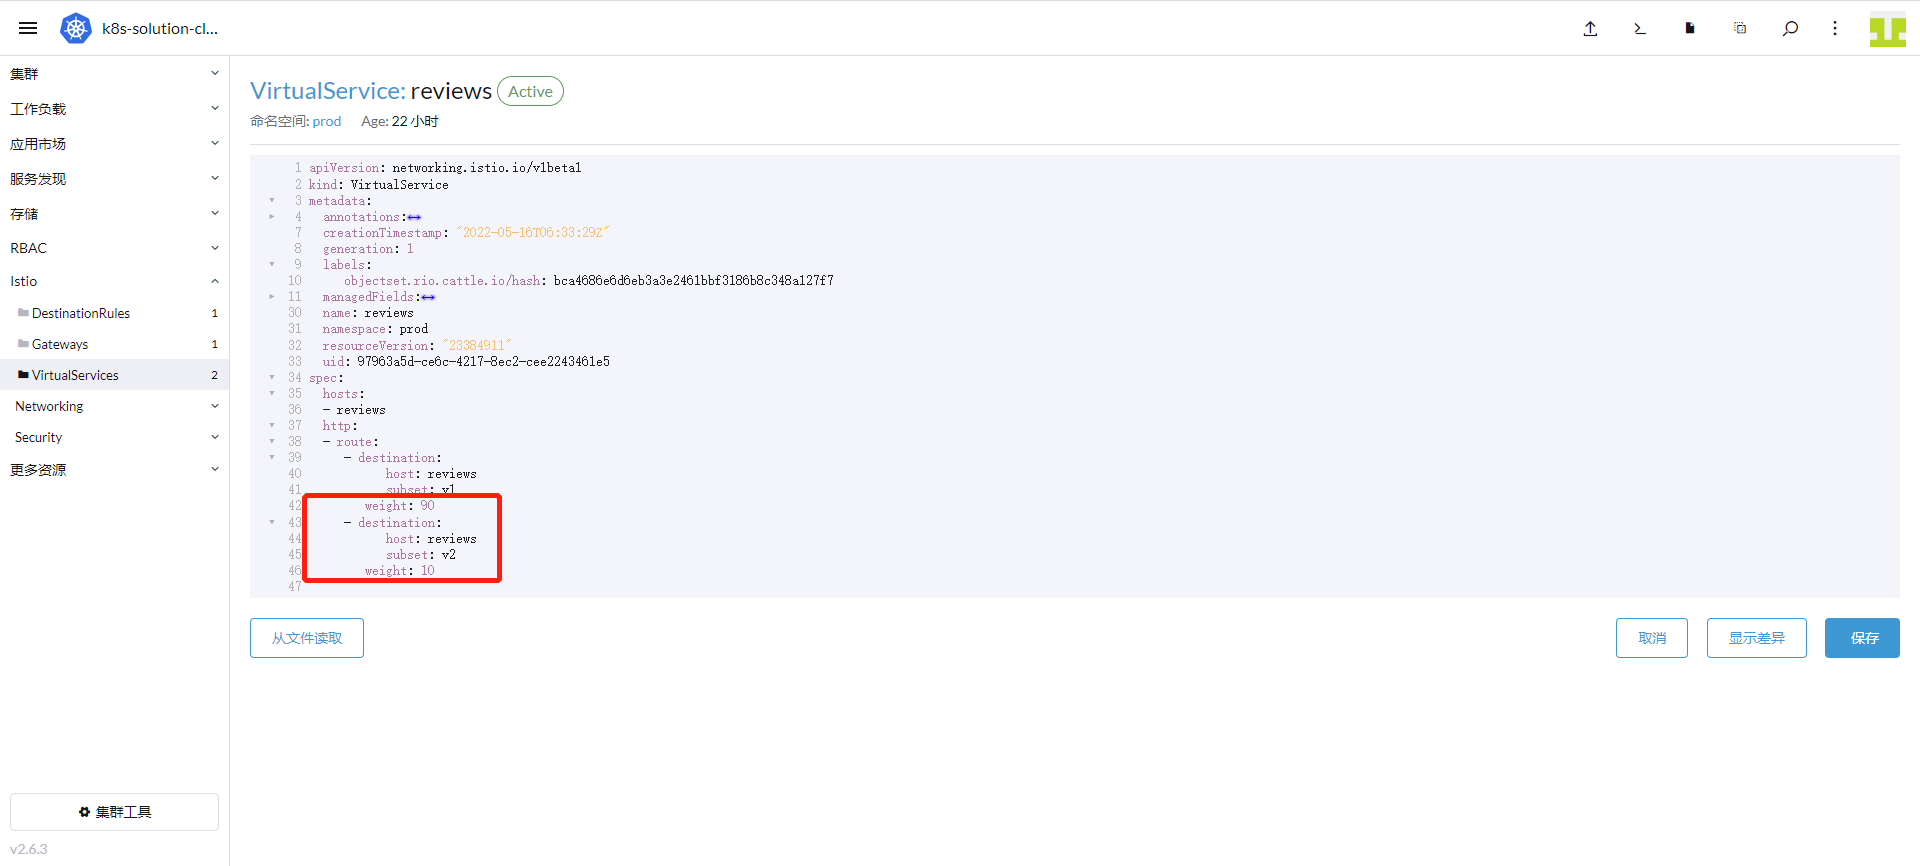
增加 v1 的权重是 90,v2 的权重是 10,最后点击“保存”。
8.5 观测 reviews-v2 运行情况
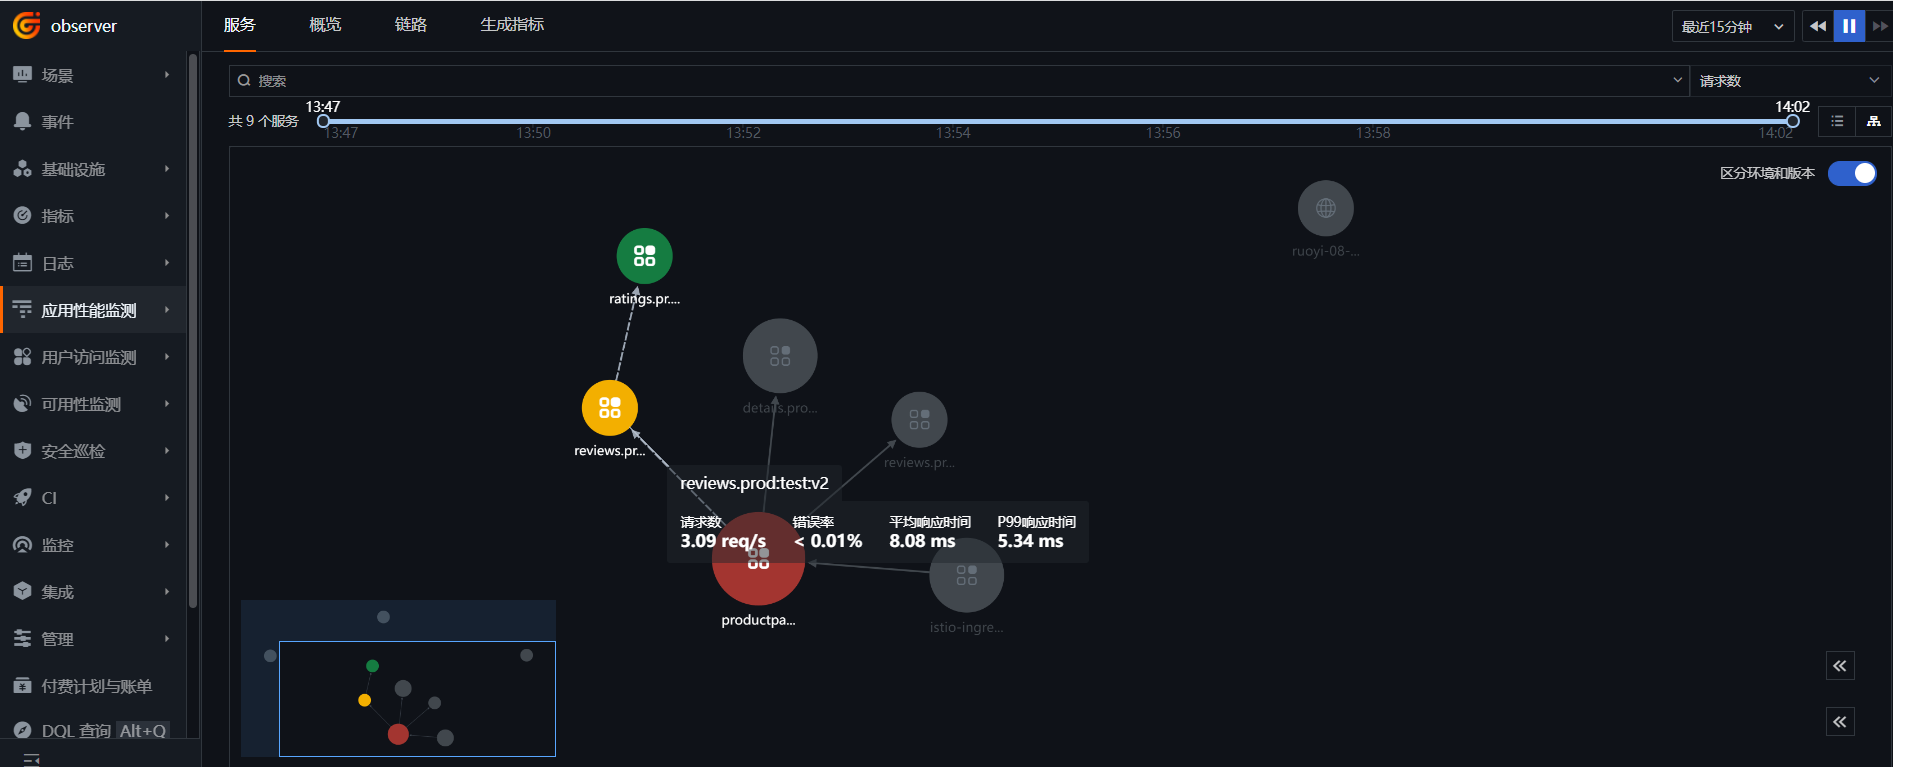
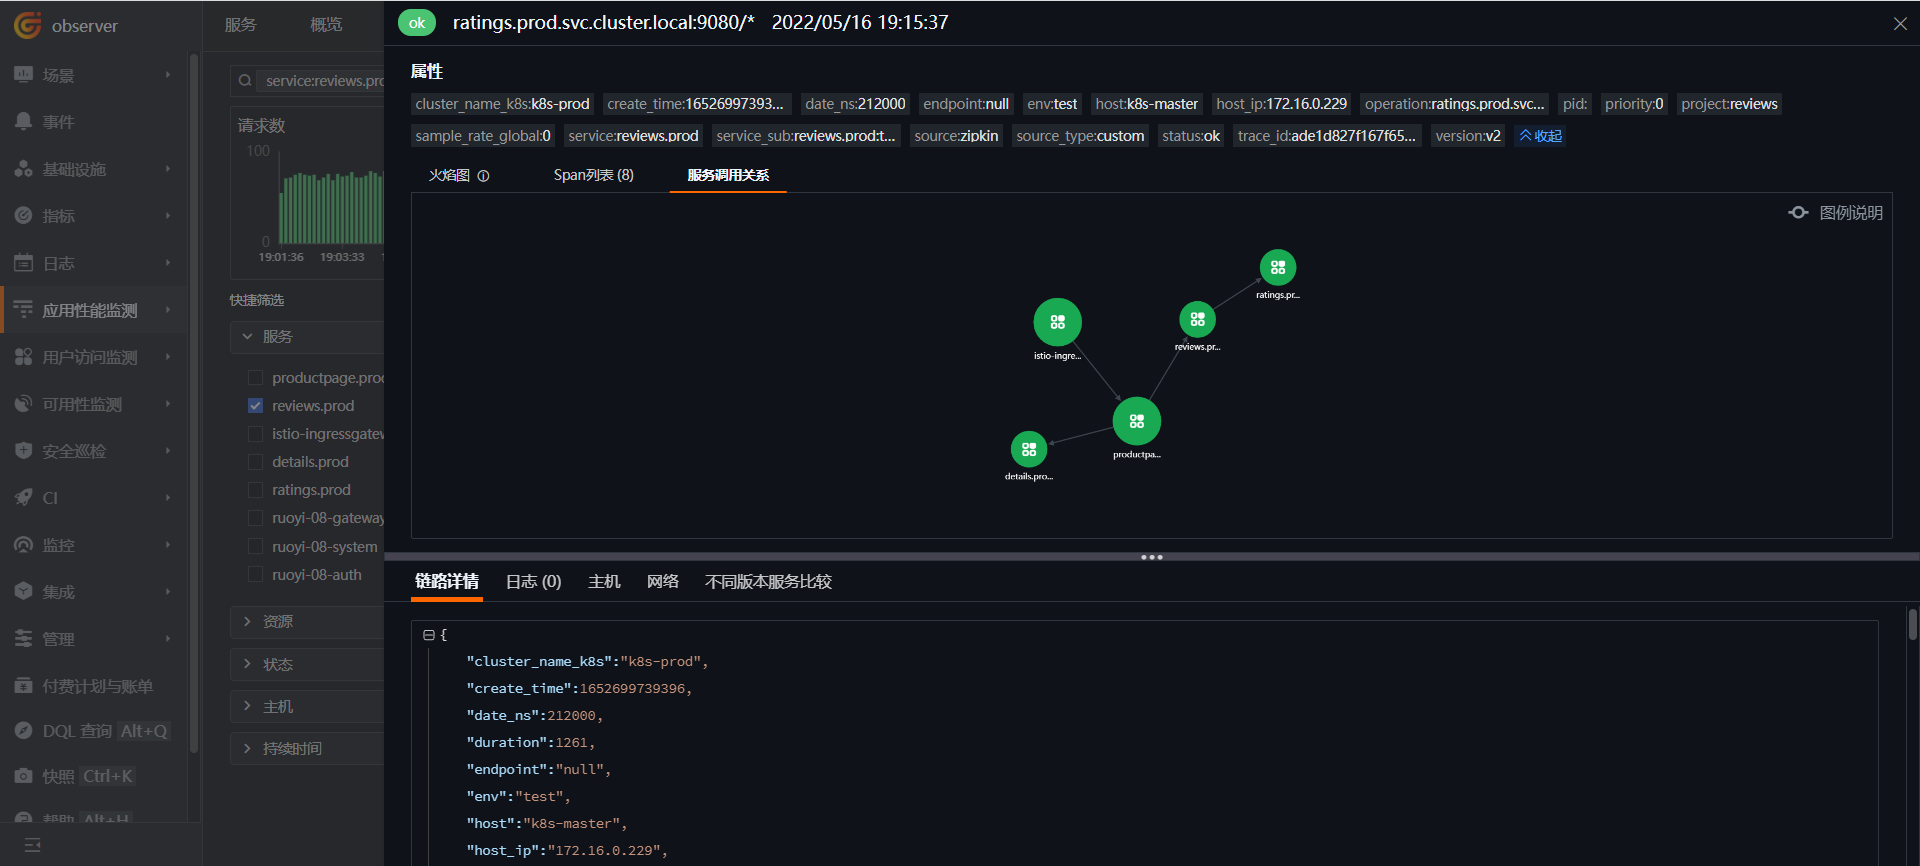
登录「观测云」,进入「应用性能监测」模块,点击右上方的图标。

打开「区分环境和版本」,查看 bookinfo 的调用拓扑图。
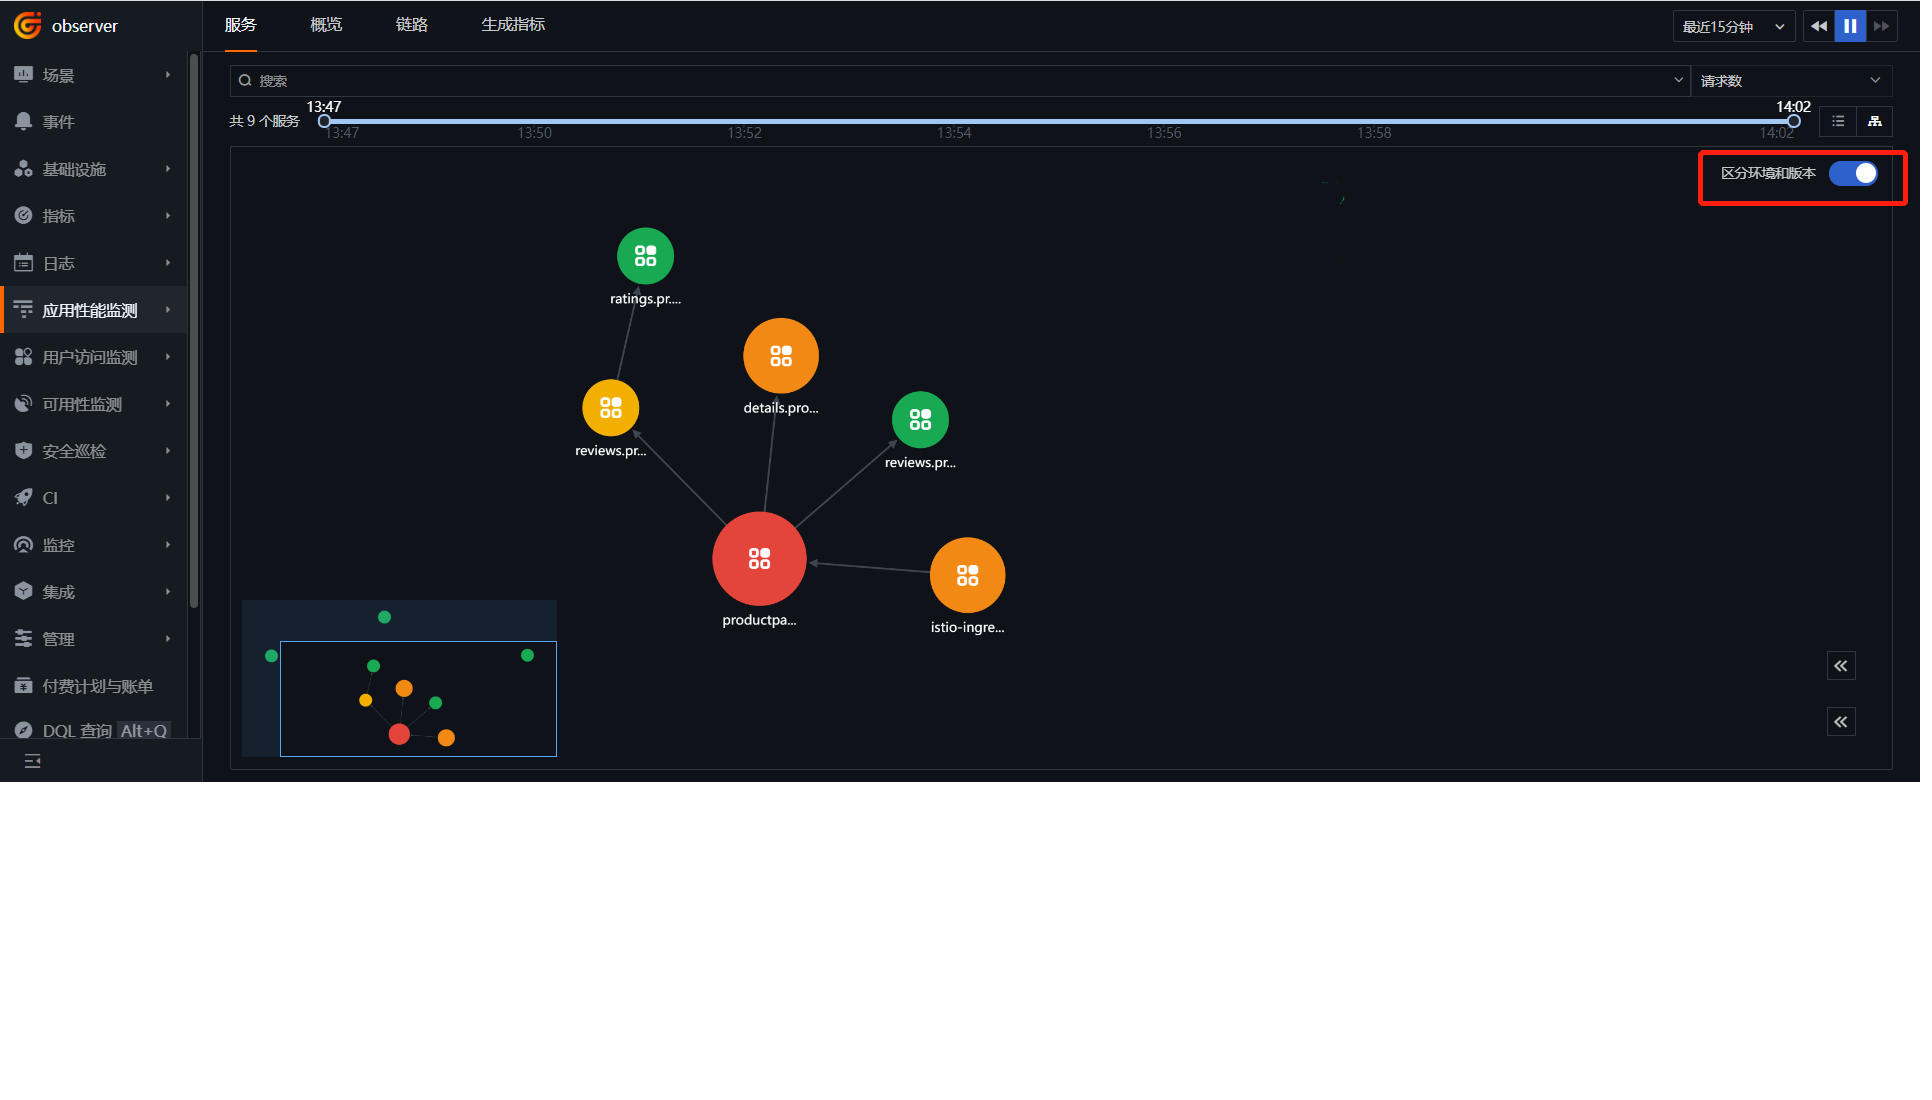
鼠标点击 reviews-v2 上,可以看到是 v2 在连 ratings,而 reviews-v1 并不调用 ratings。
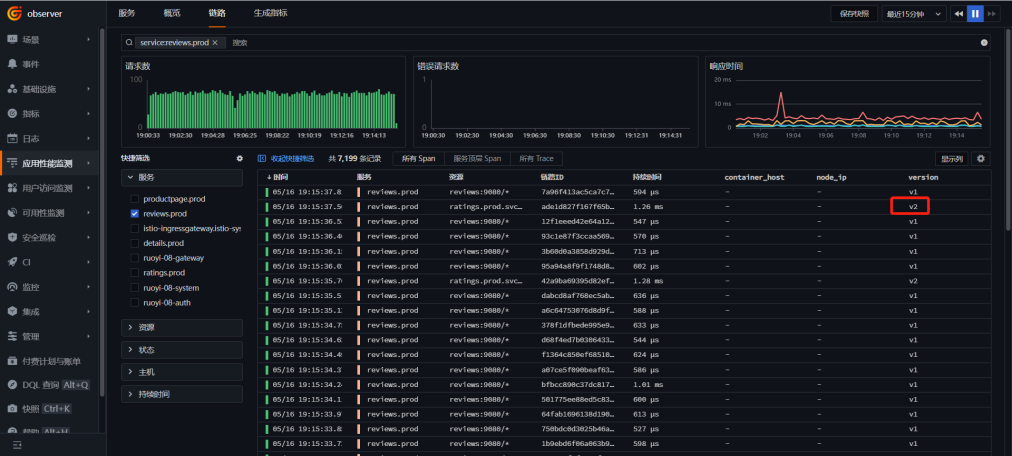
点击「链路」,选择「reviews.prod」服务,点击进入一个带“v2”版本的链路。
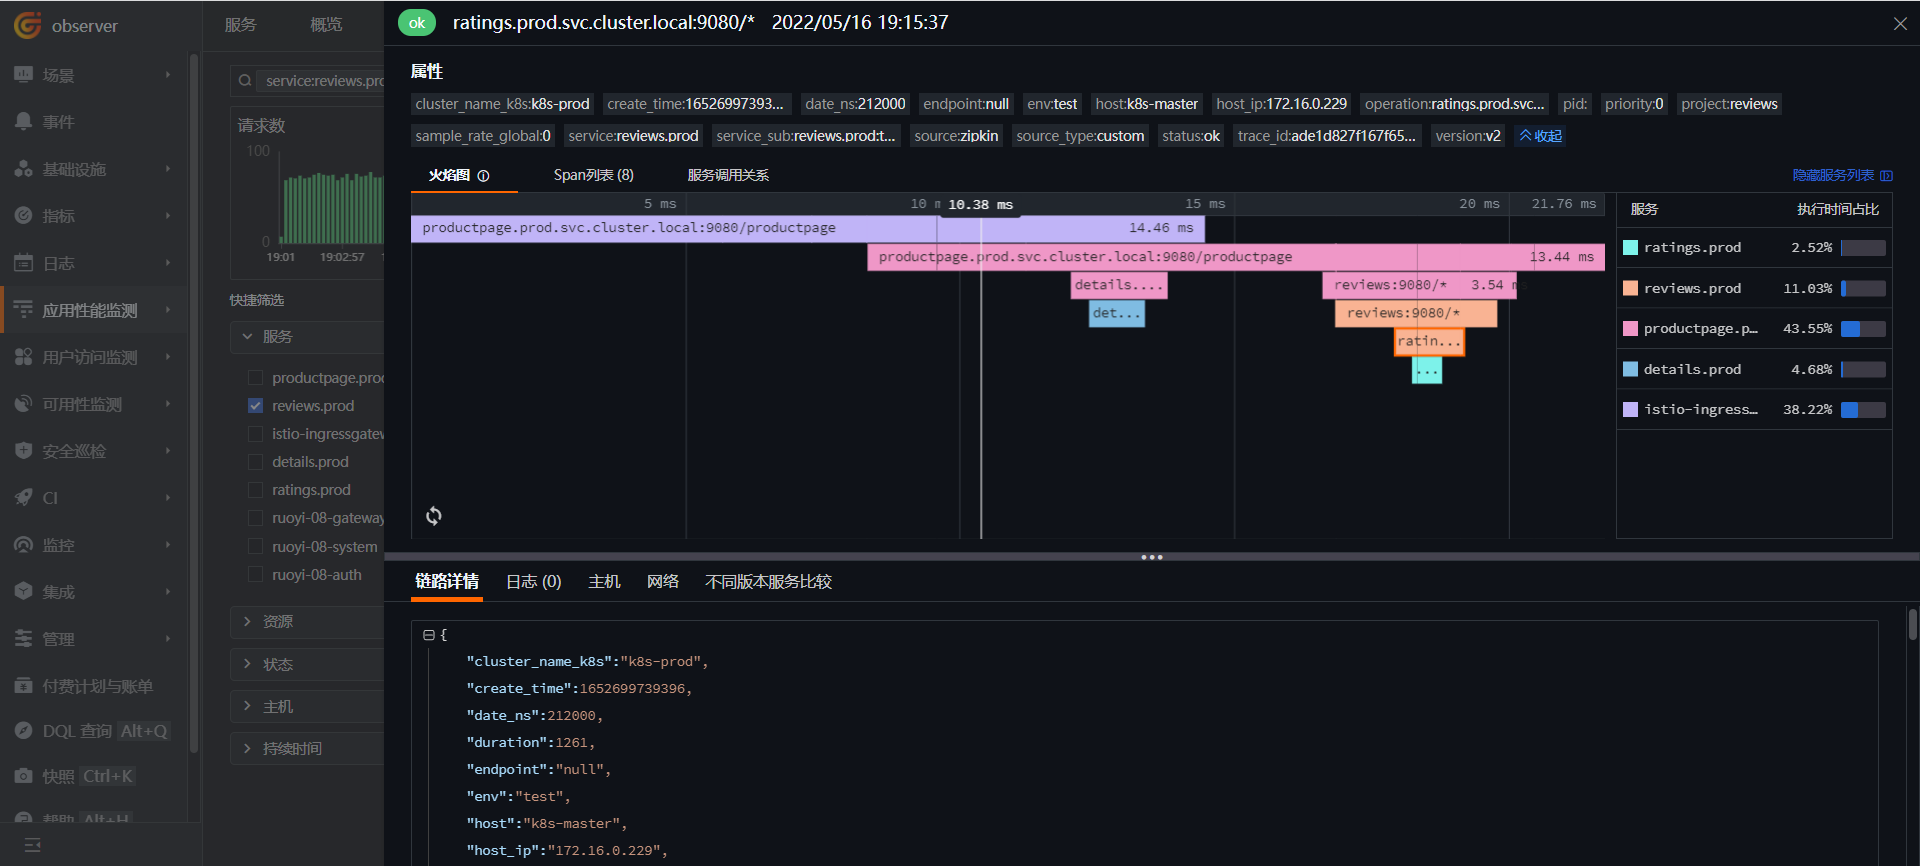
查看火焰图。
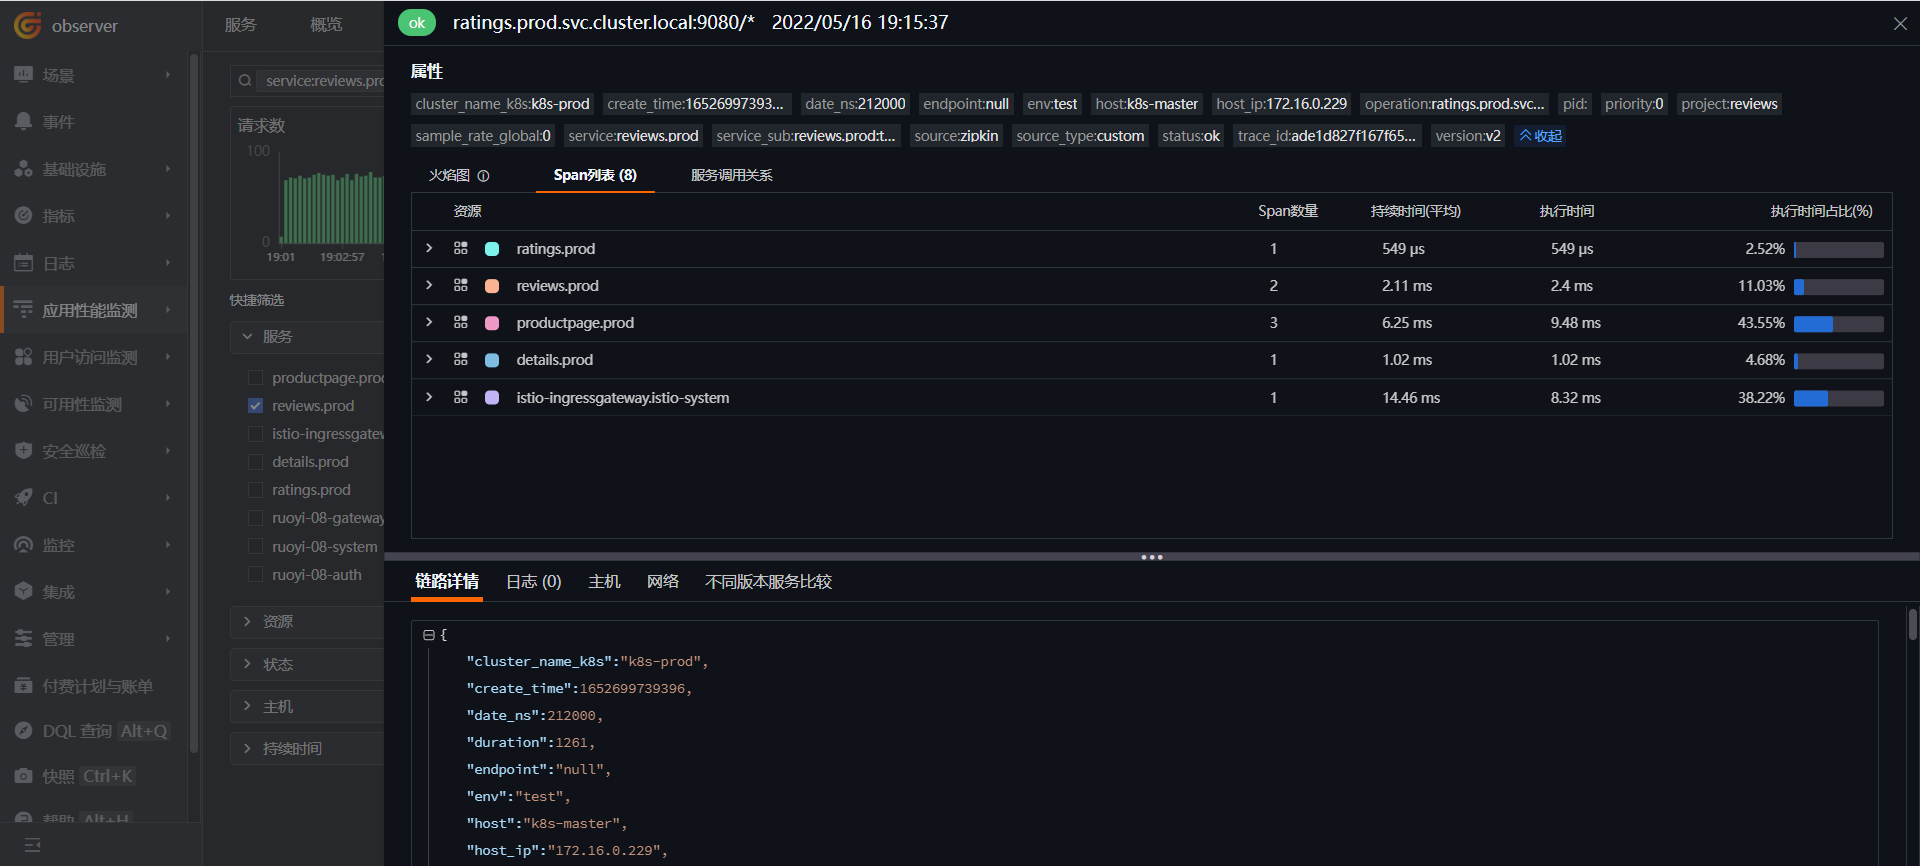
查看 Span 列表。
查看服务调用关系。
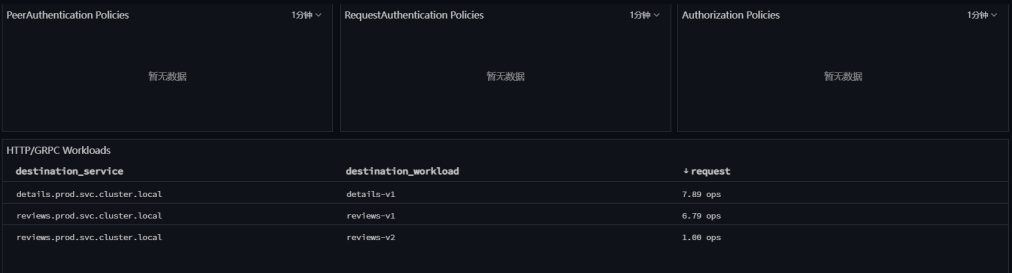
在 Istio Mesh 监控视图里面也可以看到服务的调用情况,v1、v2 版本的流量基本是 9:1。
8.6 完成发布
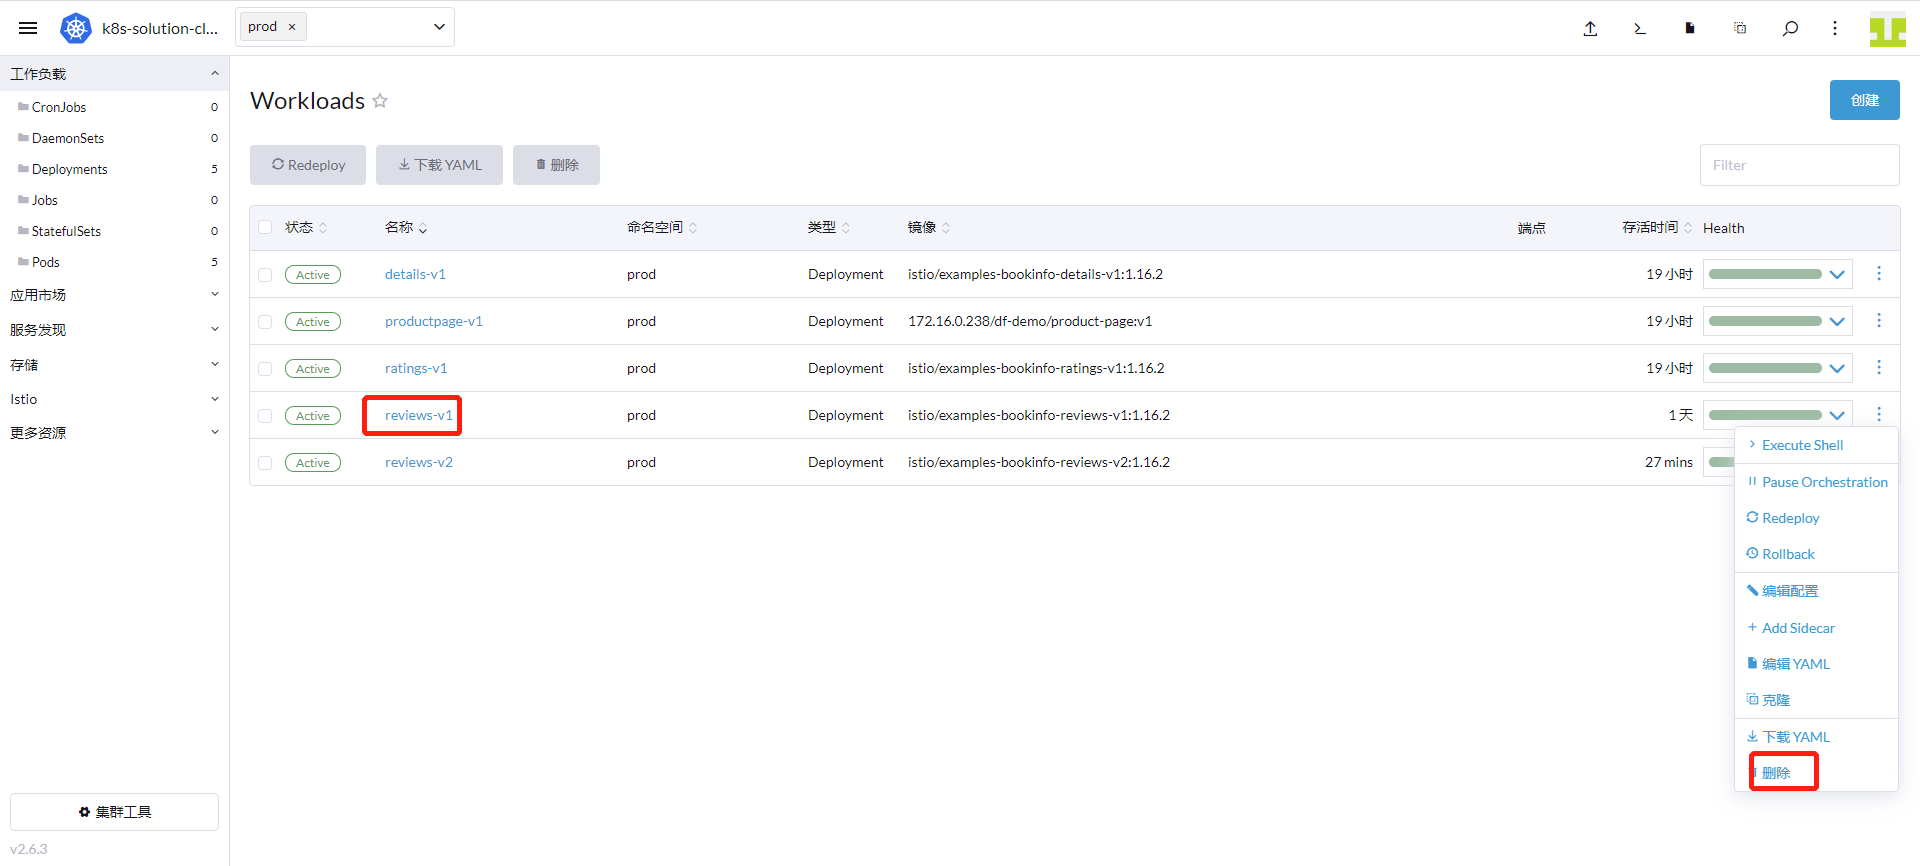
通过在观测云的操作,本次发布符合预期。「Rancher」 - 「集群」 - 「Istio」 - 「VirtualServices」,点击 reviews 右边的「编辑 YAML」,把“v2”权重设置成 100,“v1”去掉,点击「保存」。
进入「集群」 - 「工作负载」->「Deployments」,找到 “reviews-v1” 点击「删除」。