APM Performance Check
Background
"Application Performance Monitoring" is based on the APM anomaly root cause analysis detector. It selects the service, resource, project, and env information to be monitored, and regularly performs intelligent inspections of application performance. Through the anomalies in application service Metrics, it automatically analyzes the upstream and downstream information of the service to confirm the root cause of the anomaly for that application.
Prerequisites
- Guance "Application Performance Monitoring" has already integrated applications
- Self-built DataFlux Func Guance Special Edition or enable DataFlux Func (Automata)
- In Guance "Management / API Key Management", create an API Key for operations
Note: If you consider using a cloud server for offline deployment of DataFlux Func, please ensure it's with the same operator and region as the current SaaS deployment of Guance Select Site.
Enable Inspection
In your self-hosted DataFlux Func, install the "Guance Self-built Inspection (APM Performance)" via the "Script Market" and configure the Guance API Key to complete the activation.
In the DataFlux Func Script Market, select the inspection scenario you want to activate, click to install, configure the Guance API Key and GuanceNode, then choose to deploy and start the script.

After the startup script deployment is successful, it will automatically create the startup script and automatic trigger configuration, which can be directly accessed through the link.

Configure Inspection
In the Guance studio monitoring - Intelligent Inspection module or in the automatically created startup script in DataFlux Func, configure the inspection conditions you wish to filter. You can refer to the following two configuration methods:
Configure Inspection in Guance
Enable/Disable
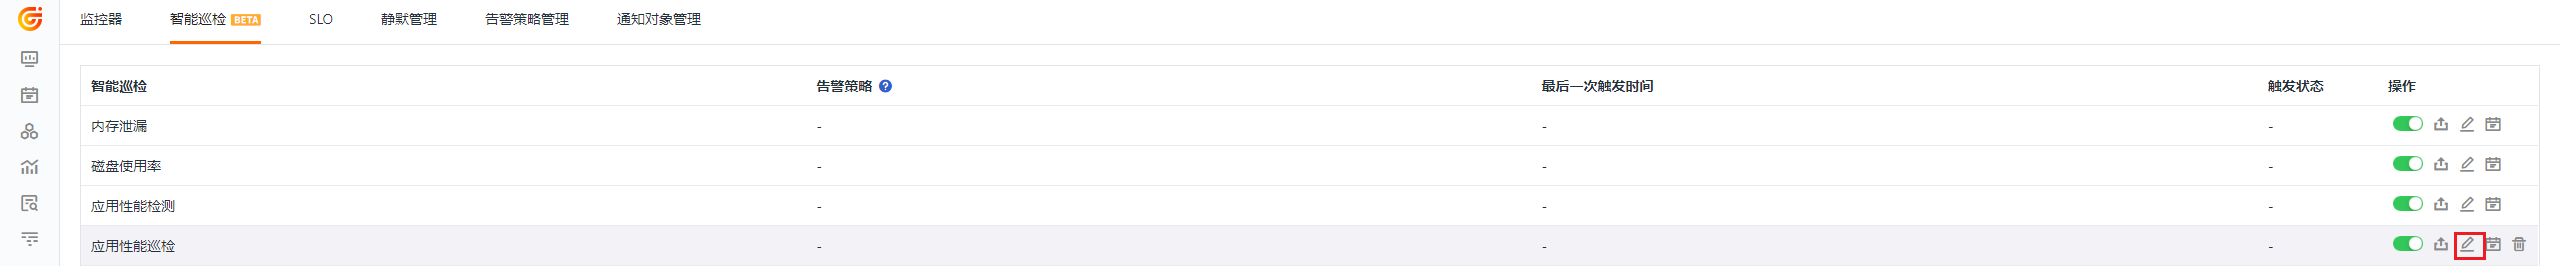
Application performance inspection is by default "Enabled". You can manually "Disable" it. After enabling, it will inspect the configured application performance monitoring.
Edit
The "Application Performance Inspection" under Intelligent Inspection supports users to manually add filtering conditions. Under the operation menu on the right side of the intelligent inspection list, click the Edit button to edit the inspection template.
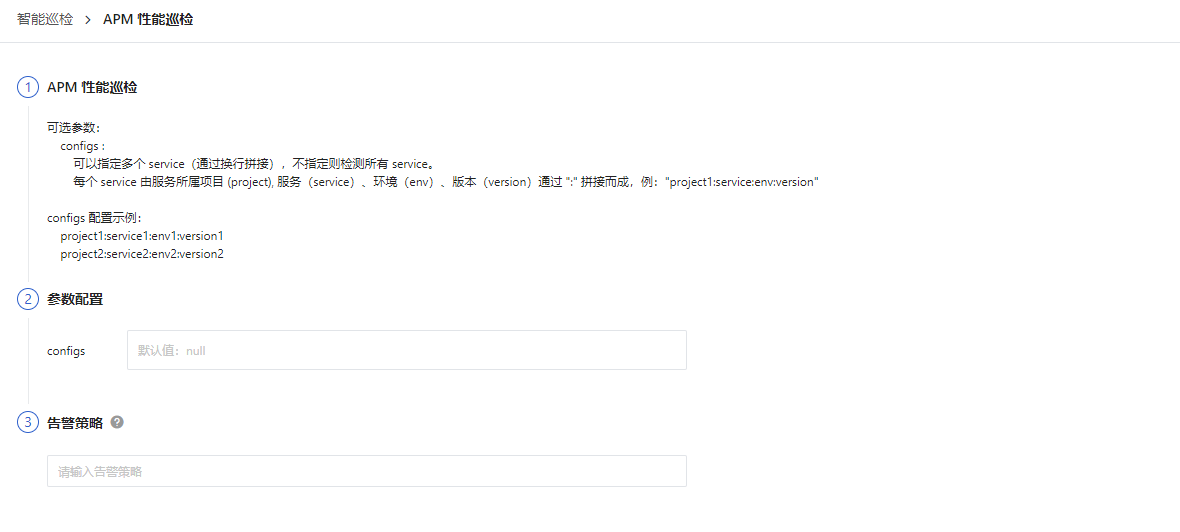
- Filtering Conditions: Configure the project of the application service, including service (service), environment (env), version (version) concatenated with ":".
- Alert Notifications: Supports selecting and editing alert strategies, including event levels to notify, notification targets, and alert silence periods.
After clicking edit in the parameter configuration entry, fill in the corresponding detection objects and save to start the inspection:
You can reference the configuration of multiple projects, environments, versions, and services as follows:
 // Configuration Example:
configs are configured in toml format as follows:
        enabled_service = [
            "project1:service1:env1:version1",
            "project2:service2:env2:version2"
        ]

              # Specifies the services to be inspected, default is the entire workspace
        disabled_service = [
            "project2:service2:env2:version2"
        ]

              # Specifies the error rate for services, default is 0
        [service_error_rate_threshold]
        "project1:service1:env1:version1"=0.1
        "project2:service2:env2:version2"=0.2

              # Specifies the p99 threshold for services, default is 15s
        [service_p99_threshold]
        "project1:service1:env1:version1"=15000000
        "project2:service2:env2:version2"=90000000
Note: In the self-hosted DataFlux Func, when writing custom inspection handling functions, you can also add filtering conditions (refer to example code configurations). Note that parameters configured in Guance studio will override those set in the custom inspection handling function.
Configure Inspection in DataFlux Func
In DataFlux Func, after configuring the necessary filtering conditions for inspection, you can directly select the run() method on the page to test it. After clicking publish, the script will execute normally. You can also view or modify the configuration in Guance "Monitoring / Intelligent Inspection".
from guance_monitor__register import self_hosted_monitor
from guance_monitor__runner import Runner
import guance_monitor_apm_performance__main as main

# Support for using filtering functions to filter the objects being inspected, for example:
def filter_project_servcie_sub(data):
    '''
    Filters project, service_sub, detecting objects that meet requirements, returning True if matched, False otherwise
    '''
    project = data['project']
    service_sub = data['service_sub']
    if service_sub in ['redis:dev:v1.0', 'mysql:dev:v1.0']:
        return True


@self_hosted_monitor(account['api_key_id'], account['api_key'])
@DFF.API('APM Performance Check', fixed_crontab='0 * * * *', timeout=900)
def run(configs=None):
    '''
    en:
        title: APM Performance Check
        doc: |
            Optional parameters:
                configs :
                    You can specify the detection service (enabled_service), otherwise all services will be detected.
                    You can specify the filtering service (disabled_service), and do not specify no filtering
                    You can set the p99 threshold (service_p99_threshold) and error rate threshold (service_error_rate_threshold) separately for services
                    Note: Each service by service belongs to the project (project), service (service), environment (env), version (version) by ":" patchwork, example: "project1: service: env: version"

                Example of configuring configs in toml format:

                    enabled_service = [
                        "project1:service1:env1:version1",
                        "project2:service2:env2:version2"
                    ]

                    disabled_service = [
                        "project1:service2:env2:version2",
                    ]

                    [service_error_rate_threshold]
                    "project1:service1:env1:version1"=0.1
                    "project2:service2:env2:version2"=0.2

                    [service_p99_threshold]
                    "project1:service1:env1:version1"=15000000
                    "project2:service2:env2:version2"=90000000
    '''

    checkers = [
        main.APMCheck(configs=configs)
    ]

    Runner(checkers).run_v2()
View Events
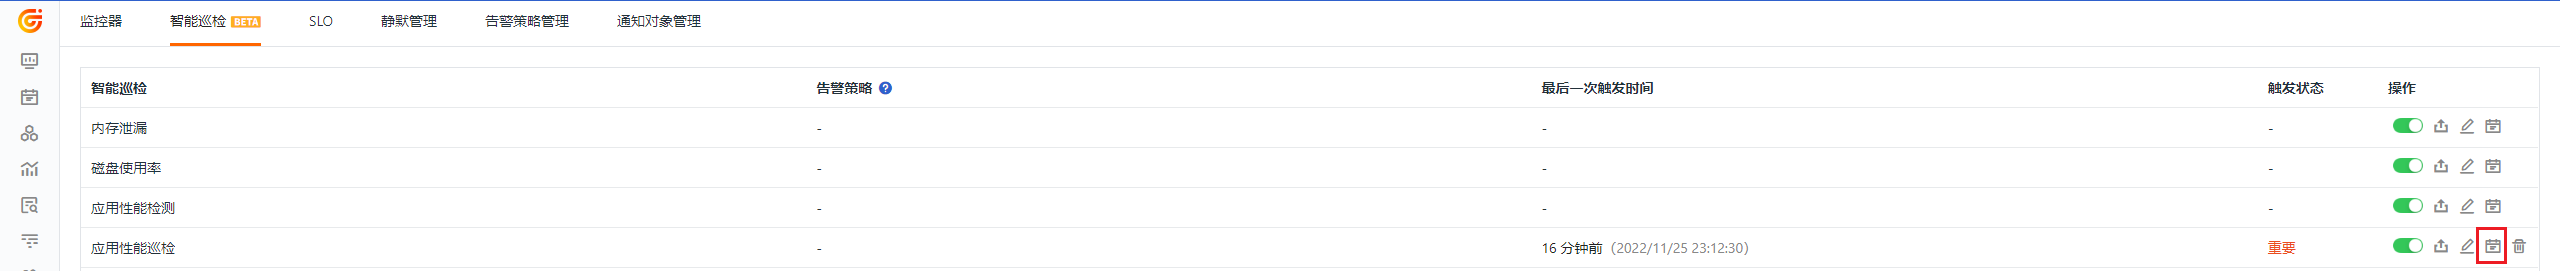
Intelligent inspection based on Guance inspection algorithms will look for anomalies in APM Metrics, such as sudden anomalies in resources. For anomalies, intelligent inspection will generate corresponding events. Under the operation menu on the right side of the intelligent inspection list, click the View Related Events button to view corresponding abnormal events.
Event Details Page
Clicking Event, you can view the details page of the intelligent inspection event, including event status, time of anomaly occurrence, anomaly name, basic attributes, event details, alert notifications, history records, and related events.
- Clicking the small icon in the top-right corner of the details page labeled "View Monitor Configuration" allows you to view and edit the configuration details of the current intelligent inspection.
Basic Attributes
- Detection Dimensions: Based on the filtering conditions configured for intelligent inspection, supports copying detection dimensions
key/value, adding to filters, and viewing related logs, containers, processes, security checks, traces, user access monitoring, availability monitoring, and CI data. - Extended Attributes: After selecting extended attributes, supports copying in
key/valueform, forward/reverse filtering.
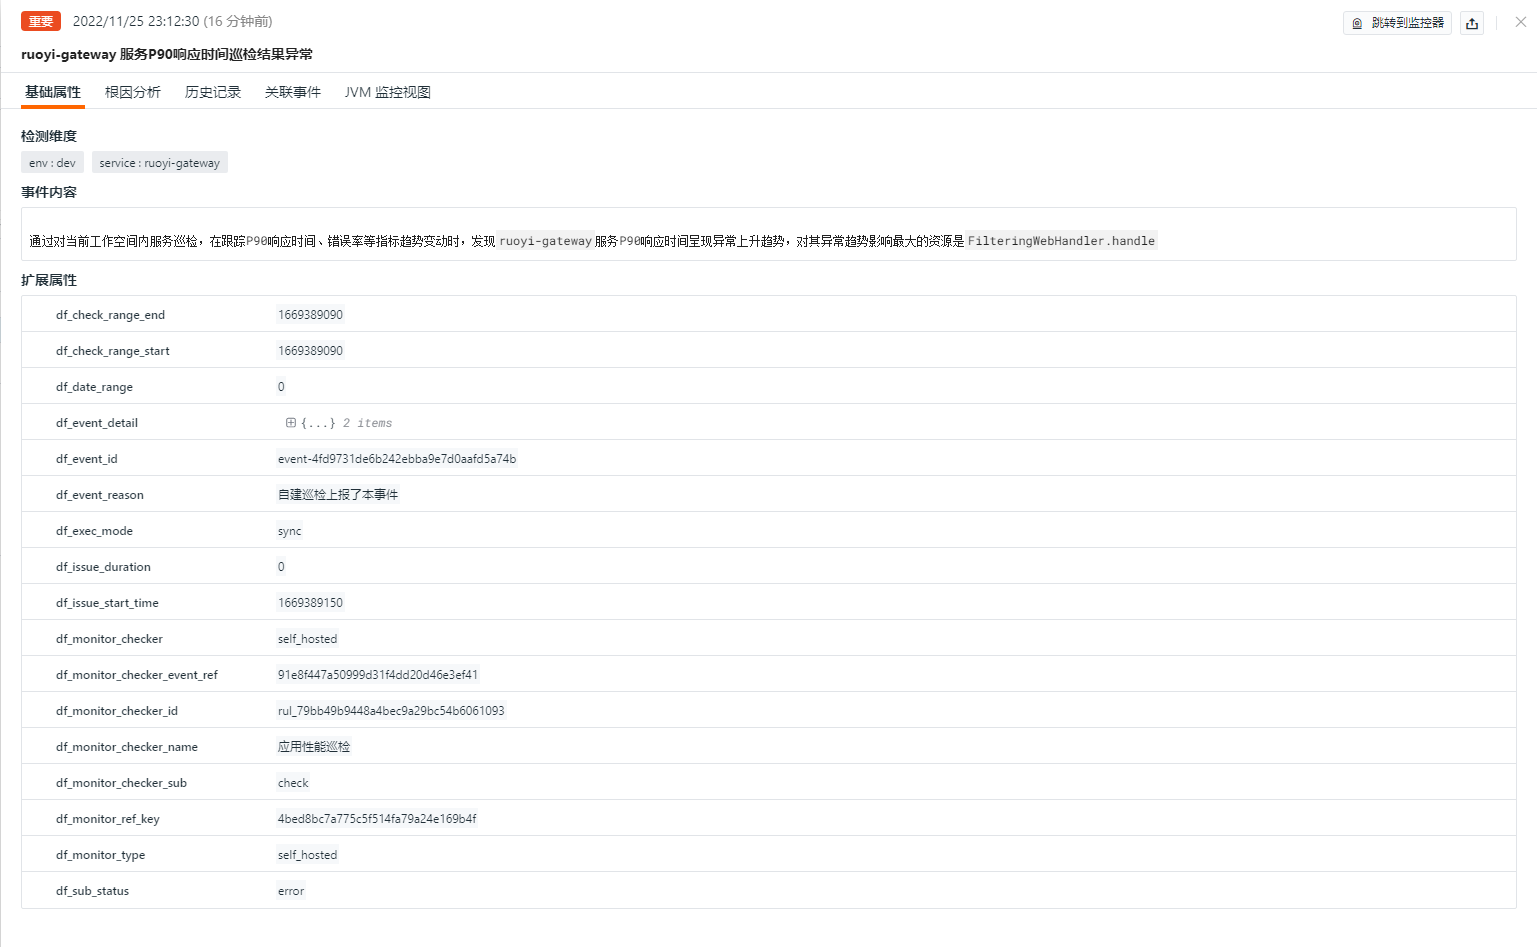
Event Details
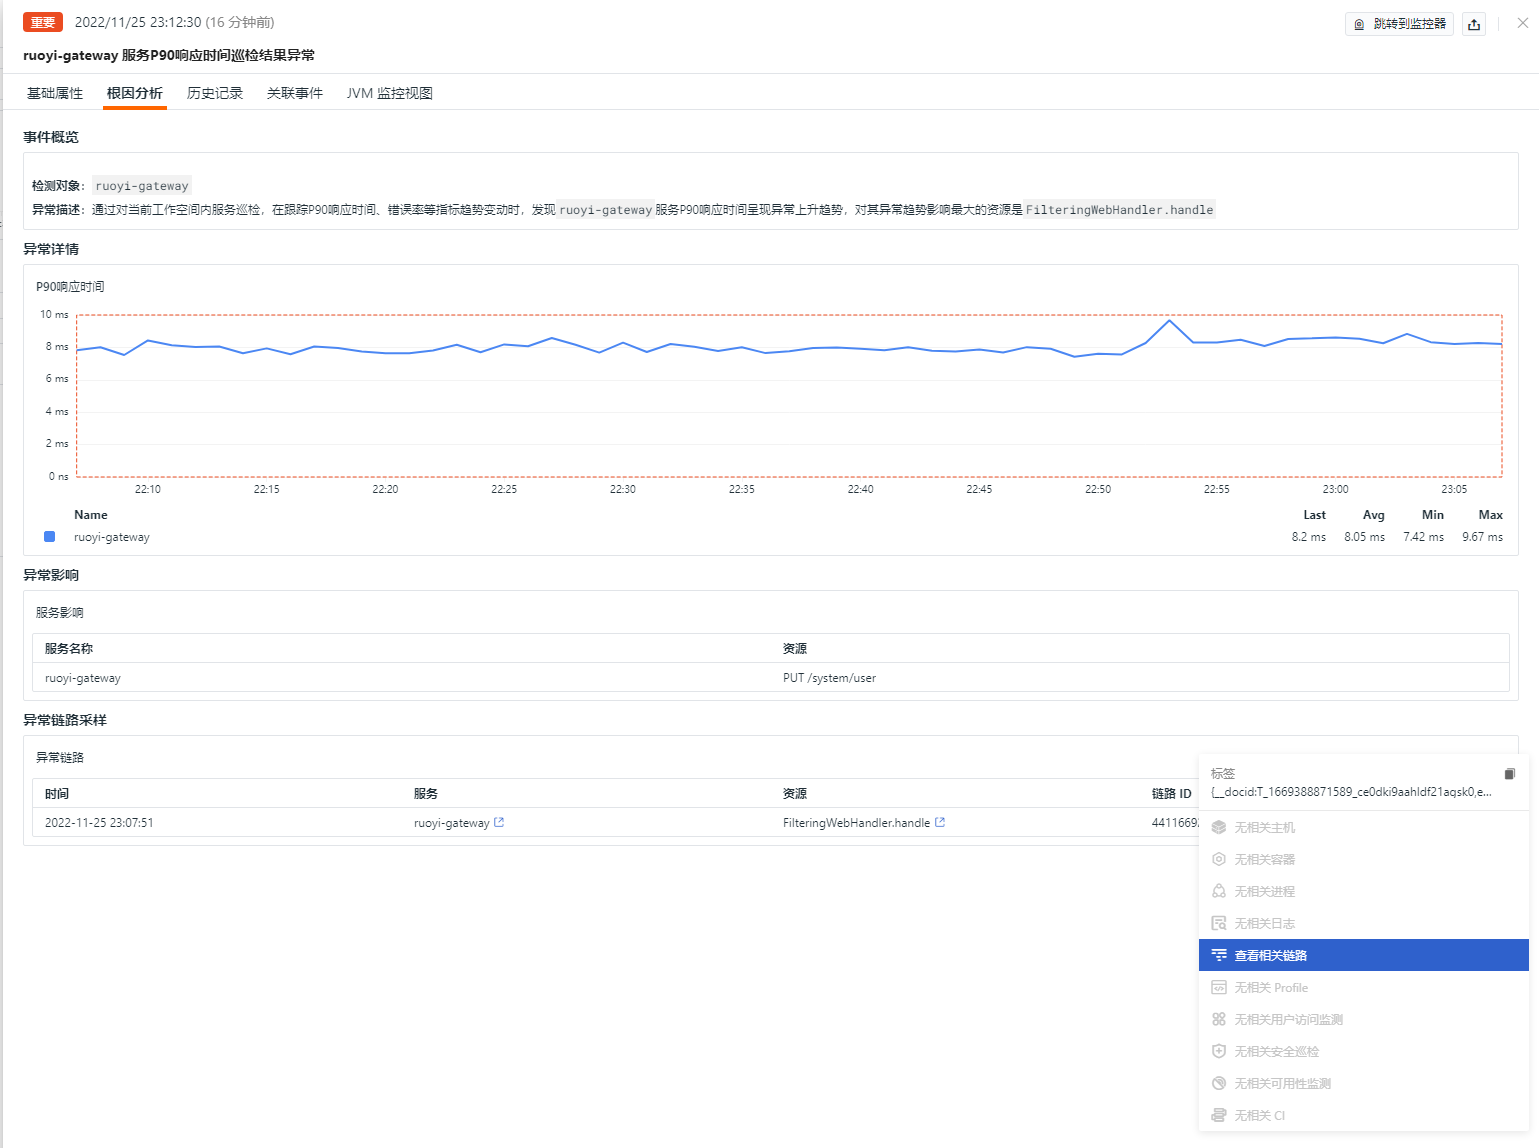
- Event Overview: Describes the object and content of the abnormal inspection event.
- Error Trend: Can view the performance metrics of the current application over the last hour.
- Anomaly Impact: Can view the services and resources affected by the current trace anomaly.
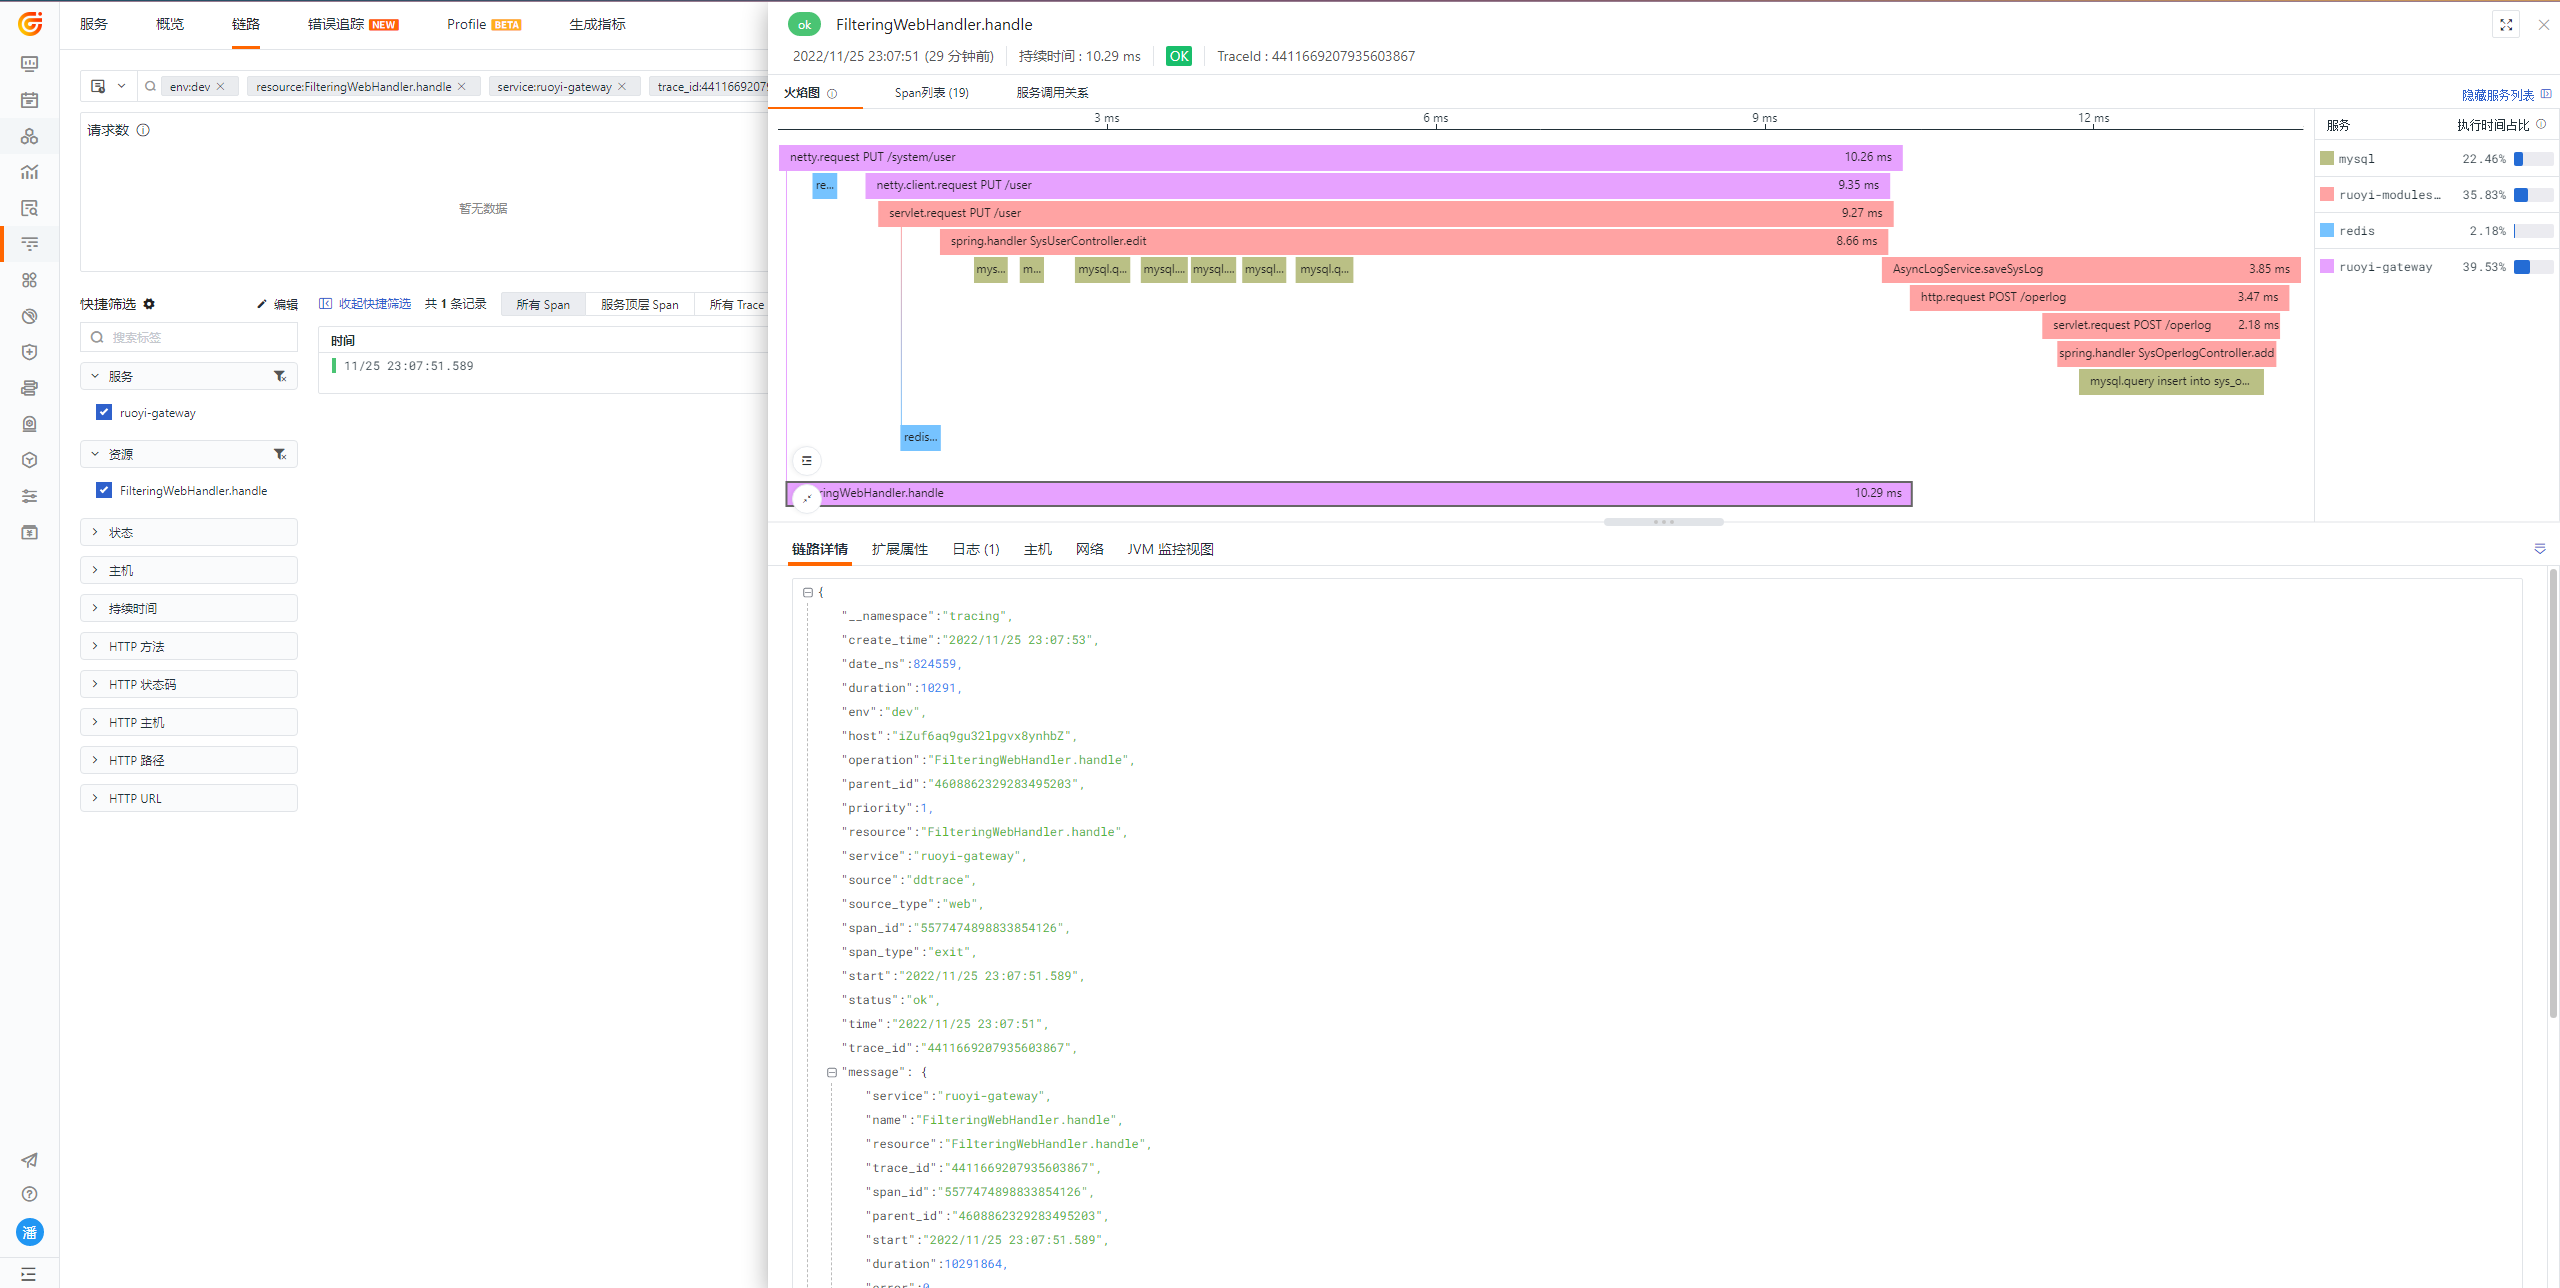
- Anomaly Trace Sampling: View detailed error times, services, resources, trace IDs; clicking on services and resources enters the corresponding data Explorer; clicking on the trace ID enters the specific trace detail page.
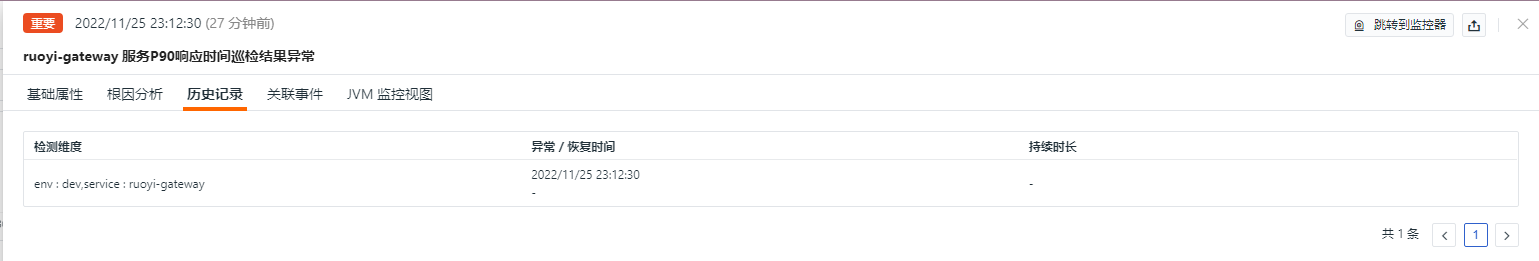
History Records
Supports viewing detection objects, anomaly/recovery times, and duration.
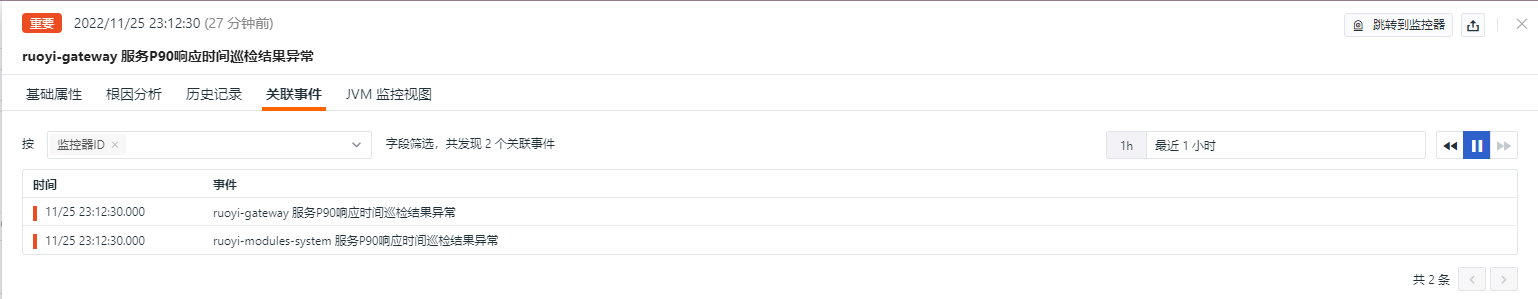
Related Events
Supports viewing associated events through selected fields and time component information.
Common Issues
1. How to configure the detection frequency of application performance inspection
- In the self-hosted DataFlux Func, add
fixed_crontab='0 * * * *', timeout=900in the decorator when writing custom inspection handling functions, and then configure it in "Management / Automatic Trigger Configuration".
2. Why might there be no anomaly analysis when application performance inspection is triggered
When there is no anomaly analysis in the inspection report, check the data collection status of the current datakit.
3. Under what circumstances will application performance inspection events be generated
Using error rates, P90, and other Metrics as entry points, when one of these Metrics experiences an abnormal change and affects the upstream and downstream chains, it triggers the collection of alarm information and performs root cause analysis.
4. During inspection, a previously normal script now throws errors
Update the referenced script sets in the DataFlux Func Script Market. You can view the update records of the Script Market through the Change Log to facilitate timely updates of the scripts.
5. During the upgrade of the inspection script, the corresponding script set in Startup shows no changes
First delete the corresponding script set, then click the upgrade button to configure the corresponding Guance API key to complete the upgrade.
6. After enabling inspection, how to determine if the inspection is effective
In "Management / Automatic Trigger Configuration", check the corresponding inspection status. First, the status should be Enabled, and secondly, you can verify whether there are issues with the inspection script by clicking Execute. If the message "Executed successfully xxx minutes ago" appears, the inspection is running effectively.