Generate Metrics
Guance supports generating new metrics data based on existing data within the current workspace, allowing you to design and implement new technical metrics according to your needs.
Warning
- Roles with Generate Metrics Configuration Management operation permissions can create and edit Generate Metrics;
- After metrics are generated, they will be stored according to the current default Data Storage Policy, and billed based on the generated Time Series Count;
- After metrics are generated, if no data is reported during the period, they cannot be queried and analyzed in the workspace, such as querying metrics data in Metrics Analysis, Charts, and Query Tools.
Create/Clone Rules
Go to the Logs > Generate Metrics page,
-
Click the Create button to start creating a new generate metrics rule;
-
Click the icon to clone an existing rule and create a new rule.

Step 1: Data Source: Filter all existing Index data in the current workspace;
Step 2: Data Query: Based on the selected index data, you can filter all/single log data sources in the current workspace to generate new data, and by adding filtering and aggregation expressions to the existing data, request to generate new metrics results and data sets;
-
Log Source: The log data sources that have been enabled for collection.
- Note: "*" represents all data sources;
-
Search: Supports filtering log data by keywords;
-
Filter: Supports adding one/multiple filtering conditions to existing tag data, and adding "AND" (AND), "OR" (OR) relationships to the same row of filtering conditions;
-
Aggregation Methods: See the table below:
| Aggregation Method | Description |
|---|---|
| count | Count the number |
| avg | Calculate the average, requires selecting the aggregation field |
| max | Calculate the maximum value, requires selecting the aggregation field |
| min | Calculate the minimum value, requires selecting the aggregation field |
| P75 | Calculate the 75% value of the specified field, requires selecting the aggregation field |
| P95 | Calculate the 95% value of the specified field, requires selecting the aggregation field |
| P99 | Calculate the 99% value of the specified field, requires selecting the aggregation field |
- Dimensions: Aggregate data according to the selected objects, i.e., generate a statistical value for each selected object in the data request
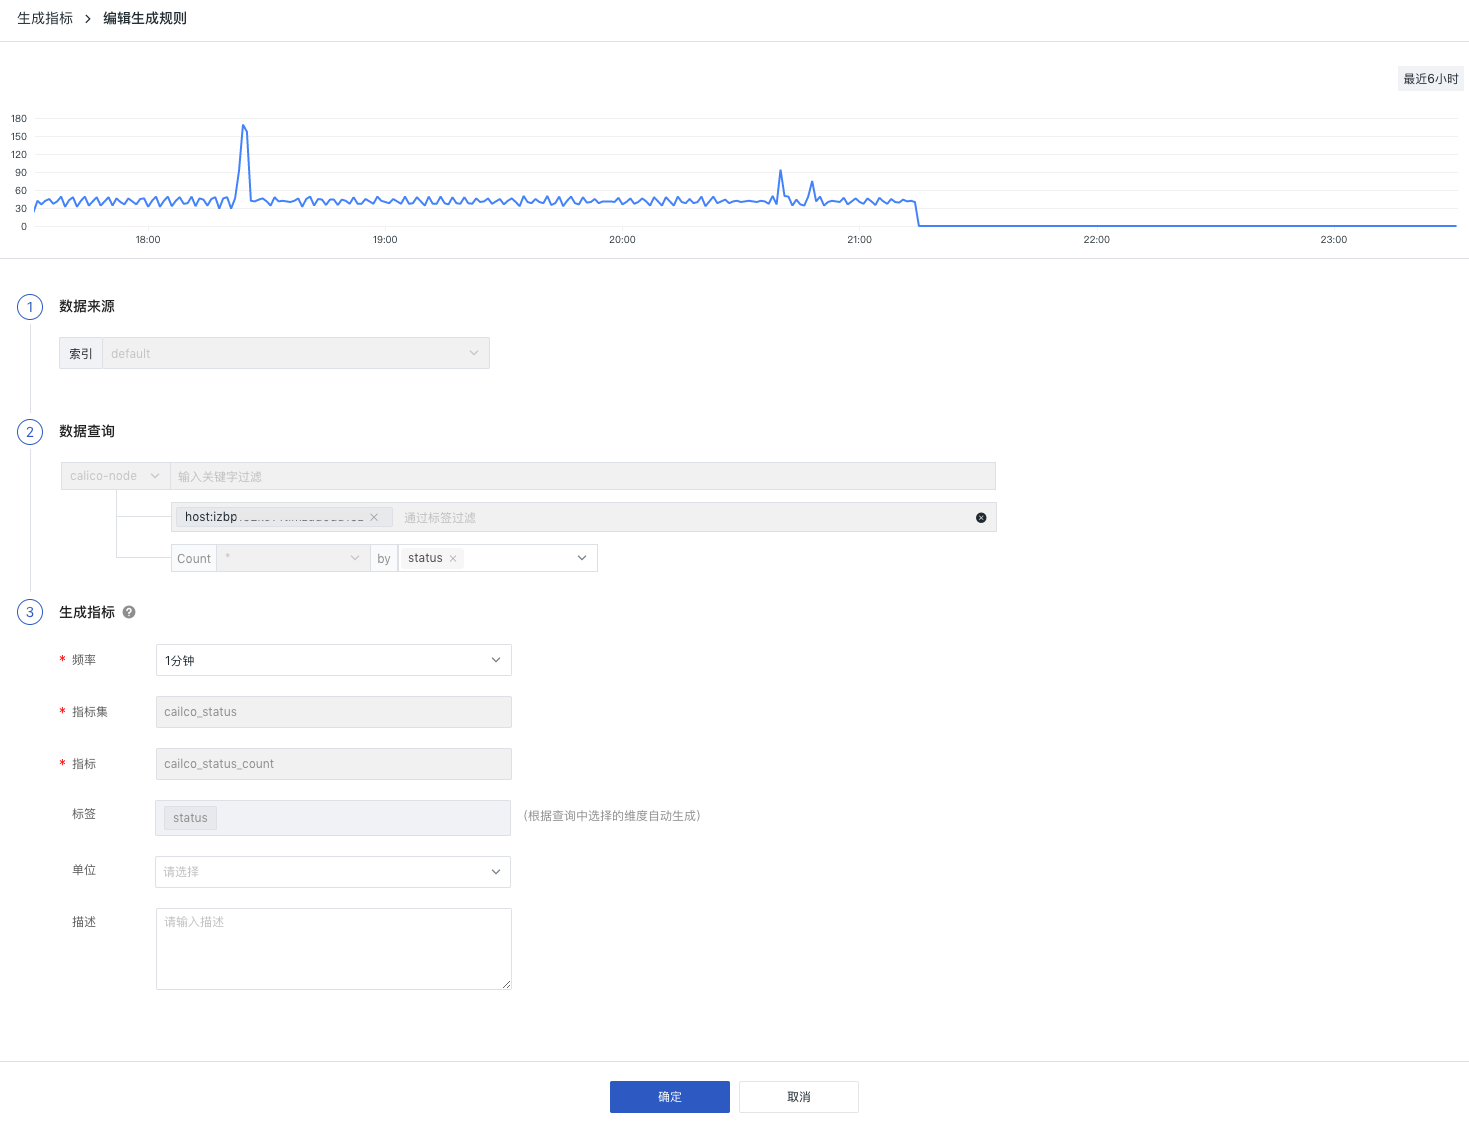
Step 3: Generate Metrics: Set the method and result of generating metrics, including the frequency of generating metrics, the tag name of the newly generated metrics, and the measurement name;
| Field | Description |
|---|---|
| Frequency | The execution cycle of generating metrics, default is 1 minute, i.e., generate new metrics data every 1 minute; Optional 5 minutes, 15 minutes; The selected frequency time is also the aggregation time, selecting a frequency of 1 minute means aggregating and generating metrics every 1 minute, and the time range for each aggregation is also 1 minute. ❗️ If the data has a delay of more than 1 minute, the data will not be counted after it is stored. |
| Time Range | Based on the selected frequency as the time interval, the chart defaults to querying for 6 hours, i.e., the effect of a certain data statistic display within 6 hours; when the frequency is modified to >= 1 hour, the query time range is fixed to 7 days. |
| Measurement | Set the name of the measurement where the metrics are stored. |
| Metrics | Set the name of the metrics, where the metrics name cannot be duplicated, and multiple metrics can be added. |
| Tags | Automatically generated based on the dimensions selected in the query. |
| Unit | Optional, set the unit of the metrics, after setting the unit for the generated metrics, it can be applied in chart queries. |
| Description | Optional, set the description of the metrics, after setting the description for the generated metrics, it can be applied in chart queries. |
Step 4: After completing the generation rule, click Confirm to complete the generate metrics rule and start data collection.
Operation Instructions
All added rules are displayed on the Generate Metrics interface, and users can perform the following operations:

Edit Rules
On the Generate Metrics page, you can view all created generate metrics rules and edit the generate metrics rules.
Note: Since the data source and aggregation expressions of the generate metrics rules determine the data type, some rules do not support editing and modification.
Enable/Disable Rules
On the Generate Metrics page, you can modify the rule status. After the generate metrics rule is disabled, the corresponding data will not be written to the measurement, and will resume writing after being enabled.
Delete Rules
On the Generate Metrics page, unwanted rules can be deleted. After the rule is deleted, the measurement will not be deleted, but data writing will stop.
Batch Operations
You can perform batch operations on specific rules, including enabling, disabling, and deleting rules.
View Metrics
View in Metrics Analysis
On the Generate Metrics page, click the Open in Metrics Analysis button on the right side of the rule to jump to the Metrics Analysis page for query and analysis.
Note: Generate Metrics aggregates and generates metrics based on the frequency you selected and the data within the query time range. If no data is reported during the period, metrics cannot be generated, and they cannot be queried or searched in Metrics.

View in Metrics Management
On the Generate Metrics page, click the Open in Metrics Management button on the right side of the rule to jump to the Metrics Management page to view metrics and tags, and you can edit the metrics unit and description.

More Application Scenarios
Apply in Chart Queries
After metrics are generated, you can go to Scenarios > Dashboards > Create Dashboard, and query and analyze metrics data in Visual Charts.

Apply in DQL Query Tools
After metrics are generated, you can go to Shortcut > Query Tools > DQL Query to query and analyze metrics data.
