Synthetic Testing Anomaly Detection
Used to monitor the availability data within a workspace. You can set threshold ranges for specified data volumes generated by dial testing tasks over a period of time. Once the data volume reaches these thresholds, the system will trigger an alert. Additionally, you can customize alert levels so that different threshold ranges trigger corresponding level alerts when specified data volumes are reached.
Use Cases
Supports monitoring data generated from HTTP, TCP, ICMP, WEBSOCKET, and multi-step tests. For example, monitoring production environment deployment URLs for unavailability.
Detection Configuration
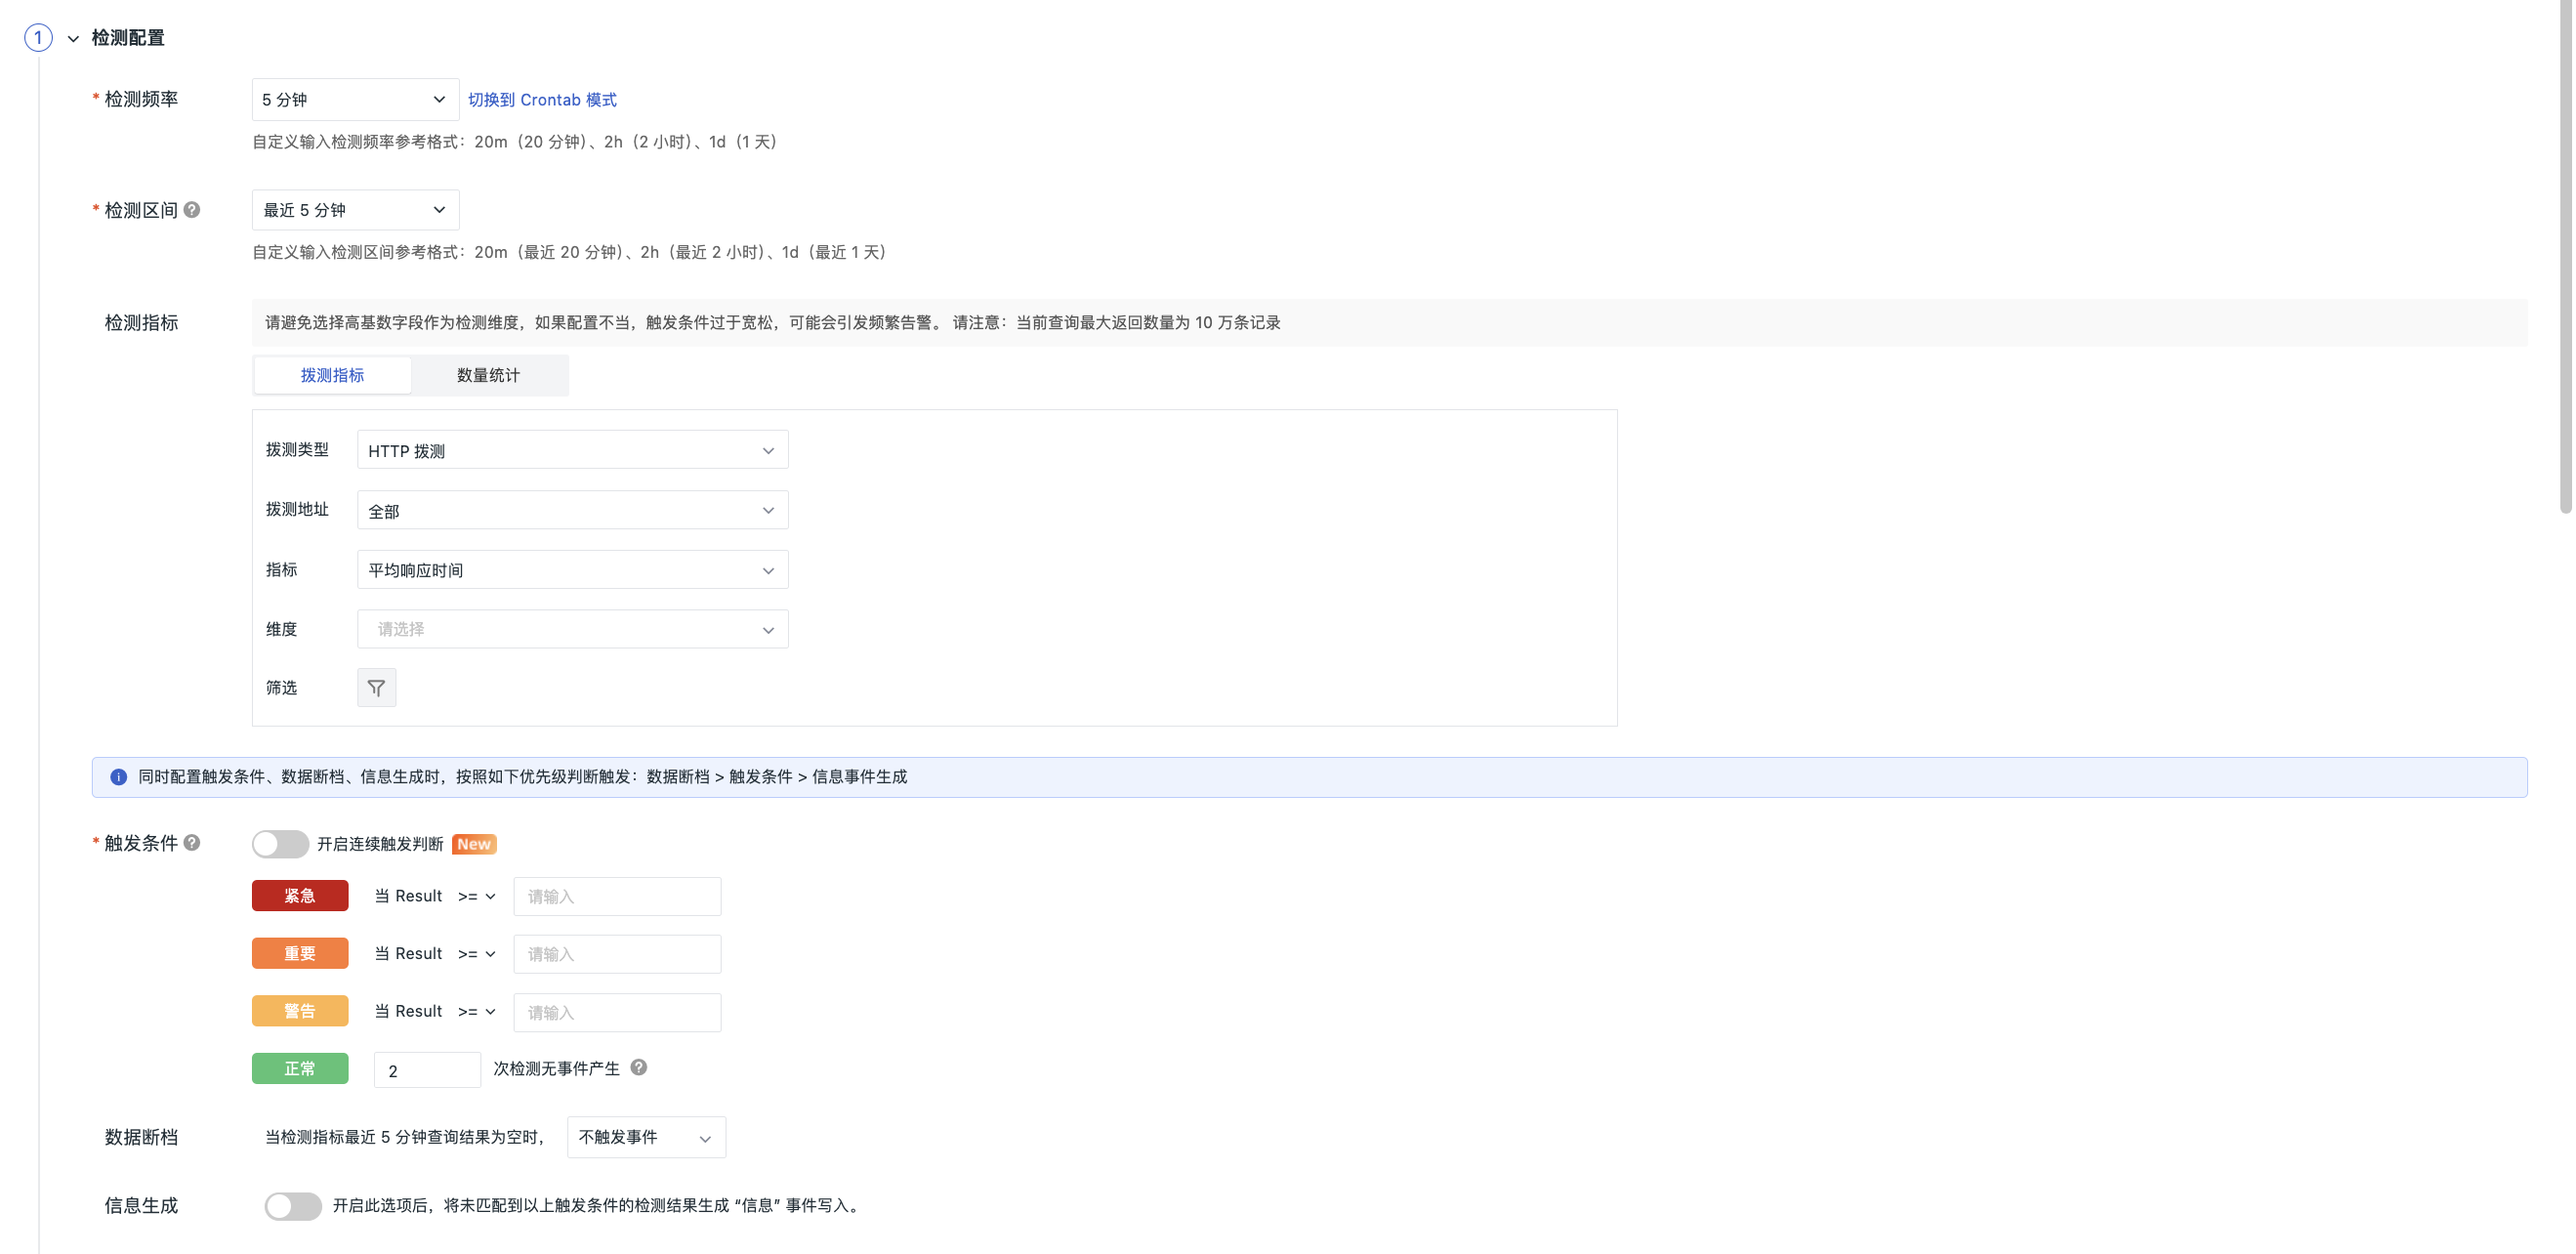
Detection Frequency
The frequency at which detection rules are executed; defaults to 5 minutes.
Detection Interval
The time range for querying detection metrics. This is influenced by the detection frequency, leading to different selectable intervals.
| Detection Frequency | Detection Intervals (Dropdown Options) |
|---|---|
| 1m | 1m/5m/15m/30m/1h/3h |
| 5m | 5m/15m/30m/1h/3h |
| 15m | 15m/30m/1h/3h/6h |
| 30m | 30m/1h/3h/6h |
| 1h | 1h/3h/6h/12h/24h |
| 6h | 6h/12h/24h |
| 12h | 12h/24h |
| 24h | 24h |
3) Detection Metrics: Set the metrics for detecting data, supporting setting the specified data volume generated by all or individual dial testing tasks within the current workspace as detection metrics.
Dial Testing Metrics:
| Field | Description |
|---|---|
| Test Type | Includes four types of dial testing: HTTP, TCP, ICMP, WEBSOCKET. |
| Test Address | Supports monitoring all or individual dial testing tasks available in the current workspace. |
| Metrics | Supports detection based on metric dimensions, including average response time, P50 response time, P75 response time, P90 response time, P99 response time, availability, error request count, request count, and availability. |
| Dimensions | Any string type (keyword) fields in the configuration data can be selected as detection dimensions. Currently, up to three fields can be chosen. By combining multiple detection dimension fields, a specific detection object can be determined. Guance will determine if the statistical metrics for a given detection object meet the threshold conditions, triggering an event if they do.For example, selecting detection dimensions host and host_ip results in a detection object {host: host1, host_ip: 127.0.0.1}. |
| Filtering | Filters the data for detection metrics based on metric tags to limit the scope of detection. One or more tag filters, fuzzy matches, and fuzzy non-matches can be added. |
Count Statistics
You can query and aggregate dial testing tasks using keyword searches or tag filtering based on the four different test types.
In addition to simple queries, expression-based queries can also be used.
Trigger Conditions
Set the trigger conditions for alert levels: you can configure any one of critical, major, minor, or normal alert levels.
Configure trigger conditions and severity levels; if any value among multiple query results meets the trigger condition, an event is generated.
For more details, refer to Event Level Description.
If Continuous Trigger Judgment is enabled, you can configure it to trigger events after multiple consecutive judgments, with a maximum limit of 10 times.
Alert Levels
-
Critical (Red), Major (Orange), Minor (Yellow) Alert Levels: Based on configured condition operators.
-
Normal (Green) Alert Level: Based on configured detection counts, as follows:
-
Each execution of a detection task counts as 1 detection, e.g., if [Detection Frequency = 5 minutes], then 1 detection = 5 minutes.
- Custom detection counts can be defined, e.g., if [Detection Frequency = 5 minutes], then 3 detections = 15 minutes.
| Level | Description |
|---|---|
| Normal | After the detection rule takes effect, if critical, major, or minor anomaly events occur, and the data detection results return to normal within the configured custom detection count, a recovery alert event is generated. Recovery alert events are not subject to Alert Mute. If no recovery alert event detection count is set, the alert event will not recover and will remain in the Events > Unrecovered Events List. Recovery alert events are not subject to Alert Mute. If no recovery alert event detection count is set, the alert event will not recover and will remain in the Events > Unrecovered Events List. |
Data Gaps
Seven strategies can be configured for handling data gaps.
-
In conjunction with the detection interval time range, judge the query results of the most recent minutes for the detection metrics, do not trigger an event;
-
In conjunction with the detection interval time range, judge the query results of the most recent minutes for the detection metrics, treat the query result as 0; this result will then be compared against the thresholds configured in the Trigger Conditions to determine if an anomaly event should be triggered.
-
Customize filling of the detection interval values, trigger data gap events, critical events, major events, minor events, and recovery events; choose this configuration strategy with a recommended custom data gap time >= detection interval time span. If the configured time <= detection interval time span, both data gap and anomaly conditions may be met simultaneously, in which case only the data gap processing result will apply.
Information Generation
Enabling this option writes unmatched detection results as "Information" events.
Note: When configuring trigger conditions, data gaps, and information generation simultaneously, the following priority order applies: data gaps > trigger conditions > information event generation.