Alert Aggregation Notification Template
Title
You have {{N}} {{level}} alert notifications
Content
No Aggregation
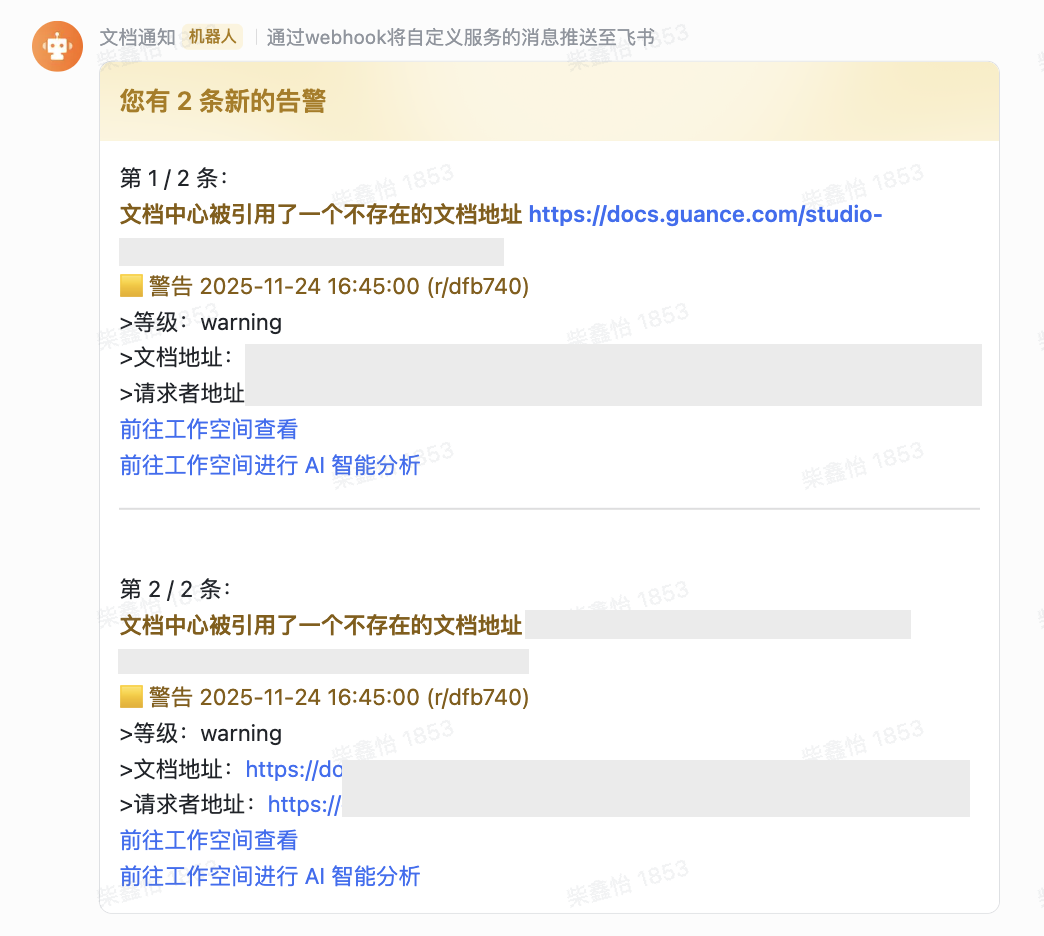
You have N new Guance alerts
Item 1 / 2:
Title
Content
Go to Workspace to view
Go to Workspace for AI analysis
Item 2 / 2:
Title
Content
Go to Workspace to view
Go to Workspace for AI analysis
- Go to Workspace to view: Opens the Event Explorer to view the current event (filter condition:
df_event_id).
Diagram:
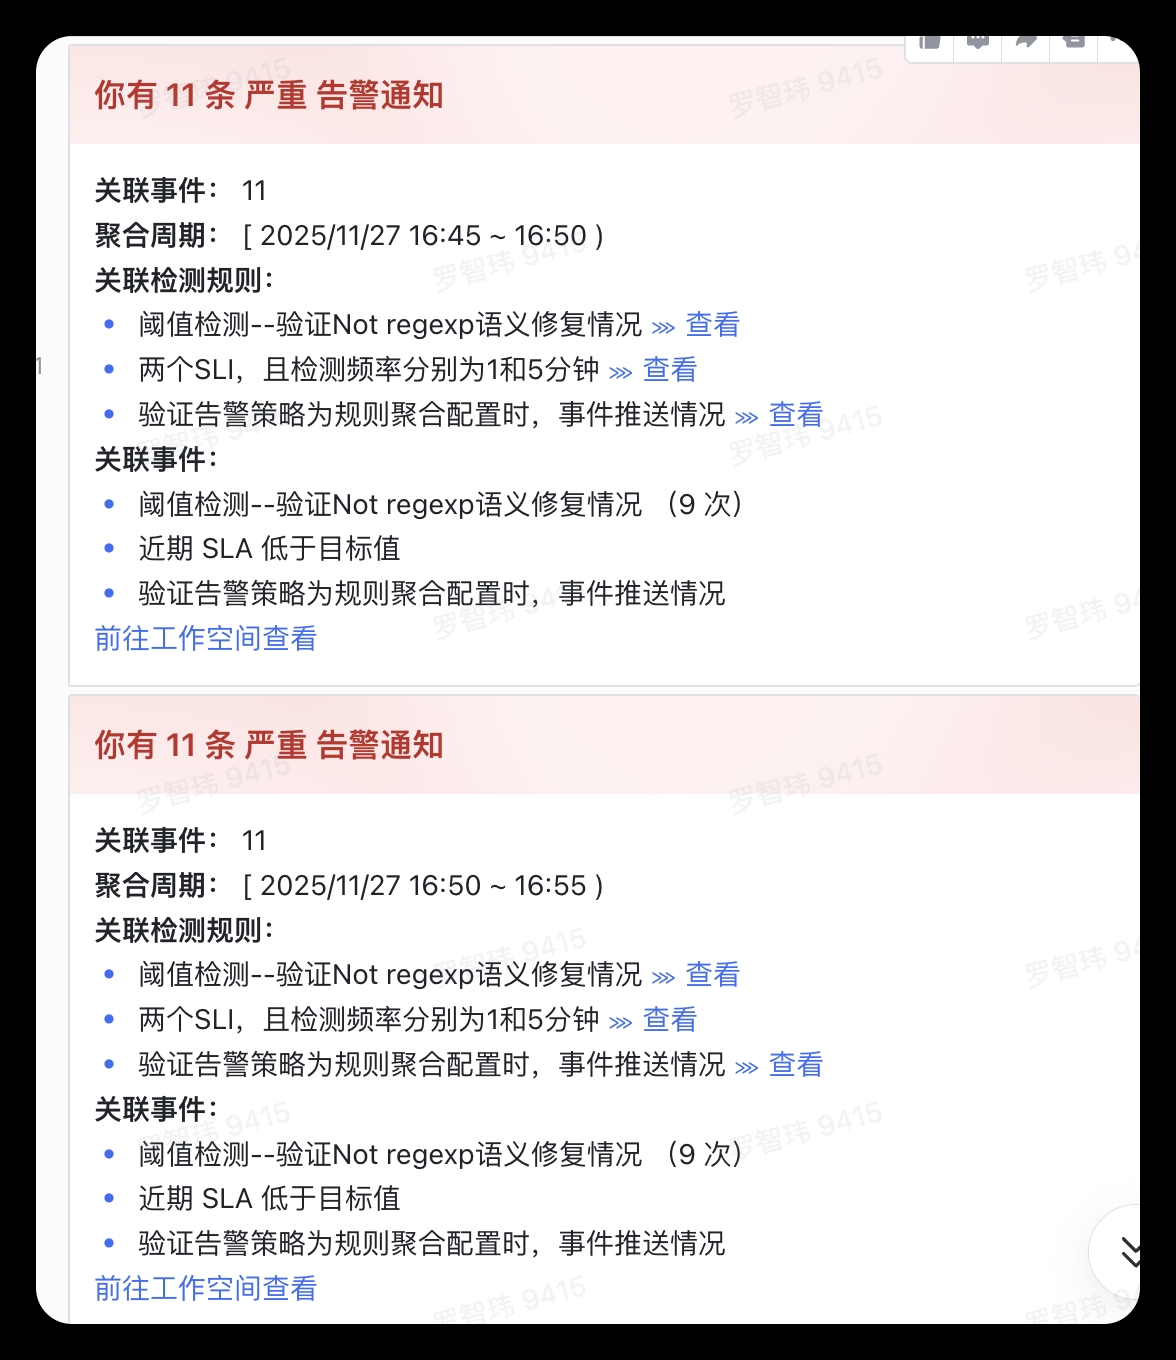
Rule Aggregation
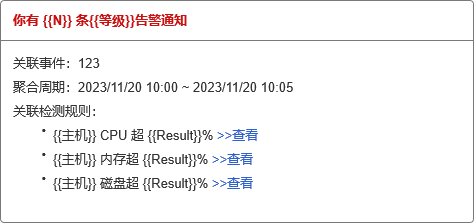
All
Related Events: 123
Aggregation Period: 2023/11/20 10:00 ~ 2023/11/20 10:05
Related Detection Rules:
- {{event_title}} >>View
- View: Opens the Explorer to view all events generated by the current Monitor within the aggregation period (filter condition:
df_monitor_checker_id).
Diagram:
Detection Rule - Monitor
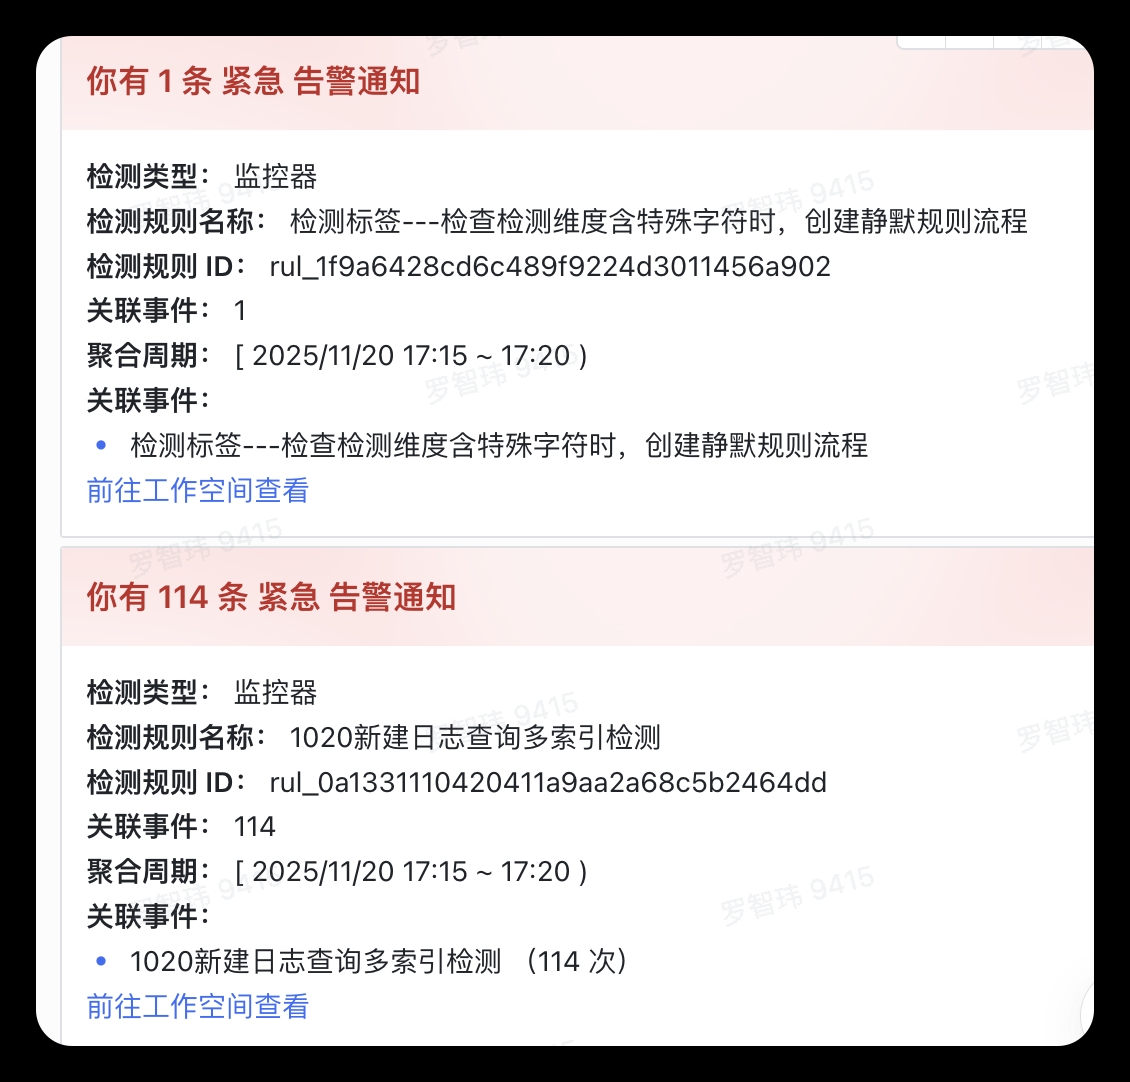
Detection Type: Monitor
Detection Rule Name: {{host}} CPU exceeds {{Result}}%
Detection Rule ID: rule_cdbkjcbsdjcb1234445455
Related Events: 123
Aggregation Period: 2023/11/20 10:00 ~ 2023/11/20 10:05
Go to Workspace to view
- View: Opens the Explorer to view events associated with the current Monitor (filter condition:
df_monitor_checker_id).
Detection Rule - Intelligent Inspection
Detection Type: Intelligent Inspection
Detection Rule Name: {{host}} CPU exceeds {{Result}}%
Detection Rule ID: rule_cdbkjcbsdjcb1234445455
Related Events: 123
Aggregation Period: 2023/11/20 10:00 ~ 2023/11/20 10:05
Go to Workspace to view
Go to Workspace for AI analysis
- View: Opens the Explorer to view events associated with the current Intelligent Inspection rule (filter condition:
df_monitor_checker_id).
Detection Rule - SLO
Detection Type: SLO
Detection Rule Name: {{host}} CPU exceeds {{Result}}%
Detection Rule ID: rule_cdbkjcbsdjcb1234445455
Related Events: 123
Aggregation Period: 2023/11/20 10:00 ~ 2023/11/20 10:05
Go to Workspace to view
Go to Workspace for AI analysis
- View: Opens the Explorer to view events associated with the current SLO (filter condition:
df_monitor_checker_id).
Detection Dimension
Detection Dimension: service:kodo,host:test
Related Events: 123
Aggregation Period: 2023/11/20 10:00 ~ 2023/11/20 10:05
Related Detection Rules:
The latency of service {{service}} exceeds the threshold. Please check it as soon as possible >>View
The CPU usage of host {{host}} exceeds the threshold. Please check it as soon as possible >>View
Related Events:
The latency of serviceA exceeds the threshold. Please check it as soon as possible 4 times
The latency of serviceB exceeds the threshold. Please check it as soon as possible 3 times
The CPU usage of hostA exceeds the threshold. Please check it as soon as possible 5 times
The CPU usage of hostB exceeds the threshold. Please check it as soon as possible 6 times
Tags
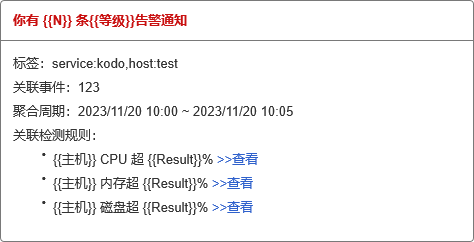
Tags: service:kodo,host:test
Related Events: 123
Aggregation Period: 2023/11/20 10:00 ~ 2023/11/20 10:05
Related Detection Rules:
- {{event_title}} >>View
- View: Opens the Explorer to view events associated with the current detection rule (filter condition:
df_monitor_checker_id).
Diagram:
Intelligent Aggregation
Title Clustering
Title: {{host}} CPU exceeds {{Result}}%
Related Events: 123
Aggregation Period: 2023/11/20 10:00 ~ 2023/11/20 10:05
Related Detection Rules:
The latency of service {{service}} exceeds the threshold. Please check it as soon as possible >>View
The CPU usage of host {{host}} exceeds the threshold. Please check it as soon as possible >>View
Related Events:
The latency of serviceA exceeds the threshold. Please check it as soon as possible 4 times
The latency of serviceB exceeds the threshold. Please check it as soon as possible 3 times
The CPU usage of hostA exceeds the threshold. Please check it as soon as possible 5 times
The CPU usage of hostB exceeds the threshold. Please check it as soon as possible 6 times
- View: Opens the Explorer to view all events generated by the current detection rule within the aggregation period (filter condition:
df_monitor_checker_id).
Content Clustering
Title: {{host}} CPU exceeds {{Result}}%
Related Events: 123
Aggregation Period: 2023/11/20 10:00 ~ 2023/11/20 10:05
Related Detection Rules:
The latency of service {{service}} exceeds the threshold. Please check it as soon as possible >>View
The CPU usage of host {{host}} exceeds the threshold. Please check it as soon as possible >>View
Related Events:
The latency of serviceA exceeds the threshold. Please check it as soon as possible 4 times
The latency of serviceB exceeds the threshold. Please check it as soon as possible 3 times
The CPU usage of hostA exceeds the threshold. Please check it as soon as possible 5 times
The CPU usage of hostB exceeds the threshold. Please check it as soon as possible 6 times
- View: Opens the Explorer to view all events generated by the current detection rule within the aggregation period (filter condition:
df_monitor_checker_id).
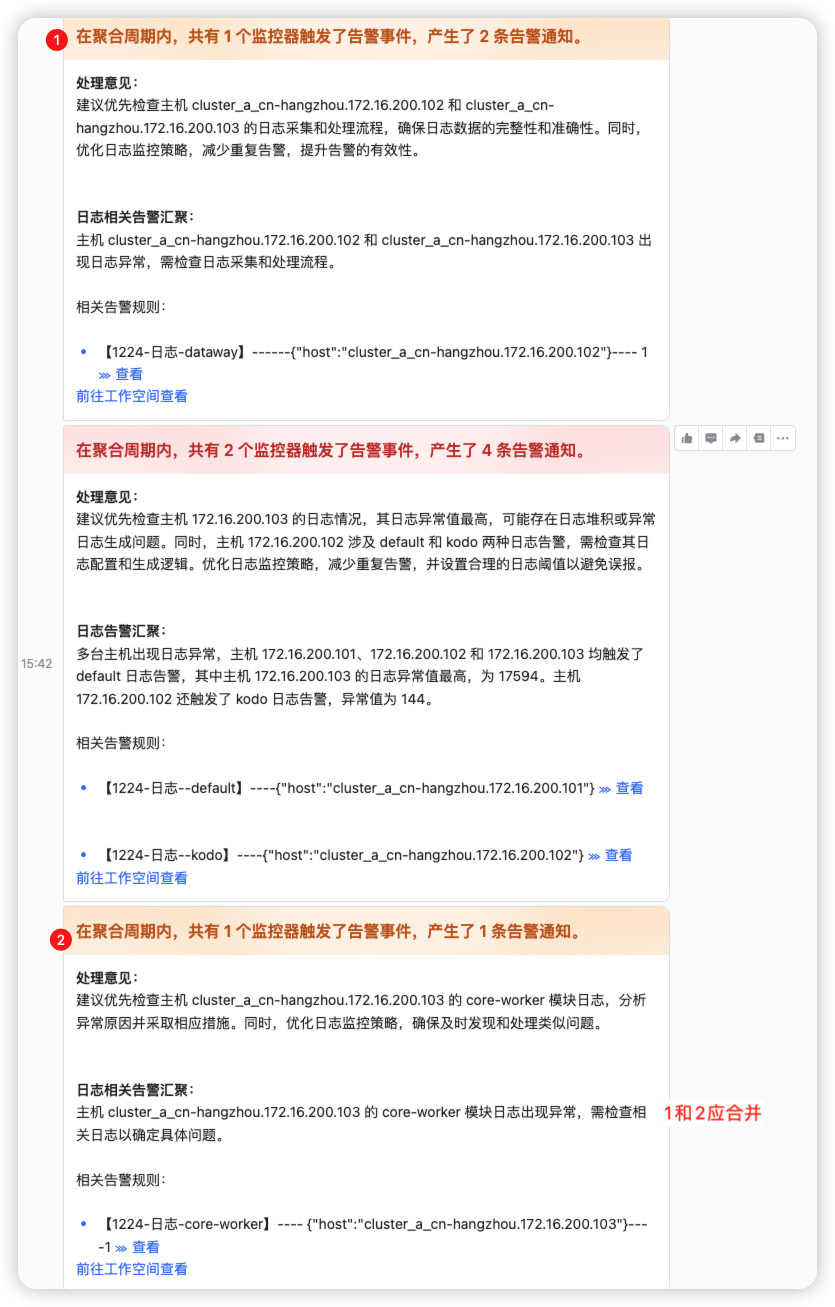
AI Aggregation
Title: title: Describes the summary information of the current alert.
Handling Suggestion: suggestion: Recommendations for handling the current alert.
{xxx-related} Alert Aggregation: "summary": "Multiple hosts show CPU and memory anomalies, with the highest abnormal value at 98% (host 172.16.200.108). Host 1
Related Detection Rules: df_monitor_checker_ids: The involved monitors (rule IDs).
{xxx-related} Alert Aggregation: "summary": "Multiple hosts show CPU and memory anomalies, with the highest abnormal value at 98% (host 172.16.200.108). Host 1
Related Detection Rules: df_monitor_checker_ids: The involved monitors (rule IDs).
Example:
Title: During the aggregation period, 3 monitors triggered alert events, generating 19 alert notifications.

Handling Suggestion: Prioritize handling hosts with high-frequency alerts. Host 172.16.200.101 involves CPU anomalies, memory anomalies, and communication issues, requiring a comprehensive check. Examine alert correlation. Multiple monitors (rule IDs) involve host resources (CPU, memory) and module communication, which may indicate a systemic issue. Optimize monitoring policies to reduce repeatedly triggered alerts in a short period and apply alert noise reduction based on time windows.

Host-related Alert Aggregation: Multiple hosts show CPU and memory anomalies, with the highest abnormal value at 98% (host 172.16.200.108). Host 172.16.200.101 triggered both CPU and memory alerts and requires priority inspection.

Related Detection Rules: title View("rul_e68e2d5e620b40c691128a399de3f479")

Application-related Alert Aggregation: Multiple hosts show CPU and memory anomalies, with the highest abnormal value at 98% (host 172.16.200.108). Host 172.16.200.101 triggered both CPU and memory alerts and requires priority inspection.

Related Detection Rules: title View("rul_e68e2d5e620b40c691128a399de3f479")
Diagram: