Event Details
In the Unrecovered Events Explorer, All Events Explorer, and Change Events, clicking on any event data will display the event details, including basic attributes, extended fields, alert notifications, historical records, etc.
Basic Attributes
-
Detection Dimensions: Specific properties used to identify and classify events during the detection process.
-
You can query all detection dimensions. Clicking allows you to view related detection content and supports the following operations:
- Filter Field Values: Filter based on field values of the detection dimension to view event data related to that field.
- Reverse Filter Field Values: Filter in reverse based on field values of the detection dimension to view other event data excluding that field.
- Copy: Copies the label content to the clipboard.
-

-
Event Content: Defined by the Event Content Description on the monitor configuration page.
-
Detection Metrics: Query statement for the detection metrics configured when setting up the monitor.
-
Historical Trends: Displays the historical trend of detection results for the current unrecovered event. Click Get Chart Query to obtain the current query statement.

Extended Fields
You can manage the attribute fields contained in this event data through the following operations:
-
In the search bar, you can quickly search and locate by entering the field name or value;
-
After checking the field alias, it will appear after the field name;
-
On the event detail page, you can view the relevant field attributes of the current event under Extended Fields:
Field |
Attribute |
|---|---|
| Filter Field Values | Adds the field to the explorer's search bar to view all data related to this field. This can be used to filter and view related traces in the APM Explorer. |
| Reverse Filter Field Values | Adds the field to the explorer's search bar to view data excluding this field. |
| Copy | Copies the field to the clipboard. |

Alert Notifications
Displays notification target types, notification target names, whether notifications were successfully sent, etc. Click to expand and view detailed information about the alert notification target, with hover-to-copy support.
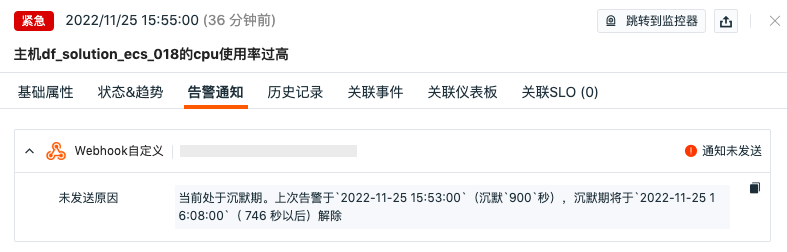
- If the alert is in a Mute state, it will display as muted;
- If the alert is sent normally, it will display corresponding notification target markers. Hover over the icon to show the specific notification target name.
Note
During the mute period, alert notifications will not be resent to the relevant targets.
History
Displays the host of the inspected object, anomaly/recovery times, and duration.
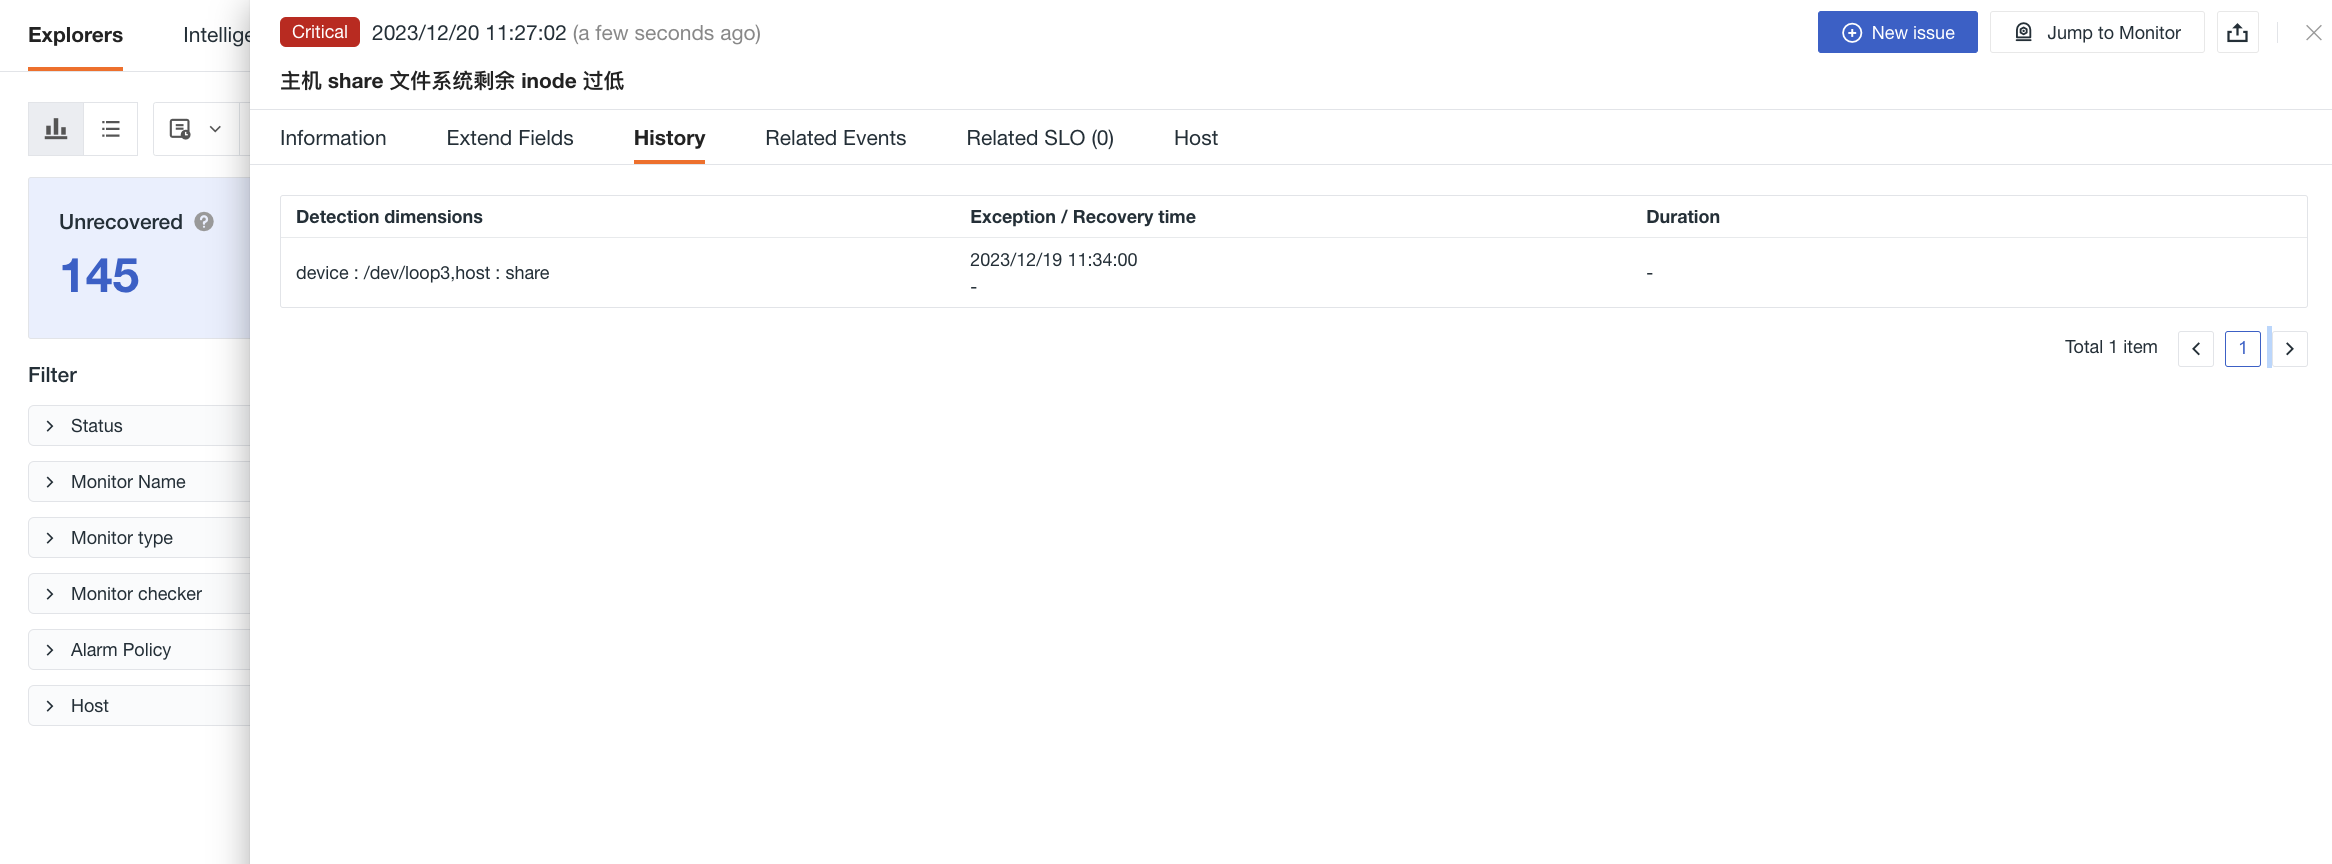
Clicking on a data entry opens the corresponding explorer with df_fault_id automatically applied for query filtering.

Related Events
Supports viewing associated events within a certain time frame based on four filter fields.
Field |
Description |
|---|---|
| Same Fault ID | df_fault_id; A special ID marker used to record the entire process from triggering an anomaly event to recovering normally for a given detection dimension. |
| Same Monitor | df_monitor_checker_id |
| Same Detection Dimension | df_dimension_tags |
| Same Level | df_status |
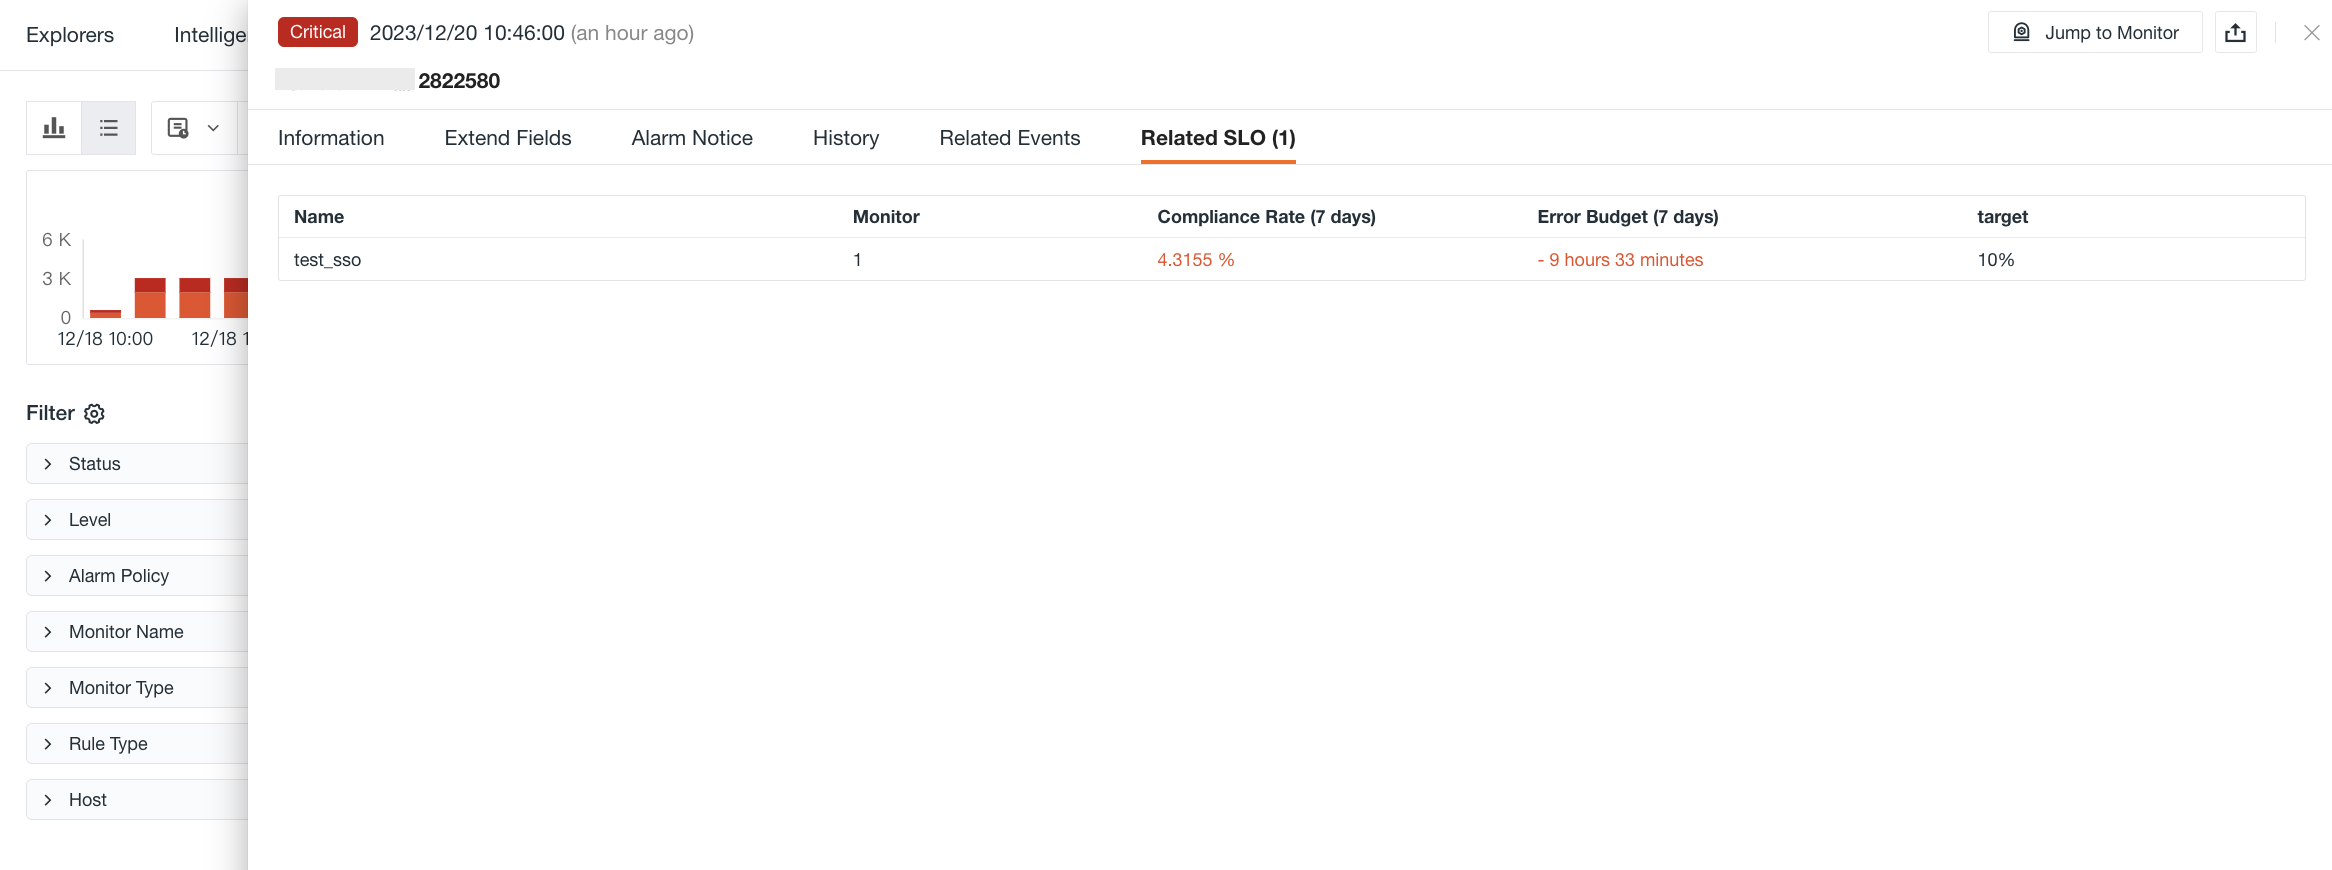
Related SLO
If an SLO is configured in the monitor, you can view related SLOs, including SLO name, monitor, compliance rate, error budget, target, etc.
Related Dashboards
If a related dashboard is configured in the monitor, you can view the associated dashboard.
Related Queries
In the related queries section, you can view all queries associated with the current event.

Bind Internal Views
The system supports binding or deleting internal views (user views) to the event details page. Clicking "Bind Internal View" adds a new view to the current event details page.
