All Events
The All Events Explorer provides a consolidated view of event data from all sources within the current workspace. It offers multi-dimensional analysis views of key information such as event source, alert level, and monitoring type through both list and chart formats.
Analysis Views
The system provides two data display modes, which can be switched by clicking the top toggle button:
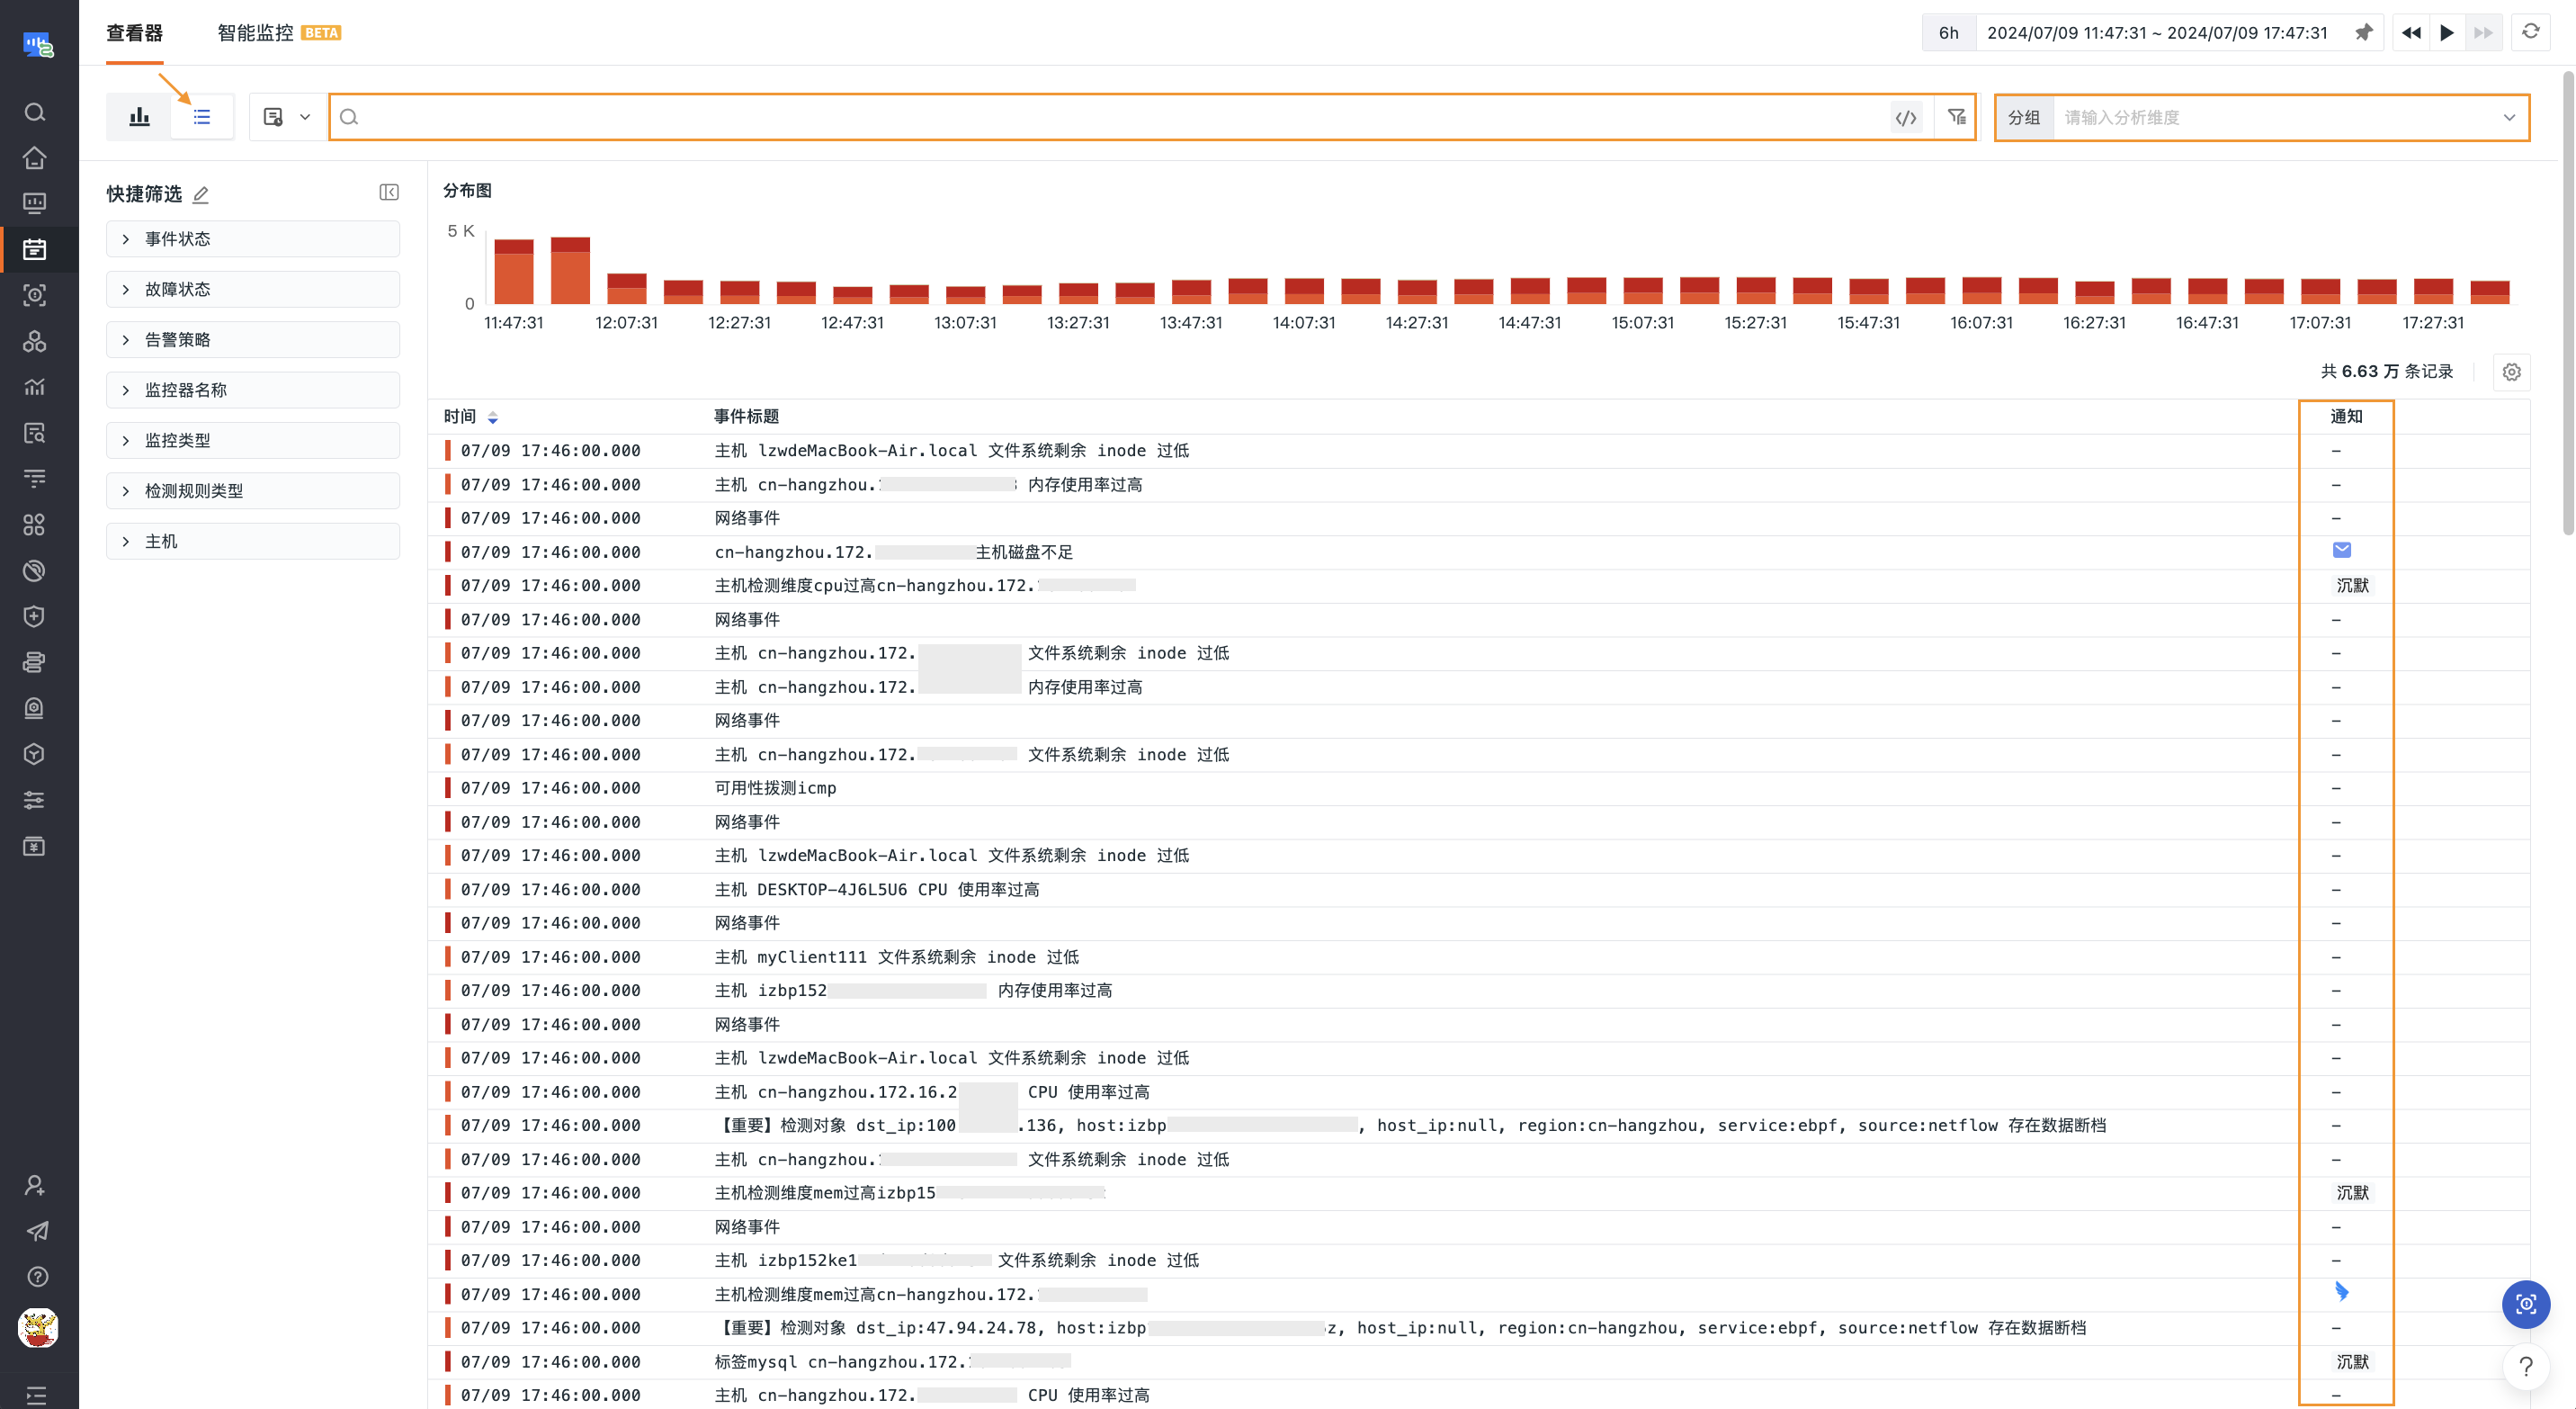
Displays event records in a list format. Each event shows key information such as time, title, source, level, and notification status. Above the list, a stacked bar chart intuitively presents the distribution of event counts by alert level at different time points.
Visual analysis based on aggregation operations, supporting the following chart types:
- Time Series Chart
- Top List
- Pie Chart
- Treemap
- Grouped Table Chart
Charts aggregate and filter data under by conditions based on operation modes such as count, last, first, and count_distinct.
Display Items
Based on all event data, you can set display preferences via "Display Items".
Standard
The default mode, which intuitively displays core event information.
List
After switching to "List" mode, you can control the displayed columns by adding or removing built-in event fields. The following fields are displayed by default:
notice: Notificationtime: Timedf_source: Event Sourcedf_title: Event Titledf_status: Level
For more settings, refer to Explorer Display Items.