Unrecovered Events
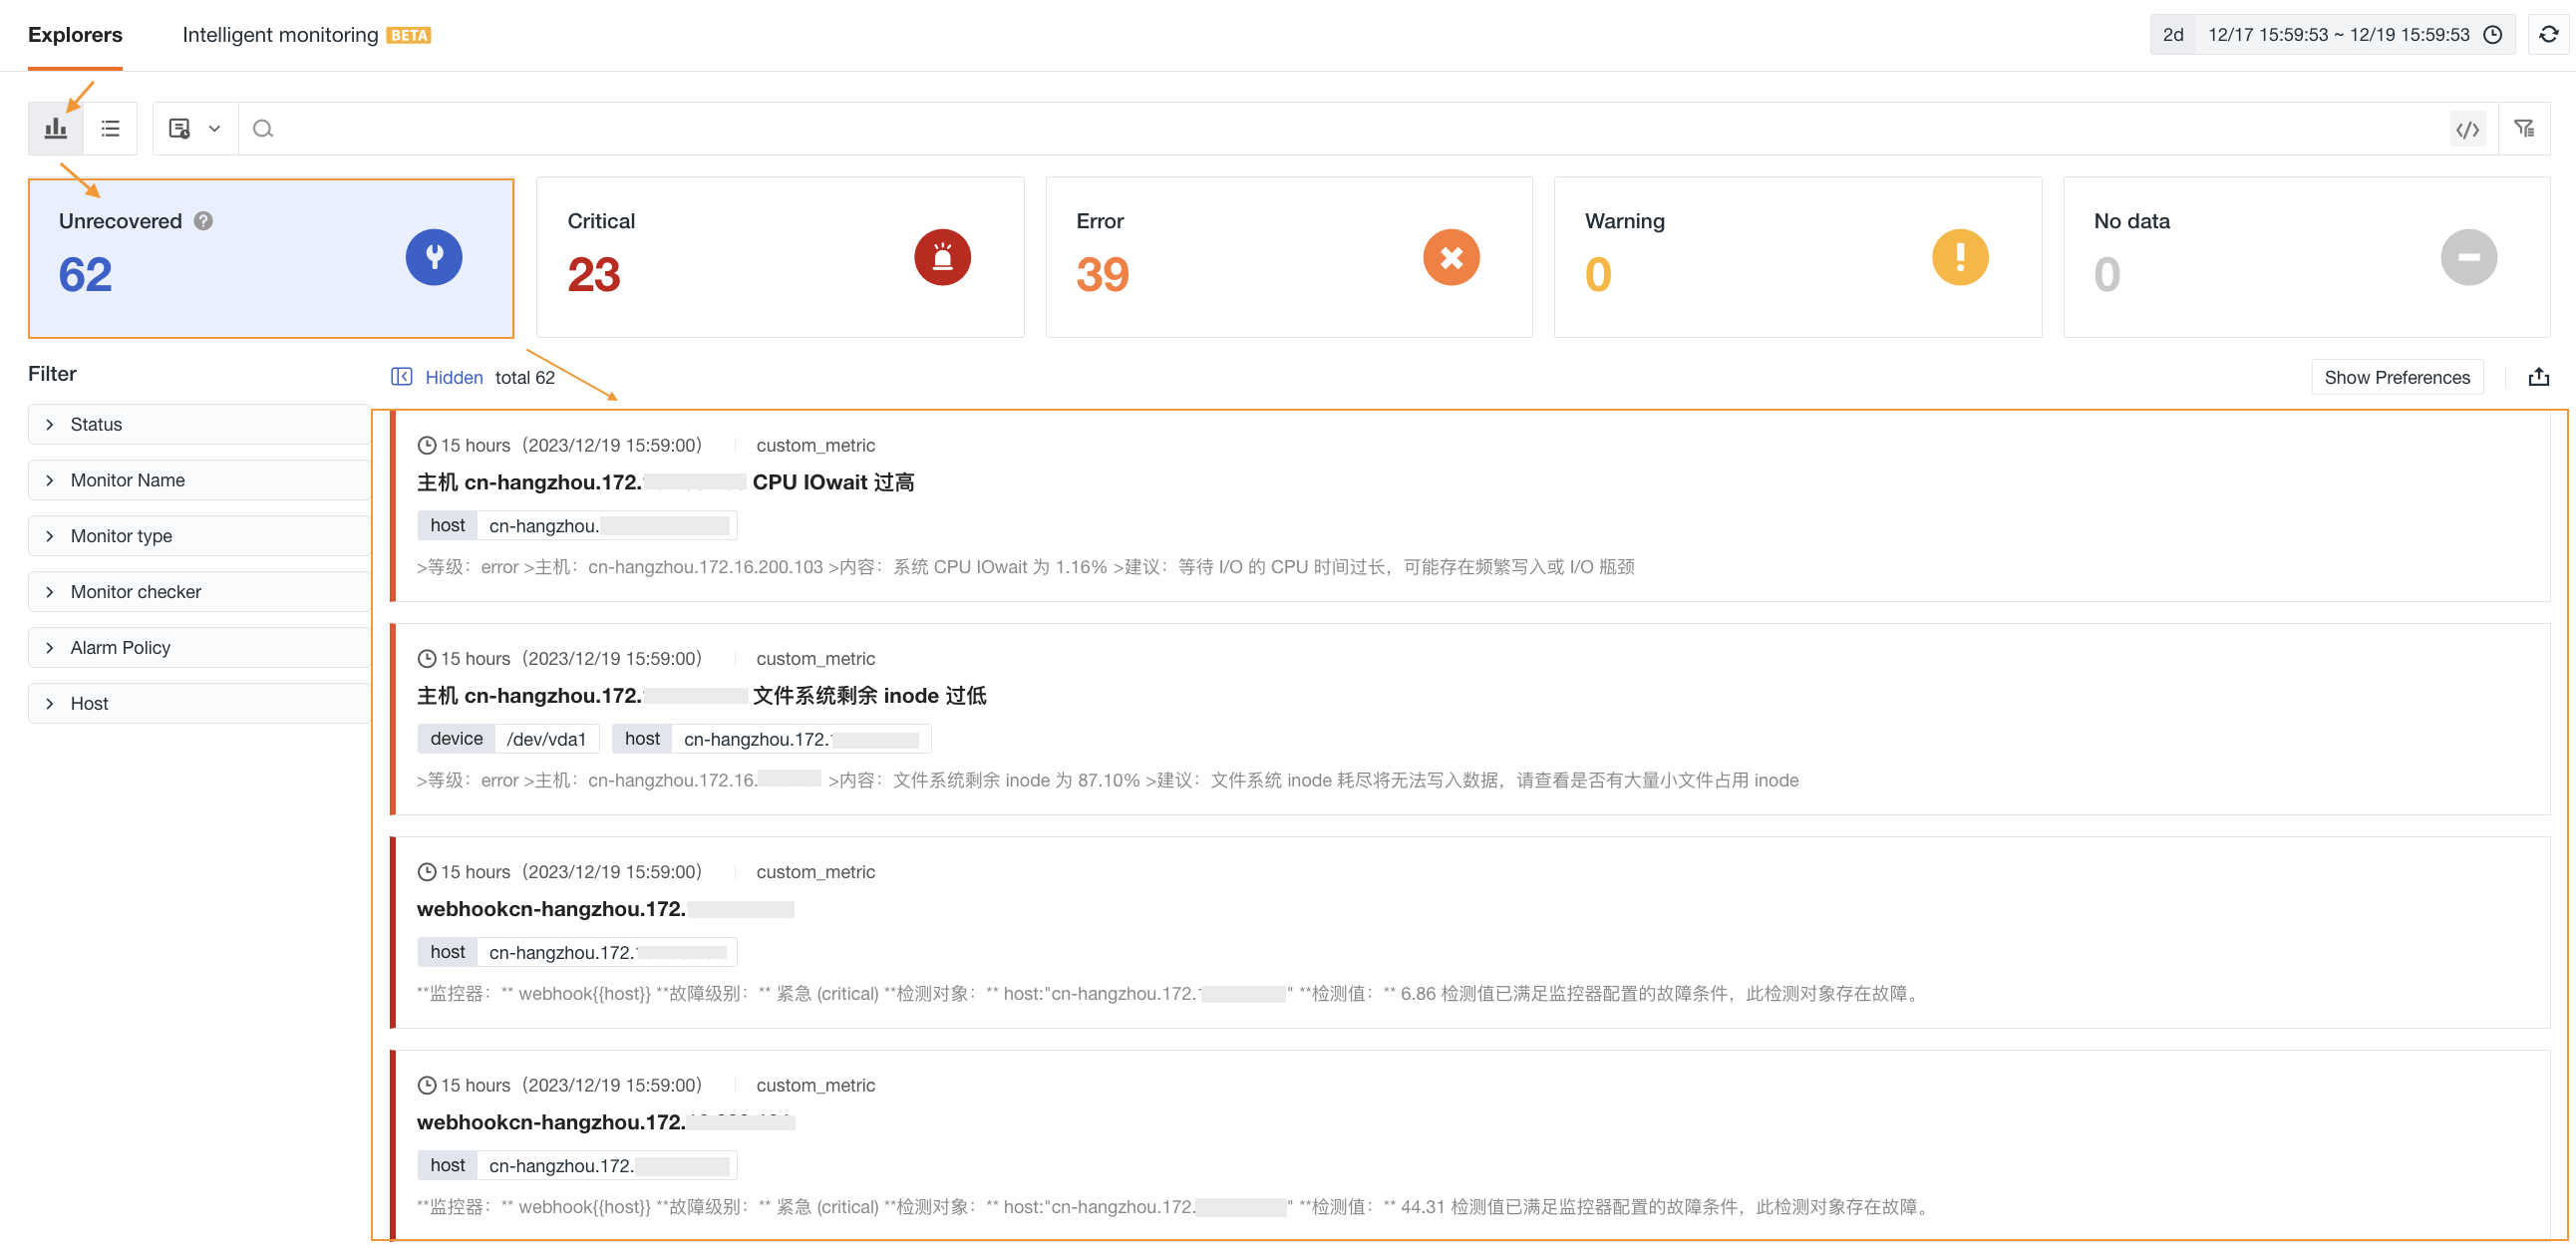
The Unrecovered Events explorer centrally displays all event records at alert levels in the current workspace, helping users fully understand the context of alert events, accelerating their understanding and awareness of events, while effectively reducing alert fatigue through associated monitors, alert policies, and more.
The Unrecovered Events data source queries event data, aggregates by df_fault_id as the unique identifier, and displays the most recent data results. Using this explorer visualization tool, you can intuitively view a series of key data points from event level to trigger threshold baseline. From event level, duration, alert notifications, monitors, event content, and historical trigger trend charts, this information forms a comprehensive view that helps you analyze and understand events from different angles, enabling more informed response decisions.
Core Logic
| Mechanism | Description |
|---|---|
| Aggregation dimension | Uses df_fault_id as the unique identifier to aggregate multiple event triggers of the same detection object into a single record. This means that multiple anomaly triggers of the same host under the same monitor rule appear as only one aggregated record in the Unrecovered Events list, avoiding alert storms. |
| Time window | By default, events with df_status != ok from the last 48 hours are displayed. You can adjust the time range, with a maximum of 7 days of data supported |
| Status determination | The level of the most recent event trigger of the detection object is used as the currently displayed level. If the event level changes during the triggering process (such as upgrading from warning to critical), the list displays the latest level |
Event Card
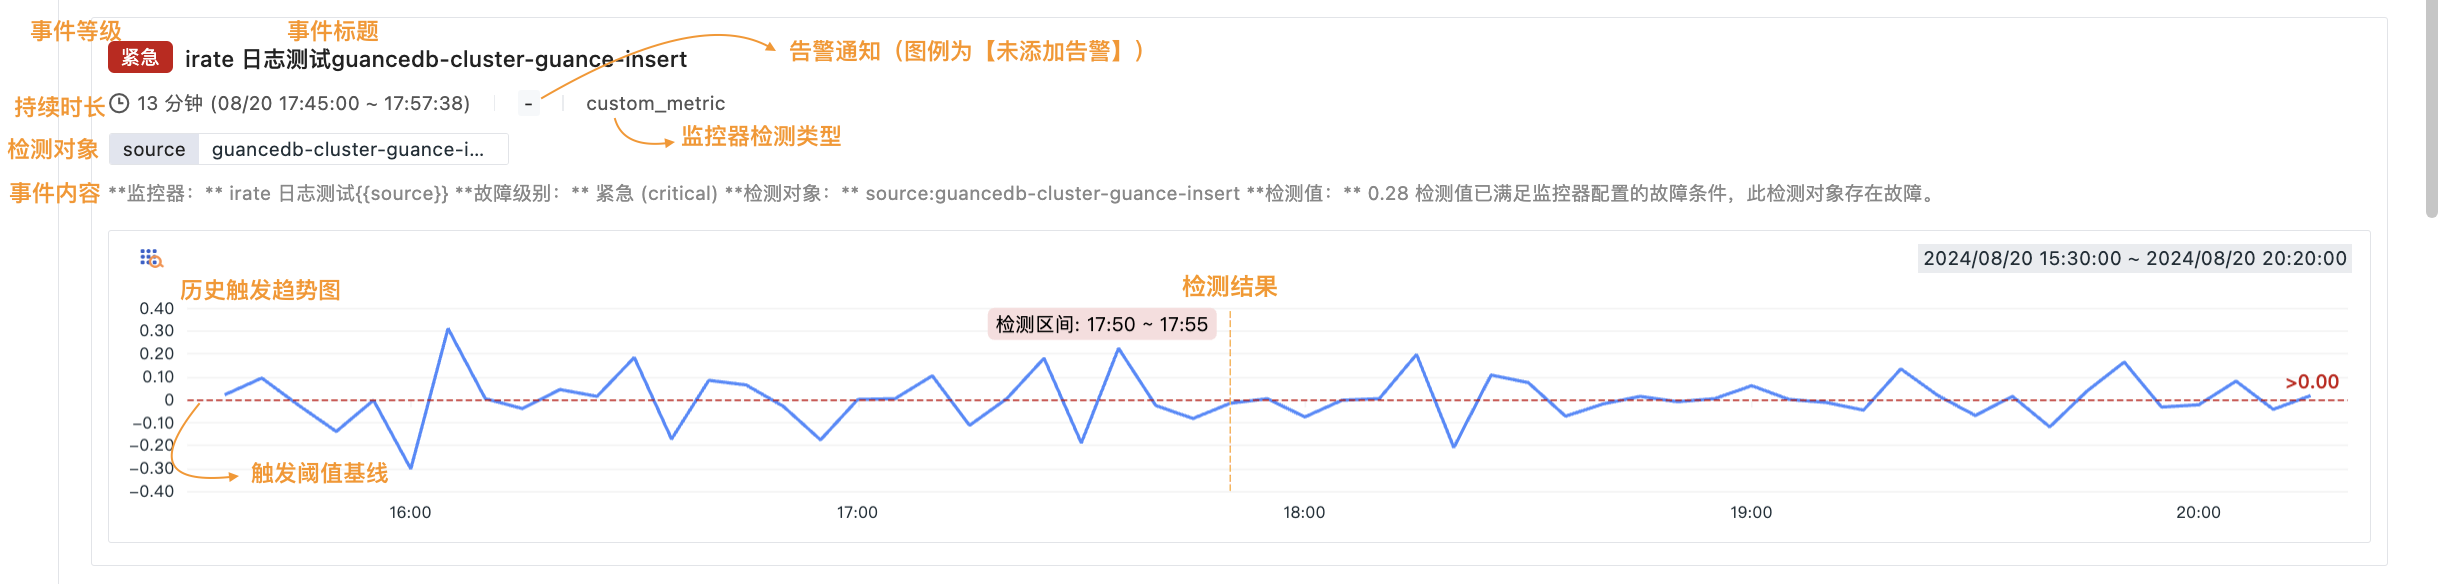
Before clicking an event to view details, the card presents key information in a structured way:
Event Level
Based on the monitor trigger conditions, the following status statistics are generated, with severity decreasing in order:
- Fatal (
fatal) - Critical (
critical) - Error (
error) - Warning (
warning) - No Data (
nodata)
In the Unrecovered Events explorer, each event's level is defined as the level of the most recent event trigger of that detection object. This means that if the same fault first triggers warning and then escalates to critical, the card displays the level as critical.
For more details, see Event Level Description.
Event Title
The event title displayed in the Unrecovered Events explorer directly comes from the title set when configuring the monitor rule. It represents the title used when the detection object last triggered an event. Titles typically include key variable substitutions, such as host names and metric values, allowing for quick identification of the problem object.
Duration
Represents the duration from the first anomaly trigger of the current detection object to the end time of the current time widget, such as 5 分钟 (08/20 17:53:00 ~ 17:57:38). This duration reflects how long the fault has persisted and is an important basis for assessing impact scope and urgency. If the duration exceeds the expected recovery time, it is recommended to prioritize handling or escalate.
Alert Notification
The alert notification status of the most recent event trigger of the current detection object, reflecting whether the event has reached the relevant personnel. It mainly includes the following three states:
- Muted: Indicates the current event is affected by a mute rule and no alert notification was sent externally. The event is only recorded in the system and no alert notification is sent externally, suitable for known issues or maintenance windows;
- The identifier of the actually sent notification target: Includes DingTalk bots, WeCom bots, Lark bots, etc., indicating the alert has been successfully pushed to the corresponding channel;
-: No external alert notification was triggered. Possible causes include no notification configured on the monitor, an invalid notification target, or exceeded notification frequency limits.
Monitor Detection Type
The monitor type, identifying which detection rule triggered the event, such as threshold detection, log detection, mutation detection, etc. The detection type helps you quickly locate the monitor configuration entry to adjust rules or temporarily disable them.
Detection Object
When configuring a monitor rule, if a by group query is used at the metric detection level, the event card displays the filter conditions, such as source:kodo-servicemap. This indicates that the event is a detection result grouped by a specific dimension rather than a global aggregation. Click the detection object tag to quickly filter other events in the same dimension.
Event Content
The event content of the most recent event trigger of the current detection object, sourced from the predefined content set when configuring the monitor rule. It represents the event content when the detection object last triggered an event. The content typically includes:
- Specific metric values at the time of trigger
- Comparison results with thresholds
- Predefined troubleshooting suggestions or handling guidance
- Complete description after variable substitution
Historical Trigger Trend Chart
This trend is displayed via a Window function, showing the detection result value history for 60 detections of actual data.
Based on the detection result values of the current unrecovered event, the historical event anomaly trend is displayed, with the trigger threshold condition value configured in the monitor detection rule set as a clear reference line. The system specifically marks the detection result of the most recent event trigger of the current detection object. Through the vertical lines in the trend chart, you can quickly locate the specific time point of the event trigger. At the same time, the corresponding detection interval of this detection result is also displayed, providing an intuitive analytical tool for evaluating the event development process and its impact.
Managing Event Cards
Display Options
The Unrecovered Events list supports the following display styles to accommodate different information density requirements across scenarios:
- Standard: Displays event title, detection dimension, and event content
- Expanded: In addition to standard information, displays the detection result value historical trend of the unrecovered event
- List: Displays event data in list form, with customizable fields
Muting Events
In large-scale monitoring scenarios, to avoid the tedious steps, time consumption, and risk of omission when manually handling a large number of similar alerts, you can directly "mute" rules on the current page. During the mute period, events continue to be detected and recorded, but alert notifications are no longer sent. This is suitable for the following scenarios:
- Known issues being fixed that require temporary noise reduction
- Planned maintenance windows with expected anomalies
- Batch alerts from non-production environments or low-priority systems
Mute Operation Steps
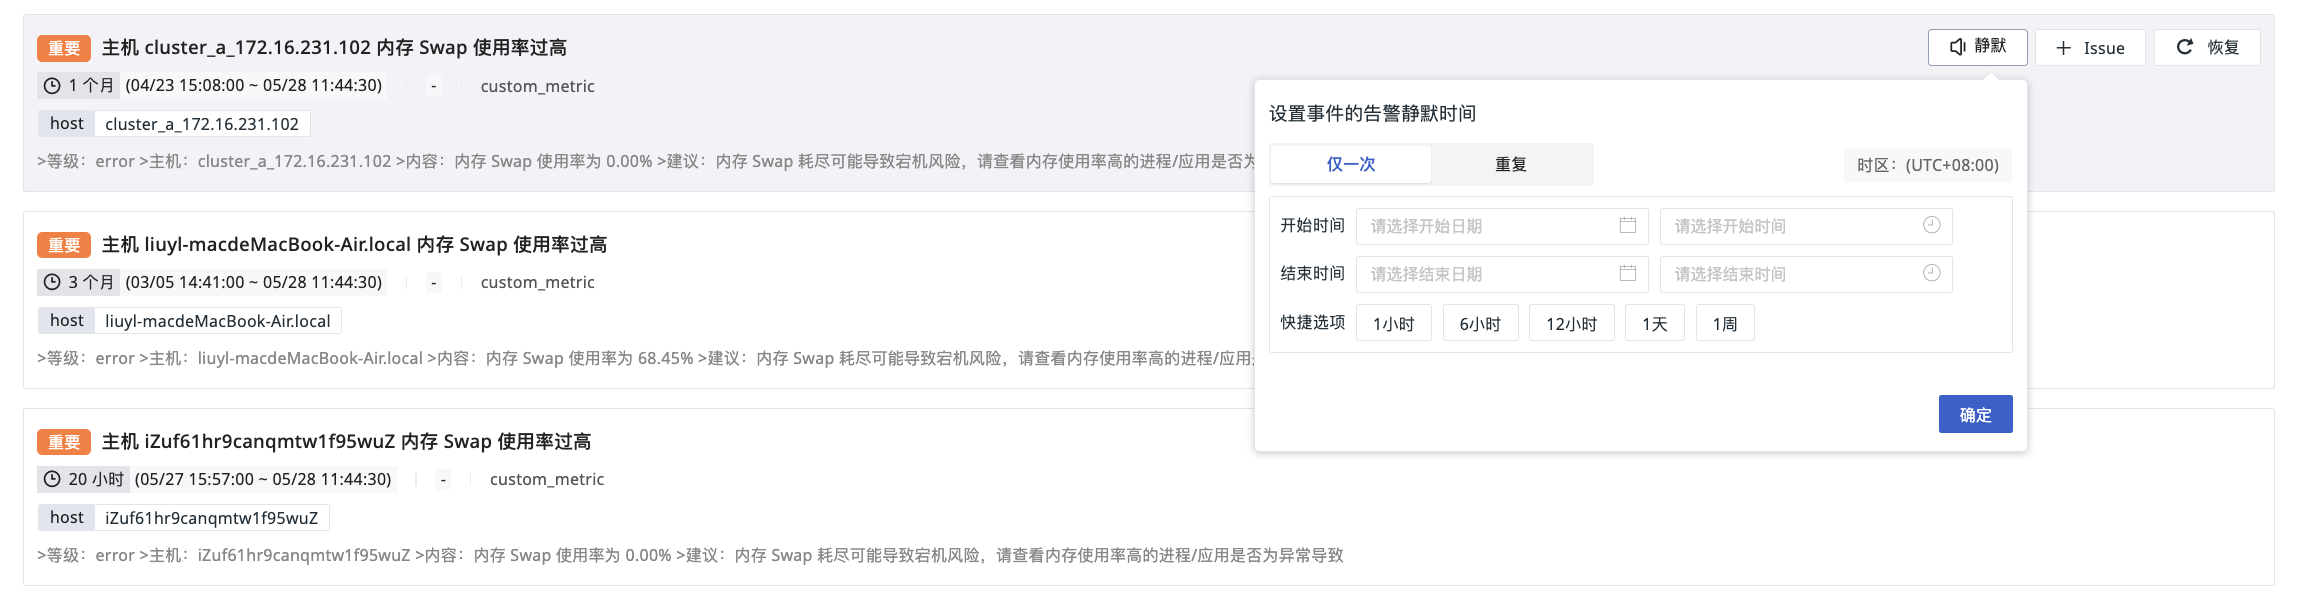
- Hover over a single event and click Mute on the right;
- Select the mute time type;
- Confirm.
Mute Time Types
Supports custom start and end times for muting, or quick setup for 1 hour, 6 hours, 12 hours, 1 day, or 1 week.
- Select the mute start time and duration;
- Select the mute period starting from a specific point;
- Select the mute expiration time. You can choose to repeat forever according to the above schedule or repeat until a specific time.
Recovering Events
An event is considered recovered when its status is normal (df_sub_status = ok). Recovery means that the detection object no longer satisfies the monitor's anomaly trigger conditions, or has been manually confirmed as resolved.
Manual recovery requires event recovery permissions. You can operate within the following scopes:
| Operation Scope | Operation Method |
|---|---|
| Single event | Click Recover on the event card or list row. If the event has an associated incident, you can select Recover Event or Recover Event and Associated Incident from the dropdown menu; if there is no associated incident, the event is recovered directly. |
| Selected events | Click Batch, select events, and then click Recover. If the selected events have associated incidents, you can also choose to recover only the events or to recover the associated incidents as well. |
| All events in the current filter scope | Click Recover All and confirm. This operation recovers events using the query scope of the current page; the current interface does not provide an option to simultaneously recover associated incidents. |
Single recovery requires confirmation in the confirmation dialog. Batch recovery only applies to the selected events, which differs from the scope of "Recover All".
Recovered events are divided into four types:
Name |
df_status |
Description |
|---|---|---|
| Recovered | ok | If the previously detected "fatal", "critical", "error", and "warning" anomaly events are not triggered again within N detections, the event is considered recovered. This is the most common type of automatic recovery, indicating that metrics have returned to the normal range |
| No Data Recovery | ok | Data is reported again after stopping, and is judged as recovered |
| No Data Considered Recovered | ok | Detection data experiences a gap and is considered as normal |
| Manual Recovery | ok | User manually clicks to recover, supporting single or batch recovery |