Pinpoint
DataKit 内置的 Pinpoint Agent 用于接收,运算,分析 Pinpoint Tracing 协议数据。
配置
采集器配置
进入 DataKit 安装目录下的 conf.d/samples 目录,复制 pinpoint.conf.sample 并命名为 pinpoint.conf。示例如下:
[[inputs.pinpoint]]
  ## Pinpoint service endpoint for
  ## - Span Server
  ## - Agent Server(unimplemented, for service intactness and compatibility)
  ## - Metadata Server(unimplemented, for service intactness and compatibility)
  ## - Profiler Server(unimplemented, for service intactness and compatibility)
  address = "127.0.0.1:9991"

  ## Keep rare tracing resources list switch.
  ## If some resources are rare enough(not presend in 1 hour), those resource will always send
  ## to data center and do not consider samplers and filters.
  # keep_rare_resource = false

  ## delete trace message
  # del_message = true

  ## Ignore tracing resources map like service:[resources...].
  ## The service name is the full service name in current application.
  ## The resource list is regular expressions uses to block resource names.
  ## If you want to block some resources universally under all services, you can set the
  ## service name as "*". Note: double quotes "" cannot be omitted.
  # [inputs.pinpoint.close_resource]
    # service1 = ["resource1", "resource2", ...]
    # service2 = ["resource1", "resource2", ...]
    # "*" = ["close_resource_under_all_services"]
    # ...

  ## Sampler config uses to set global sampling strategy.
  ## sampling_rate used to set global sampling rate.
  # [inputs.pinpoint.sampler]
    # sampling_rate = 1.0

  # [inputs.pinpoint.tags]
    # key1 = "value1"
    # key2 = "value2"
    # ...

  ## Storage config a local storage space in hard dirver to cache trace data.
  ## path is the local file path used to cache data.
  ## capacity is total space size(MB) used to store data.
  # [inputs.pinpoint.storage]
    # path = "./pinpoint_storage"
    # capacity = 5120
DataKit Pinpoint Agent 监听地址配置项为:
# Pinpoint GRPC service endpoint for
# - Span Server
# - Agent Server(unimplemented, for service intactness and compatibility)
# - Metadata Server(unimplemented, for service intactness and compatibility)
# - Profiler Server(unimplemented, for service intactness and compatibility)
address = "127.0.0.1:9991"
配置好后,重启 DataKit 即可。
可通过 ConfigMap 方式注入采集器配置 或 配置 ENV_DATAKIT_INPUTS 开启采集器。
也支持以环境变量的方式修改配置参数(需要在 ENV_DEFAULT_ENABLED_INPUTS 中加为默认采集器):
-
ENV_INPUT_PINPOINT_ADDRESS
代理 URL
字段类型: String
采集器配置字段:
address示例: 127.0.0.1:9991
-
ENV_INPUT_PINPOINT_KEEP_RARE_RESOURCE
保持稀有跟踪资源列表
字段类型: Boolean
采集器配置字段:
keep_rare_resource默认值: false
-
ENV_INPUT_PINPOINT_DEL_MESSAGE
删除 trace 消息
字段类型: Boolean
采集器配置字段:
del_message默认值: false
-
ENV_INPUT_PINPOINT_CLOSE_RESOURCE
忽略指定服务器的 tracing(正则匹配)
字段类型: JSON
采集器配置字段:
close_resource示例:
'{"service1":["resource1","other"],"service2":["resource2","other"]}' -
ENV_INPUT_PINPOINT_SAMPLER
全局采样率
字段类型: Float
采集器配置字段:
sampler示例: 0.3
-
ENV_INPUT_PINPOINT_STORAGE
本地缓存路径和大小(MB)
字段类型: JSON
采集器配置字段:
storage示例:
'{"storage":"./pinpoint_storage", "capacity": 5120}' -
ENV_INPUT_PINPOINT_TAGS
自定义标签。如果配置文件有同名标签,将会覆盖它
字段类型: JSON
采集器配置字段:
tags示例:
'{"k1":"v1", "k2":"v2", "k3":"v3"}'
DataKit 中的 Pinpoint Agent 存在以下限制
- 目前只支持 gRPC 协议
- 多服务(Agent/Metadata/Stat/Span)合一的服务使用同一个端口
- Pinpoint 链路与 DataKit 链路存在差异,详见下文
Pinpoint Agent 配置
- 下载所需的 Pinpoint APM Agent
Pinpoint 支持实现了多语言的 APM Collector 本文档使用 JAVA Agent 进行配置。下载 JAVA APM Collector。
-
配置 Pinpoint APM Collector,打开 /path_to_pinpoint_agent/pinpoint-root.config 配置相应的多服务端口
- 配置
profiler.transport.module = GRPC - 配置
profiler.transport.grpc.agent.collector.port = 9991(即 DataKit Pinpoint Agent 中配置的端口) - 配置
profiler.transport.grpc.metadata.collector.port = 9991(即 DataKit Pinpoint Agent 中配置的端口) - 配置
profiler.transport.grpc.stat.collector.port = 9991(即 DataKit Pinpoint Agent 中配置的端口) - 配置
profiler.transport.grpc.span.collector.port = 9991(即 DataKit Pinpoint Agent 中配置的端口)
- 配置
-
启动 Pinpoint APM Agent 启动命令
$ java -javaagent:/path_to_pinpoint/pinpoint-bootstrap.jar \
    -Dpinpoint.agentId=agent-id \
    -Dpinpoint.applicationName=app-name \
    -Dpinpoint.config=/path_to_pinpoint/pinpoint-root.config \
    -jar /path_to_your_app.jar
DataKit 链路数据遵循 OpenTracing 协议,DataKit 中一条链路是通过简单的父子(子 span 中存放父 span 的 id)结构串联起来且每个 span 对应一次函数调用
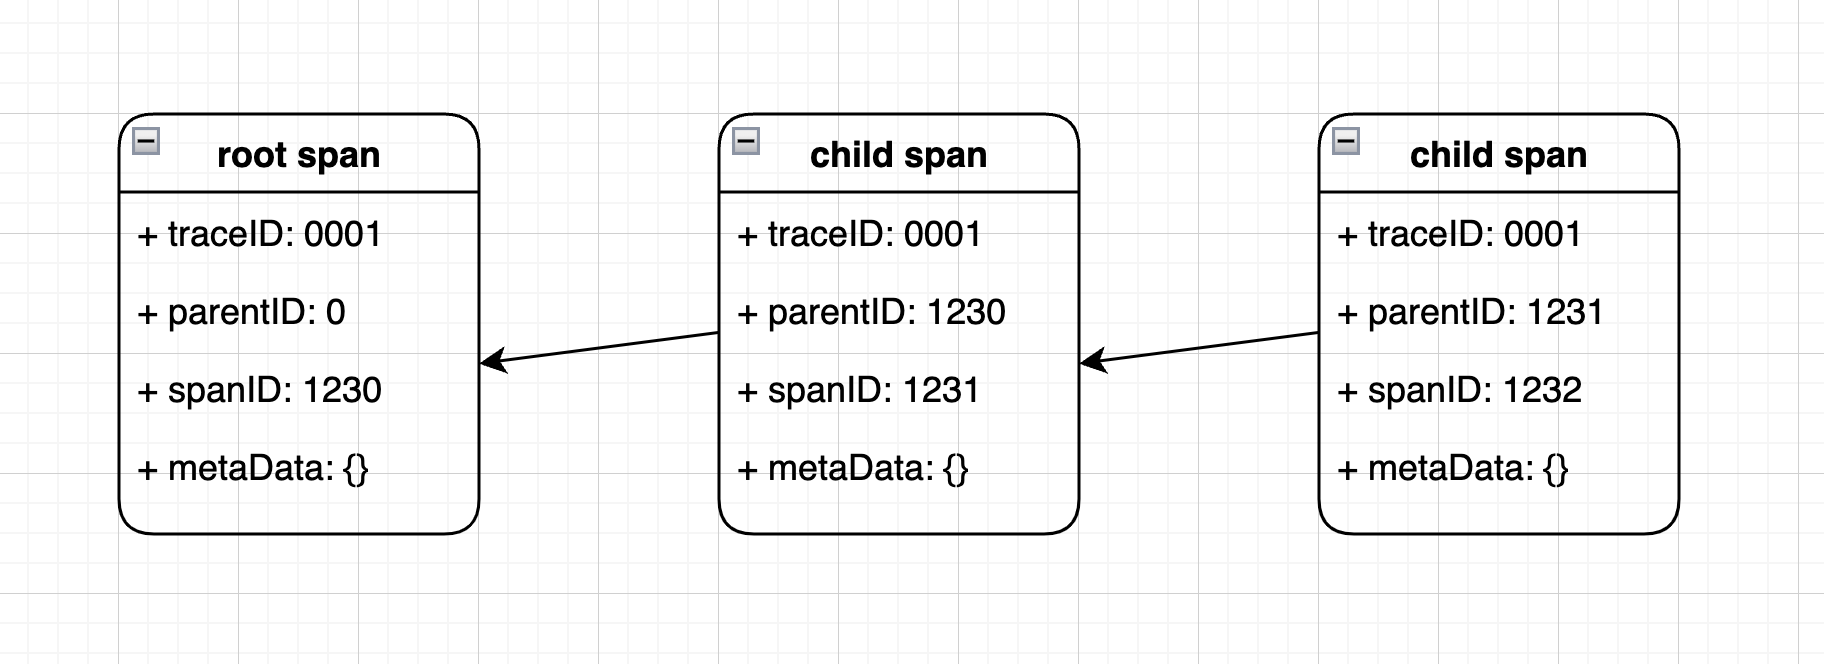
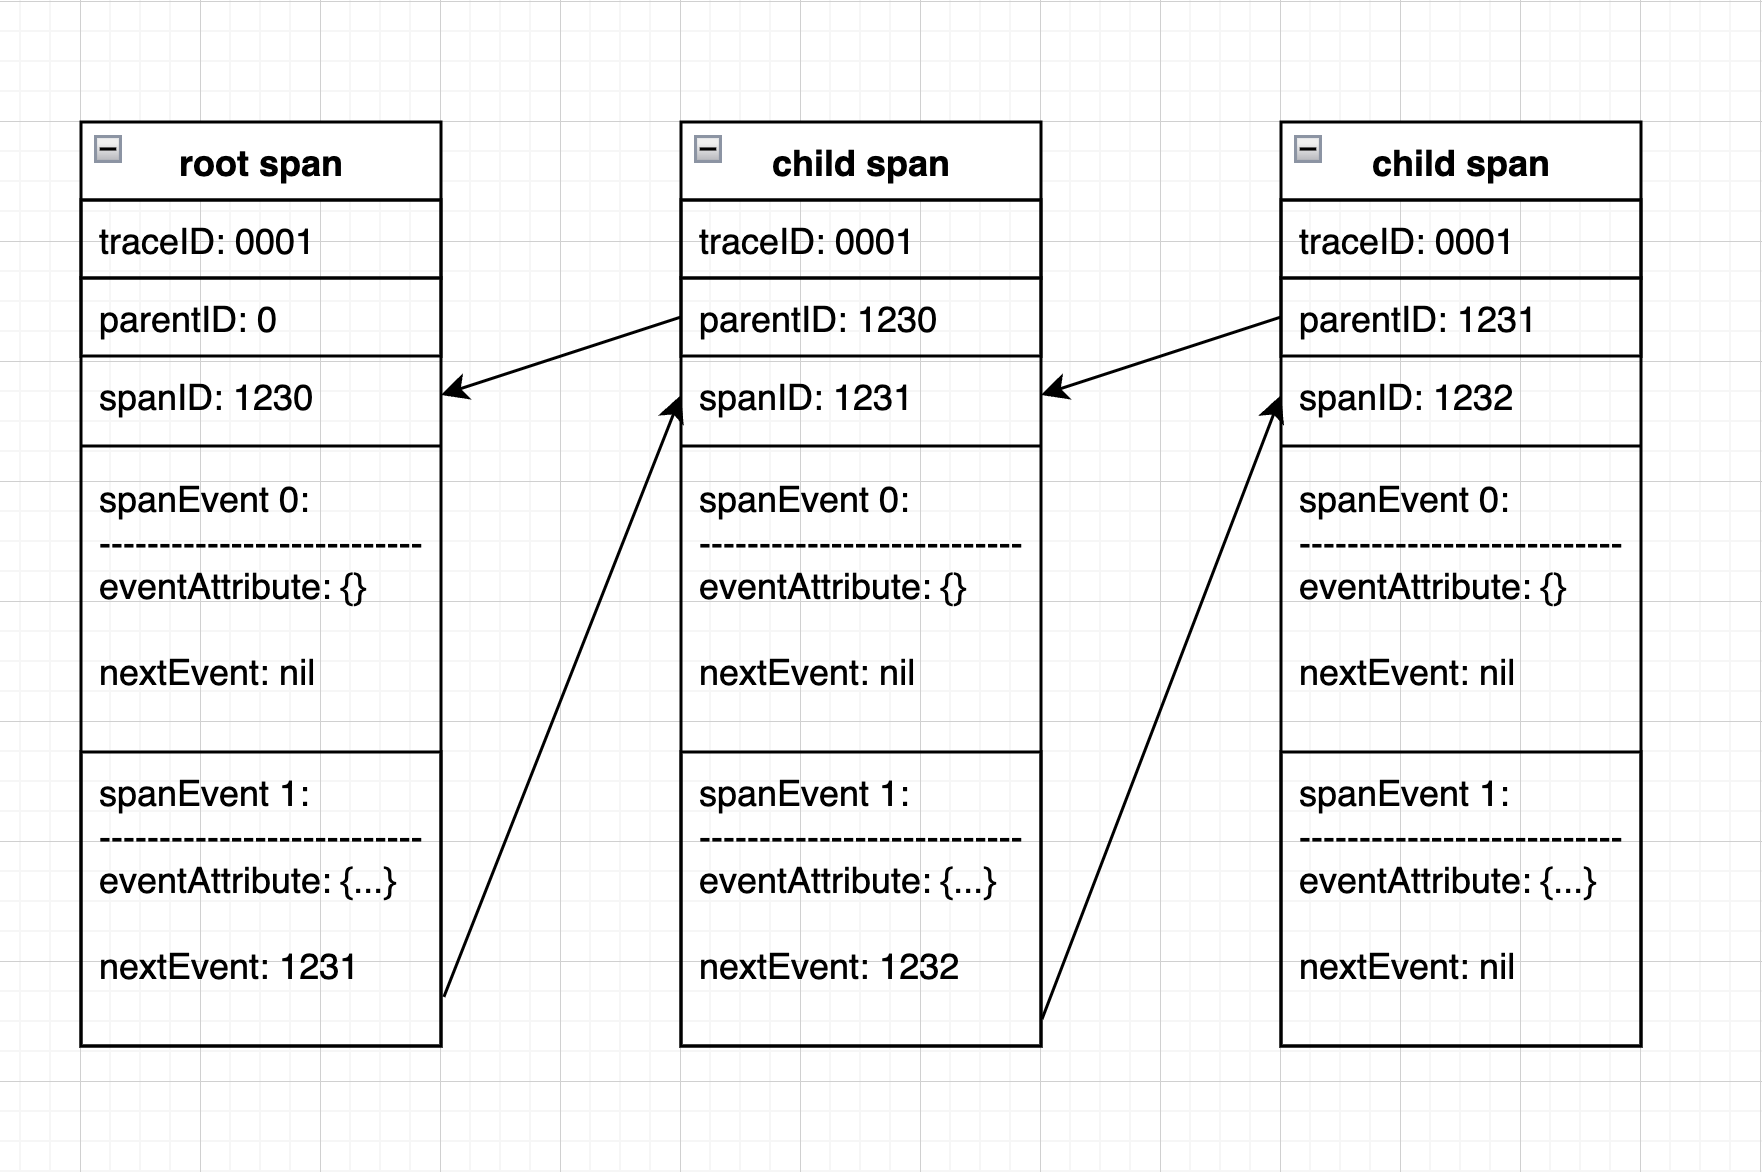
Pinpoint APM 链路数据较为复杂:
- 父 span 负责产生子 span 的 ID
- 子 span 中也要存放父 span 的 ID
- 使用 span event 替代 OpenTracing 中的 span
- 一个 span 为一个服务的一次应答过程
PinPointV2
DataKit 1.19.0 版本重新优化后更改 source 为 PinPointV2。 新版本的链路数据重新梳理 SpanChunk 和 Span 的关系、Event 和 Span 的关系、Span 与 Span 的关系。
以及 Event 中 startElapsed 和 endElapsed 时间对齐问题。
主要的逻辑点:
- 缓存
serviceType服务表,并写到文件中,防止 DataKit 重启而丢失数据。 Span中的parentSpanId不为 -1,则缓存。如parentSpanId:-1,则根据spanEvent中的nextSpanId从缓存中取出Span拼接到一个链路中。- 缓存所有
SpanChunk中的event,直到接收到主Span才从缓存中全部取出,追加到链路中。 - 按顺序累加当前
Event中startElapsed作为下一个Event的起始时间。 - 按照
Depth字段判断当前Event的父子级关系。 - 遇到数据库查询会将
sql语句替换当前的 '资源' 名称。
链路字段
pinpoint
Following is tags/fields of tracing data
| Tags & Fields | Description |
|---|---|
| base_service ( tag) |
Span base service name |
| container_host ( tag) |
Container hostname. Available in OpenTelemetry. Optional. |
| db_host ( tag) |
DB host name: ip or domain name. Optional. |
| db_name ( tag) |
Database name. Optional. |
| db_system ( tag) |
Database system name:mysql,oracle... Optional. |
| dk_fingerprint ( tag) |
DataKit fingerprint(always DataKit's hostname) |
| endpoint ( tag) |
Endpoint info. Available in SkyWalking, Zipkin. Optional. |
| env ( tag) |
Application environment info. Available in Jaeger. Optional. |
| host ( tag) |
Hostname. |
| http_method ( tag) |
HTTP request method name. Available in DDTrace, OpenTelemetry. Optional. |
| http_route ( tag) |
HTTP route. Optional. |
| http_status_code ( tag) |
HTTP response code. Available in DDTrace, OpenTelemetry. Optional. |
| http_url ( tag) |
HTTP URL. Optional. |
| operation ( tag) |
Span name |
| out_host ( tag) |
This is the database host, equivalent to db_host,only DDTrace-go. Optional. |
| project ( tag) |
Project name. Available in Jaeger. Optional. |
| service ( tag) |
Service name. Optional. |
| source_type ( tag) |
Tracing source type |
| span_type ( tag) |
Span type |
| status ( tag) |
Span status |
| version ( tag) |
Application version info. Available in Jaeger. Optional. |
| duration | Duration of span Type: int | (gauge) Unit: time,μs |
| message | Origin content of span Type: string Unit: N/A |
| parent_id | Parent span ID of current span Type: string Unit: N/A |
| resource | Resource name produce current span Type: string Unit: N/A |
| span_id | Span id Type: string Unit: N/A |
| start | start time of span. Type: int | (gauge) Unit: timeStamp,usec |
| trace_id | Trace id Type: string Unit: N/A |
指标字段
pp-agentStats-metric
Pinpoint agent JVM runtime statistics converted from Pinpoint PAgentStat batches.
| Tags & Fields | Description |
|---|---|
| agentVersion ( tag) |
Pinpoint agent version |
| agent_id ( tag) |
Agent ID |
| container ( tag) |
Whether it is a container |
| hostname ( tag) |
Host name |
| ip ( tag) |
Agent IP |
| pid ( tag) |
Process ID |
| ports ( tag) |
Open ports |
| GcNewCount | Cumulative new-generation garbage collection count reported by the Pinpoint agent. Type: int | (count) Unit: count Tagged by: agentVersion, agent_id, container, hostname, ip, pid, ports |
| GcNewTime | Cumulative new-generation garbage collection time in milliseconds reported by the Pinpoint agent. Type: int | (count) Unit: time,ms Tagged by: agentVersion, agent_id, container, hostname, ip, pid, ports |
| JvmCpuLoad | Recent JVM process CPU load ratio reported by the Pinpoint agent, in the range 0 to 1. Type: float | (gauge) Unit: percent,percent_decimal Tagged by: agentVersion, agent_id, container, hostname, ip, pid, ports |
| JvmGcOldCount | Cumulative old-generation garbage collection count reported by the Pinpoint agent. Type: int | (count) Unit: count Tagged by: agentVersion, agent_id, container, hostname, ip, pid, ports |
| JvmGcOldTime | Cumulative old-generation garbage collection time in milliseconds reported by the Pinpoint agent. Type: int | (count) Unit: time,ms Tagged by: agentVersion, agent_id, container, hostname, ip, pid, ports |
| JvmMemoryHeapMax | Maximum JVM heap memory in bytes. Type: int | (gauge) Unit: digital,B Tagged by: agentVersion, agent_id, container, hostname, ip, pid, ports |
| JvmMemoryHeapUsed | Current JVM heap memory used in bytes. Type: int | (gauge) Unit: digital,B Tagged by: agentVersion, agent_id, container, hostname, ip, pid, ports |
| JvmMemoryNonHeapMax | Maximum JVM non-heap memory in bytes; Pinpoint may report -1 when the maximum is undefined. Type: int | (gauge) Unit: digital,B Tagged by: agentVersion, agent_id, container, hostname, ip, pid, ports |
| JvmMemoryNonHeapUsed | Current JVM non-heap memory used in bytes. Type: int | (gauge) Unit: digital,B Tagged by: agentVersion, agent_id, container, hostname, ip, pid, ports |
| PoolCodeCacheUsed | JVM code-cache memory pool usage ratio reported by the Pinpoint agent, in the range 0 to 1. Type: float | (gauge) Unit: percent,percent_decimal Tagged by: agentVersion, agent_id, container, hostname, ip, pid, ports |
| PoolMetaspaceUsed | JVM metaspace memory pool usage ratio reported by the Pinpoint agent, in the range 0 to 1. Type: float | (gauge) Unit: percent,percent_decimal Tagged by: agentVersion, agent_id, container, hostname, ip, pid, ports |
| PoolNewGenUsed | JVM new-generation memory pool usage ratio reported by the Pinpoint agent, in the range 0 to 1. Type: float | (gauge) Unit: percent,percent_decimal Tagged by: agentVersion, agent_id, container, hostname, ip, pid, ports |
| PoolOldGenUsed | JVM old-generation memory pool usage ratio reported by the Pinpoint agent, in the range 0 to 1. Type: float | (gauge) Unit: percent,percent_decimal Tagged by: agentVersion, agent_id, container, hostname, ip, pid, ports |
| PoolPermGenUsed | JVM permanent-generation memory pool usage ratio reported by the Pinpoint agent; -1 means unavailable on JVMs without PermGen. Type: float | (gauge) Unit: percent,percent_decimal Tagged by: agentVersion, agent_id, container, hostname, ip, pid, ports |
| PoolSurvivorSpaceUsed | JVM survivor-space memory pool usage ratio reported by the Pinpoint agent, in the range 0 to 1. Type: float | (gauge) Unit: percent,percent_decimal Tagged by: agentVersion, agent_id, container, hostname, ip, pid, ports |
| SystemCpuLoad | Recent system CPU load ratio reported by the Pinpoint agent, in the range 0 to 1. Type: float | (gauge) Unit: percent,percent_decimal Tagged by: agentVersion, agent_id, container, hostname, ip, pid, ports |