DDTrace Golang
目前有两种插桩方式:编译时插桩和代码侵入式手动插桩。侵入性插桩需要修改已有代码,但一般不需要做太多变更,只需要替换相关的 import 包即可。
DDTrace 推出编译时接入 APM 需要安装 Orchestrion。
以下是这两种方式的使用方式介绍。
编译时插桩
要求:
- Go 版本必须 1.18+
- 必须使用 Go Module 管理项目。
- 安装 DataKit 并开启 DDTrace 采集器
- 安装 Orchestrion
如果安装失败,尝试将项目克隆到本地再编译。
git clone https://github.com/DataDog/orchestrion.git
cd orchestrion/
go build
cp orchestrion $GOPATH/bin/
- 初始化 Orchestrion
- 编译 & 运行
使用以下三种方式的一种进行编译你的项目:
- 在
go build命令之前:
- 使用
-toolexec方式:
go build -toolexec="orchestrion toolexec" .
go run -toolexec="orchestrion toolexec" .
go test -toolexec="orchestrion toolexec" ./...
- 修改环境变量
$GOFLAGS:
编译之后的执行程序就可以在运行过程中触发链路并上传。
使用环境变量修改各种配置与别的语言都是一样的,具体参考下方文档中的环境变量配置。
更多文档
手动方式插桩
安装 DDTrace Golang SDK:
安装 profiling 库
其它跟组件有关的库,视情况而定,比如:
go get gopkg.in/DataDog/dd-trace-go.v1/contrib/gorilla/mux
go get gopkg.in/DataDog/dd-trace-go.v1/contrib/net/http
go get gopkg.in/DataDog/dd-trace-go.v1/contrib/database/sql
我们可以从 GitHub 插件库或 Datadog 相关支持文档了解更多可用的 tracing SDK。
代码示例
简单的 HTTP 服务
package main

import (
  "log"
  "net/http"
  "time"

  httptrace "gopkg.in/DataDog/dd-trace-go.v1/contrib/net/http"
  "gopkg.in/DataDog/dd-trace-go.v1/ddtrace/tracer"
  "gopkg.in/DataDog/dd-trace-go.v1/profiler"
)

func main() {
  tracer.Start(
    tracer.WithService("test"),
    tracer.WithEnv("test"),
  )
  defer tracer.Stop()

  err := profiler.Start(
    profiler.WithService("test"),
    profiler.WithEnv("test"),
    profiler.WithProfileTypes(
      profiler.CPUProfile,
      profiler.HeapProfile,

      // The profiles below are disabled by
      // default to keep overhead low, but
      // can be enabled as needed.
      // profiler.BlockProfile,
      // profiler.MutexProfile,
      // profiler.GoroutineProfile,
    ),
  )
  if err != nil {
    log.Fatal(err)
  }
  defer profiler.Stop()

  // Create a traced mux router
  mux := httptrace.NewServeMux()
  // Continue using the router as you normally would.
  mux.HandleFunc("/", func(w http.ResponseWriter, r *http.Request) {
    time.Sleep(time.Second)
    w.Write([]byte("Hello World!"))
  })
  if err := http.ListenAndServe(":18080", mux); err != nil {
    log.Fatal(err)
  }
}
编译运行
手动埋点
以下代码演示了一个文件打开操作的 trace 数据收集。
在 main() 入口代码中,设置好基本的 trace 参数,并启动 trace:
package main

import (
    "io/ioutil"
    "os"
    "time"

    "gopkg.in/DataDog/dd-trace-go.v1/ddtrace/ext"
    "gopkg.in/DataDog/dd-trace-go.v1/ddtrace/tracer"
)

func main() {
    tracer.Start(
        tracer.WithEnv("prod"),
        tracer.WithService("test-file-read"),
        tracer.WithServiceVersion("1.2.3"),
        tracer.WithGlobalTag("project", "add-ddtrace-in-golang-project"),
    )

    // end of app exit, make sure tracer stopped
    defer tracer.Stop()

    tick := time.NewTicker(time.Second)
    defer tick.Stop()

    // your-app-main-entry...
    for {
        runApp()
        runAppWithError()

        select {
        case <-tick.C:
        }
    }
}

func runApp() {
    var err error
    // Start a root span.
    span := tracer.StartSpan("get.data")
    defer span.Finish(tracer.WithError(err))

    // Create a child of it, computing the time needed to read a file.
    child := tracer.StartSpan("read.file", tracer.ChildOf(span.Context()))
    child.SetTag(ext.ResourceName, os.Args[0])

    // Perform an operation.
    var bts []byte
    bts, err = ioutil.ReadFile(os.Args[0])
    span.SetTag("file_len", len(bts))
    child.Finish(tracer.WithError(err))
}

func runAppWithError() {
    var err error
    // Start a root span.
    span := tracer.StartSpan("get.data")

    // Create a child of it, computing the time needed to read a file.
    child := tracer.StartSpan("read.file", tracer.ChildOf(span.Context()))
    child.SetTag(ext.ResourceName, "somefile-not-found.go")

    defer func() {
        child.Finish(tracer.WithError(err))
        span.Finish(tracer.WithError(err))
    }()

    // Perform an error operation.
    if _, err = ioutil.ReadFile("somefile-not-found.go"); err != nil {
        // error handle
    }
}
编译运行
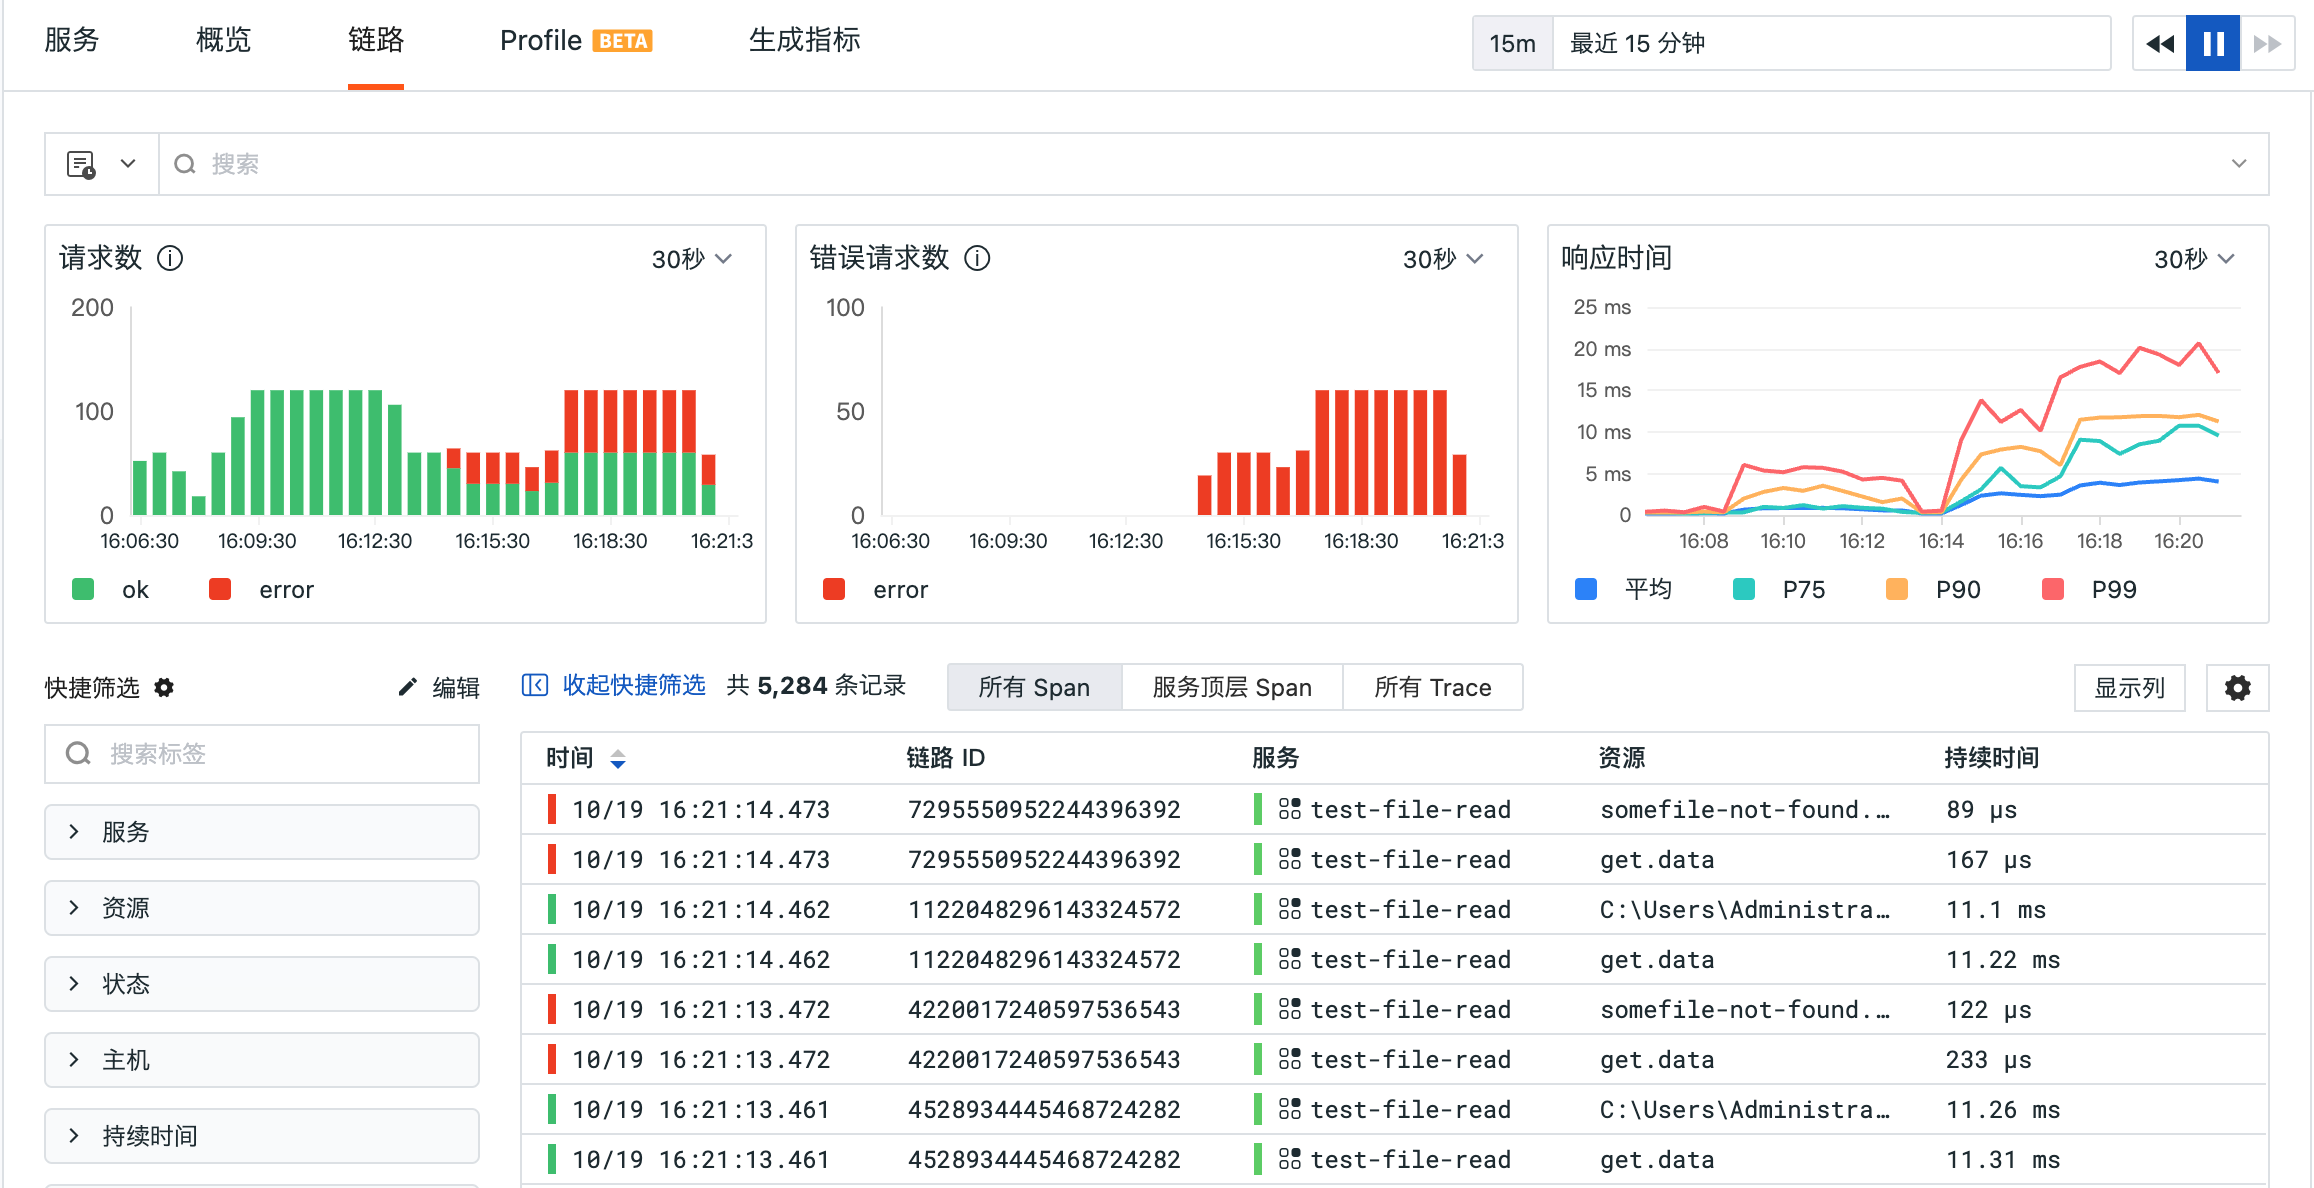
程序运行一段时间后,即可在观测云看到类似如下 trace 数据:
支持的环境变量
以下环境变量支持在启动程序的时候指定 DDTrace 的一些配置参数,其基本形式为:
更多环境变量支持,参见 DDTrace-Go 文档
Info
这些环境变量将会被代码中用 WithXXX() 注入的对应字段覆盖,故代码注入的配置,优先级更高,这些 ENV 只有在代码未指定对应字段时才生效。
-
DD_VERSION设置应用程序版本,如
1.2.3、2022.02.13 -
DD_SERVICE设置应用服务名
-
DD_ENV设置应用当前的环境,如
prod、pre-prod等 -
DD_AGENT_HOST默认值:
localhost设置 DataKit 的 IP 地址,应用产生的 trace 数据将发送给 DataKit
-
DD_TRACE_AGENT_PORT设置 DataKit trace 数据的接收端口。这里需手动指定 DataKit 的 HTTP 端口(一般为 9529)
-
DD_DOGSTATSD_PORT默认值:
8125如果要接收 DDTrace 产生的 StatsD 数据,需在 DataKit 上手动开启 StatsD 采集器 -
DD_TRACE_SAMPLING_RULES默认值:
nil这里用 JSON 数组来表示采样设置(采样率应用以数组顺序为准),其中
sample_rate为采样率,取值范围为[0.0, 1.0]。示例一:设置全局采样率为 20%:
DD_TRACE_SAMPLING_RULES='[{"sample_rate": 0.2}]' ./my-app示例二:服务名通配
app1.*、且 span 名称为abc的,将采样率设置为 10%,除此之外,采样率设置为 20%:DD_TRACE_SAMPLING_RULES='[{"service": "app1.*", "name": "b", "sample_rate": 0.1}, {"sample_rate": 0.2}]' ./my-app -
DD_TRACE_SAMPLE_RATE默认值:
nil开启上面的采样率开关
-
DD_TRACE_RATE_LIMIT设置每个 Golang 进程每秒钟的 span 采样数。如果
DD_TRACE_SAMPLE_RATE已经打开,则默认为 100 -
DD_TAGS默认值:
[]这里可注入一组全局 tag,这些 tag 会出现在每个 span 和 profile 数据中。多个 tag 之间可以用空格和英文逗号分割,例如
layer:api,team:intake、layer:api team:intake -
DD_TRACE_STARTUP_LOGS默认值:
true开启 DDTrace 有关的配置和诊断日志
-
DD_TRACE_DEBUG默认值:
false开启 DDTrace 有关的调试日志
-
DD_TRACE_ENABLED默认值:
true开启 trace 开关。如果手动将该开关关闭,则不会产生任何 trace 数据
-
DD_SERVICE_MAPPING默认值:
null动态重命名服务名,各个服务名映射之间可用空格和英文逗号分割,如mysql:mysql-service-name,postgres:postgres-service-name,mysql:mysql-service-name postgres:postgres-service-name