Rancher를 사용하여 DataKit 배포 및 관리, Kubernetes 생태계의 관측 가능성 구축
개요
기업 규모가 어느 정도 커지면 서버, Kubernetes 환경, 마이크로서비스 애플리케이션이 점점 더 많아집니다. 이러한 리소스를 효율적으로 관측 가능하게 하여 인력 및 리소스 비용을 절감하는 것은 기업이 직면한 과제입니다. Rancher 애플리케이션 스토어의 DataKit을 원클릭으로 배포하면 Guance에서 Rancher가 관리하는 K8s 클러스터에 대해 다양한 즉시 사용 가능한 관측 가능성 기능을 제공합니다.
이 문서에서는 잘 알려진 service mesh 마이크로서비스 아키텍처인 Bookinfo 사례를 통해 Guance을 사용하여 K8s, Istio, CI/CD, 카나리아 배포 등 마이크로서비스 엔드투엔드 전체 체인의 관측 가능성을 한 번에 향상시키는 방법을 자세히 설명합니다.
Guance은 클라우드 네이티브 분야의 관측 가능성을 선도하는 기업입니다. 하나의 플랫폼을 사용하고 DataKit Agent를 배포하면 호스트, 애플리케이션의 메트릭, 트레이스, 로그를 연결할 수 있습니다. 사용자가 Guance에 로그인하면 K8s 런타임 및 마이크로서비스 애플리케이션의 상태를 실시간으로 능동적으로 관측할 수 있습니다.
사례 가정
한 회사가 여러 대의 클라우드 서버, 두 개의 Kubernetes 클러스터(프로덕션 환경 1개, 테스트 환경 1개)를 보유하고 있다고 가정합니다. 테스트 환경에는 Master 노드 1대, Node 노드 2대가 있습니다. 클라우드 서버에는 Harbor, Gitlab이 배포되어 있고, Kubernetes 테스트 환경에는 Istio 프로젝트 bookinfo가 배포되어 있습니다.
이제 Guance을 사용하여 호스트, Kubernetes 클러스터, Gitlab CI, 카나리아 배포, RUM, APM, Istio 등을 관측 가능하게 합니다.
전제 조건
- Kubernetes 1.18+ 설치
- Rancher 설치 및 Kubernetes 클러스터 운영 권한
- Gitlab 설치
- Helm 3.0+ 설치
- Harbor 레지스트리 또는 기타 이미지 레지스트리 배포
절차
Warning
이 예시에서 사용된 버전 정보는 다음과 같습니다: DataKit 1.4.0, Kubernetes 1.22.6, Rancher 2.6.3, Gitlab 14.9.4, Istio 1.13.2. 버전이 다르면 구성에 차이가 있을 수 있습니다.
1단계: Rancher를 사용하여 DataKit 설치
관리를 용이하게 하기 위해 DataKit은 datakit 네임스페이스에 설치합니다.
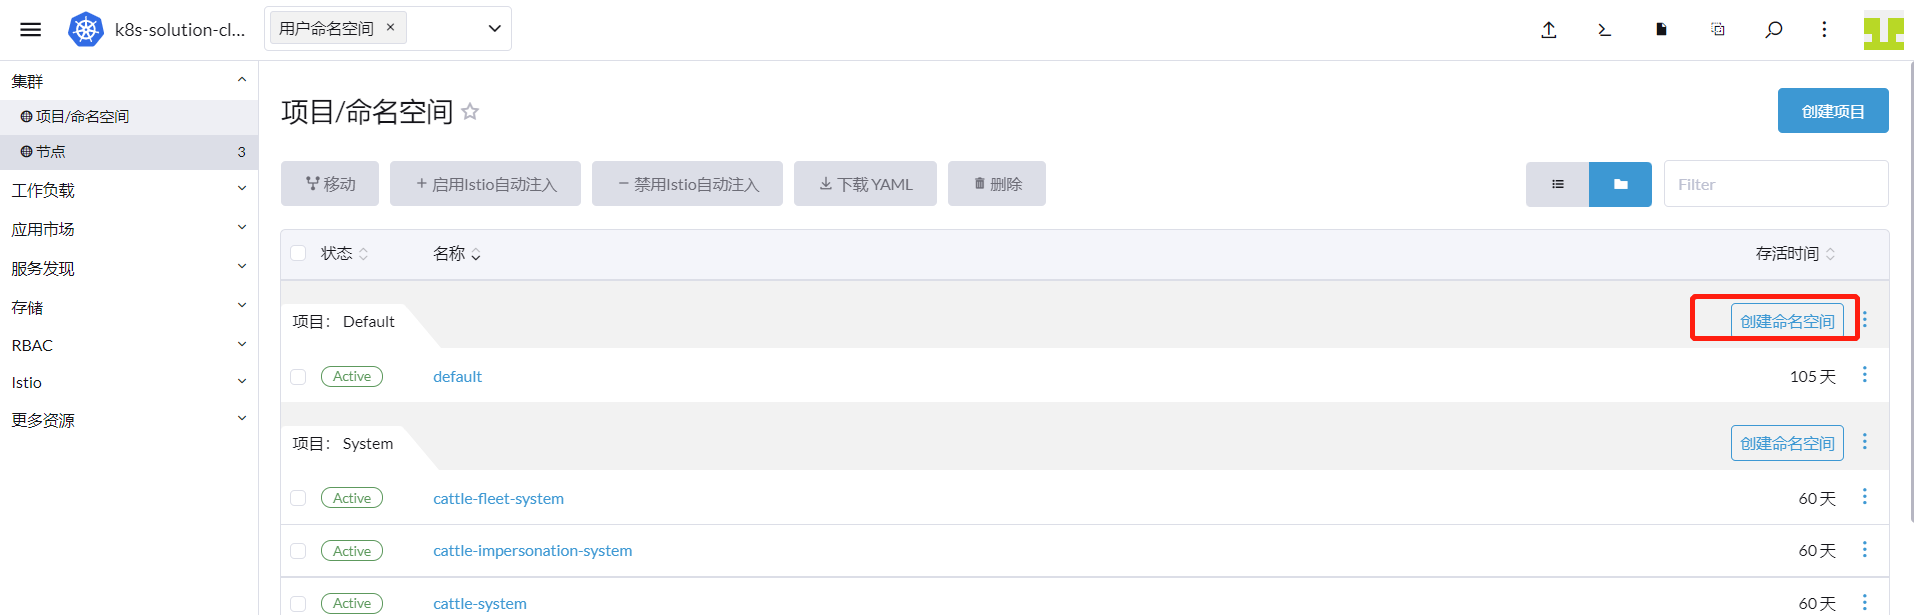
「Rancher」 → 「클러스터」 → 「프로젝트/네임스페이스」로 이동하여 「네임스페이스 생성」을 클릭합니다.
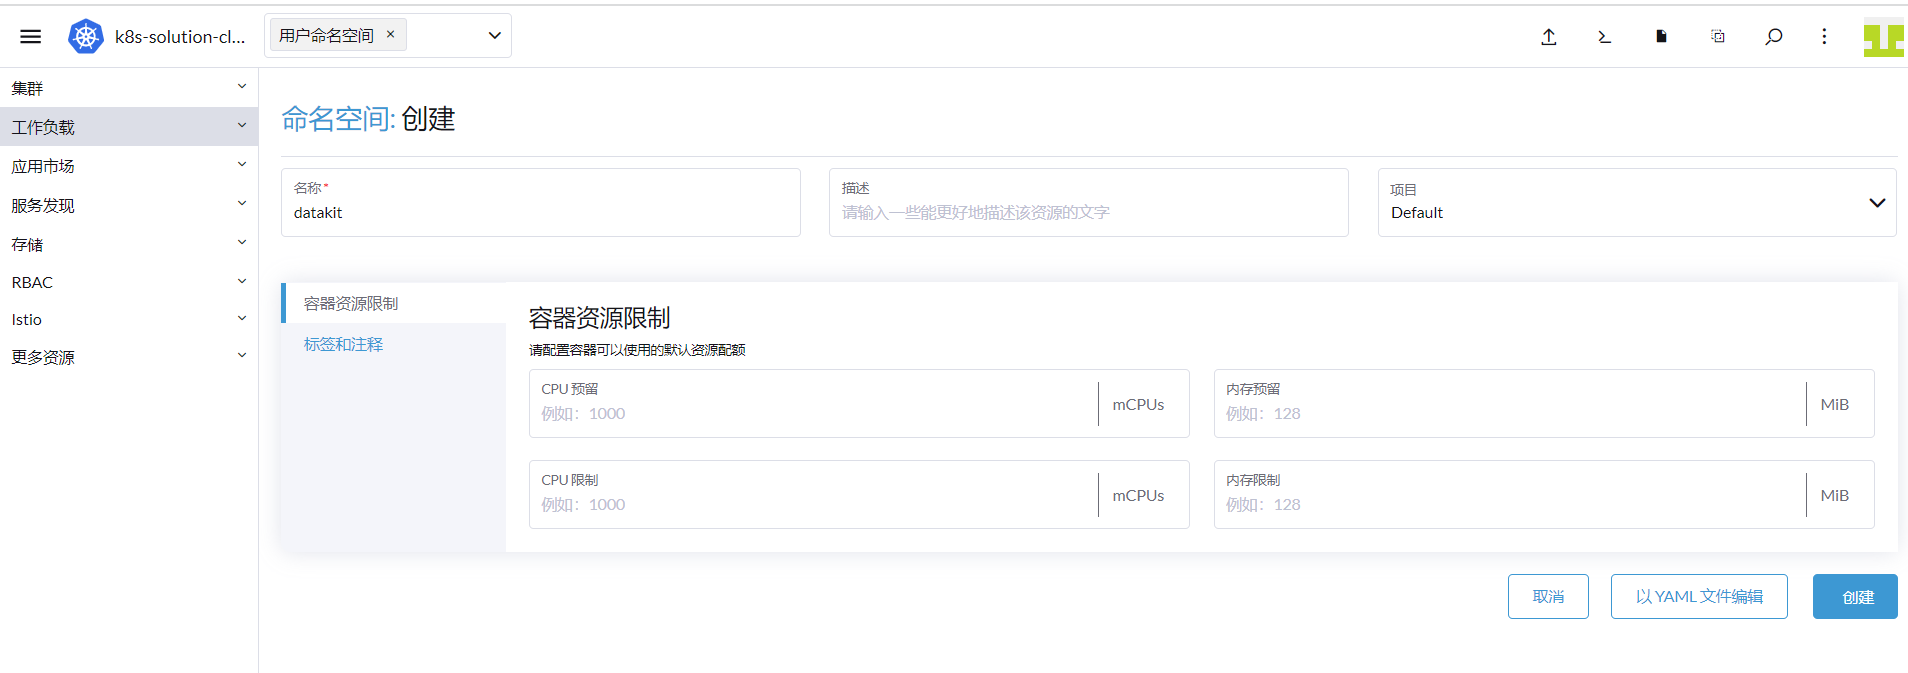
이름에 「datakit」를 입력하고 「생성」을 클릭합니다.
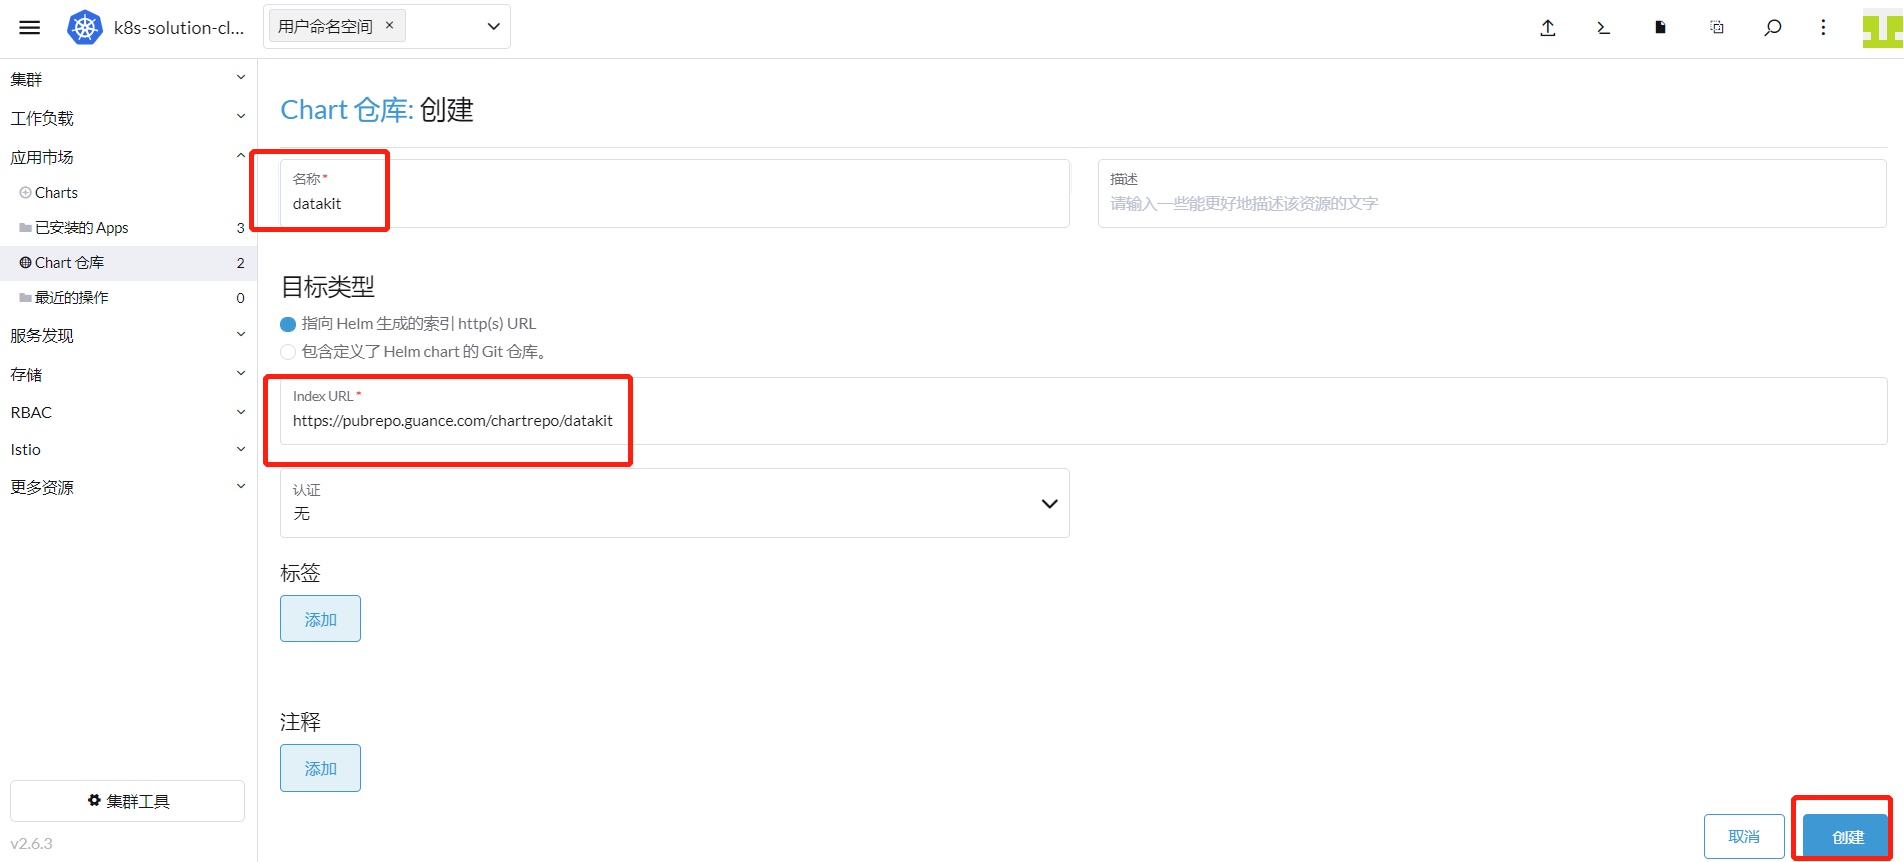
「클러스터」 → 「앱 마켓플레이스」 → 「Chart 저장소」로 이동하여 「생성」을 클릭합니다.
이름에 「datakit」를 입력하고 URL에 [https://pubrepo.guance.com/chartrepo/datakit](https://pubrepo.guance.com/chartrepo/datakit)를 입력한 후 「생성」을 클릭합니다.
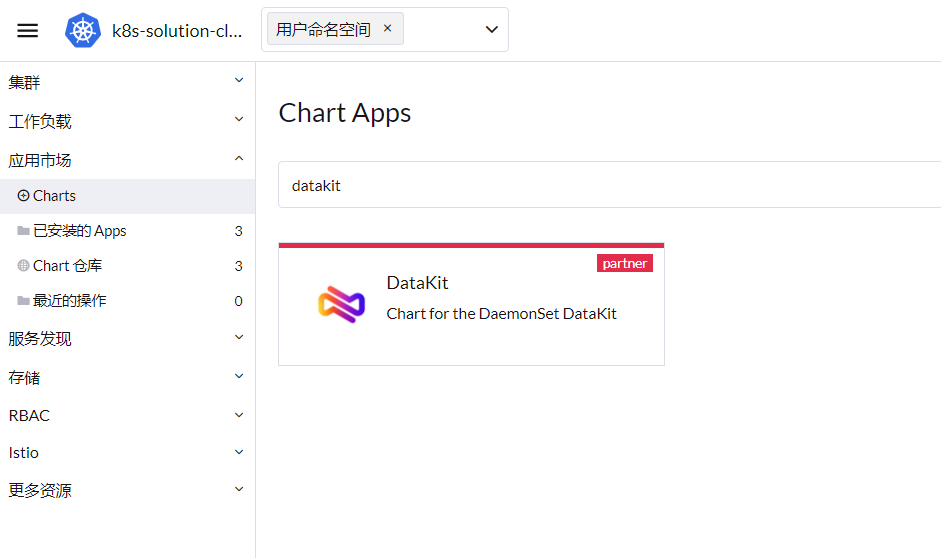
「클러스터」 → 「앱 마켓플레이스」 → 「Charts」로 이동하여 「datakit」를 선택하면 아래 그림과 같이 DataKit이 표시된 차트가 나타납니다. 클릭하여 들어갑니다.
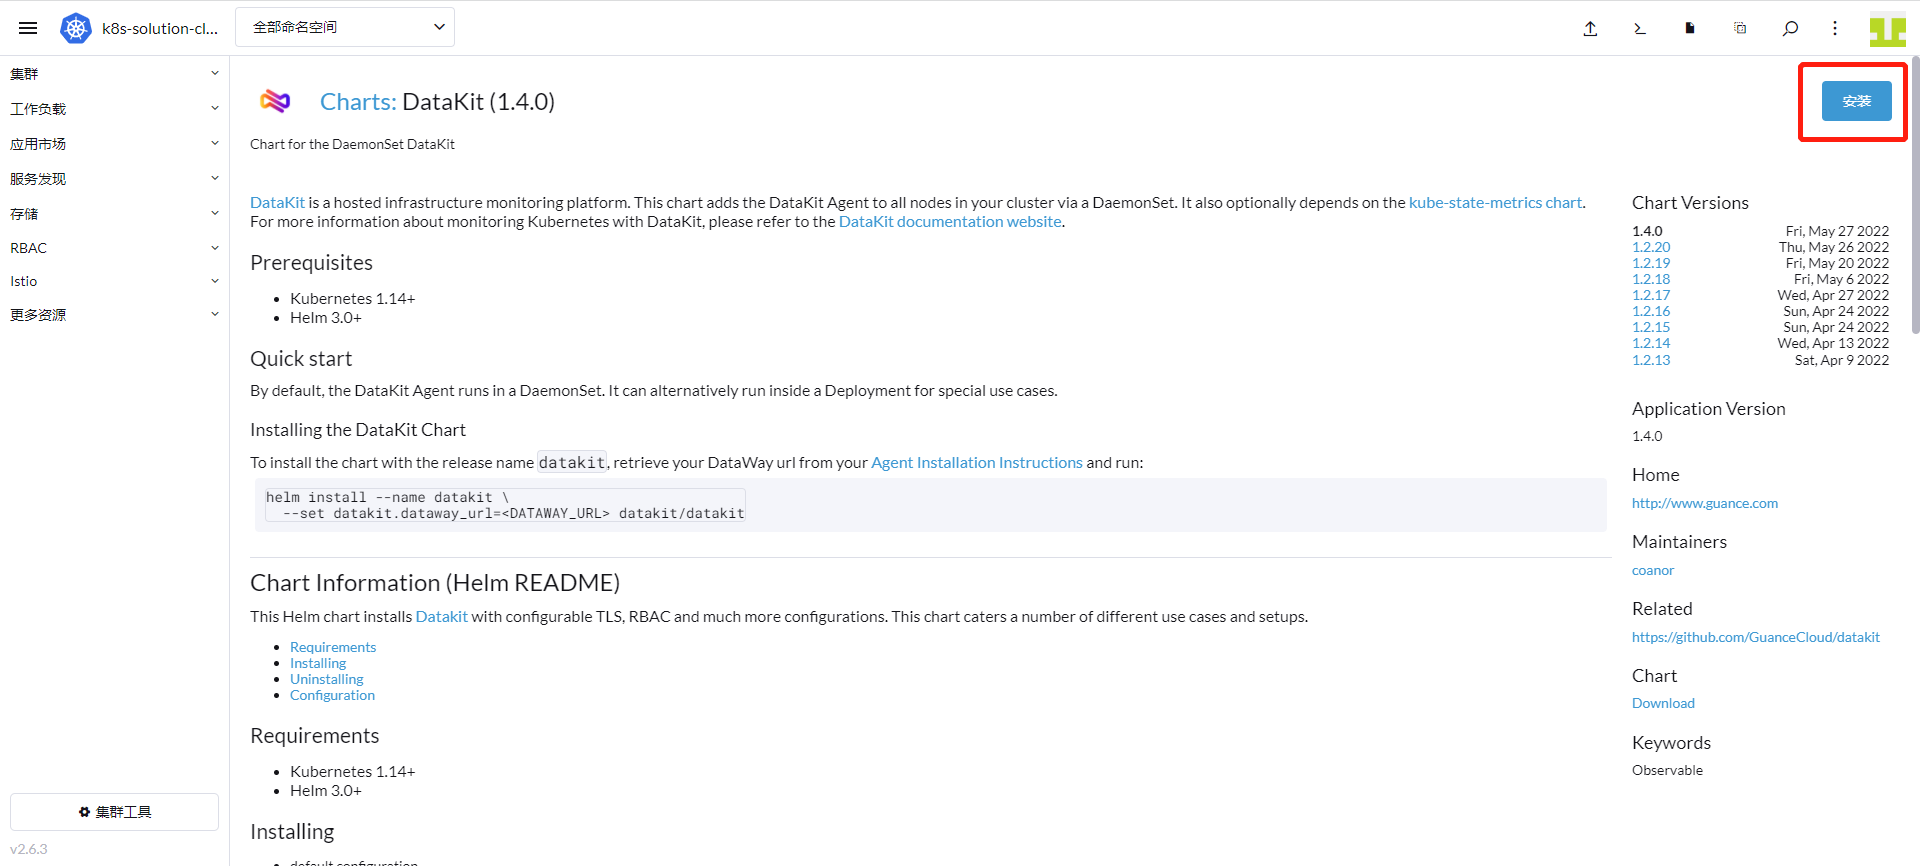
「설치」를 클릭합니다.
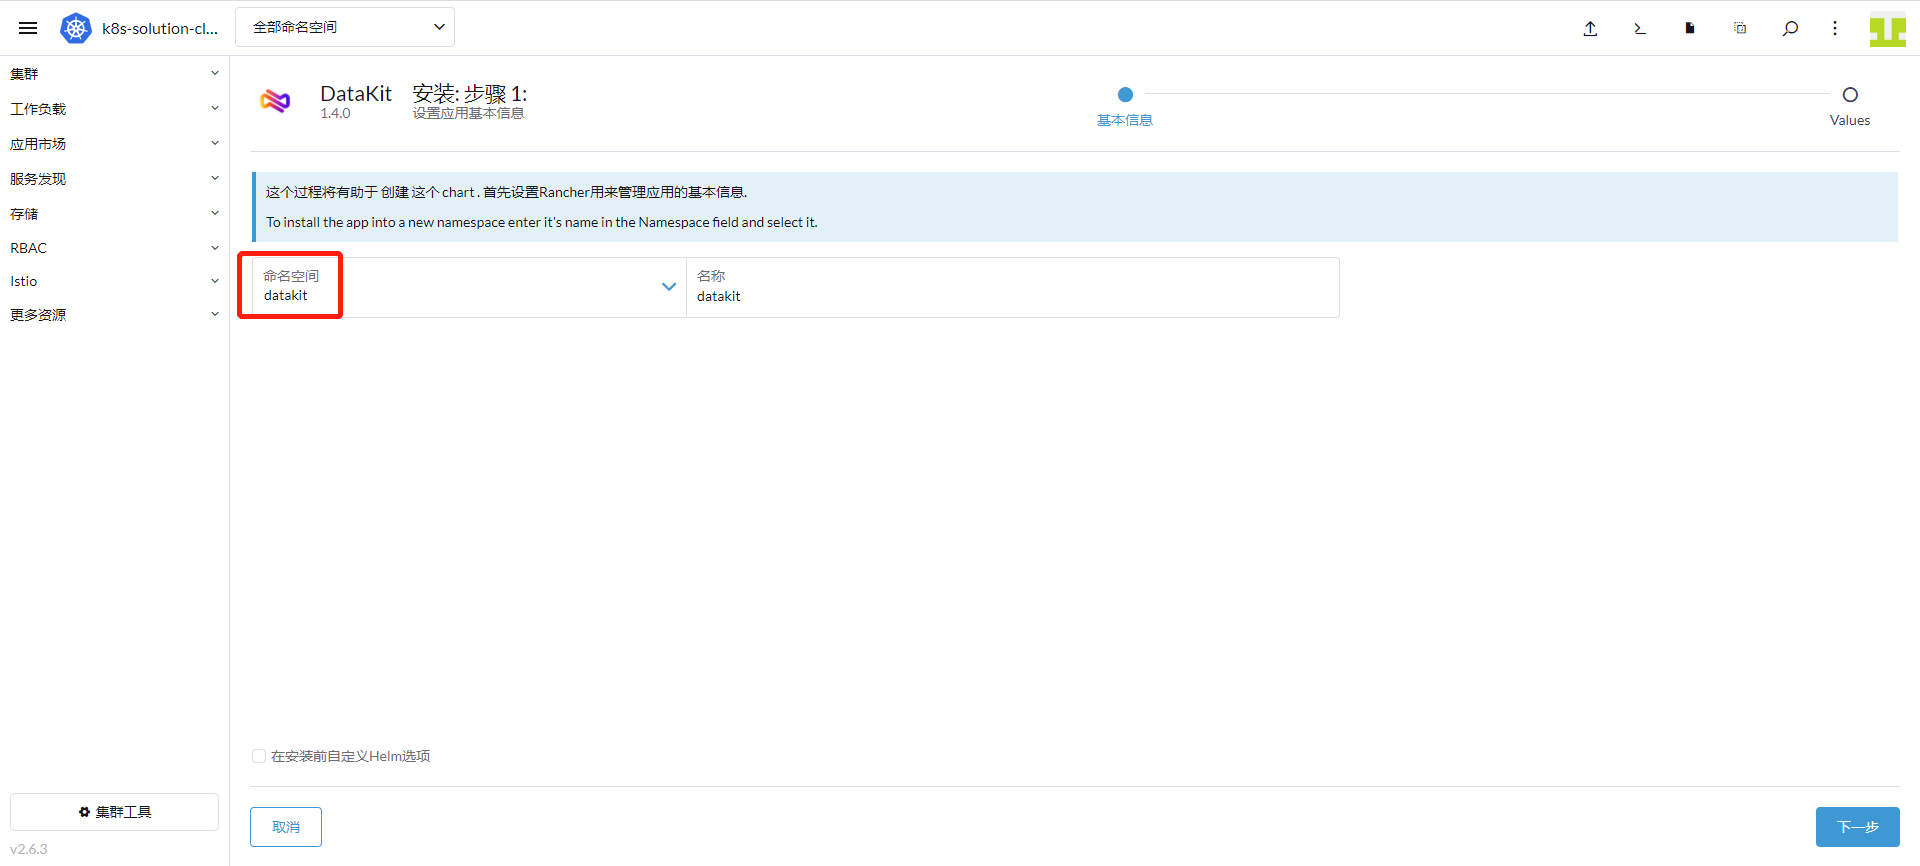
네임스페이스에서 「datakit」를 선택하고 「다음」을 클릭합니다.
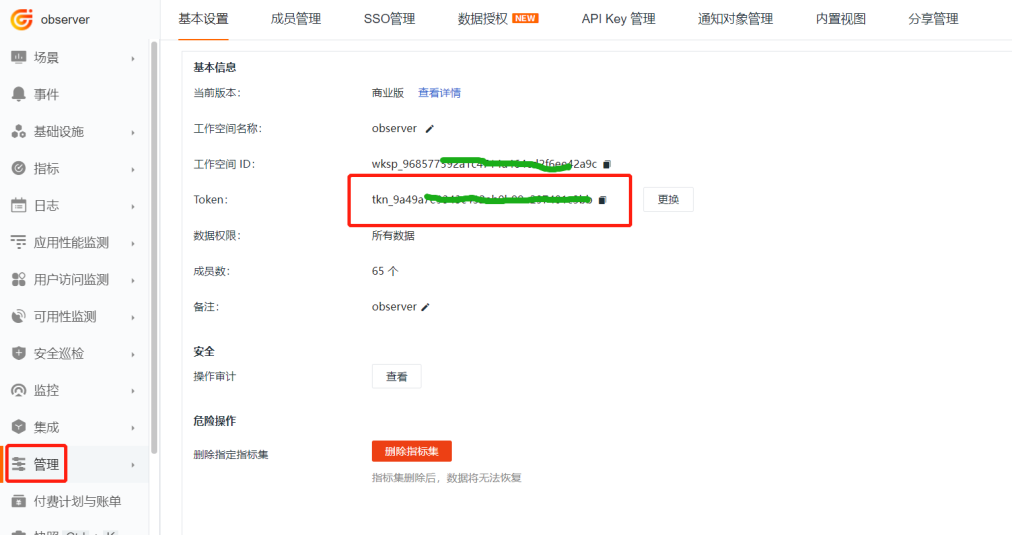
「Guance」에 로그인하여 「관리」 모듈로 이동합니다. 아래 그림에서 token을 찾아 옆에 있는 「복사 아이콘」을 클릭합니다.
Rancher 인터페이스로 전환합니다:
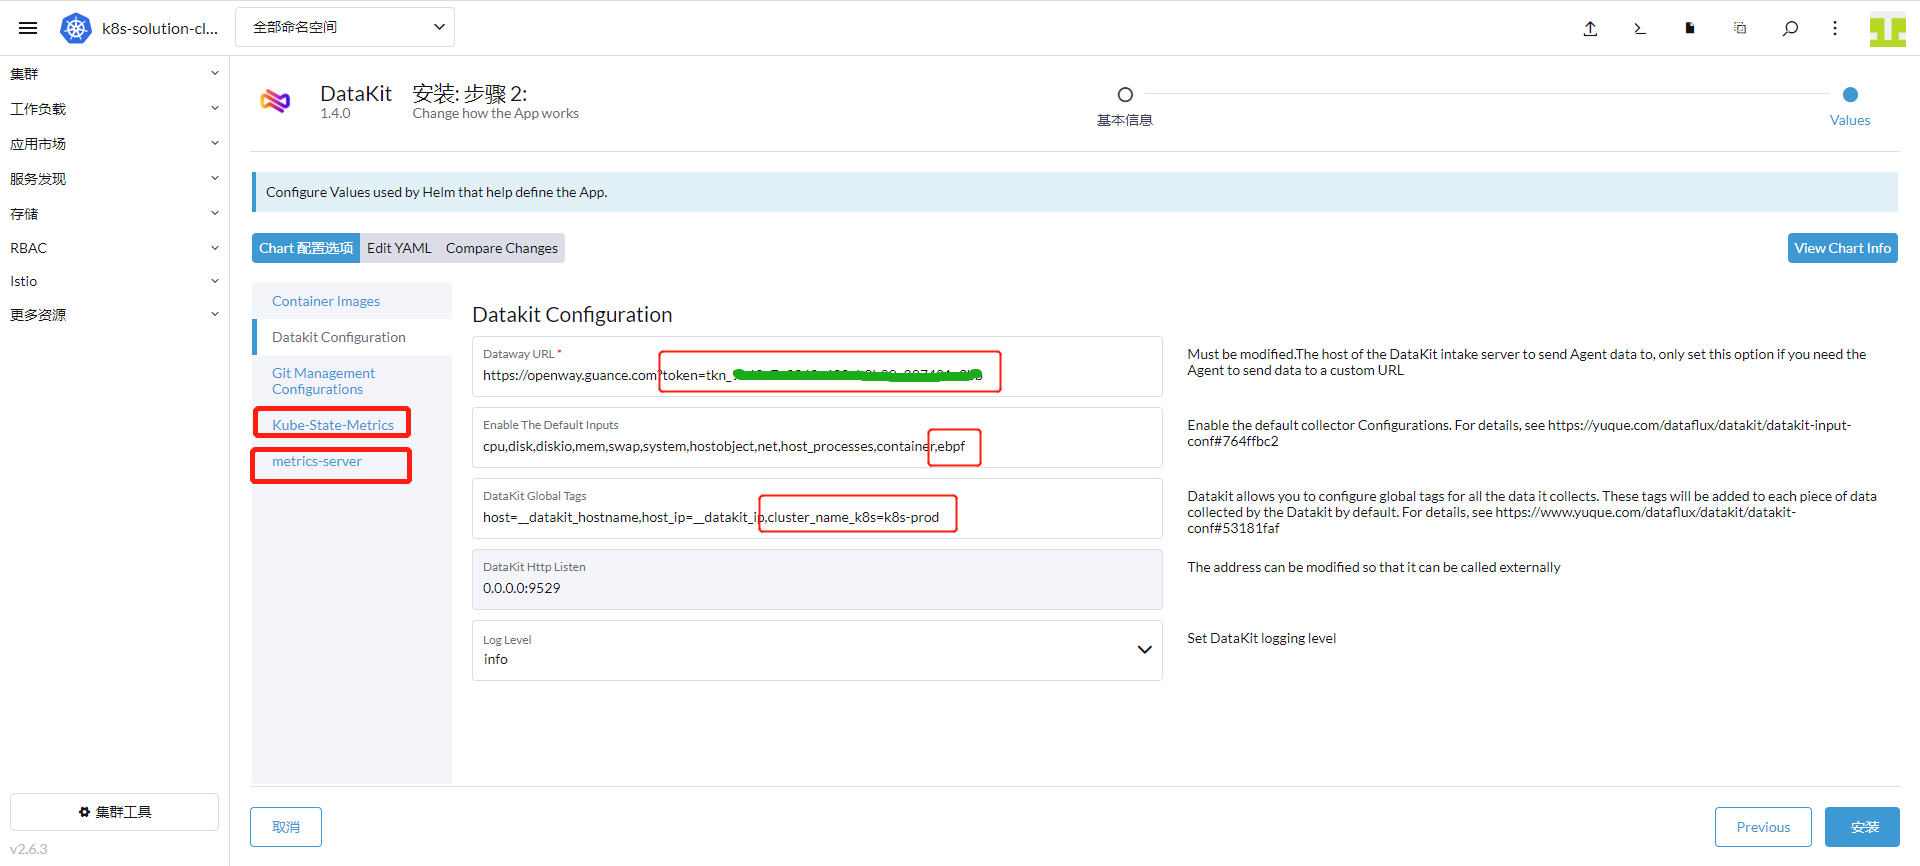
- 아래 그림의 token을 방금 복사한 token으로 바꿉니다.
- 「Enable The Default Inputs」에 「ebpf 수집기」를 추가합니다. 즉, 마지막에 “
,ebpf”를 추가합니다(쉼표로 구분). - 「DataKit Global Tags」 마지막에 “
,cluster_name_k8s=k8s-prod”를 추가합니다. (k8s-prod는 클러스터 이름으로, 직접 정의할 수 있으며 클러스터에서 수집한 메트릭에 대한 글로벌 태그를 설정합니다.)
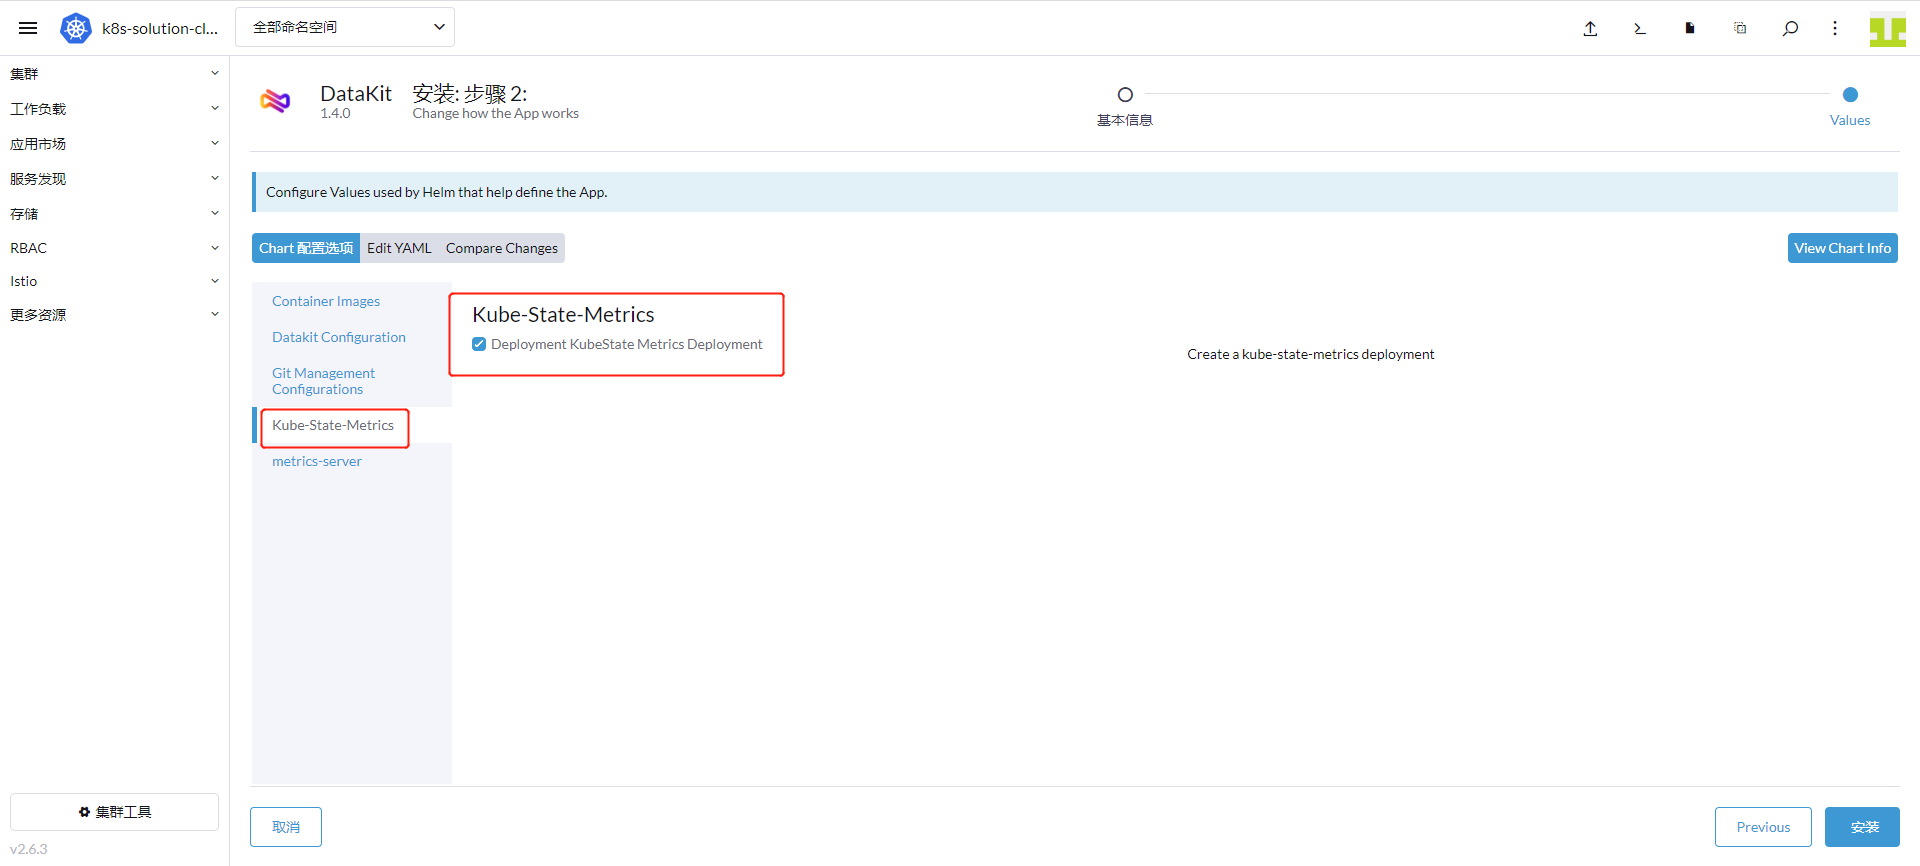
「Kube-State-Metrics」를 클릭하고 「설치」를 선택합니다.
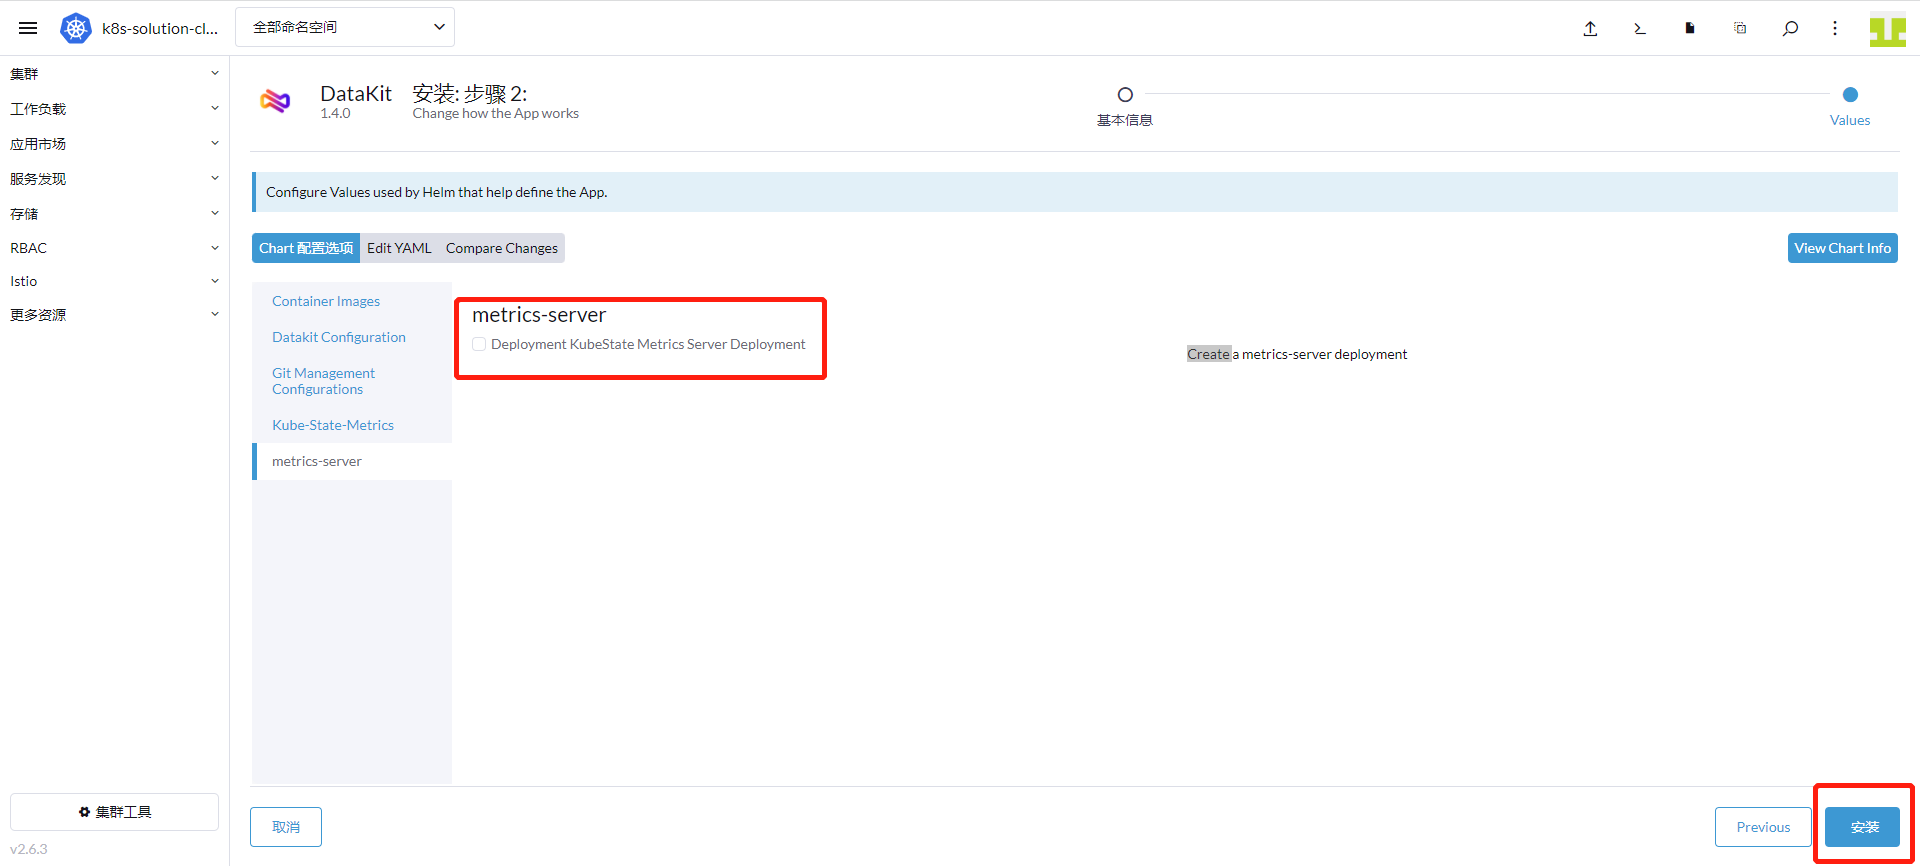
「metrics-server」를 클릭하고 「설치」를 선택한 후 아래의 「설치」 버튼을 클릭합니다.
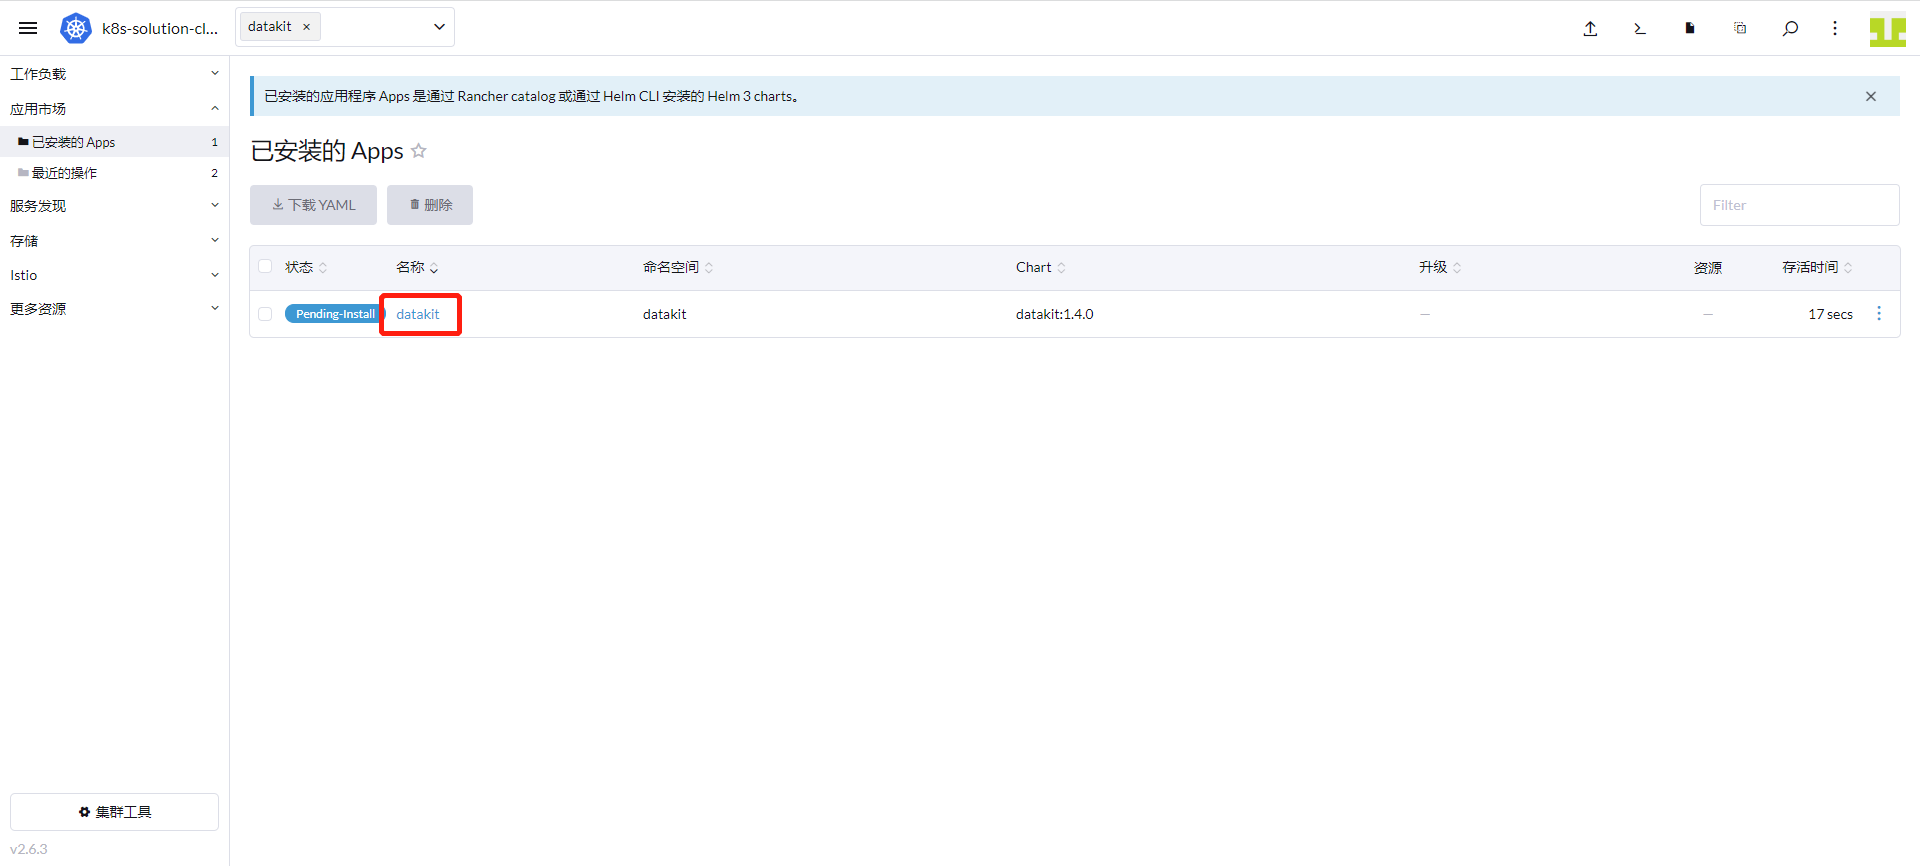
「클러스터」 → 「앱 마켓플레이스」 → 「설치된 앱」으로 이동하여 DataKit이 성공적으로 설치되었는지 확인합니다.
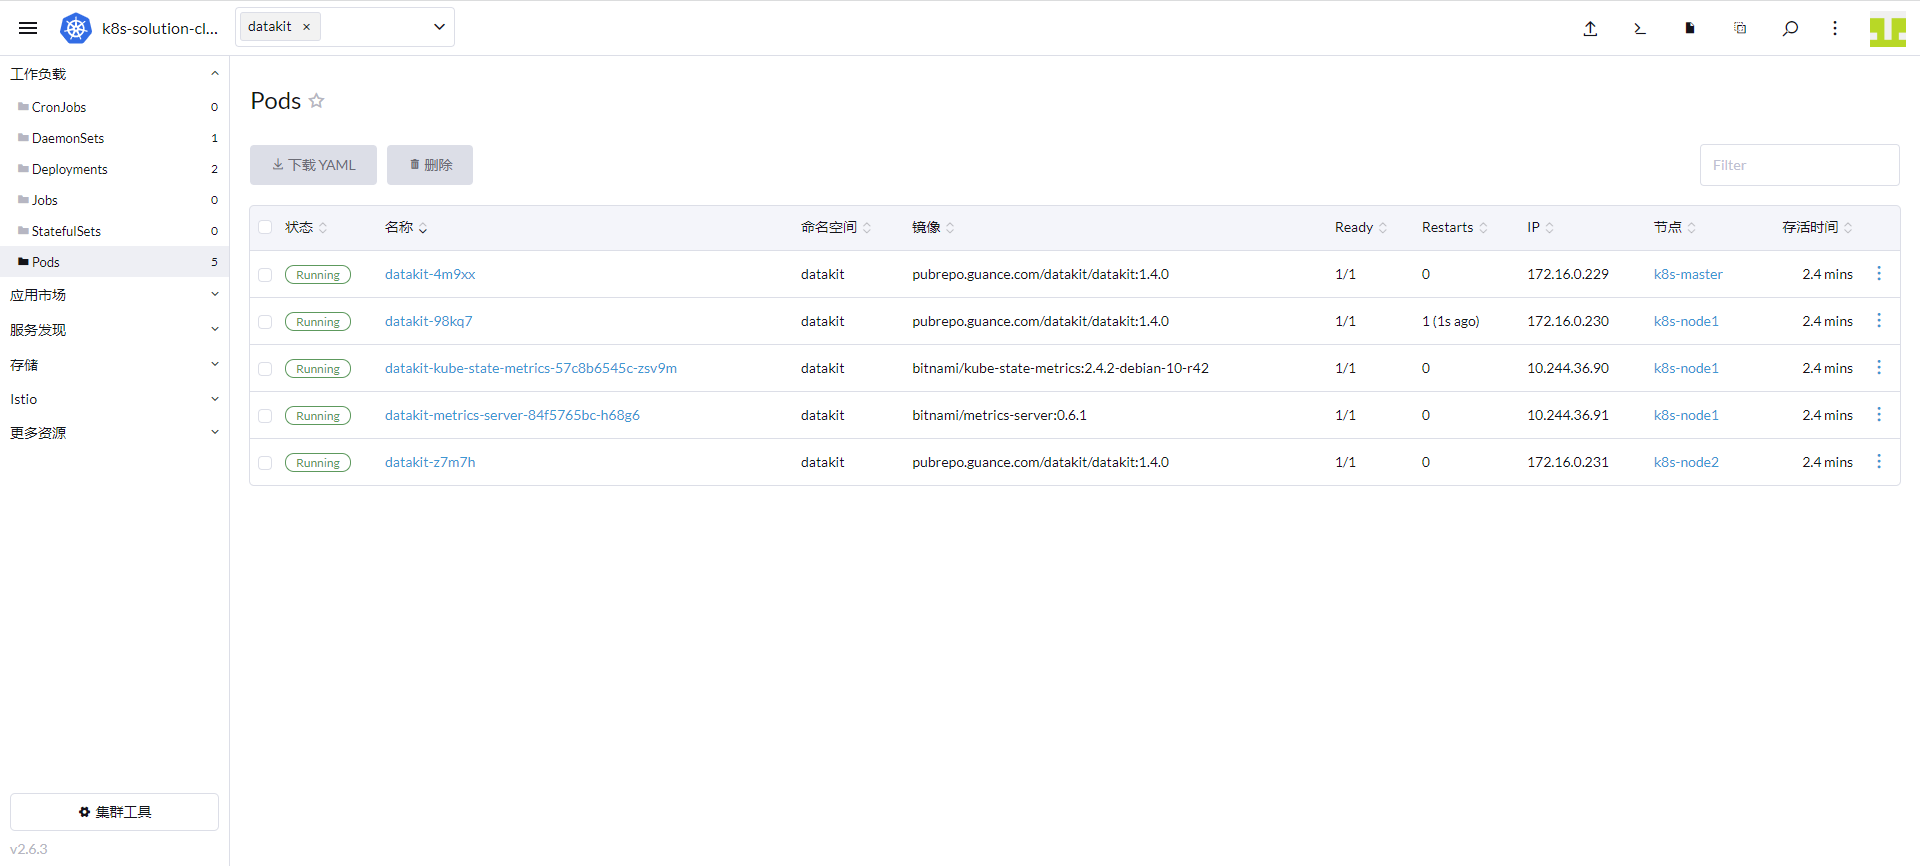
「클러스터」 → 「워크로드」 → 「Pods」로 이동하여 datakit 네임스페이스에 3개의 DataKit, 1개의 kube-state-metrics, 1개의 metrics-server가 실행 중인지 확인할 수 있습니다.
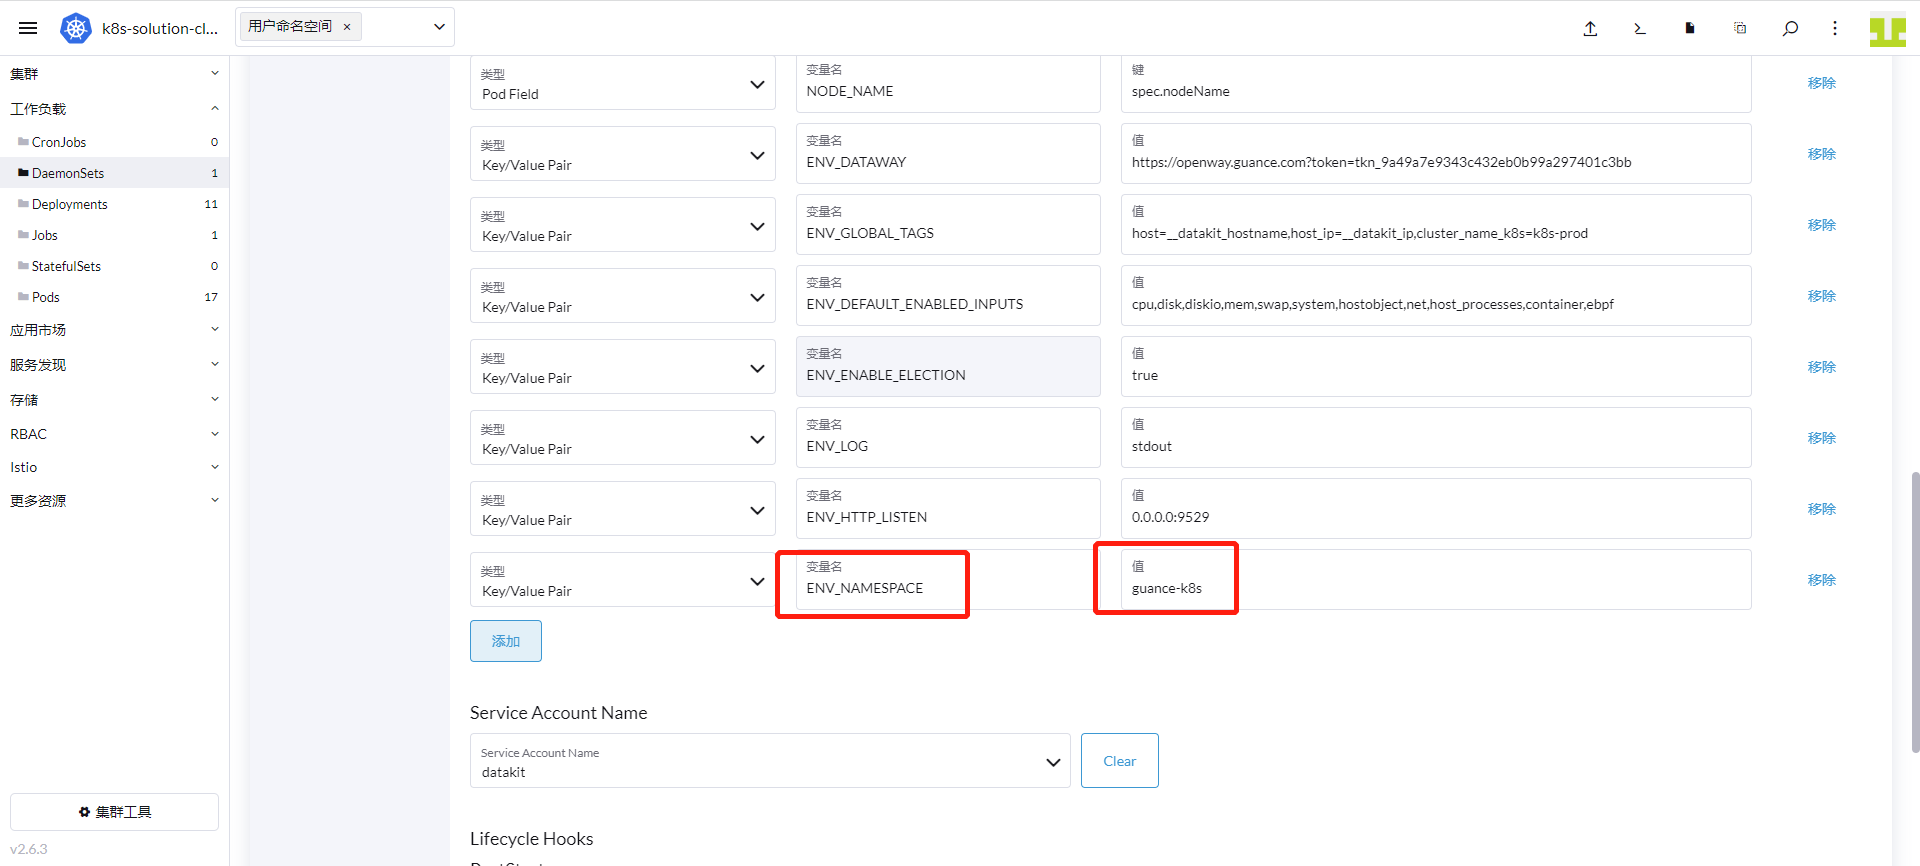
회사에 여러 클러스터가 있으므로 ENV_NAMESPACE 환경 변수를 추가해야 합니다. 이 환경 변수는 서로 다른 클러스터의 선출을 구분하기 위한 것이며, 여러 클러스터의 value 값은 동일할 수 없습니다.
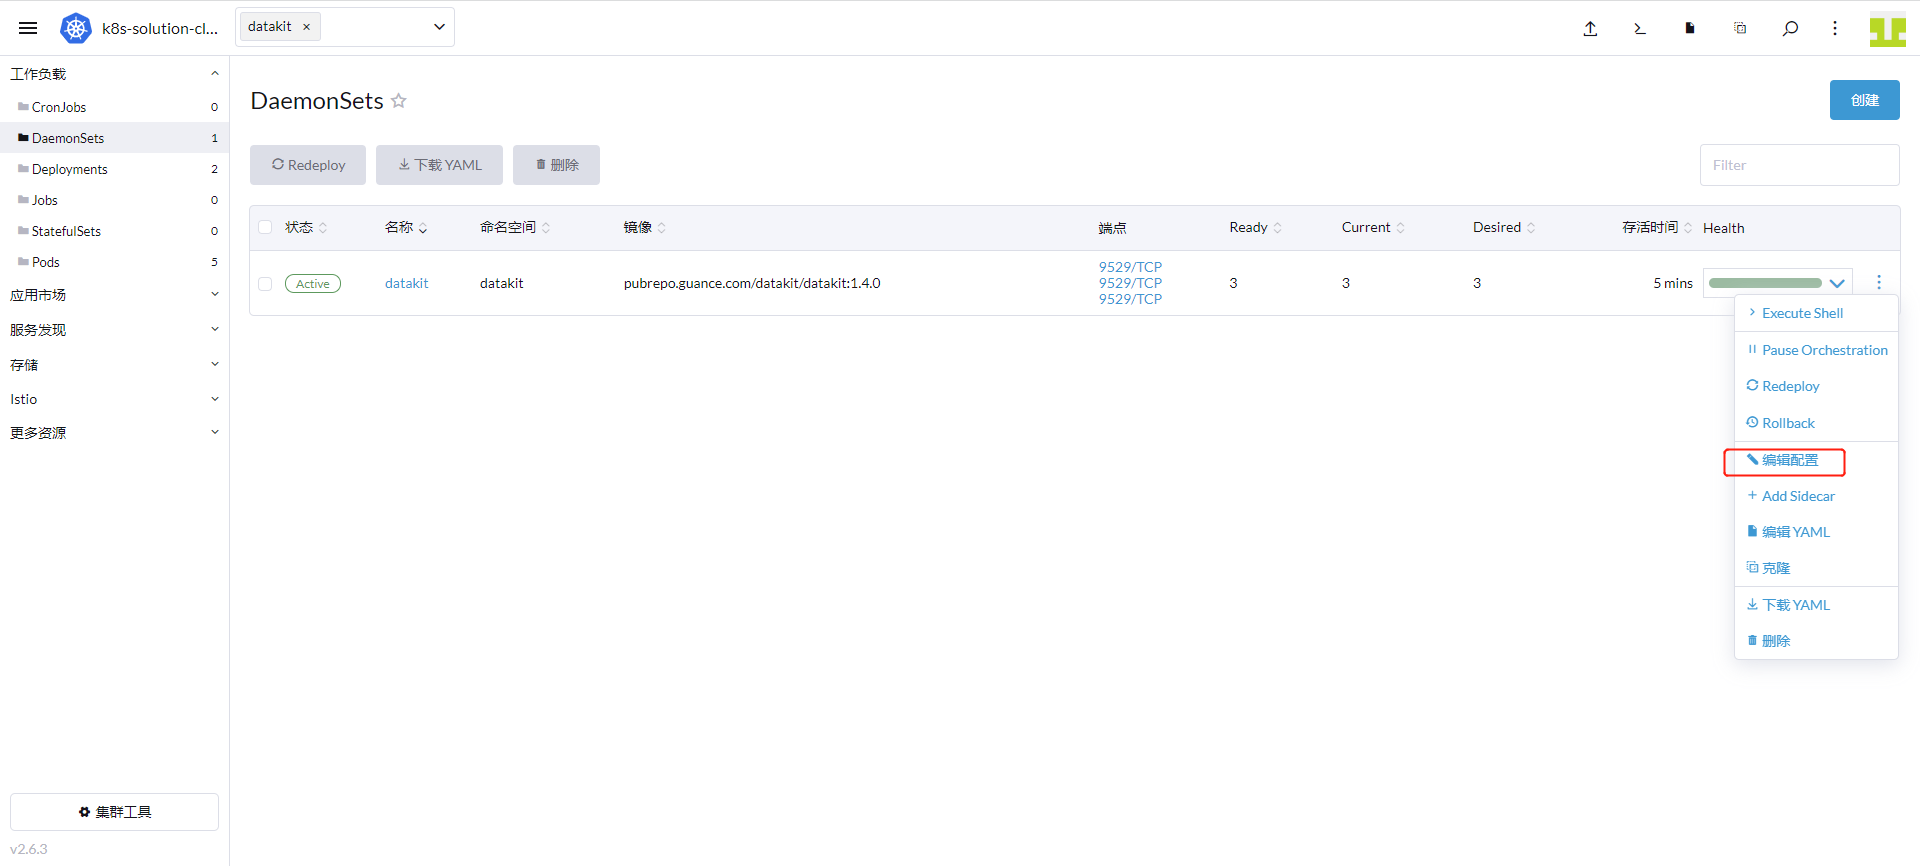
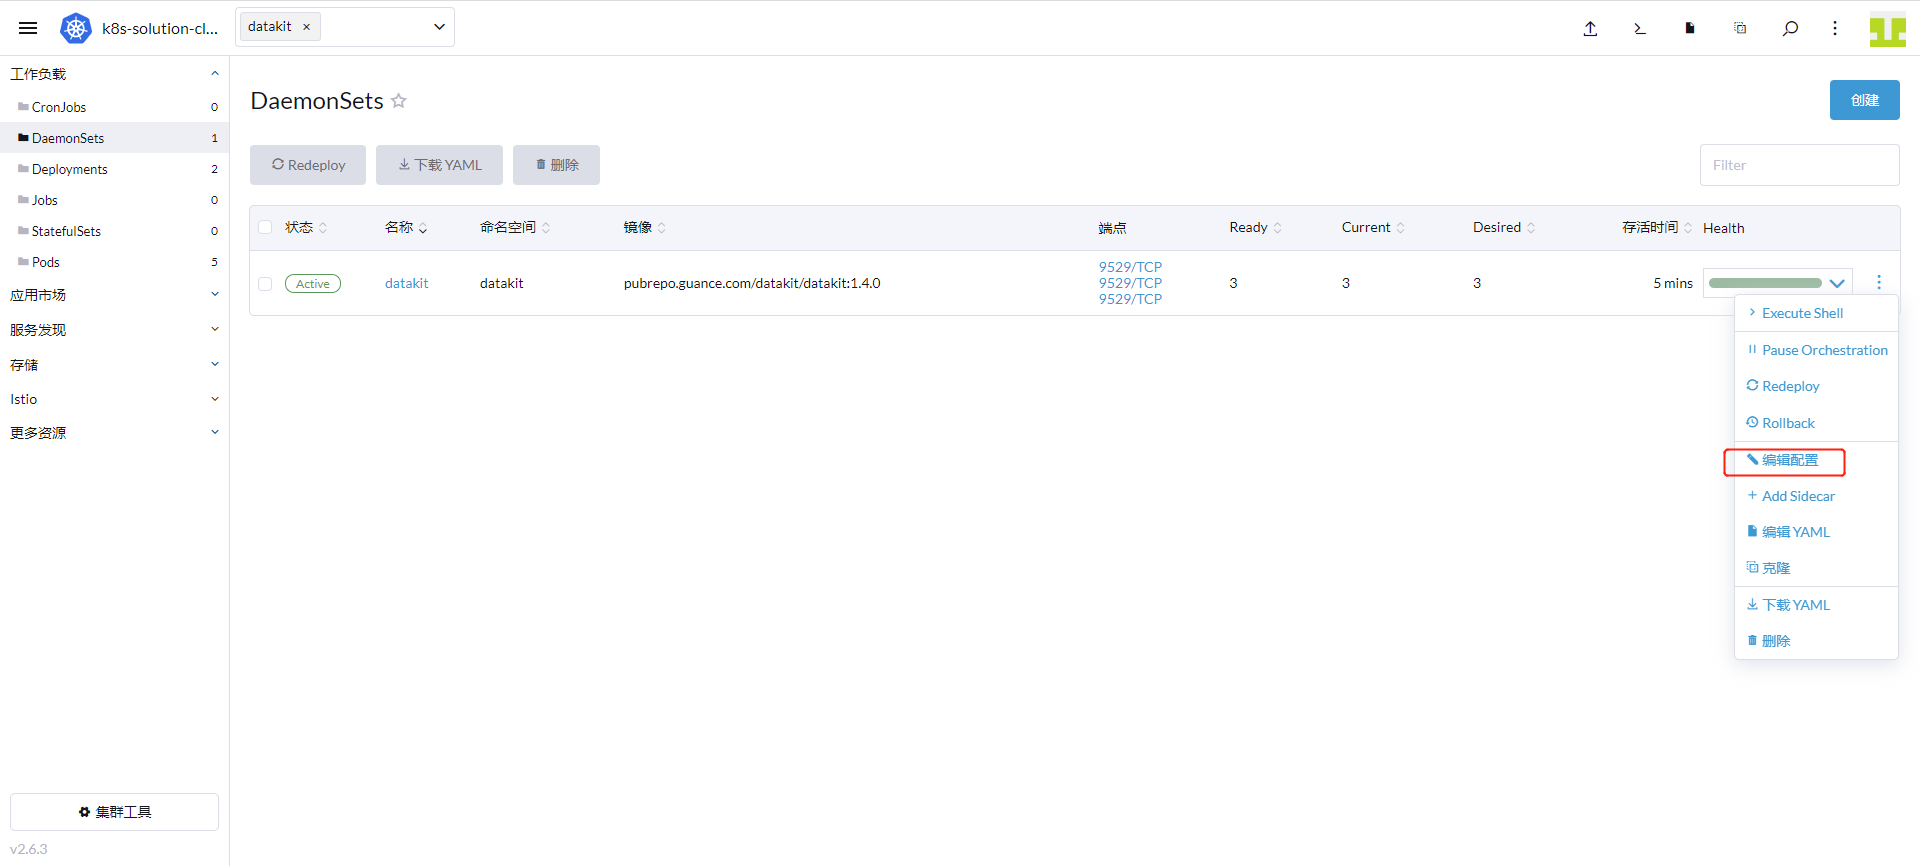
「클러스터」 → 「워크로드」 → 「DaemonSets」로 이동하여 datakit 행 오른쪽을 클릭하고 「구성 편집」을 선택합니다.
여기서 변수 이름에 ENV_NAMESPACE를 입력하고 값은 guance-k8s로 입력한 후 「저장」을 클릭합니다.
2단계: Kubernetes 관측 가능성 활성화
2.1 eBPF 관측 가능성
- 수집기 활성화
DataKit 배포 시 이미 ebpf 수집기가 활성화되었습니다.
- eBPF 뷰
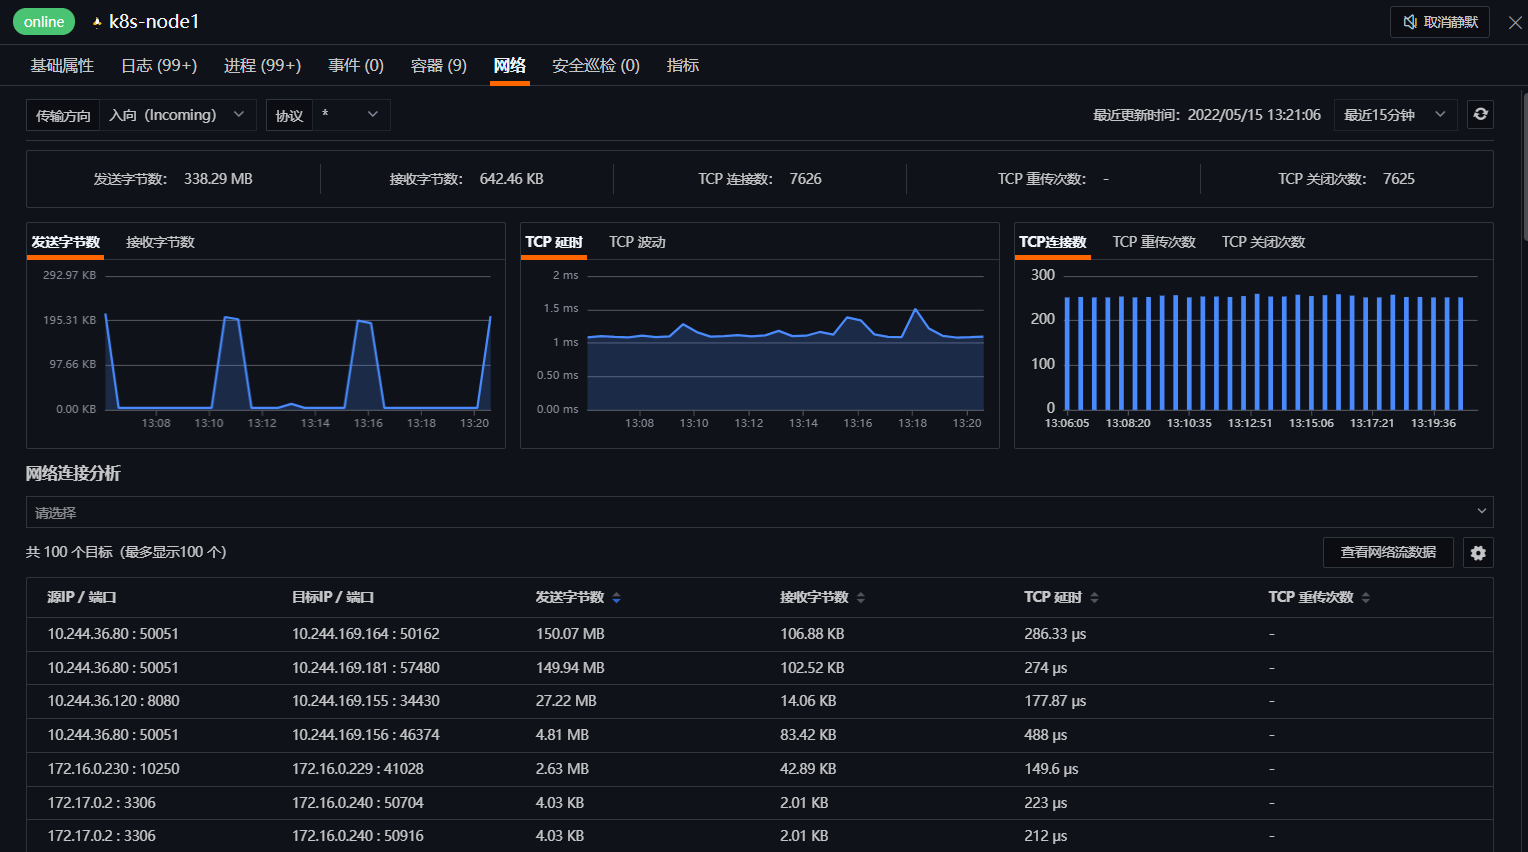
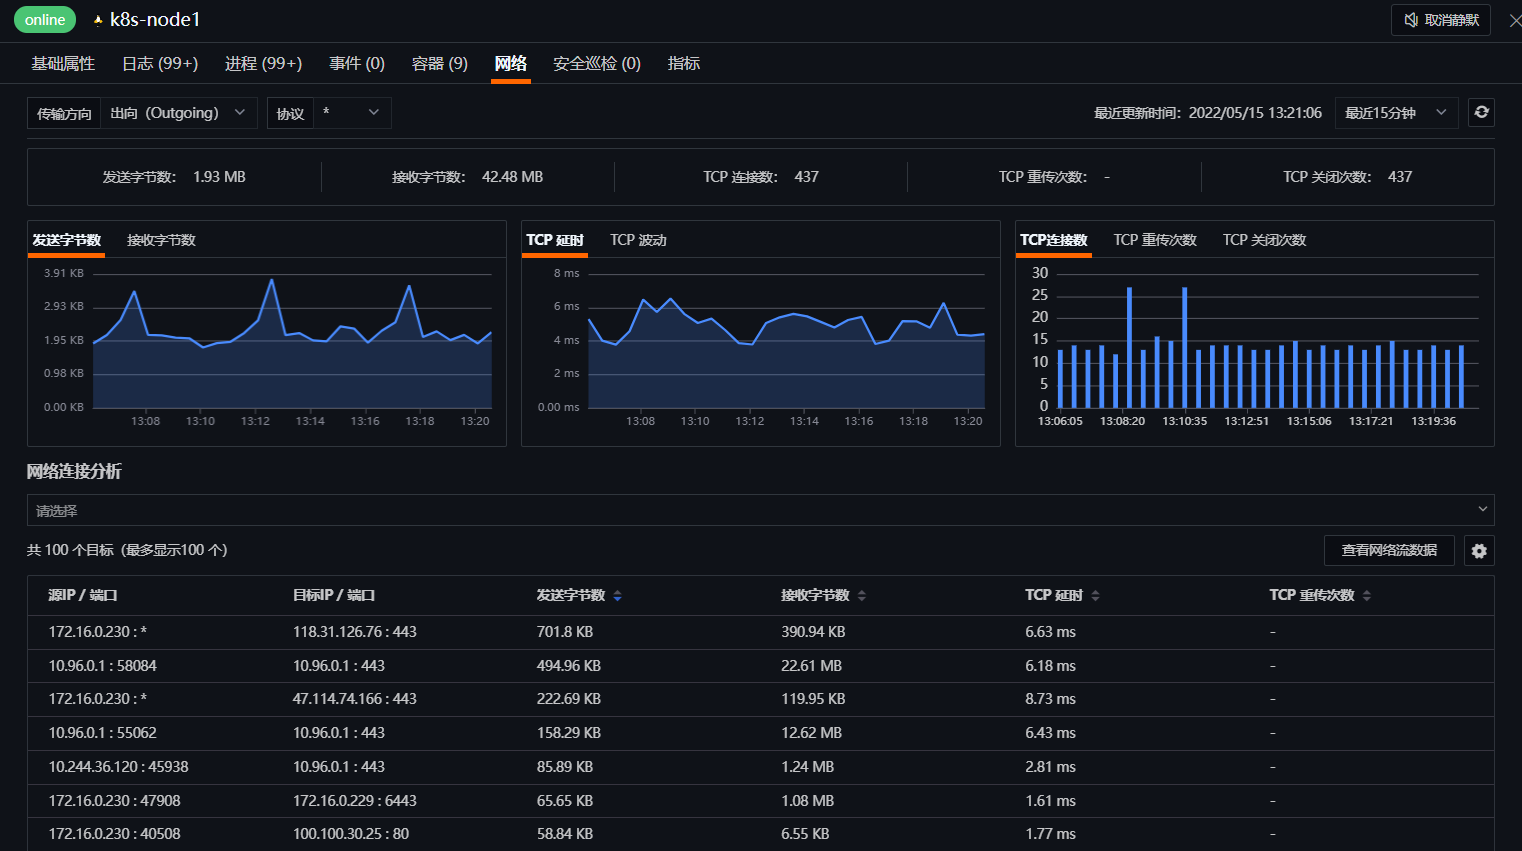
「Guance」에 로그인 → 「인프라」로 이동하여 「k8s-node1」을 클릭합니다.
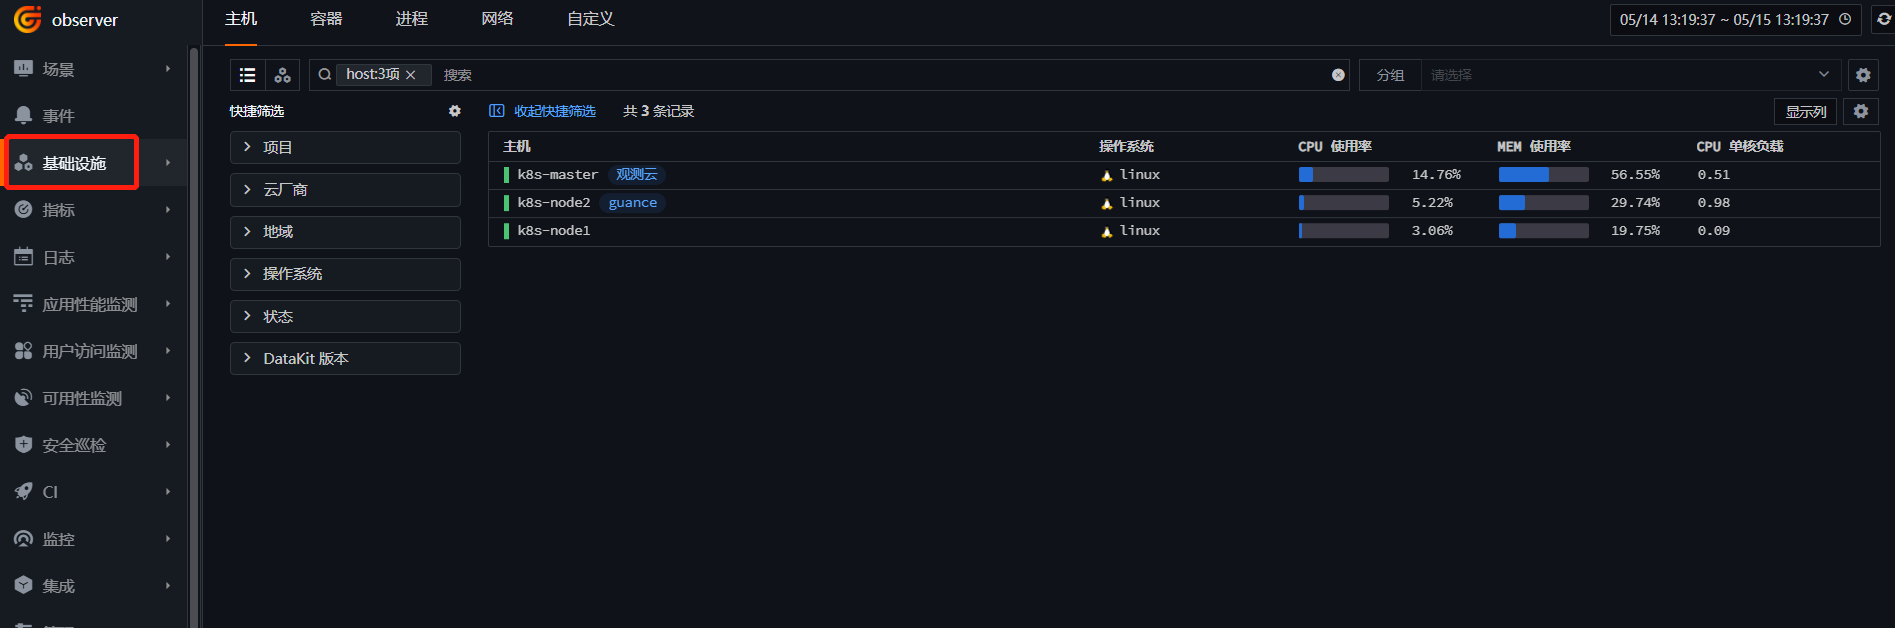
「네트워크」를 클릭하여 eBPF 모니터링 뷰를 확인합니다.
2.2 컨테이너 관측 가능성
- 수집기 활성화
DataKit은 기본적으로 Container 수집기가 활성화되어 있습니다. 여기서는 사용자 정의 수집기 구성을 설명합니다.
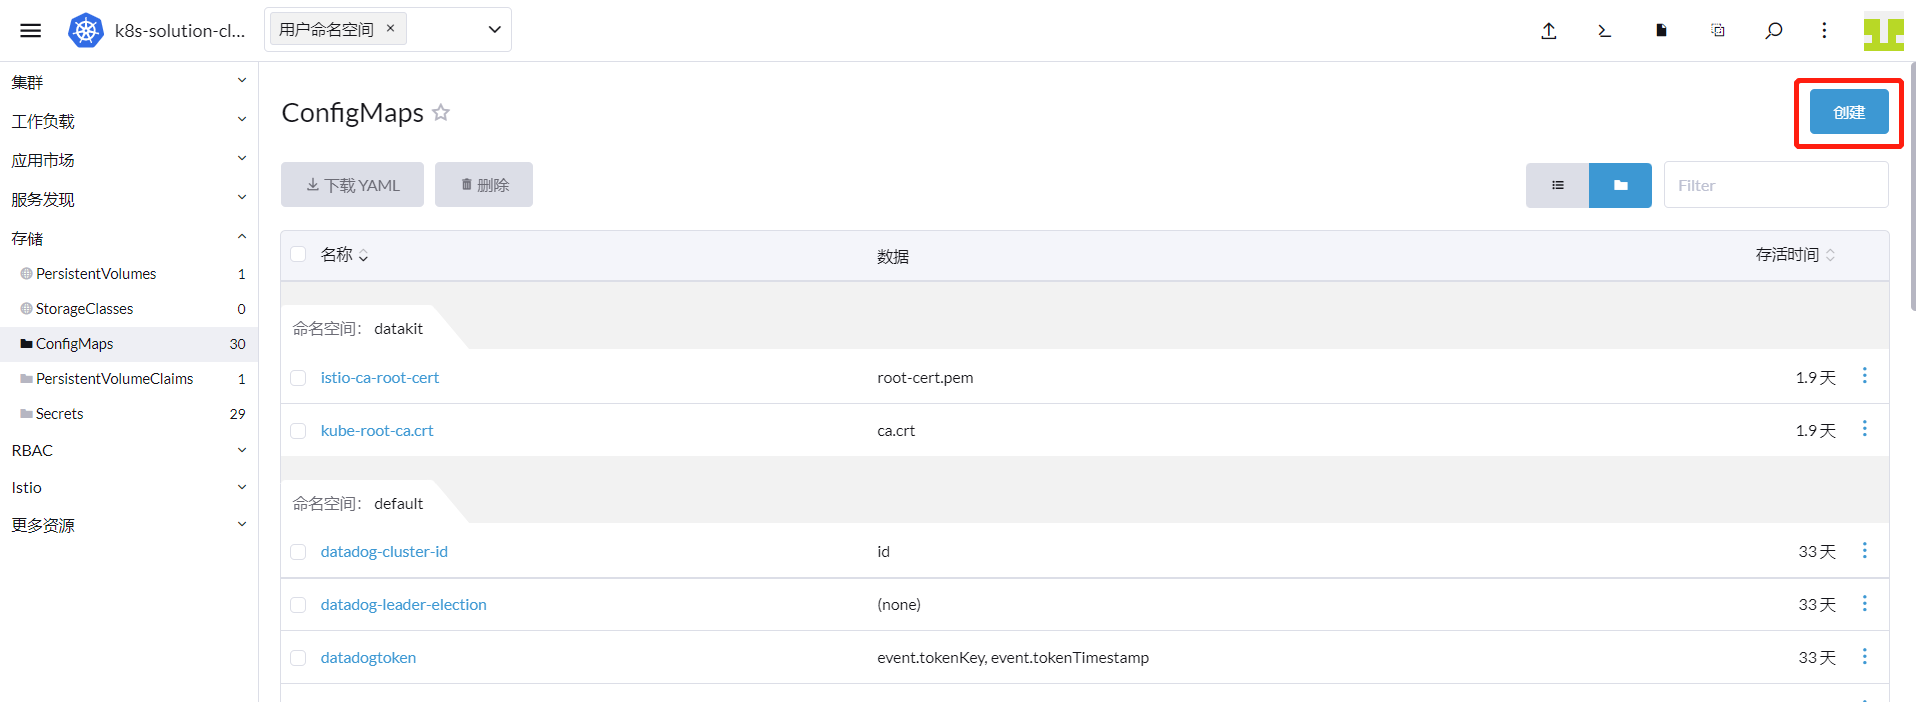
「Rancher」에 로그인 → 「클러스터」 → 「스토리지」 → 「ConfigMaps」로 이동하여 「생성」을 클릭합니다.
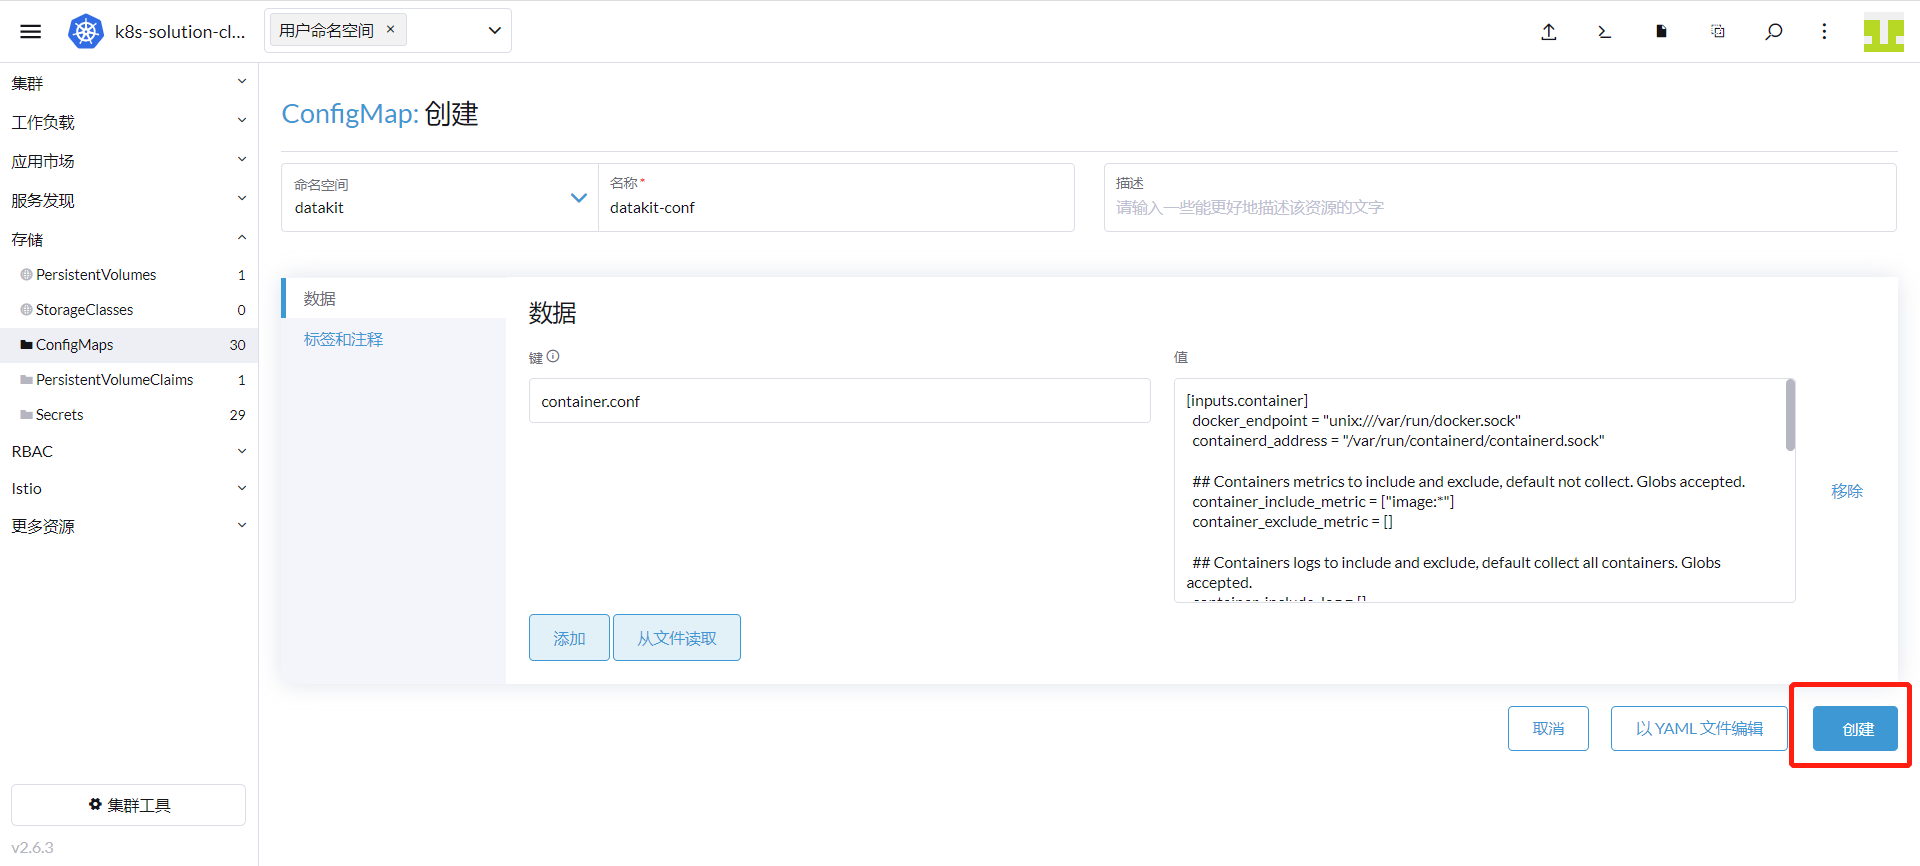
네임스페이스에 「datakit」를 입력하고 이름에 「datakit-conf」를 입력합니다. 키에 「container.conf」를 입력하고 값에 다음 내용을 입력합니다.
참고: 프로덕션 환경에서는
container_include_log = []및container_exclude_log = ["image:*"]로 설정하고, 로그를 수집해야 하는 Pod에 annotations을 추가하여 특정 컨테이너의 로그를 수집하는 것이 좋습니다.
      [inputs.container]
        docker_endpoint = "unix:///var/run/docker.sock"
        containerd_address = "/var/run/containerd/containerd.sock"

        enable_container_metric = true
        enable_k8s_metric = true
        enable_pod_metric = true

        ## Containers logs to include and exclude, default collect all containers. Globs accepted.
        container_include_log = []
        container_exclude_log = ["image:pubrepo.guance.com/datakit/logfwd*", "image:pubrepo.guance.com/datakit/datakit*"]

        exclude_pause_container = true

        ## Removes ANSI escape codes from text strings
        logging_remove_ansi_escape_codes = false

        kubernetes_url = "https://kubernetes.default:443"

        ## Authorization level:
        ##   bearer_token  - bearer_token_string  - TLS
        ## Use bearer token for authorization. ('bearer_token' takes priority)
        ## linux at:   /run/secrets/kubernetes.io/serviceaccount/token
        ## windows at: C:\var\run\secrets\kubernetes.io\serviceaccount\token
        bearer_token = "/run/secrets/kubernetes.io/serviceaccount/token"
        # bearer_token_string = "<your-token-string>"

        [inputs.container.tags]
          # some_tag = "some_value"
          # more_tag = "some_other_value"
아래 그림과 같이 내용을 입력하고 「생성」을 클릭합니다.
「클러스터」 → 「워크로드」 → 「DaemonSets」로 이동하여 datakit를 찾아 「구성 편집」을 클릭합니다.
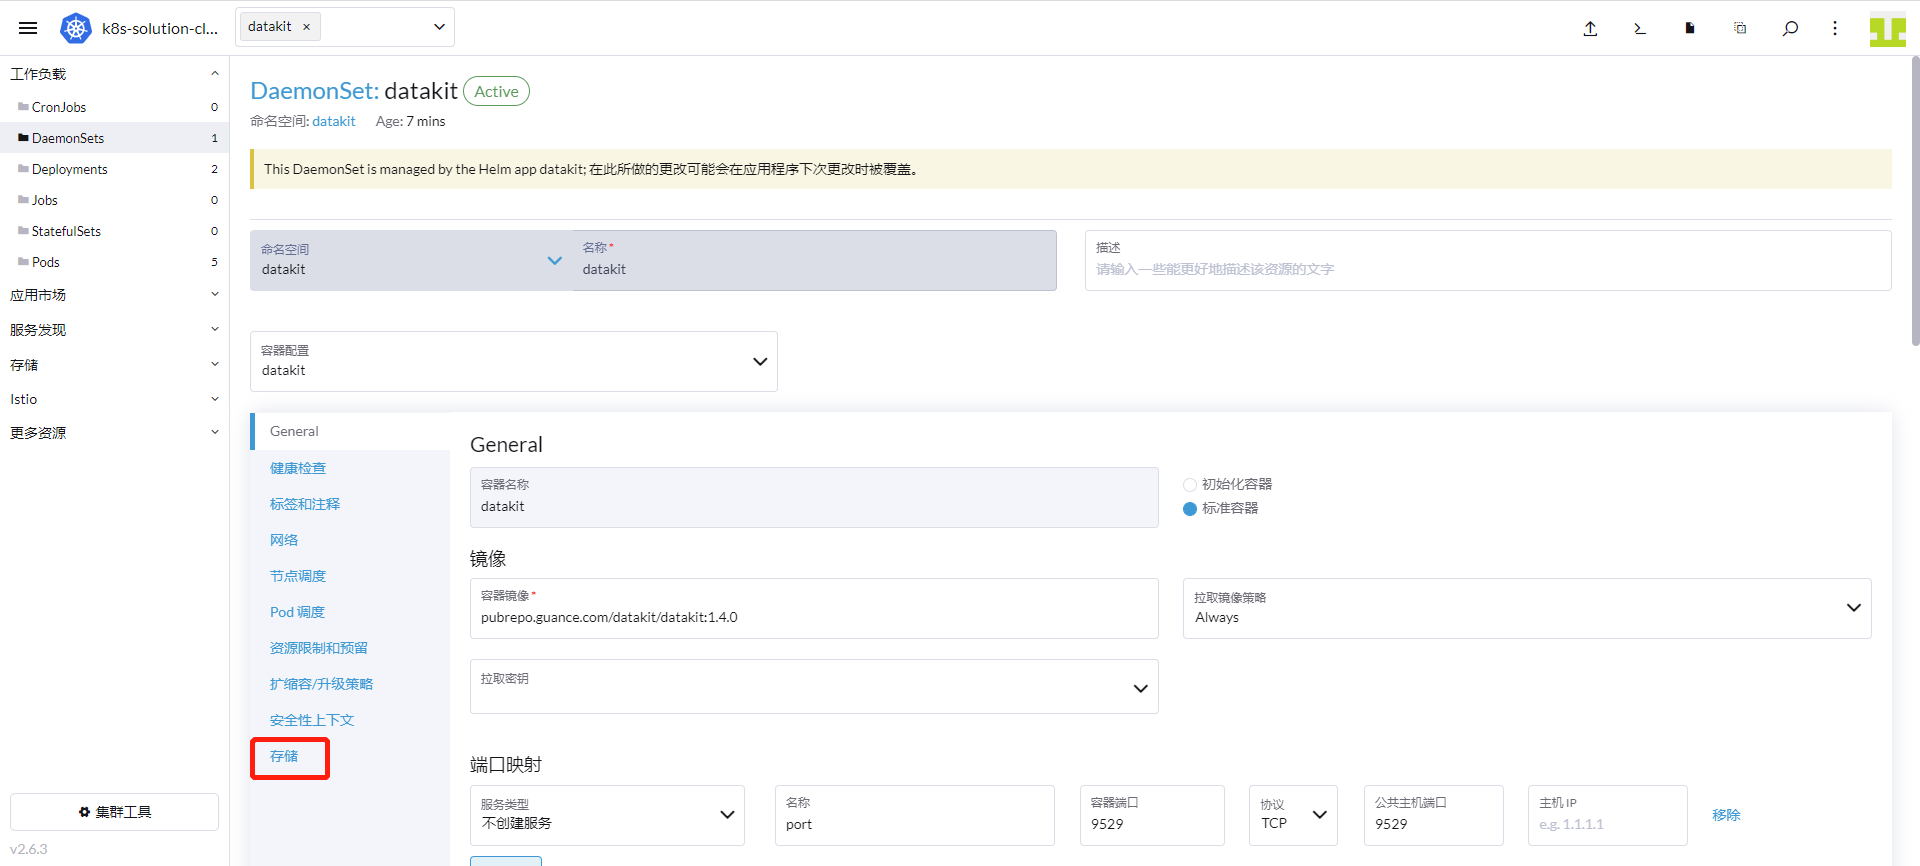
「스토리지」를 클릭합니다.
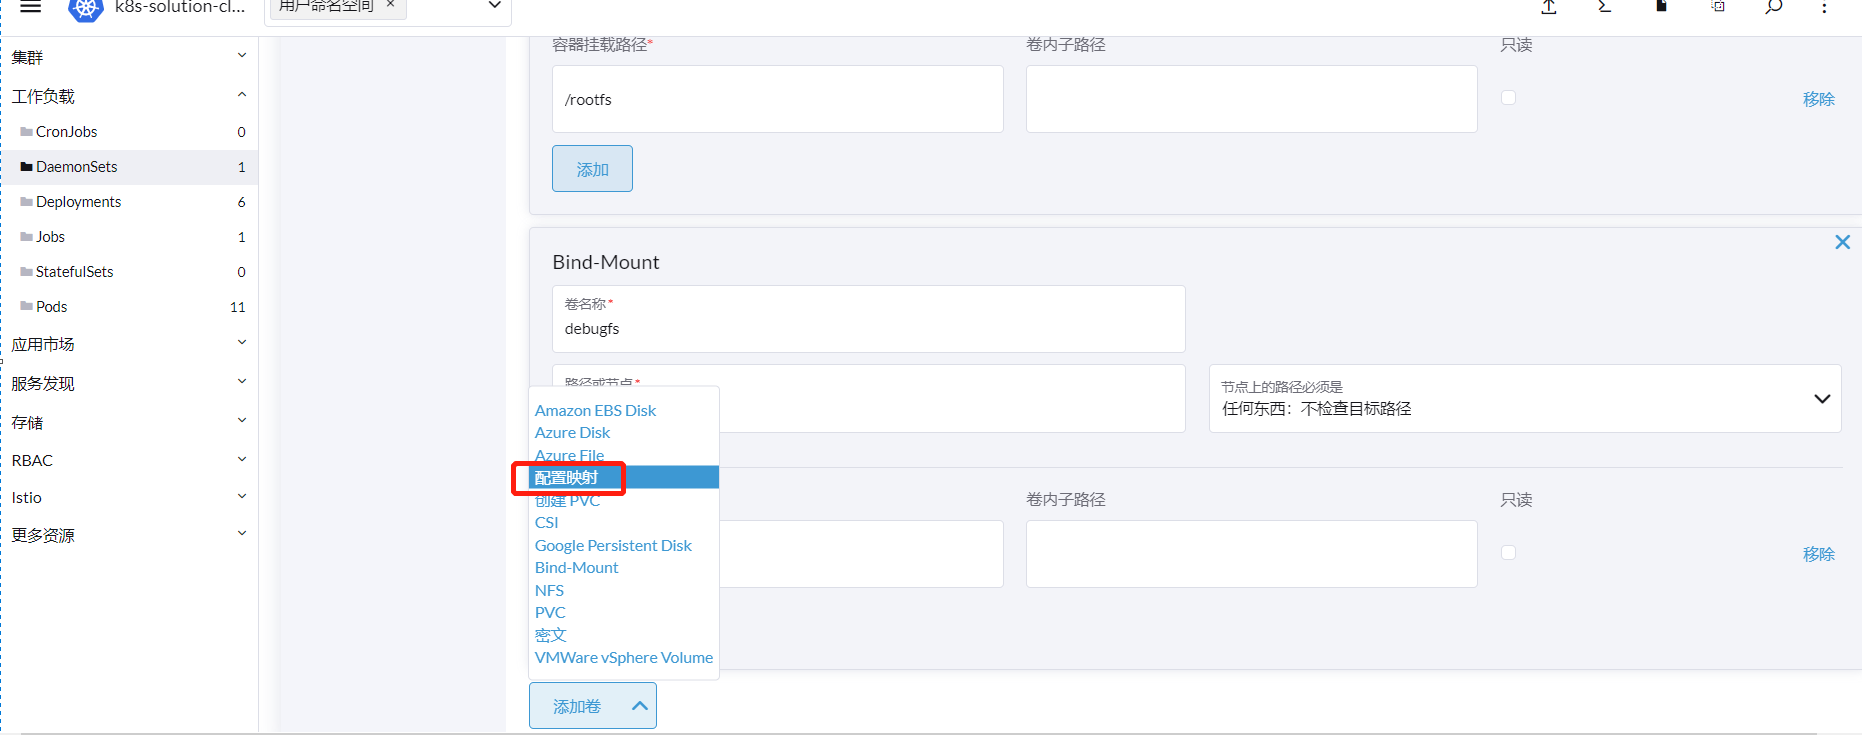
「볼륨 추가」 → 「ConfigMap」을 클릭합니다.
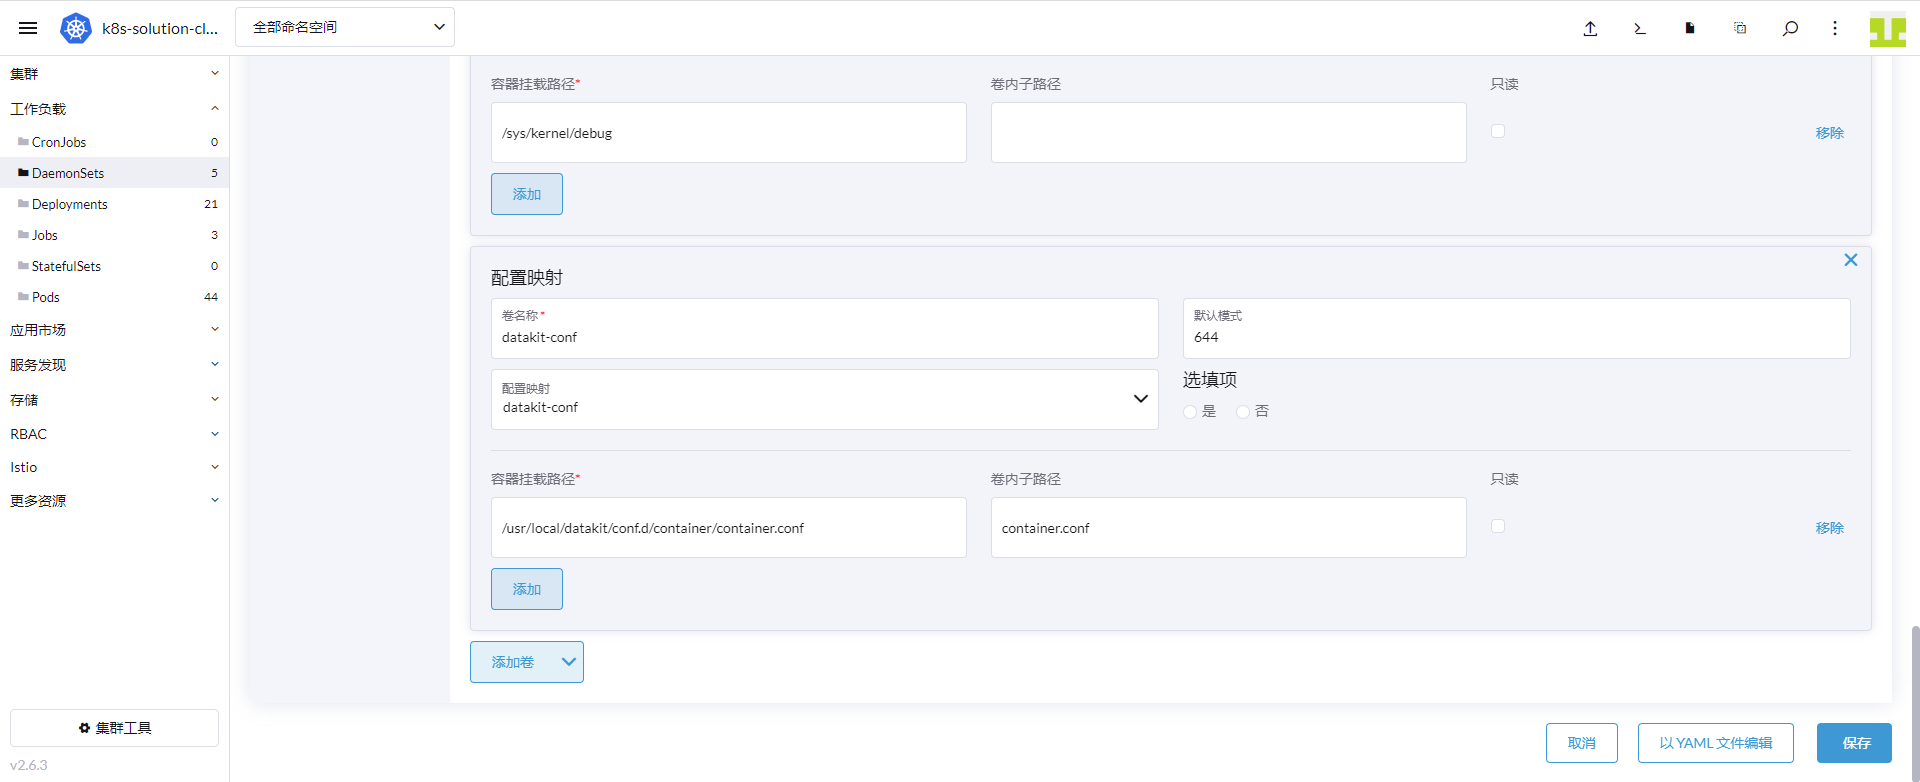
볼륨 이름에 「datakit-conf」를 입력하고 ConfigMap에서 「datakit.conf」를 선택합니다. 하위 경로에 「container.conf」를 입력하고 컨테이너 마운트 경로에 /usr/local/datakit/conf.d/container/container.conf를 입력한 후 「저장」을 클릭합니다.
- Container 모니터링 뷰
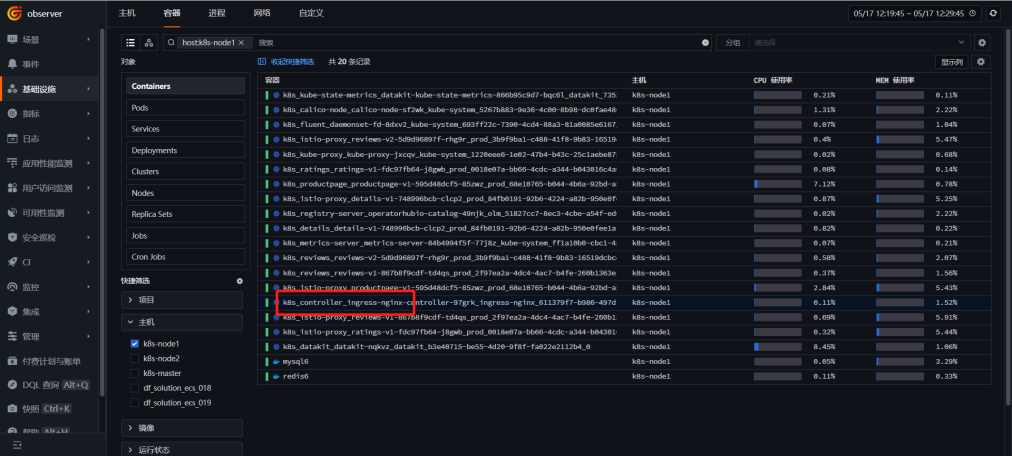
「Guance」에 로그인 → 「인프라」 → 「컨테이너」로 이동하여 「host:k8s-node1」을 입력하면 k8s-node1 노드의 컨테이너가 표시됩니다. 「ingress」를 클릭합니다.
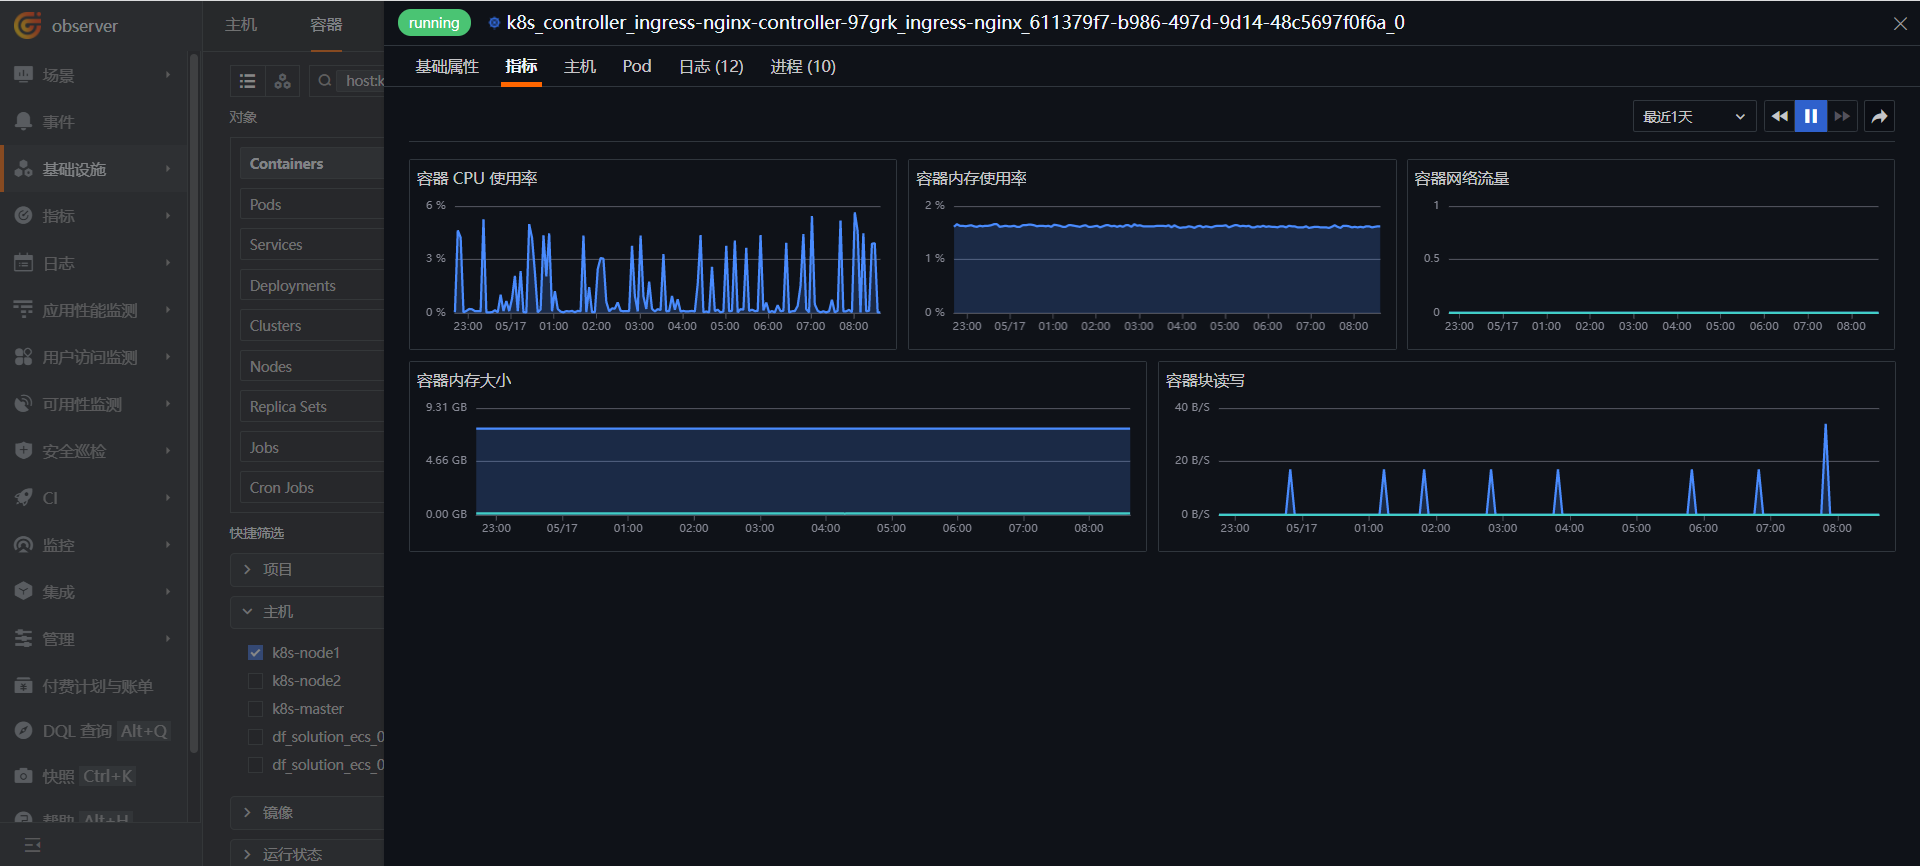
「메트릭」을 클릭하여 DataKit Container의 모니터링 뷰를 확인합니다.
2.3 Kubernetes 모니터링 뷰
- 수집기 배포
DataKit 설치 시 이미 metric-server와 Kube-State-Metrics가 설치되었습니다.
- Kubernetes 모니터링 뷰 배포
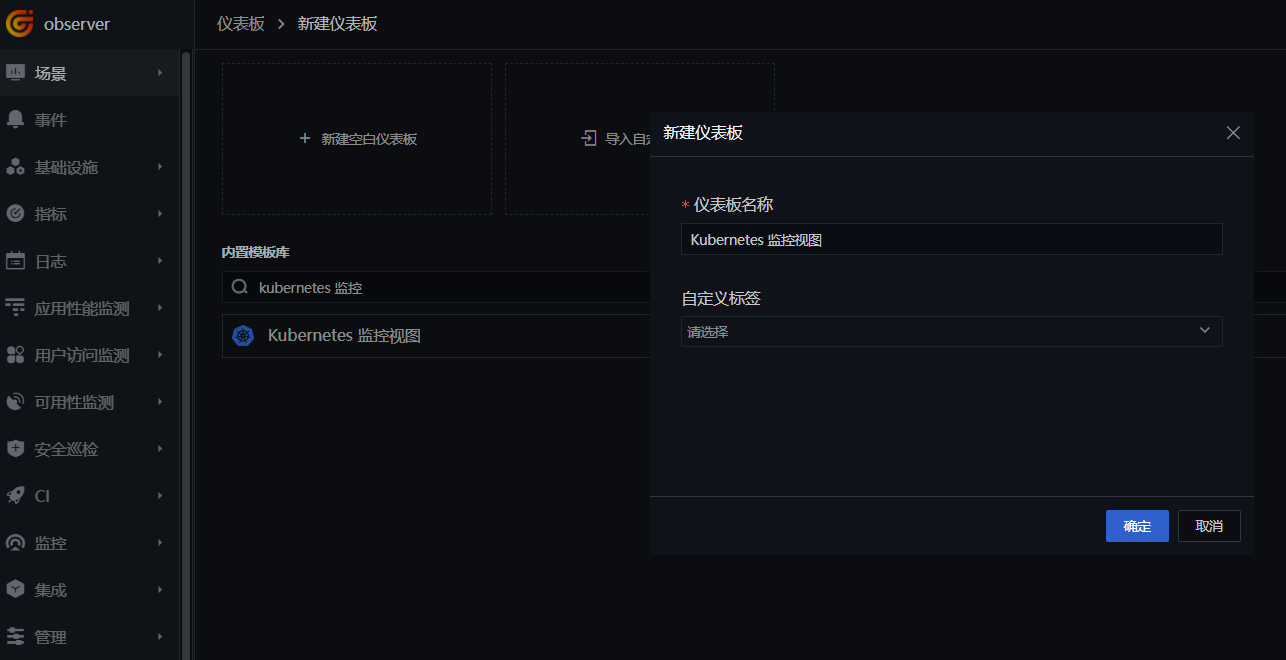
「Guance」에 로그인하여 「시나리오」 모듈로 이동합니다. 「대시보드 생성」을 클릭하고 「kubernetes 모니터링」을 입력한 후 「Kubernetes 모니터링 뷰」를 선택하고 「확인」을 클릭합니다.
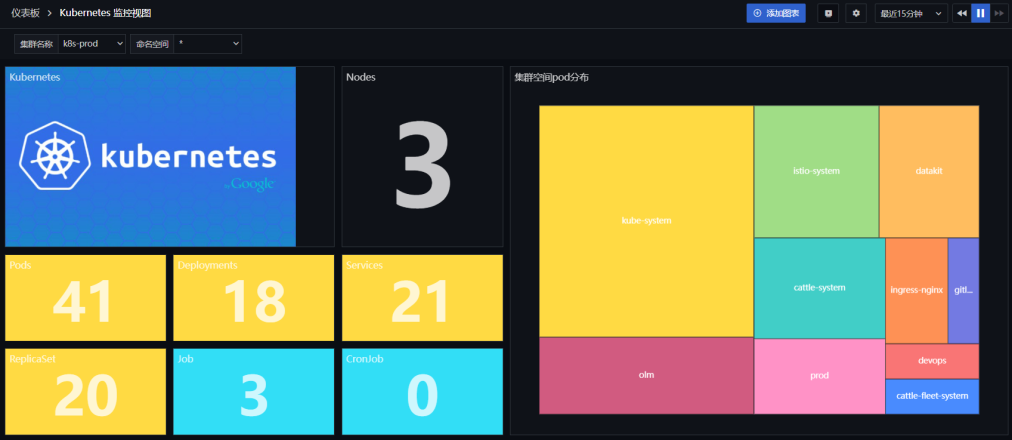
새로 생성된 「Kubernetes 모니터링 뷰」를 클릭하여 클러스터 정보를 확인합니다.
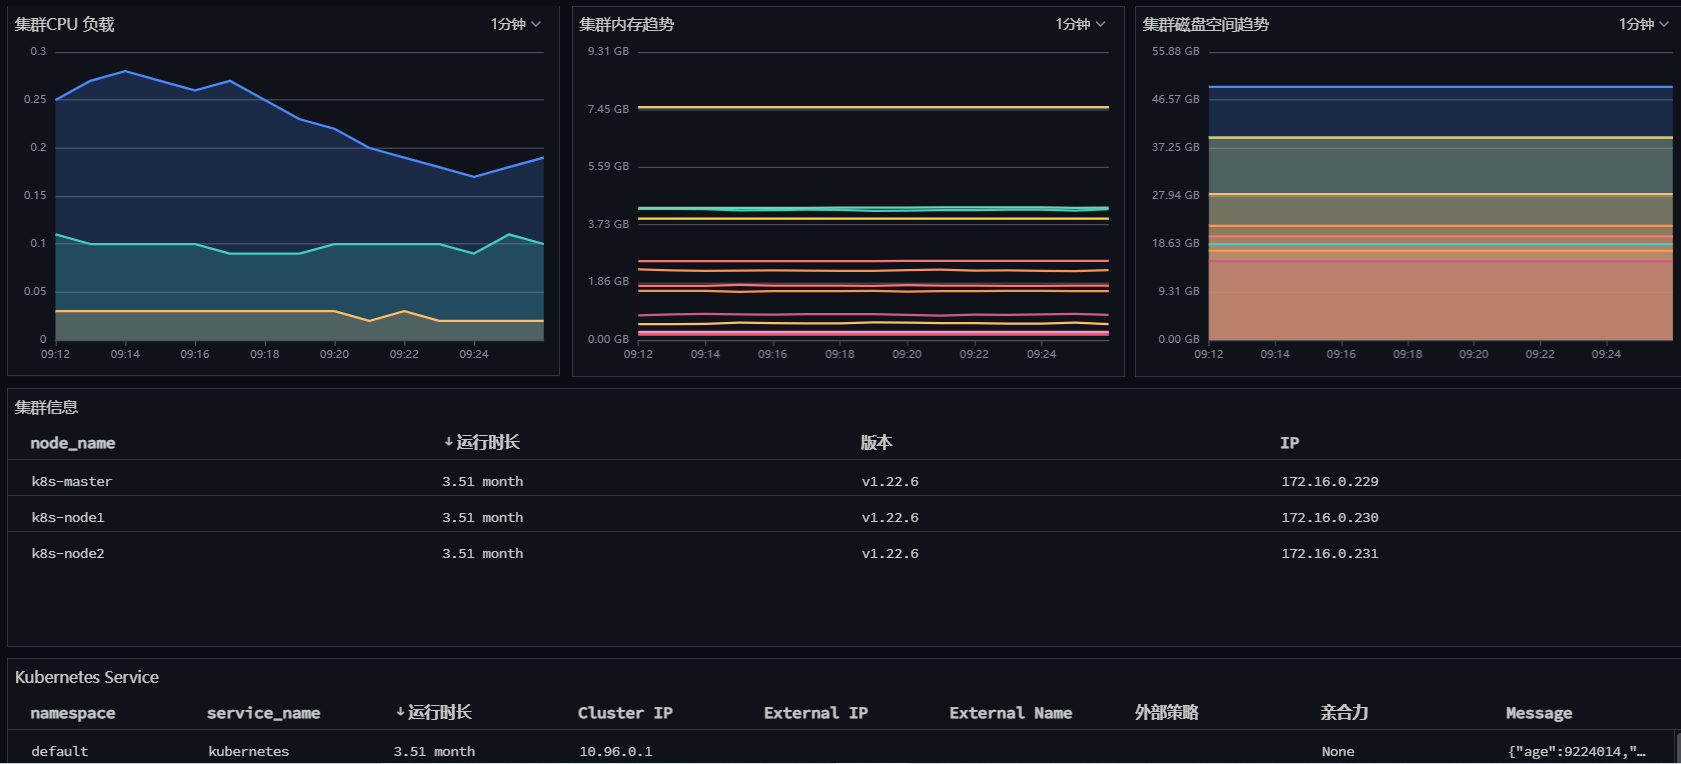
2.4 Kubernetes Overview with Kube State Metrics 모니터링 뷰
- 수집기 활성화
「Rancher」에 로그인 → 「클러스터」 → 「스토리지」 → 「ConfigMaps」로 이동하여 datakit-conf를 찾아 「구성 편집」을 클릭합니다.
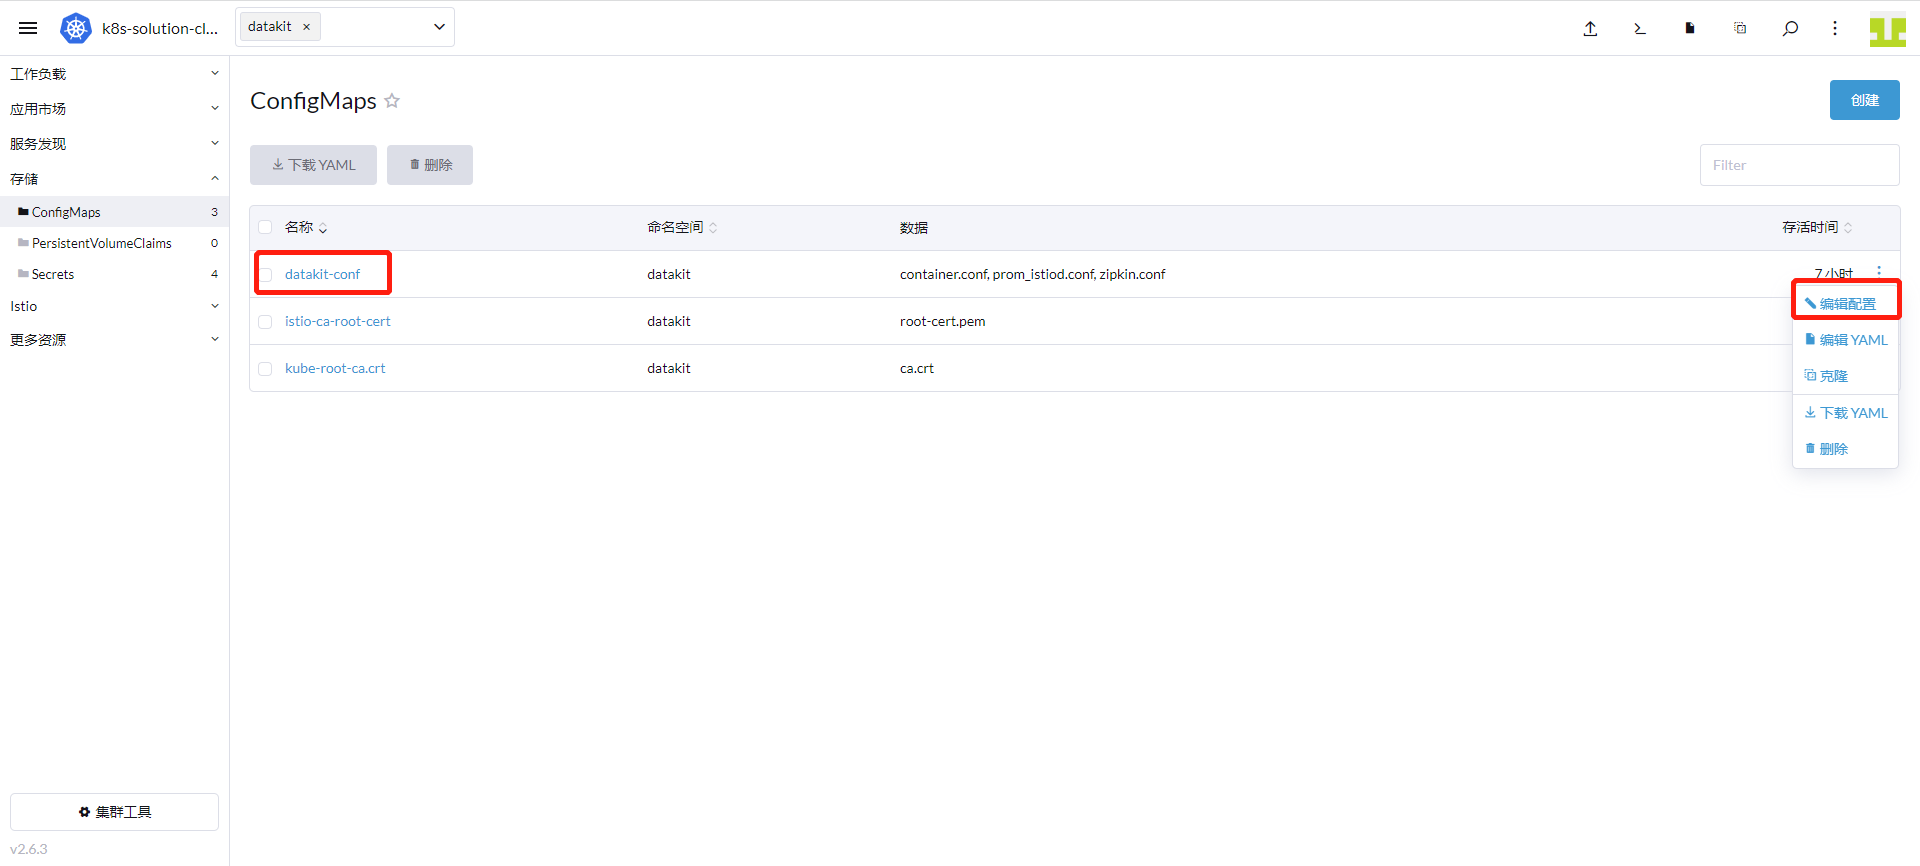
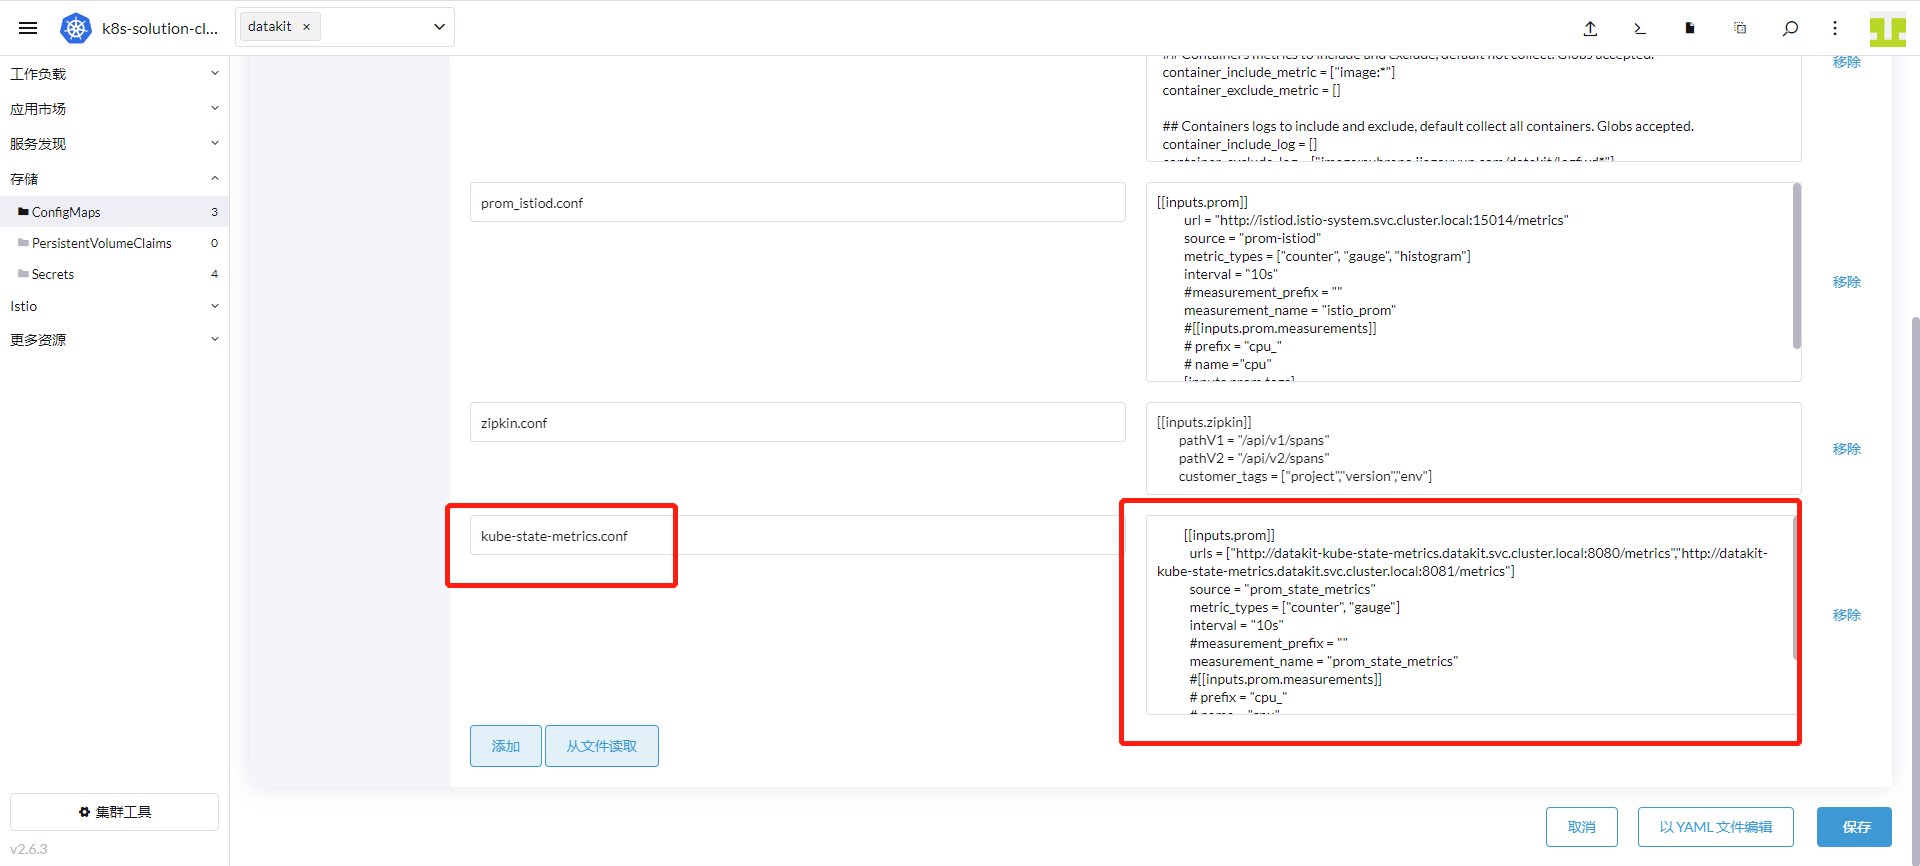
「추가」를 클릭하고 키에 「kube-state-metrics.conf」를 입력한 후 값에 다음 내용을 입력하고 「저장」을 클릭합니다.
          [[inputs.prom]]
            urls = ["http://datakit-kube-state-metrics.datakit.svc.cluster.local:8080/metrics","http://datakit-kube-state-metrics.datakit.svc.cluster.local:8081/metrics"]
            source = "prom_state_metrics"
            metric_types = ["counter", "gauge"]
            interval = "60s"
            tags_ignore = ["access_mode","branch","claim_namespace","cluster_ip","condition","configmap","container","container_id","container_runtime_version","created_by_kind","created_by_name","effect","endpoint","external_name","goversion","host_network","image","image_id","image_spec","ingress","ingressclass","internal_ip","job_name","kernel_version","key","kubelet_version","kubeproxy_version","lease","mutatingwebhookconfiguration","name","networkpolicy","node","node_name","os_image","owner_is_controller","owner_kind","owner_name","path","persistentvolume","persistentvolumeclaim","pod_cidr","pod_ip","poddisruptionbudget","port_name","port_number","port_protocol","priority_class","reason","resource","result","revision","role","secret","service","service_name","service_port","shard_ordinal","status","storageclass","system_uuid","type","uid","unit","version","volume","volumename"]
            metric_name_filter = ["kube_pod_status_phase","kube_pod_container_status_restarts_total","kube_daemonset_status_desired_number_scheduled","kube_daemonset_status_number_ready","kube_deployment_spec_replicas","kube_deployment_status_replicas_available","kube_deployment_status_replicas_unavailable","kube_replicaset_status_ready_replicas","kube_replicaset_spec_replicas","kube_pod_container_status_running","kube_pod_container_status_waiting","kube_pod_container_status_terminated","kube_pod_container_status_ready"]
            #measurement_prefix = ""
            measurement_name = "prom_state_metrics"
            #[[inputs.prom.measurements]]
            # prefix = "cpu_"
            # name = "cpu"
            [inputs.prom.tags]
            namespace = "$NAMESPACE"
            pod_name = "$PODNAME"
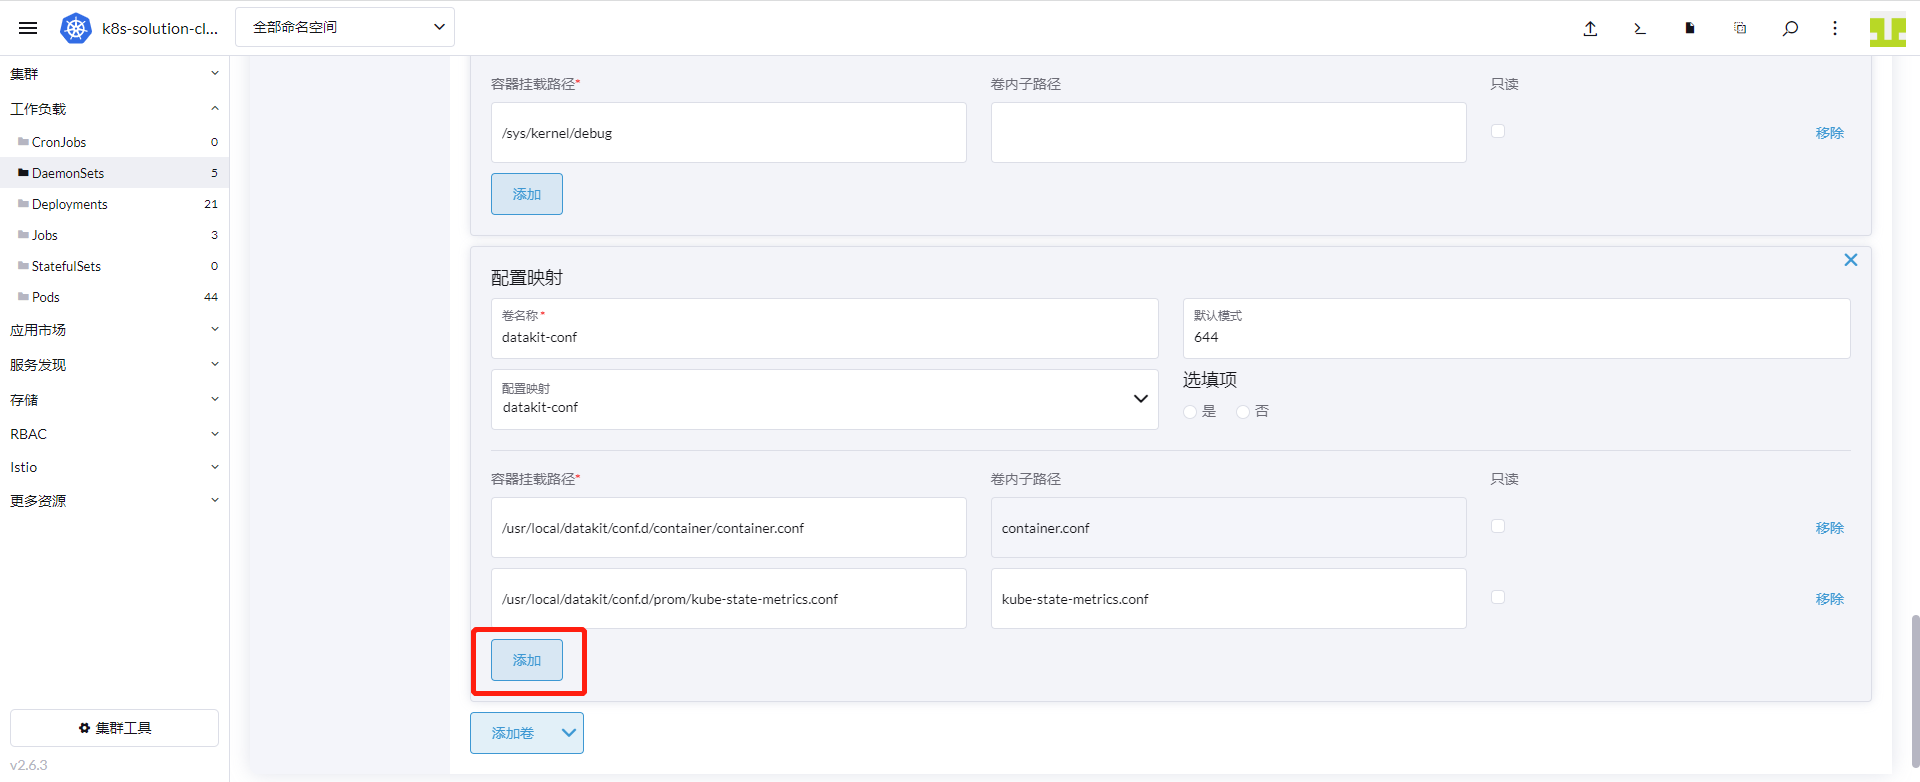
「클러스터」 → 「워크로드」 → 「DaemonSets」로 이동하여 datakit 행 오른쪽을 클릭하고 「구성 편집」을 선택합니다.
「스토리지」를 클릭하고 볼륨 이름이 「datakit-conf」인 ConfigMap을 찾아 「추가」를 클릭합니다. 컨테이너 마운트 경로에 「/usr/local/datakit/conf.d/prom/kube-state-metrics.conf」를 입력하고 하위 경로에 「kube-state-metrics.conf」를 입력한 후 「저장」을 클릭합니다.
- Kubernetes Overview with Kube State Metrics 모니터링 뷰
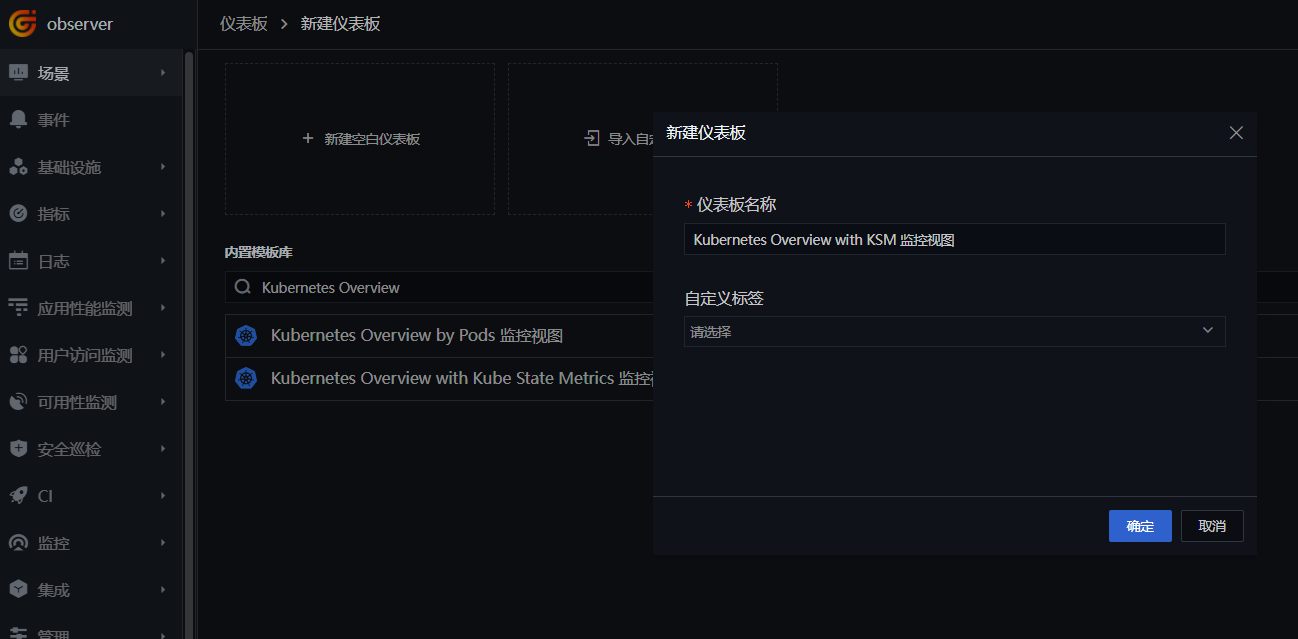
「Guance」에 로그인하여 「시나리오」 모듈로 이동합니다. 「대시보드 생성」을 클릭하고 「kubernetes Overview」를 입력한 후 「Kubernetes Overview with Kube State Metrics 모니터링 뷰」를 선택하고 「확인」을 클릭합니다.
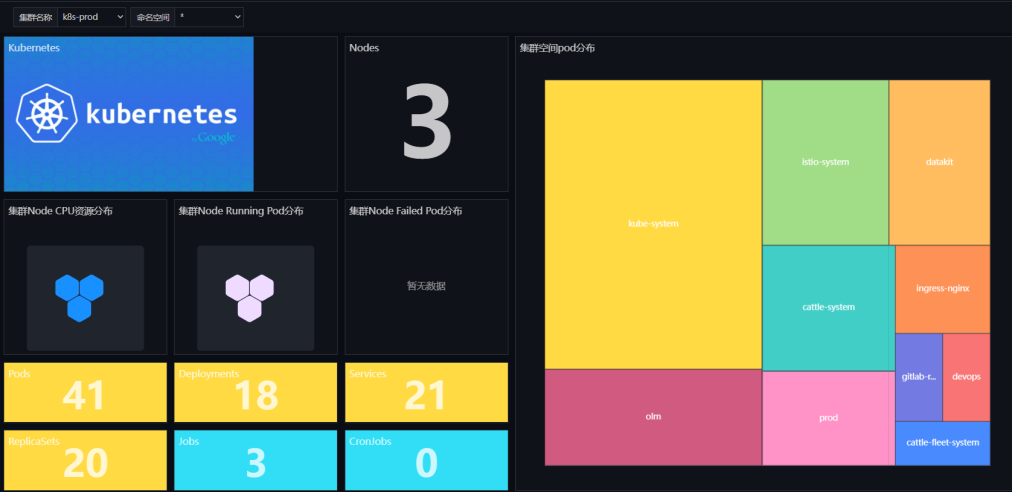
새로 생성된 「Kubernetes Overview with KSM 모니터링 뷰」를 클릭하여 클러스터 정보를 확인합니다.
2.5 Kubernetes Overview by Pods 모니터링 뷰
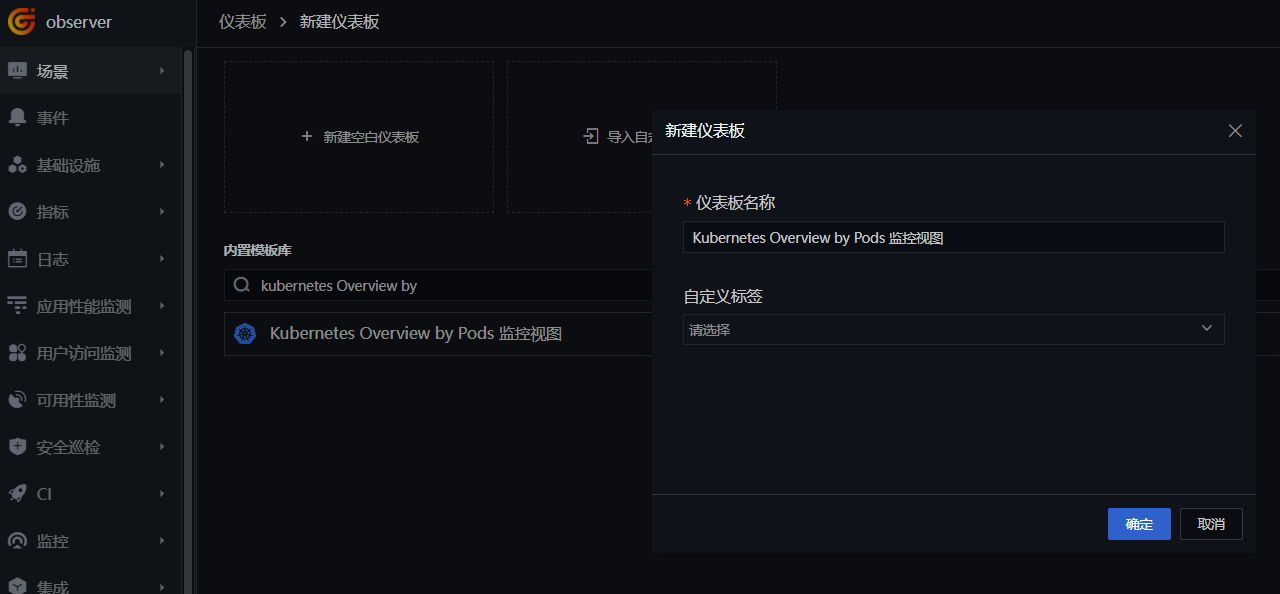
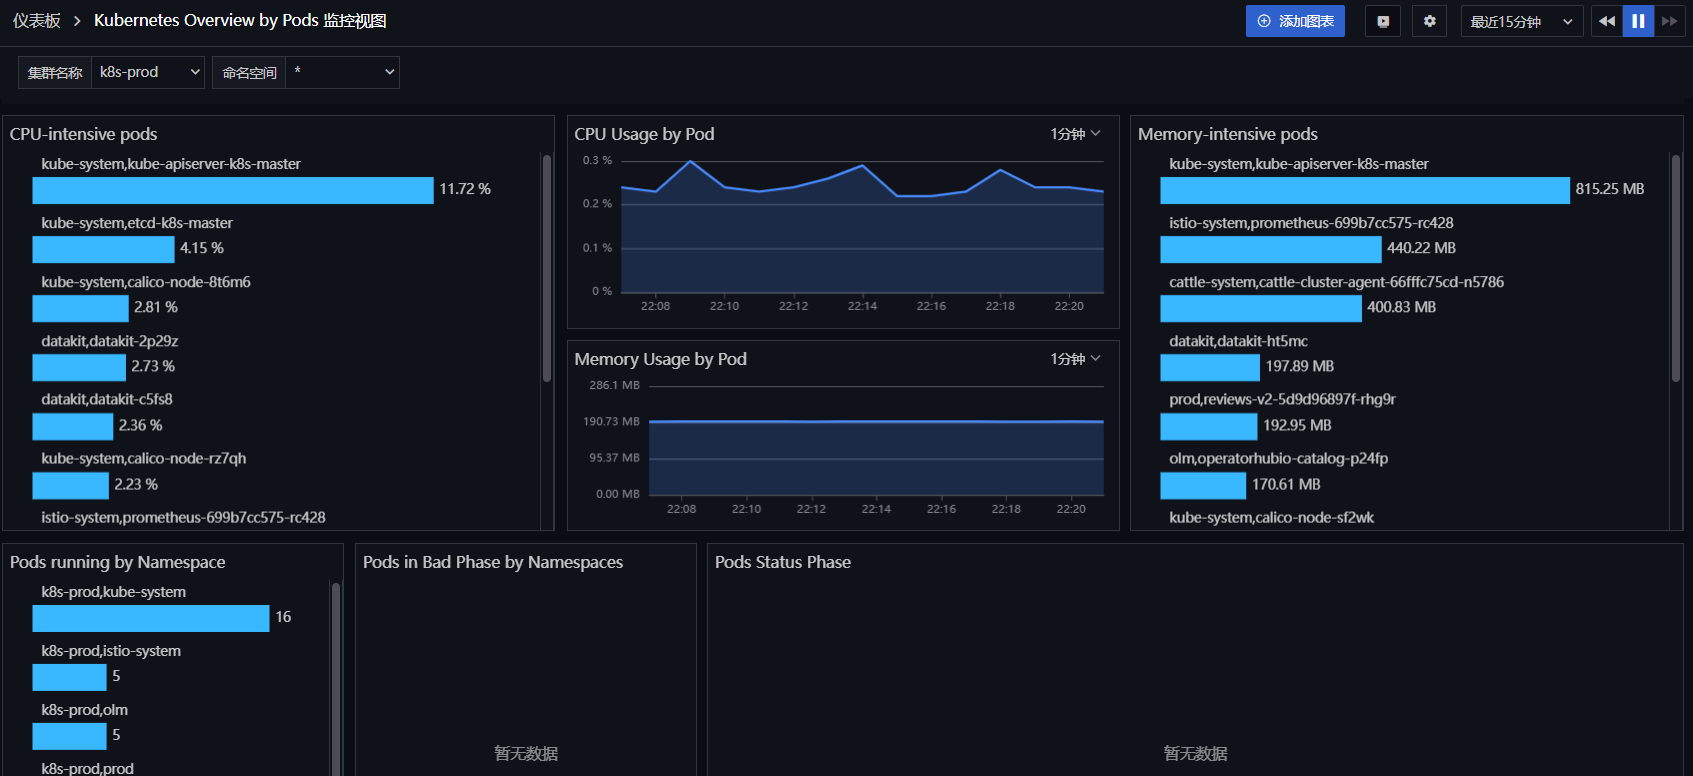
「Guance」에 로그인하여 「시나리오」 모듈로 이동합니다. 「대시보드 생성」을 클릭하고 「kubernetes Overview by」를 입력한 후 「Kubernetes Overview by Pods 모니터링 뷰」를 선택하고 「확인」을 클릭합니다.
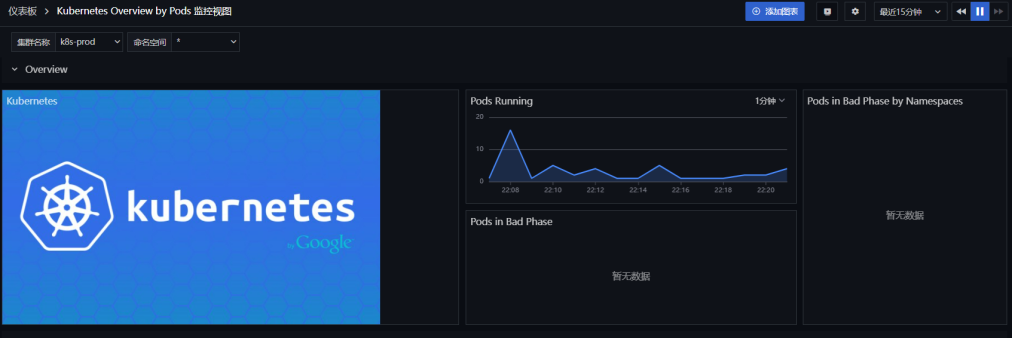
새로 생성된 「Kubernetes Overview by Pods 모니터링 뷰」를 클릭하여 클러스터 정보를 확인합니다.
2.6 Kubernetes Services 모니터링 뷰
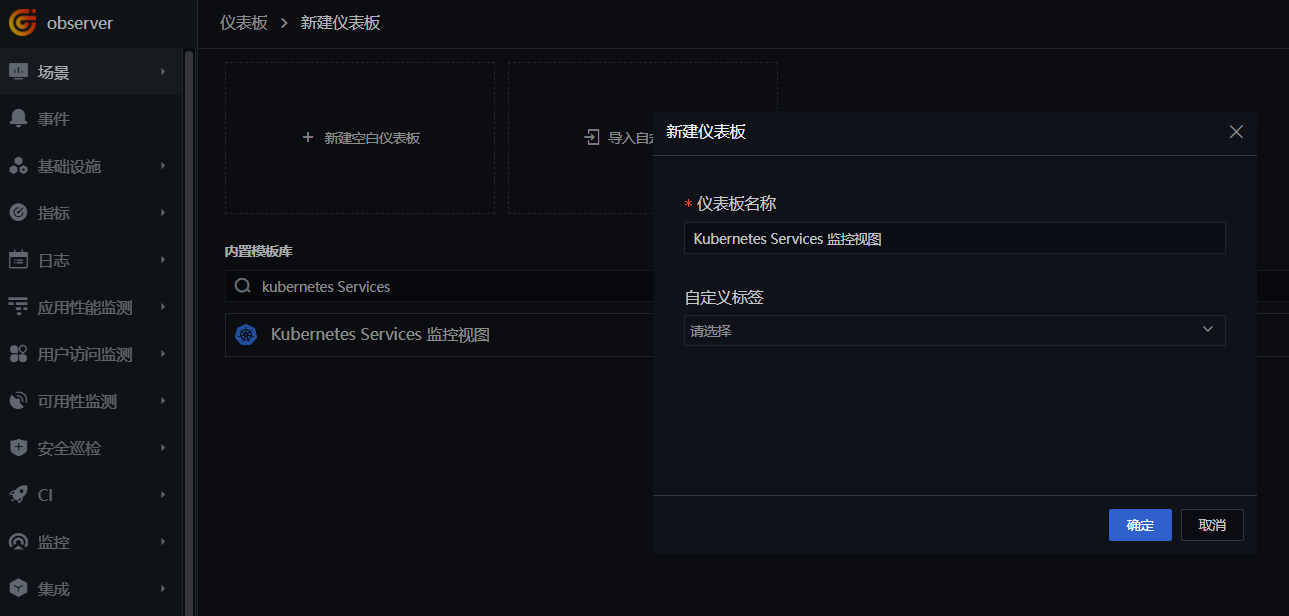
「Guance」에 로그인하여 「시나리오」 모듈로 이동합니다. 「대시보드 생성」을 클릭하고 「kubernetes Services」를 입력한 후 「Kubernetes Services 모니터링 뷰」를 선택하고 「확인」을 클릭합니다.
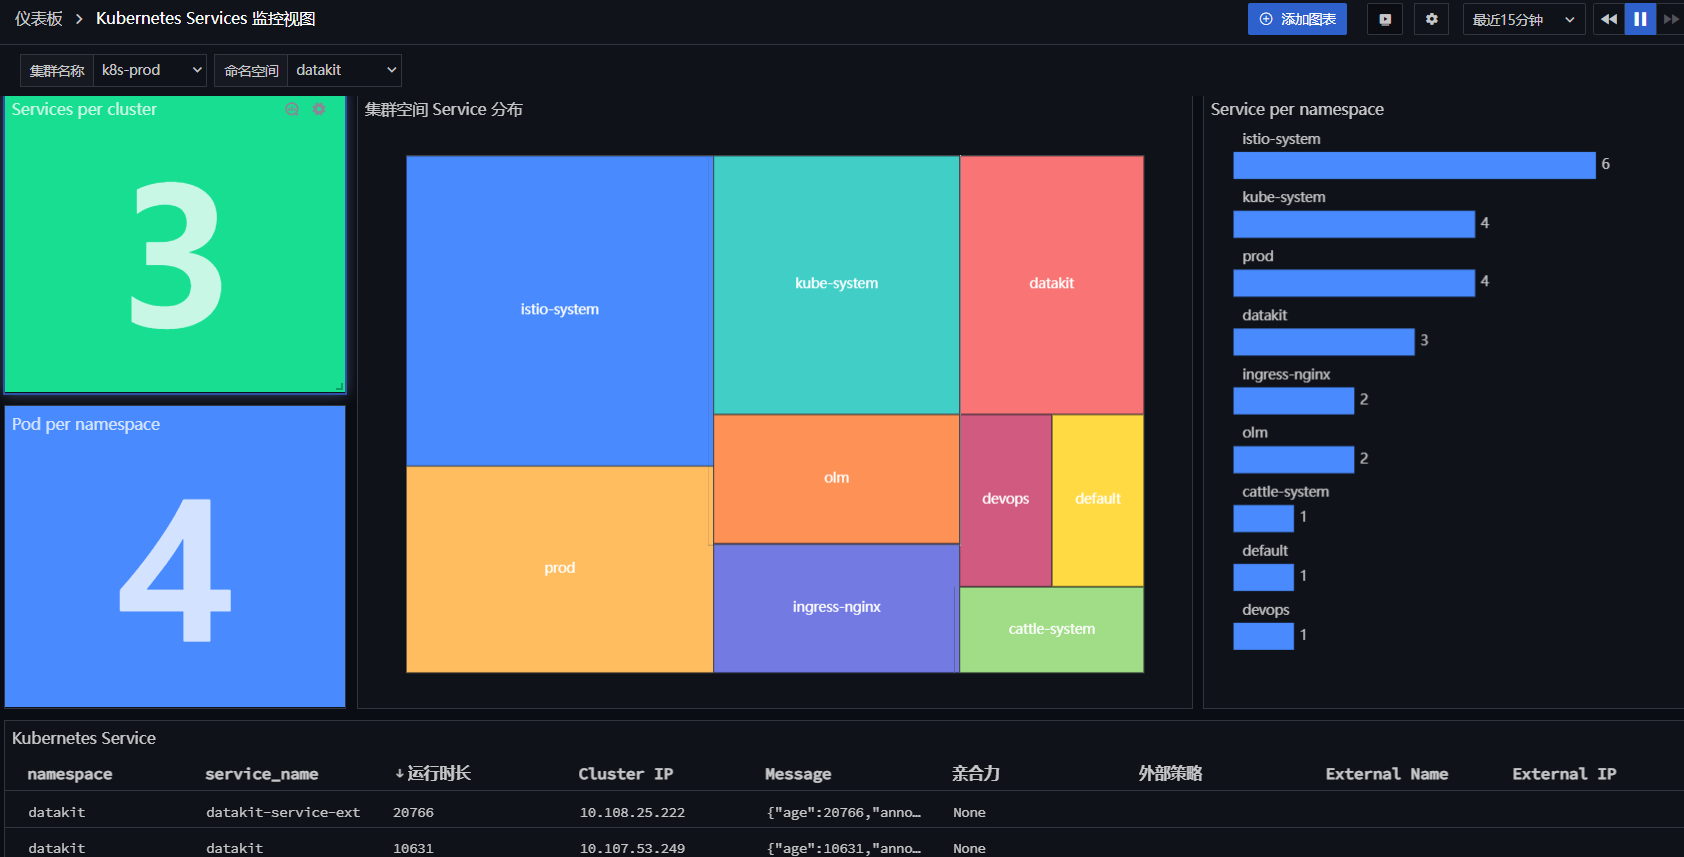
새로 생성된 「Kubernetes Services 모니터링 뷰」를 클릭하여 클러스터 정보를 확인합니다.
3단계: Istio 및 애플리케이션 배포
3.1 Istio 배포
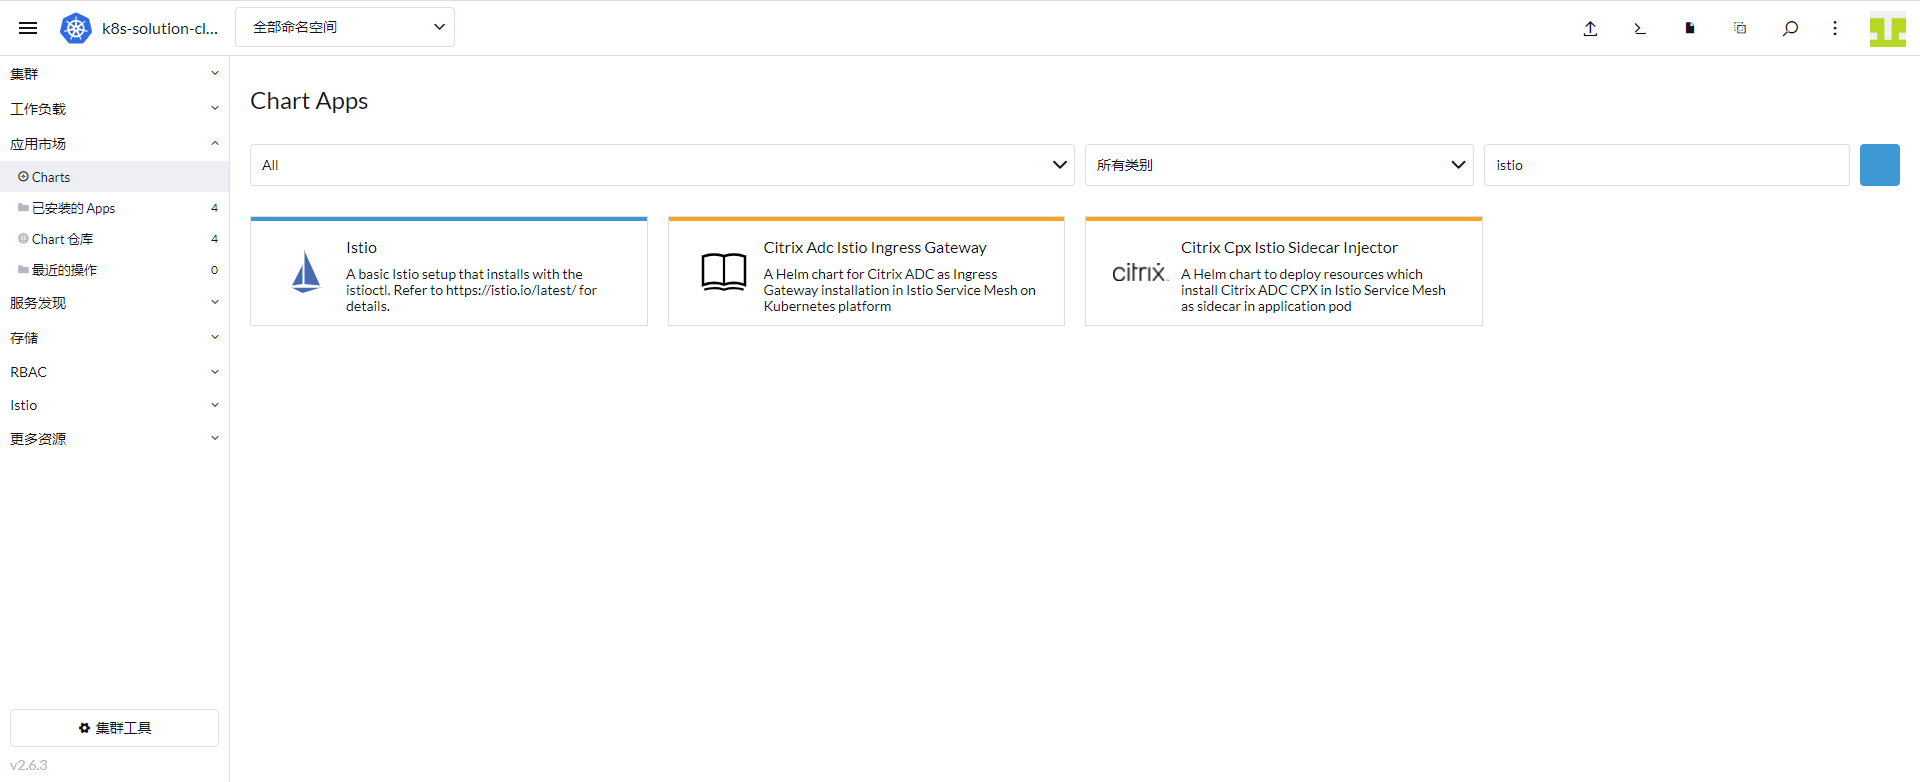
「Rancher」에 로그인 → 「앱 마켓플레이스」 → 「Charts」로 이동하여 Istio를 선택하고 설치합니다.
3.2 Sidecar 주입 활성화
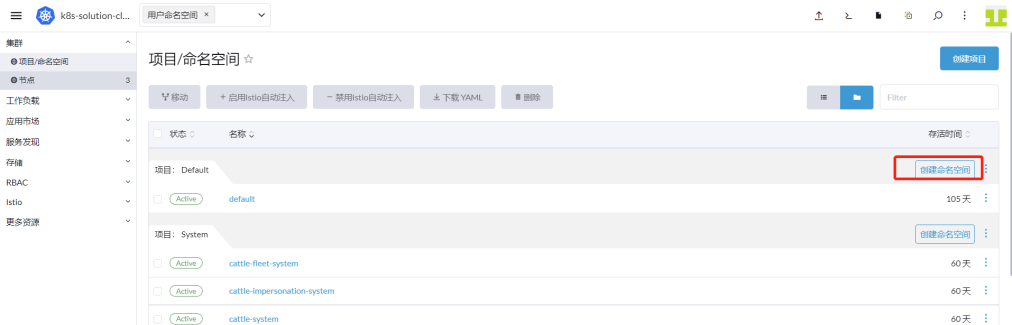
prod 네임스페이스를 생성하고 해당 네임스페이스에서 Pod 생성 시 Sidecar가 자동으로 주입되어 Pod의 모든 트래픽이 Sidecar를 통해 처리되도록 설정합니다.
「Rancher」에 로그인 → 「클러스터」 → 「프로젝트/네임스페이스」로 이동하여 「네임스페이스 생성」을 클릭합니다.
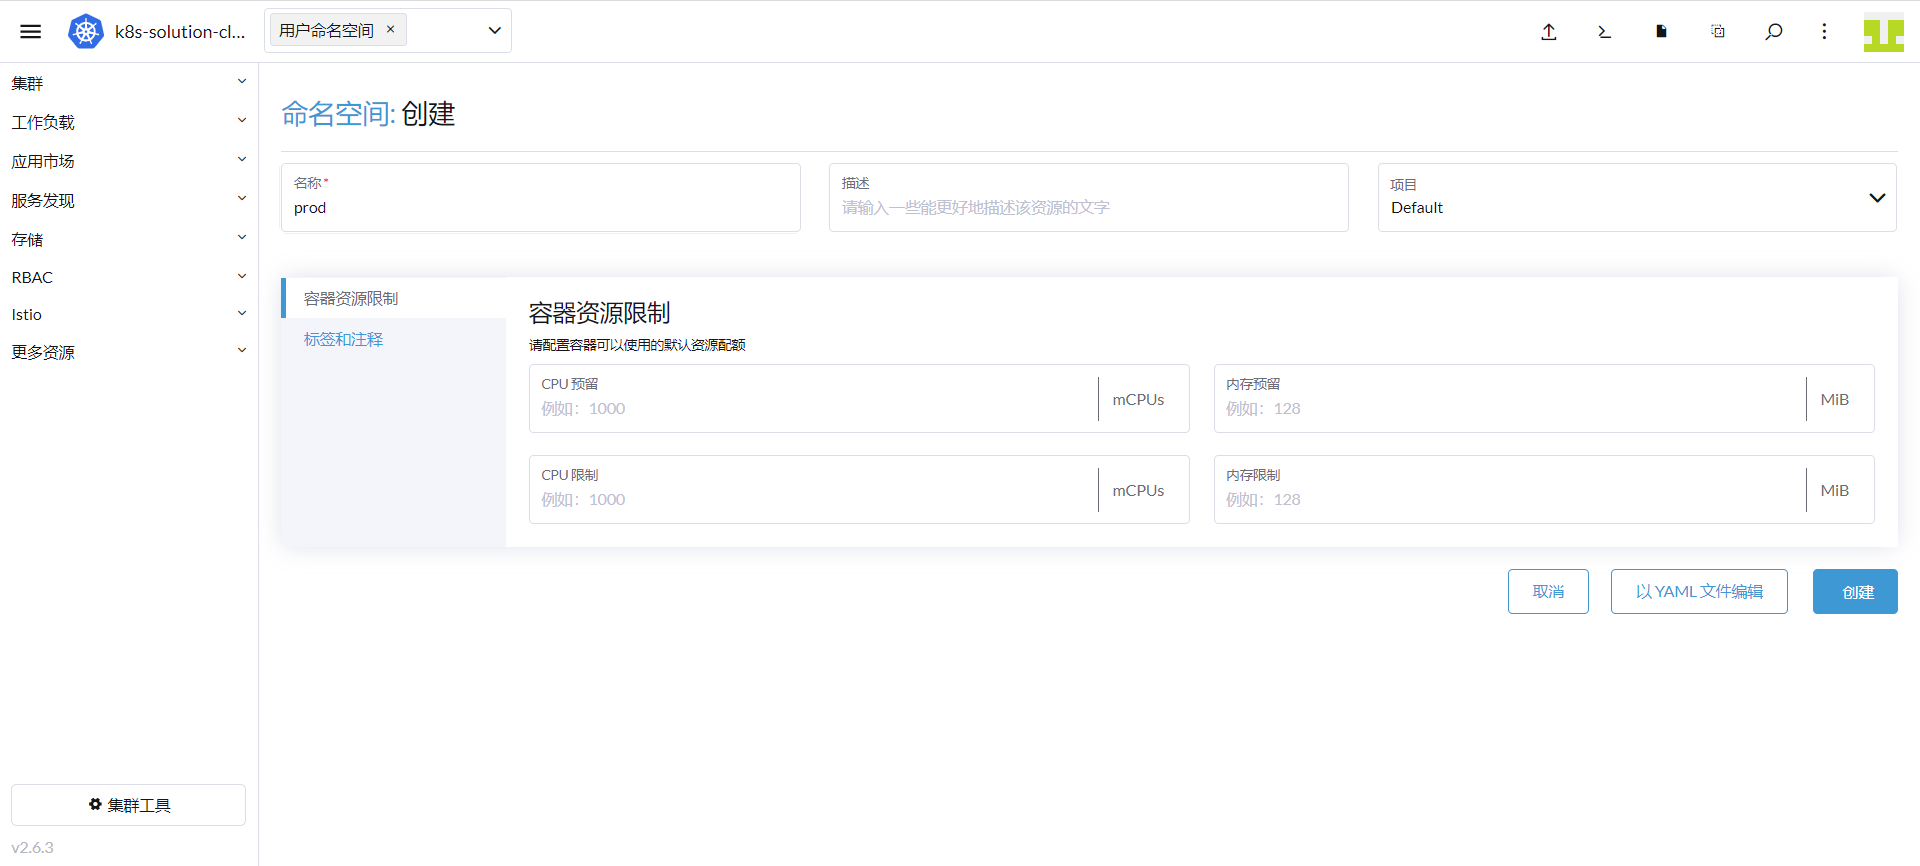
이름에 「prod」를 입력하고 「생성」을 클릭합니다.
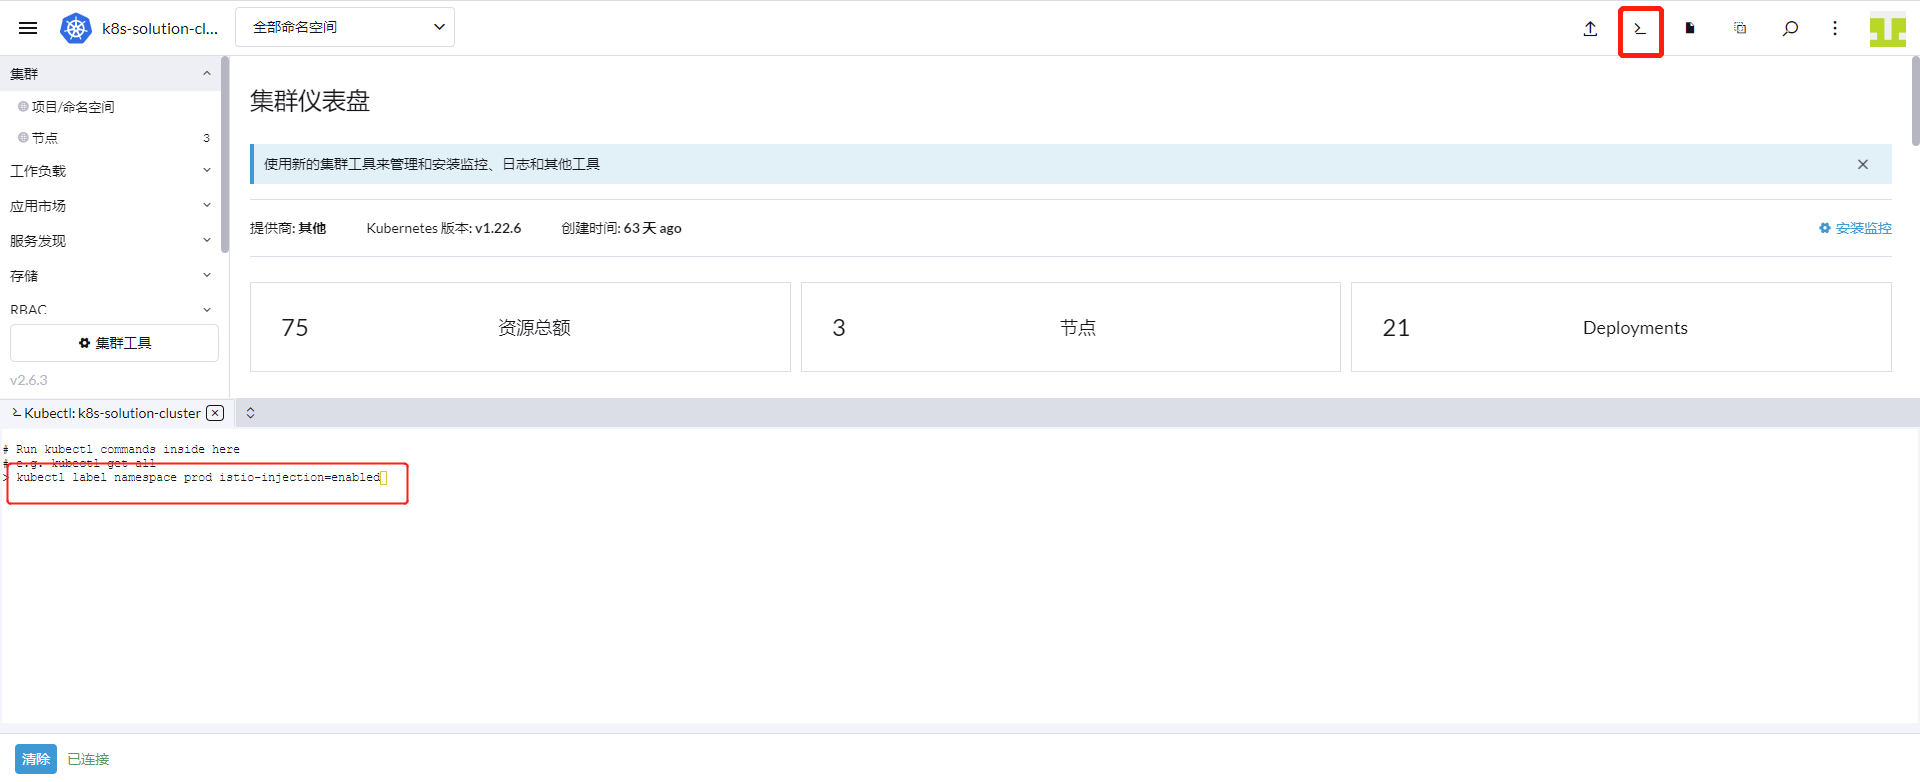
Rancher 상단의 「명령줄」 아이콘을 클릭하고 「kubectl label namespace prod istio-injection=enabled」를 입력한 후 Enter 키를 누릅니다.
3.3 Istiod 수집기 활성화
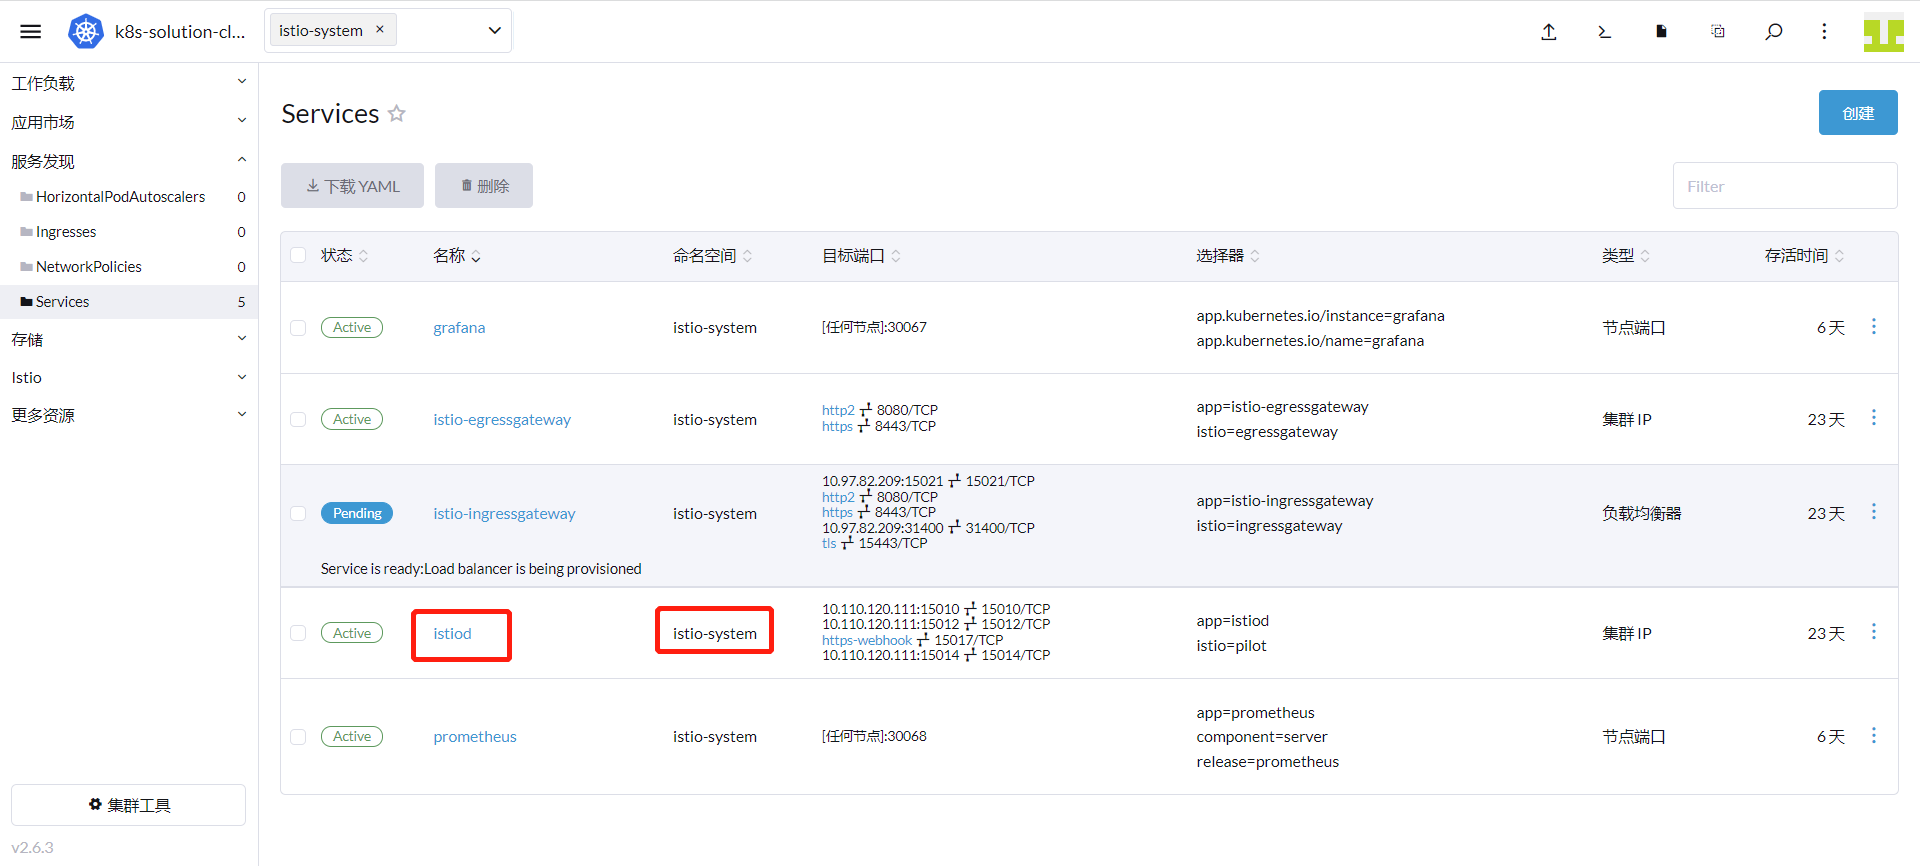
「Rancher」에 로그인 → 「클러스터」 → 「서비스 디스커버리」 → 「Service」로 이동하여 Service 이름이 istiod이고 네임스페이스가 istio-system인지 확인합니다.
「Rancher」에 로그인 → 「클러스터」 → 「스토리지」 → 「ConfigMaps」로 이동하여 datakit-conf를 찾아 「구성 편집」을 클릭합니다.
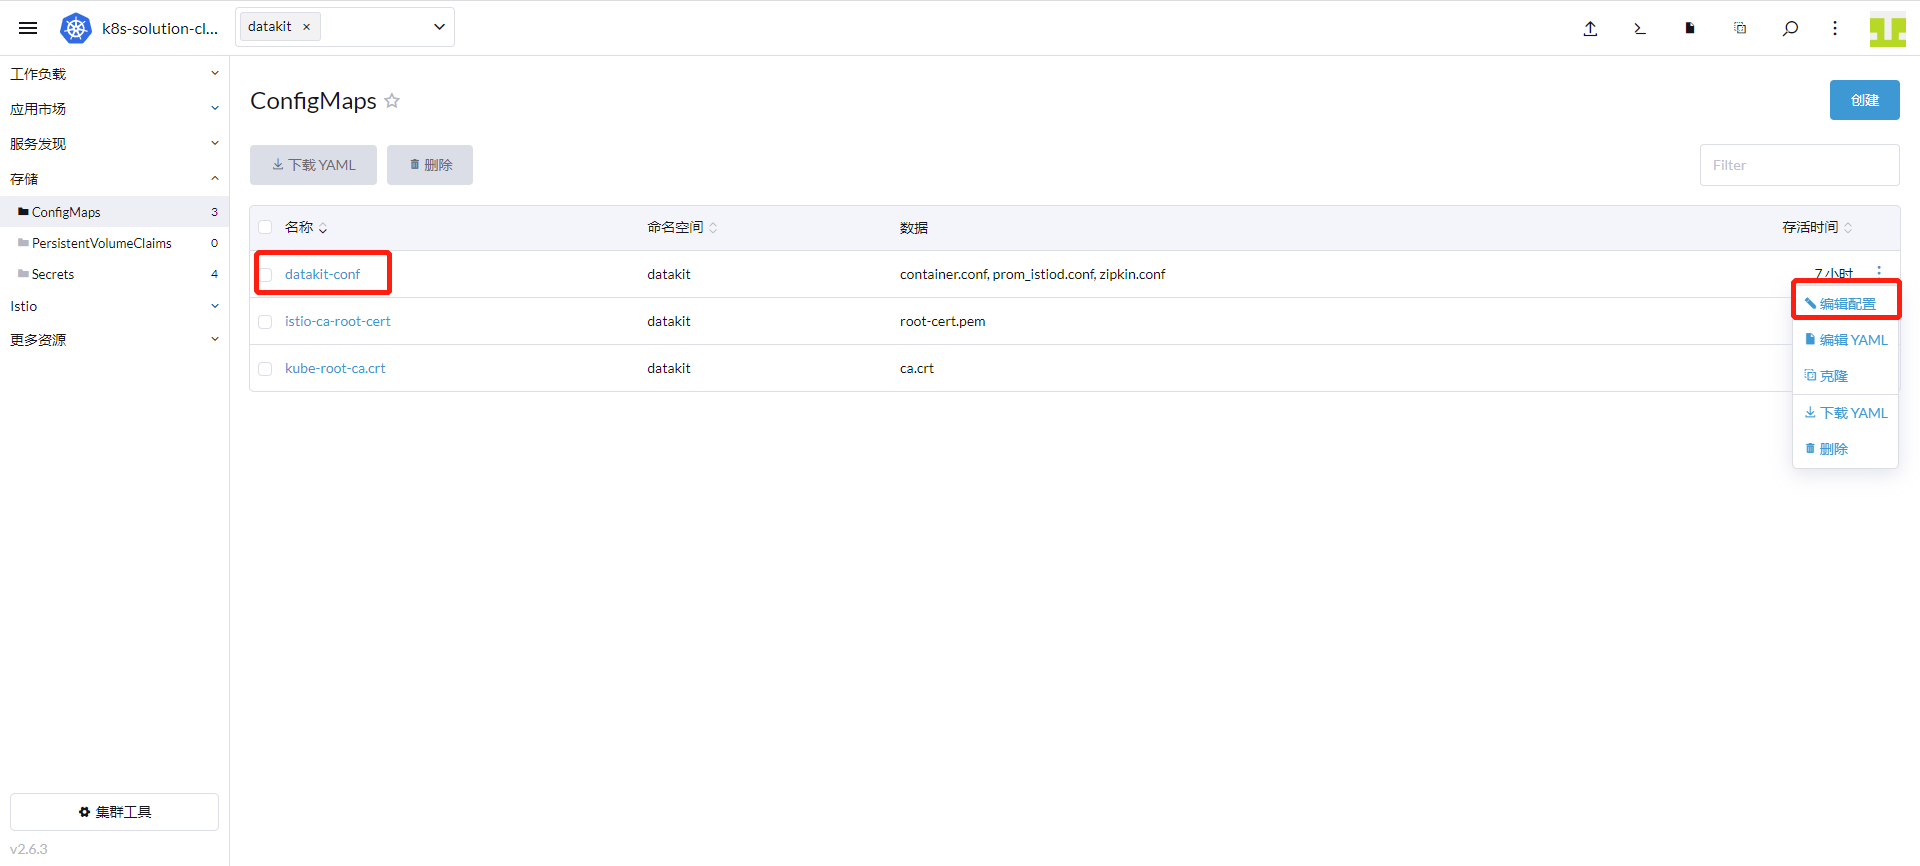
「추가」를 클릭하고 키에 「prom-istiod.conf」를 입력한 후 값에 다음 내용을 입력합니다. 「저장」을 클릭합니다.
        [[inputs.prom]]
          url = "http://istiod.istio-system.svc.cluster.local:15014/metrics"
          source = "prom-istiod"
          metric_types = ["counter", "gauge"]
          interval = "60s"
          tags_ignore = ["cache","cluster_type","component","destination_app","destination_canonical_revision","destination_canonical_service","destination_cluster","destination_principal","group","grpc_code","grpc_method","grpc_service","grpc_type","reason","request_protocol","request_type","resource","responce_code_class","response_flags","source_app","source_canonical_revision","source_canonical-service","source_cluster","source_principal","source_version","wasm_filter"]
          #measurement_prefix = ""
          metric_name_filter = ["istio_requests_total","pilot_k8s_cfg_events","istio_build","process_virtual_memory_bytes","process_resident_memory_bytes","process_cpu_seconds_total","envoy_cluster_assignment_stale","go_goroutines","pilot_xds_pushes","pilot_proxy_convergence_time_bucket","citadel_server_root_cert_expiry_timestamp","pilot_conflict_inbound_listener","pilot_conflict_outbound_listener_http_over_current_tcp","pilot_conflict_outbound_listener_tcp_over_current_tcp","pilot_conflict_outbound_listener_tcp_over_current_http","pilot_virt_services","galley_validation_failed","pilot_services","envoy_cluster_upstream_cx_total","envoy_cluster_upstream_cx_connect_fail","envoy_cluster_upstream_cx_active","envoy_cluster_upstream_cx_rx_bytes_total","envoy_cluster_upstream_cx_tx_bytes_total","istio_request_duration_milliseconds_bucket","istio_request_duration_seconds_bucket","istio_request_bytes_bucket","istio_response_bytes_bucket"]
          measurement_name = "istio_prom"
          #[[inputs.prom.measurements]]
          # prefix = "cpu_"
          # name ="cpu"
          [inputs.prom.tags]
            app_id="istiod"
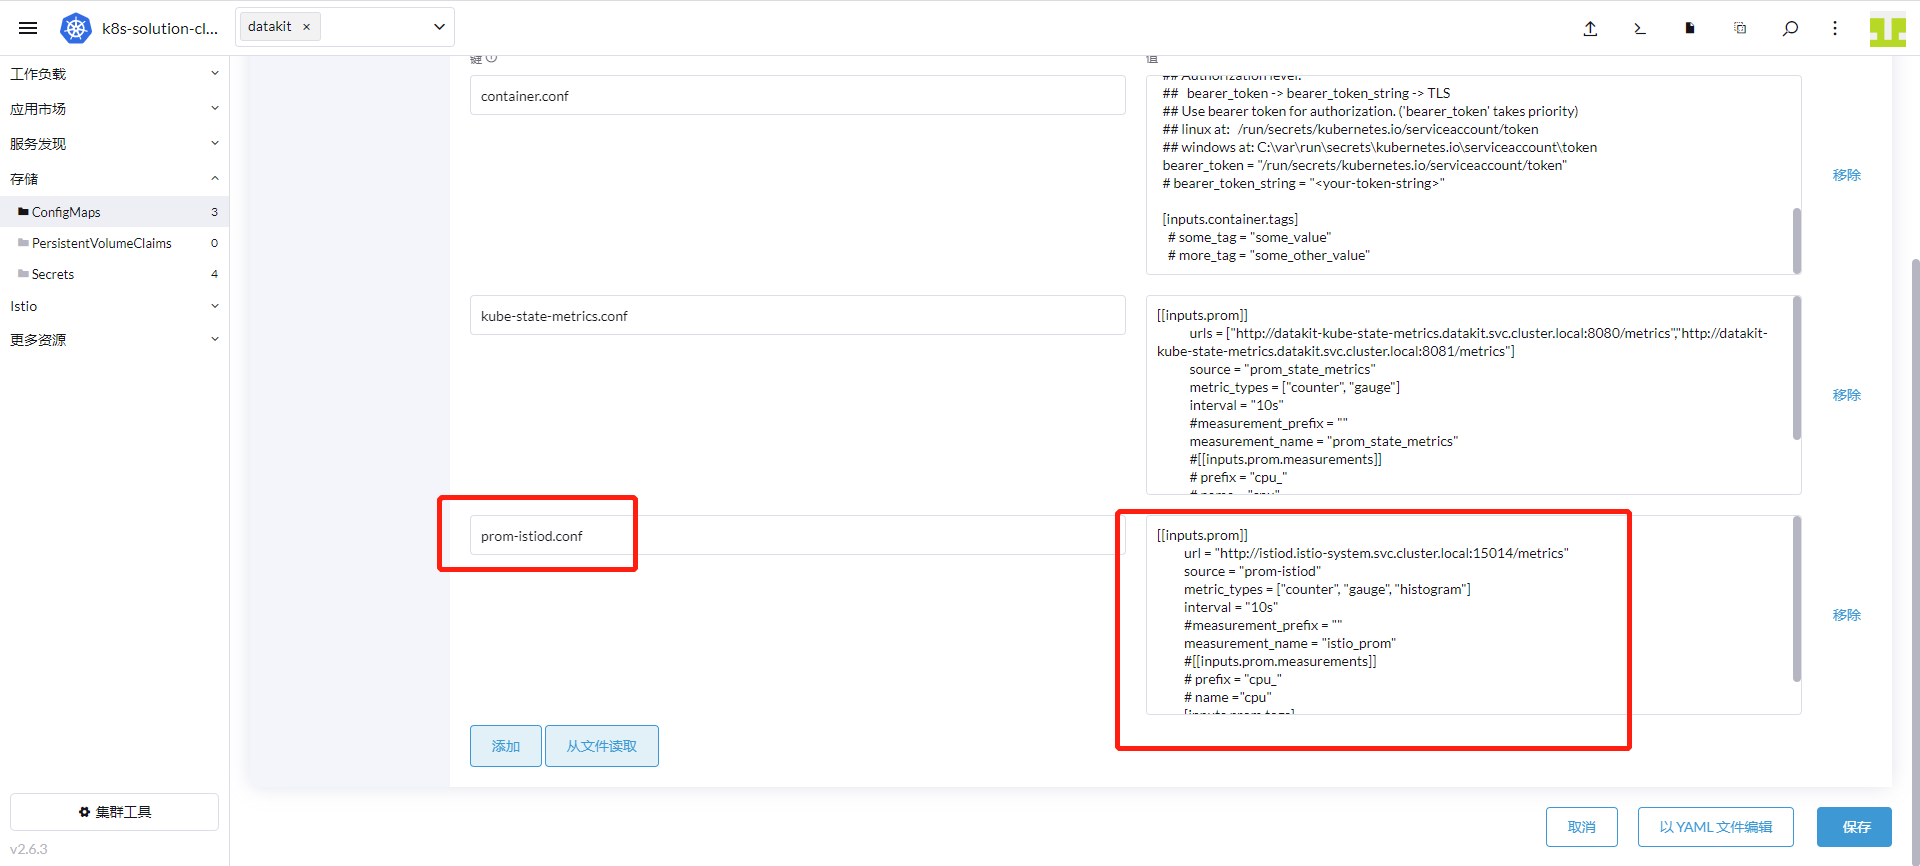
「클러스터」 → 「워크로드」 → 「DaemonSets」로 이동하여 datakit 행 오른쪽을 클릭하고 「구성 편집」을 선택합니다.
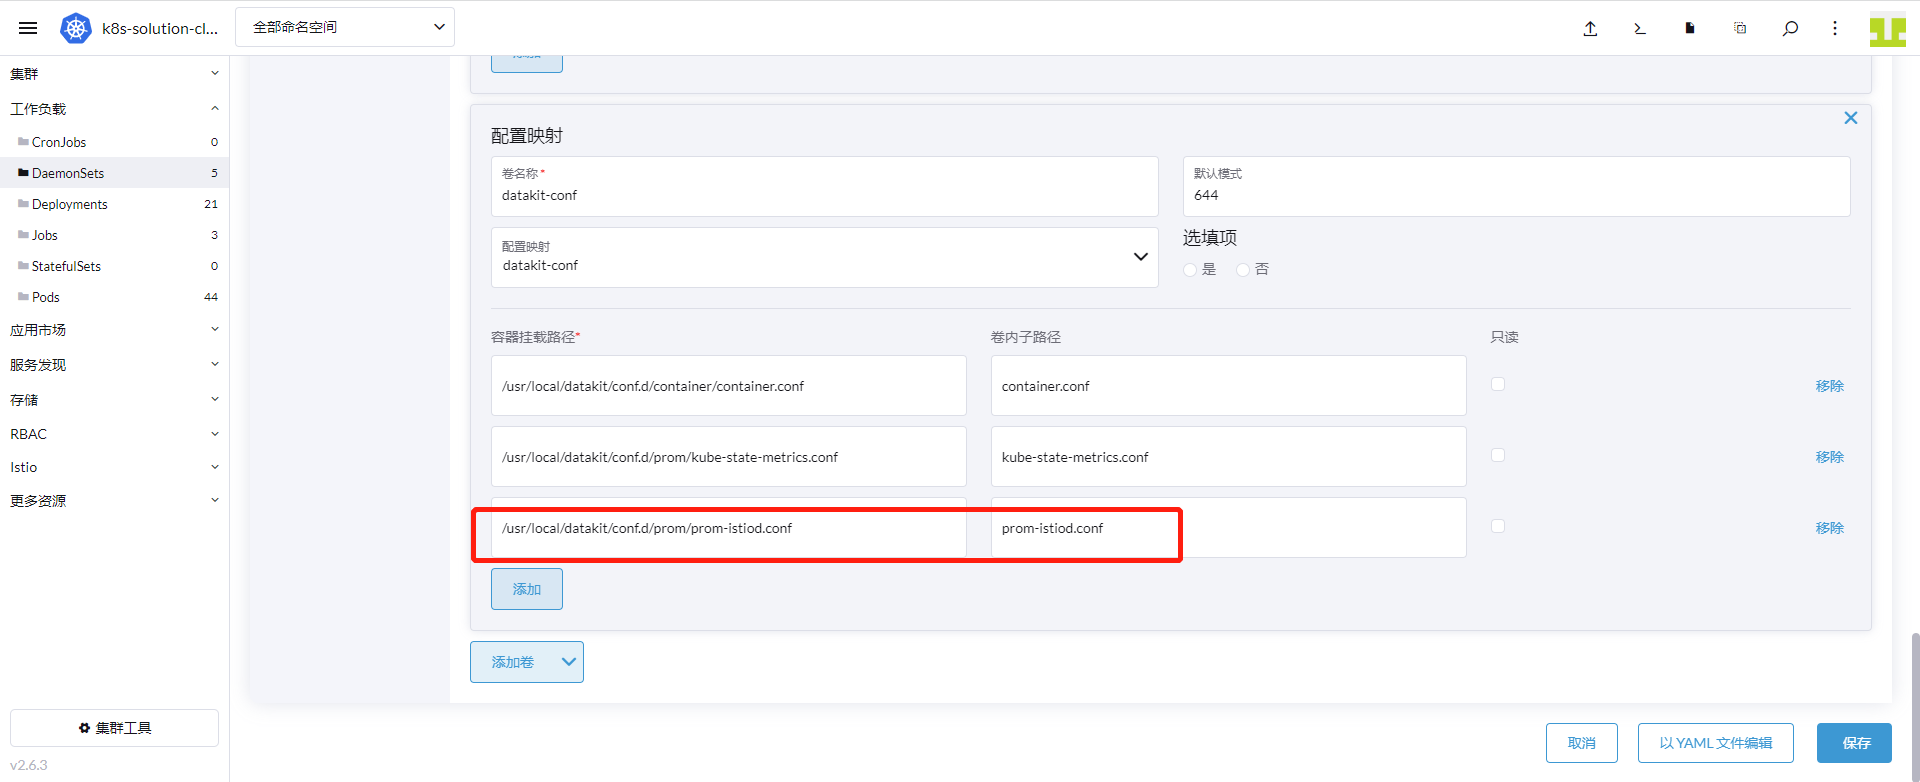
「스토리지」를 클릭하고 볼륨 이름이 “datakit-conf”인 ConfigMap을 찾아 「추가」를 클릭합니다. 다음 내용을 입력한 후 「저장」을 클릭합니다:
- 컨테이너 마운트 경로:
/usr/local/datakit/conf.d/prom/prom-istiod.conf - 하위 경로:
prom-istiod.conf
3.4 ingressgateway 및 egressgateway 수집기 활성화
ingressgateway와 egressgateway를 수집하려면 Service를 사용하여 15020 포트에 접근해야 하므로 ingressgateway와 egressgateway의 Service를 새로 생성해야 합니다.
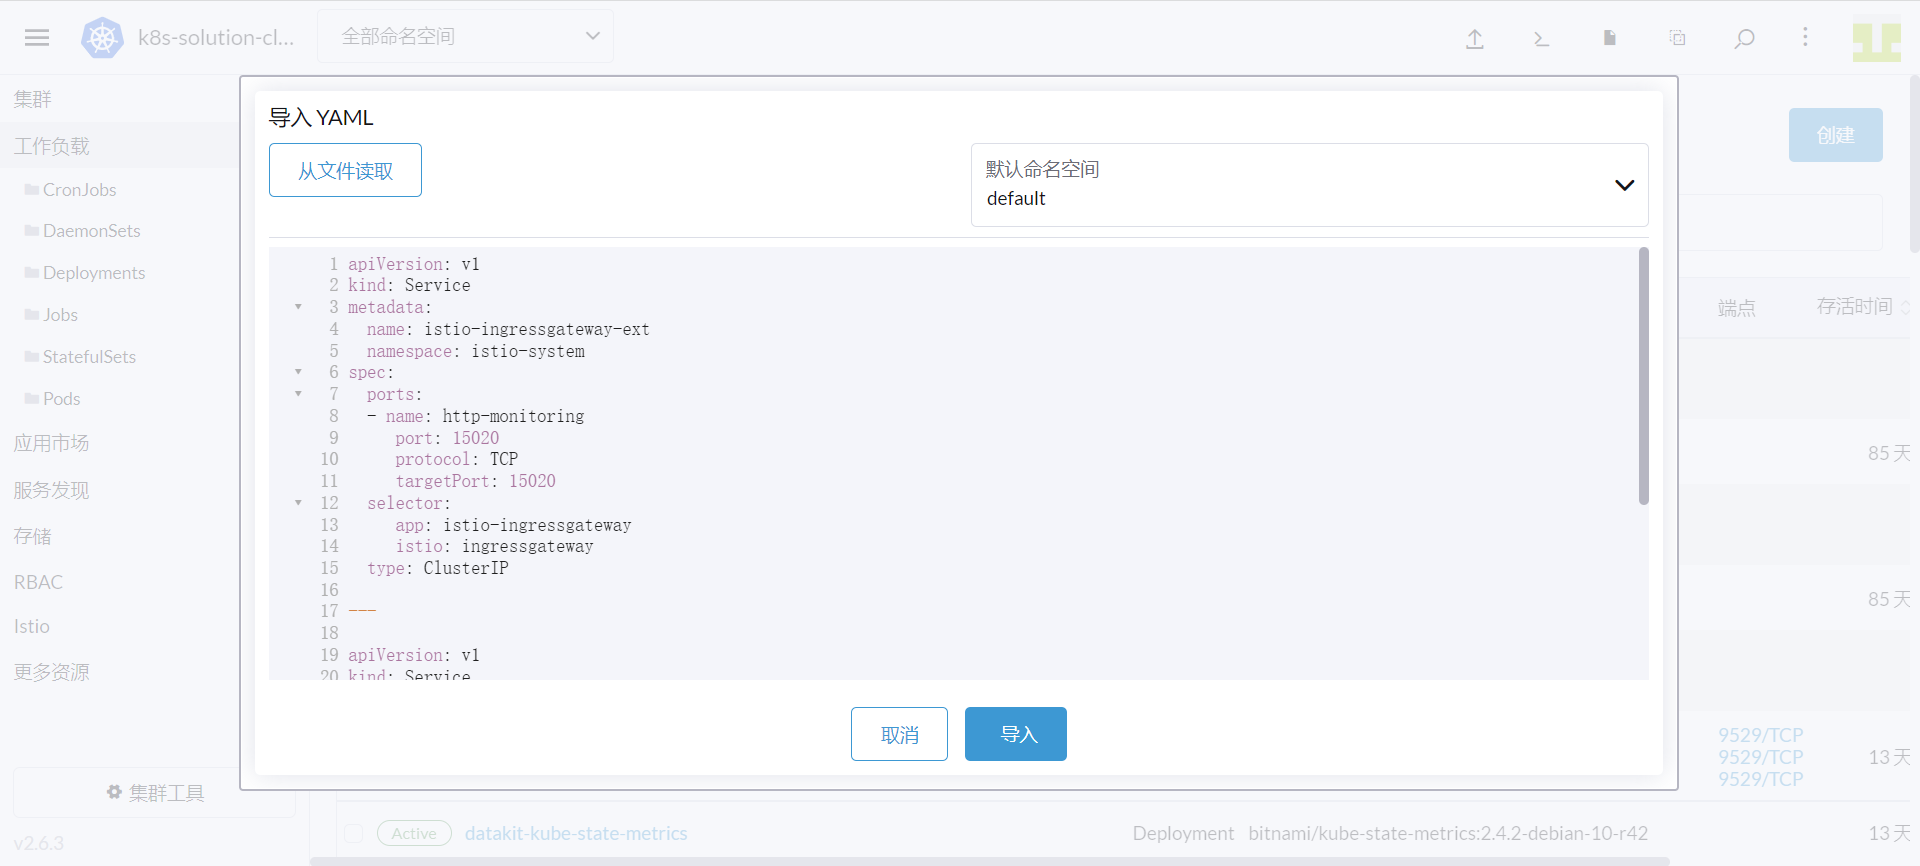
「Rancher」에 로그인 → 「클러스터」로 이동하여 상단의 「YAML 가져오기」 아이콘을 클릭하고 다음 내용을 입력한 후 「가져오기」를 클릭하면 Service 생성이 완료됩니다.
apiVersion: v1
kind: Service
metadata:
  name: istio-ingressgateway-ext
  namespace: istio-system
spec:
  ports:
    - name: http-monitoring
      port: 15020
      protocol: TCP
      targetPort: 15020
  selector:
    app: istio-ingressgateway
    istio: ingressgateway
  type: ClusterIP

---
apiVersion: v1
kind: Service
metadata:
  name: istio-egressgateway-ext
  namespace: istio-system
spec:
  ports:
    - name: http-monitoring
      port: 15020
      protocol: TCP
      targetPort: 15020
  selector:
    app: istio-egressgateway
    istio: egressgateway
  type: ClusterIP
「Rancher」에 로그인 → 「클러스터」 → 「스토리지」 → 「ConfigMaps」로 이동하여 datakit-conf를 찾아 「구성 편집」을 클릭합니다.
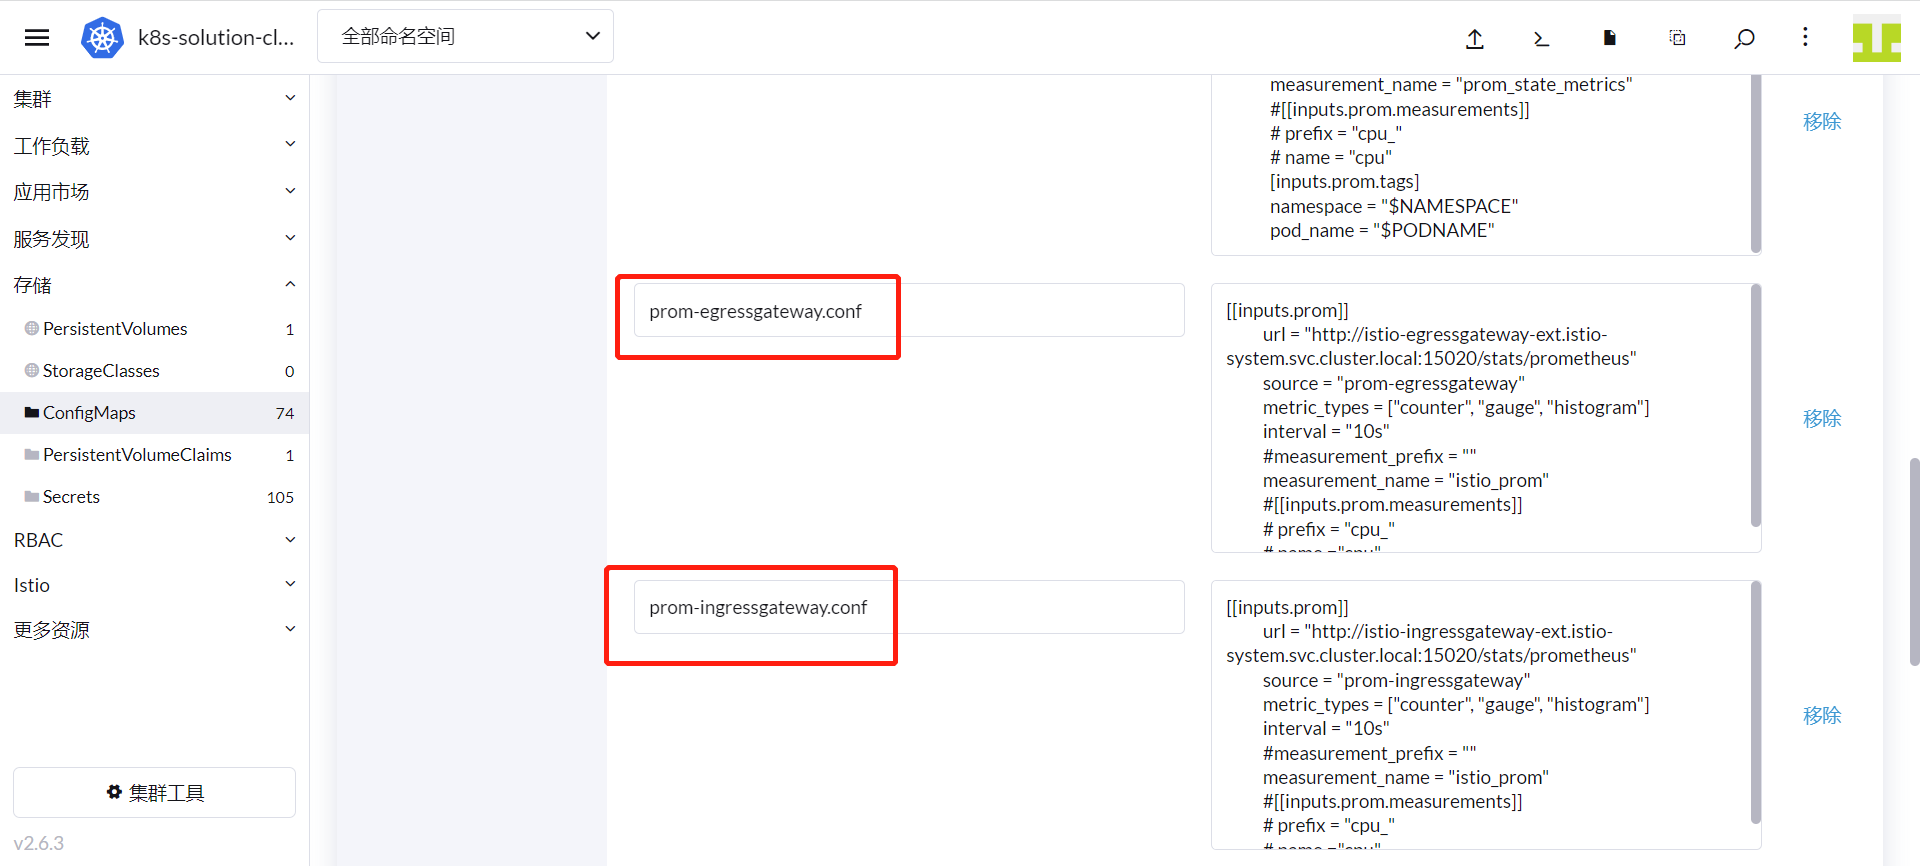
「추가」를 클릭하고 키에 각각 「prom-ingressgateway.conf」와 「prom-egressgateway.conf」를 입력한 후 값은 다음 내용을 참고하여 입력합니다. 「저장」을 클릭합니다.
#### ingressgateway
prom-ingressgateway.conf: |-
  [[inputs.prom]]
    url = "http://istio-ingressgateway-ext.istio-system.svc.cluster.local:15020/stats/prometheus"
    source = "prom-ingressgateway"
    metric_types = ["counter", "gauge"]
    interval = "60s"
    tags_ignore = ["cache","cluster_type","component","destination_app","destination_canonical_revision","destination_canonical_service","destination_cluster","destination_principal","group","grpc_code","grpc_method","grpc_service","grpc_type","reason","request_protocol","request_type","resource","responce_code_class","response_flags","source_app","source_canonical_revision","source_canonical-service","source_cluster","source_principal","source_version","wasm_filter"]
    metric_name_filter = ["istio_requests_total","pilot_k8s_cfg_events","istio_build","process_virtual_memory_bytes","process_resident_memory_bytes","process_cpu_seconds_total","envoy_cluster_assignment_stale","go_goroutines","pilot_xds_pushes","pilot_proxy_convergence_time_bucket","citadel_server_root_cert_expiry_timestamp","pilot_conflict_inbound_listener","pilot_conflict_outbound_listener_http_over_current_tcp","pilot_conflict_outbound_listener_tcp_over_current_tcp","pilot_conflict_outbound_listener_tcp_over_current_http","pilot_virt_services","galley_validation_failed","pilot_services","envoy_cluster_upstream_cx_total","envoy_cluster_upstream_cx_connect_fail","envoy_cluster_upstream_cx_active","envoy_cluster_upstream_cx_rx_bytes_total","envoy_cluster_upstream_cx_tx_bytes_total","istio_request_duration_milliseconds_bucket","istio_request_duration_seconds_bucket","istio_request_bytes_bucket","istio_response_bytes_bucket"]
    #measurement_prefix = ""
    measurement_name = "istio_prom"
    #[[inputs.prom.measurements]]
    # prefix = "cpu_"
    # name ="cpu"
#### egressgateway
prom-egressgateway.conf: |-
  [[inputs.prom]]
    url = "http://istio-egressgateway-ext.istio-system.svc.cluster.local:15020/stats/prometheus"
    source = "prom-egressgateway"
    metric_types = ["counter", "gauge"]
    interval = "60s"
    tags_ignore = ["cache","cluster_type","component","destination_app","destination_canonical_revision","destination_canonical_service","destination_cluster","destination_principal","group","grpc_code","grpc_method","grpc_service","grpc_type","reason","request_protocol","request_type","resource","responce_code_class","response_flags","source_app","source_canonical_revision","source_canonical-service","source_cluster","source_principal","source_version","wasm_filter"]
    metric_name_filter = ["istio_requests_total","pilot_k8s_cfg_events","istio_build","process_virtual_memory_bytes","process_resident_memory_bytes","process_cpu_seconds_total","envoy_cluster_assignment_stale","go_goroutines","pilot_xds_pushes","pilot_proxy_convergence_time_bucket","citadel_server_root_cert_expiry_timestamp","pilot_conflict_inbound_listener","pilot_conflict_outbound_listener_http_over_current_tcp","pilot_conflict_outbound_listener_tcp_over_current_tcp","pilot_conflict_outbound_listener_tcp_over_current_http","pilot_virt_services","galley_validation_failed","pilot_services","envoy_cluster_upstream_cx_total","envoy_cluster_upstream_cx_connect_fail","envoy_cluster_upstream_cx_active","envoy_cluster_upstream_cx_rx_bytes_total","envoy_cluster_upstream_cx_tx_bytes_total","istio_request_duration_milliseconds_bucket","istio_request_duration_seconds_bucket","istio_request_bytes_bucket","istio_response_bytes_bucket"]
    #measurement_prefix = ""
    measurement_name = "istio_prom"
    #[[inputs.prom.measurements]]
    # prefix = "cpu_"
    # name ="cpu"
「클러스터」 → 「워크로드」 → 「DaemonSets」로 이동하여 datakit 행 오른쪽을 클릭하고 「구성 편집」을 선택합니다.
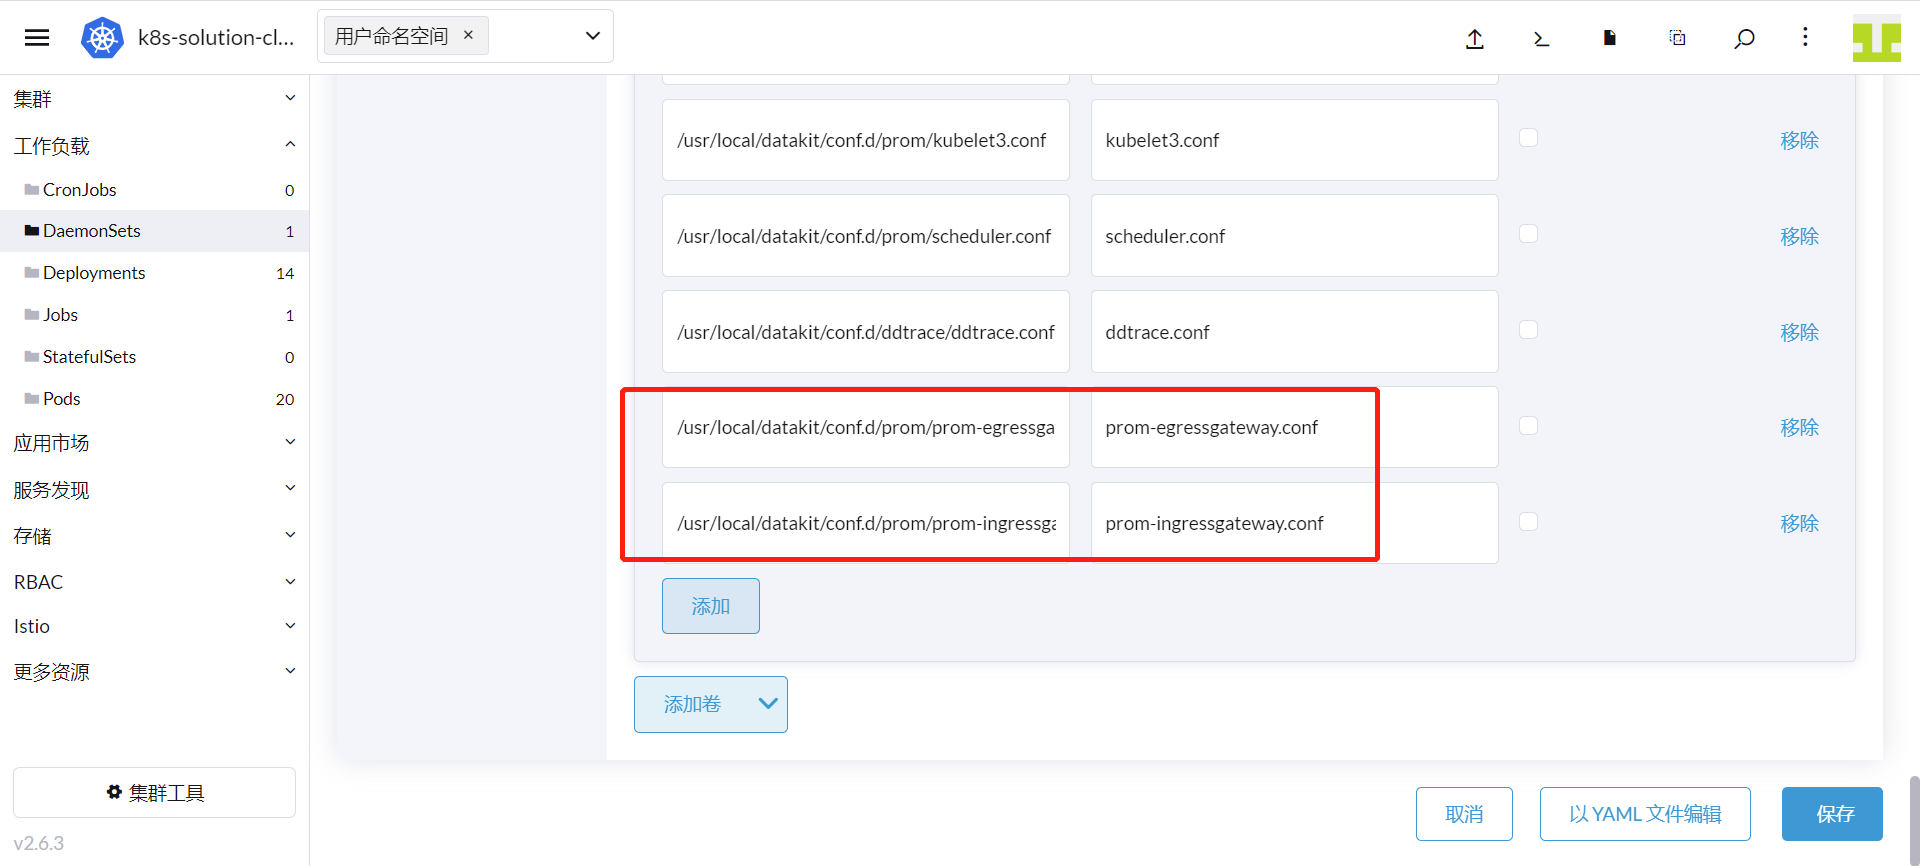
「스토리지」를 클릭하고 볼륨 이름이 “datakit-conf”인 ConfigMap을 찾아 2번 추가하고 저장합니다:
1번째 「추가」를 클릭하고 다음 내용을 입력한 후 「저장」을 클릭합니다:
- 컨테이너 마운트 경로:
/usr/local/datakit/conf.d/prom/prom-ingressgateway.conf - 하위 경로:
prom-ingressgateway.conf
2번째 「추가」를 클릭하고 다음 내용을 입력한 후 「저장」을 클릭합니다:
- 컨테이너 마운트 경로:
/usr/local/datakit/conf.d/prom/prom-egressgateway.conf - 하위 경로:
prom-egressgateway.conf
3.5 Zipkin 수집기 활성화
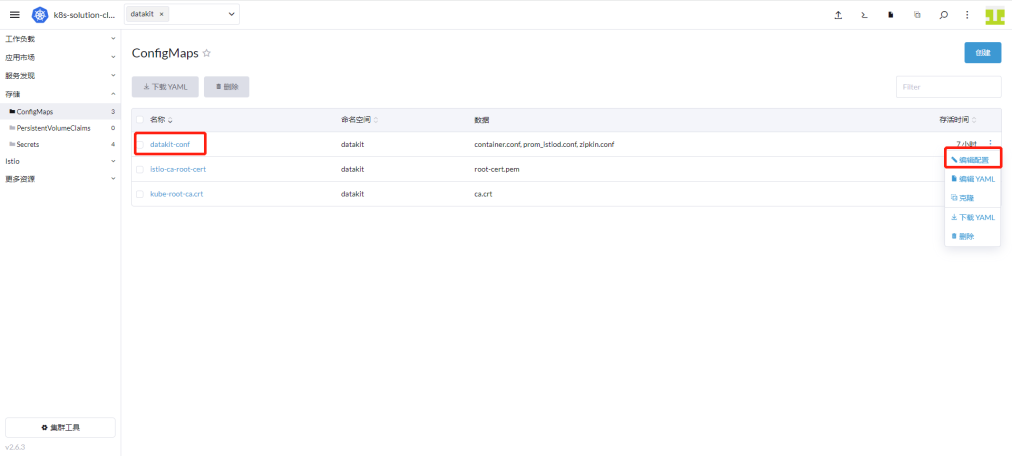
「Rancher」에 로그인 → 「클러스터」 → 「스토리지」 → 「ConfigMaps」로 이동하여 datakit-conf를 찾아 「구성 편집」을 클릭합니다.
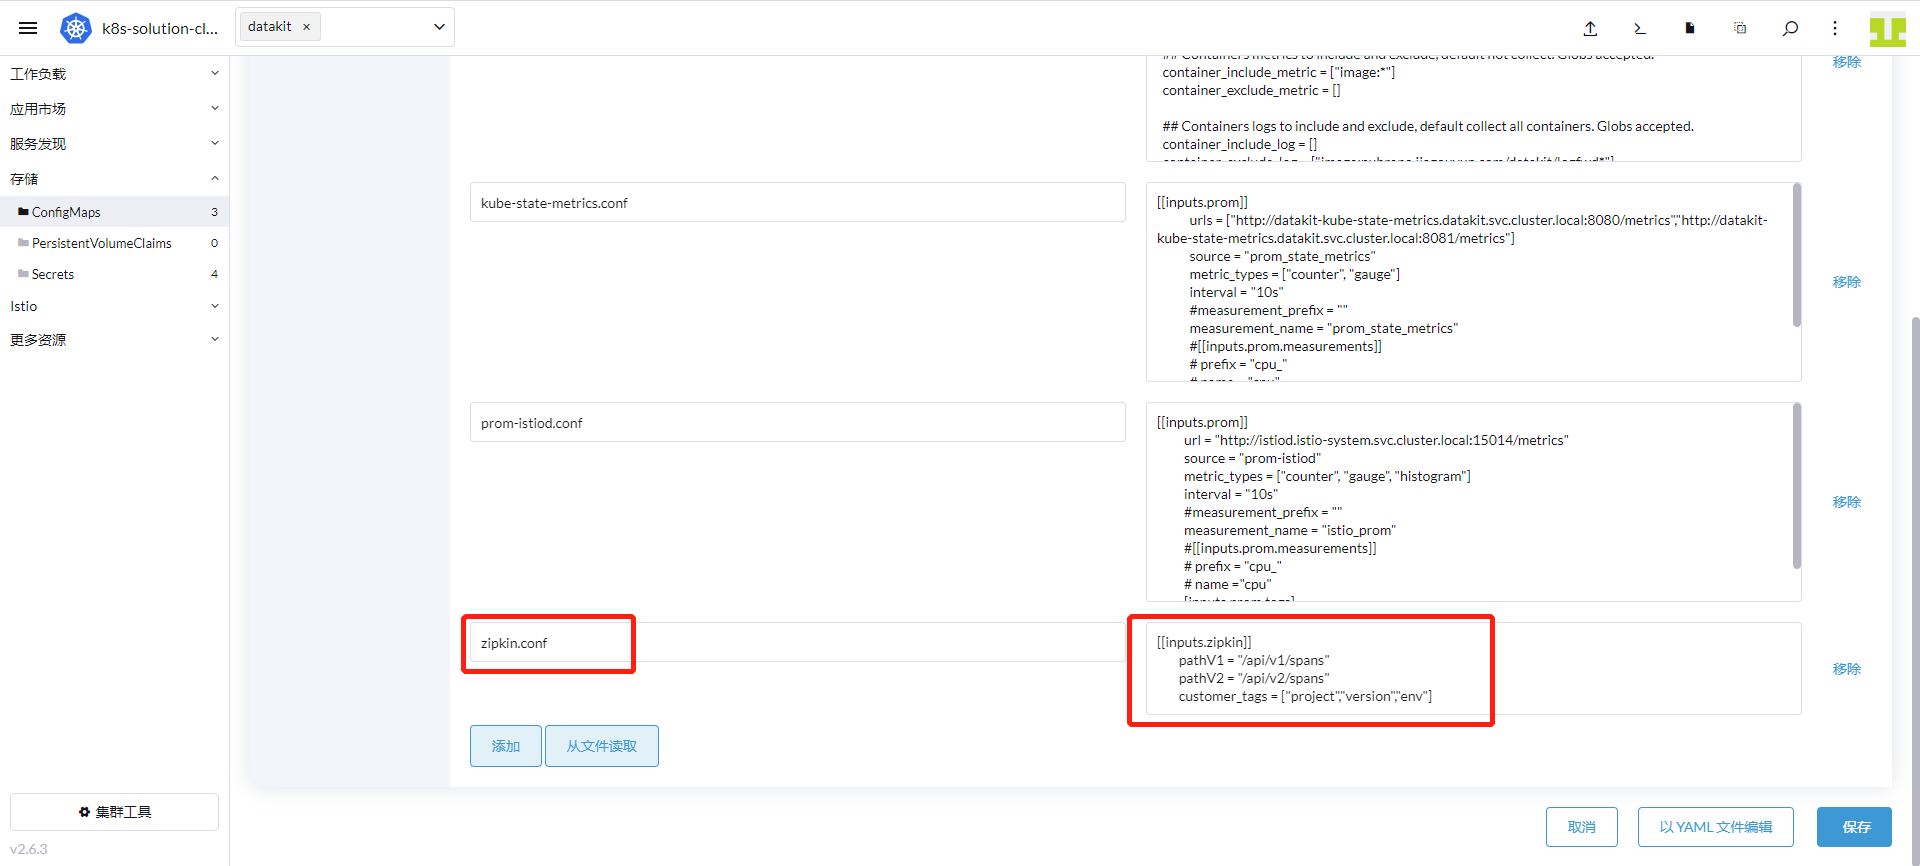
「추가」를 클릭하고 키에 「zipkin.conf」를 입력한 후 값에 다음 내용을 입력합니다. 「저장」을 클릭합니다.
      [[inputs.zipkin]]
        pathV1 = "/api/v1/spans"
        pathV2 = "/api/v2/spans"
        customer_tags = ["project","version","env"]
「클러스터」 → 「워크로드」 → 「DaemonSets」로 이동하여 datakit 행 오른쪽을 클릭하고 「구성 편집」을 선택합니다. 「스토리지」를 클릭하고 볼륨 이름이 “datakit-conf”인 ConfigMap을 찾아 「추가」를 클릭한 후 다음 내용을 입력하고 「저장」을 클릭합니다:
- 컨테이너 마운트 경로:
/usr/local/datakit/conf.d/zipkin/zipkin.conf - 하위 경로:
zipkin.conf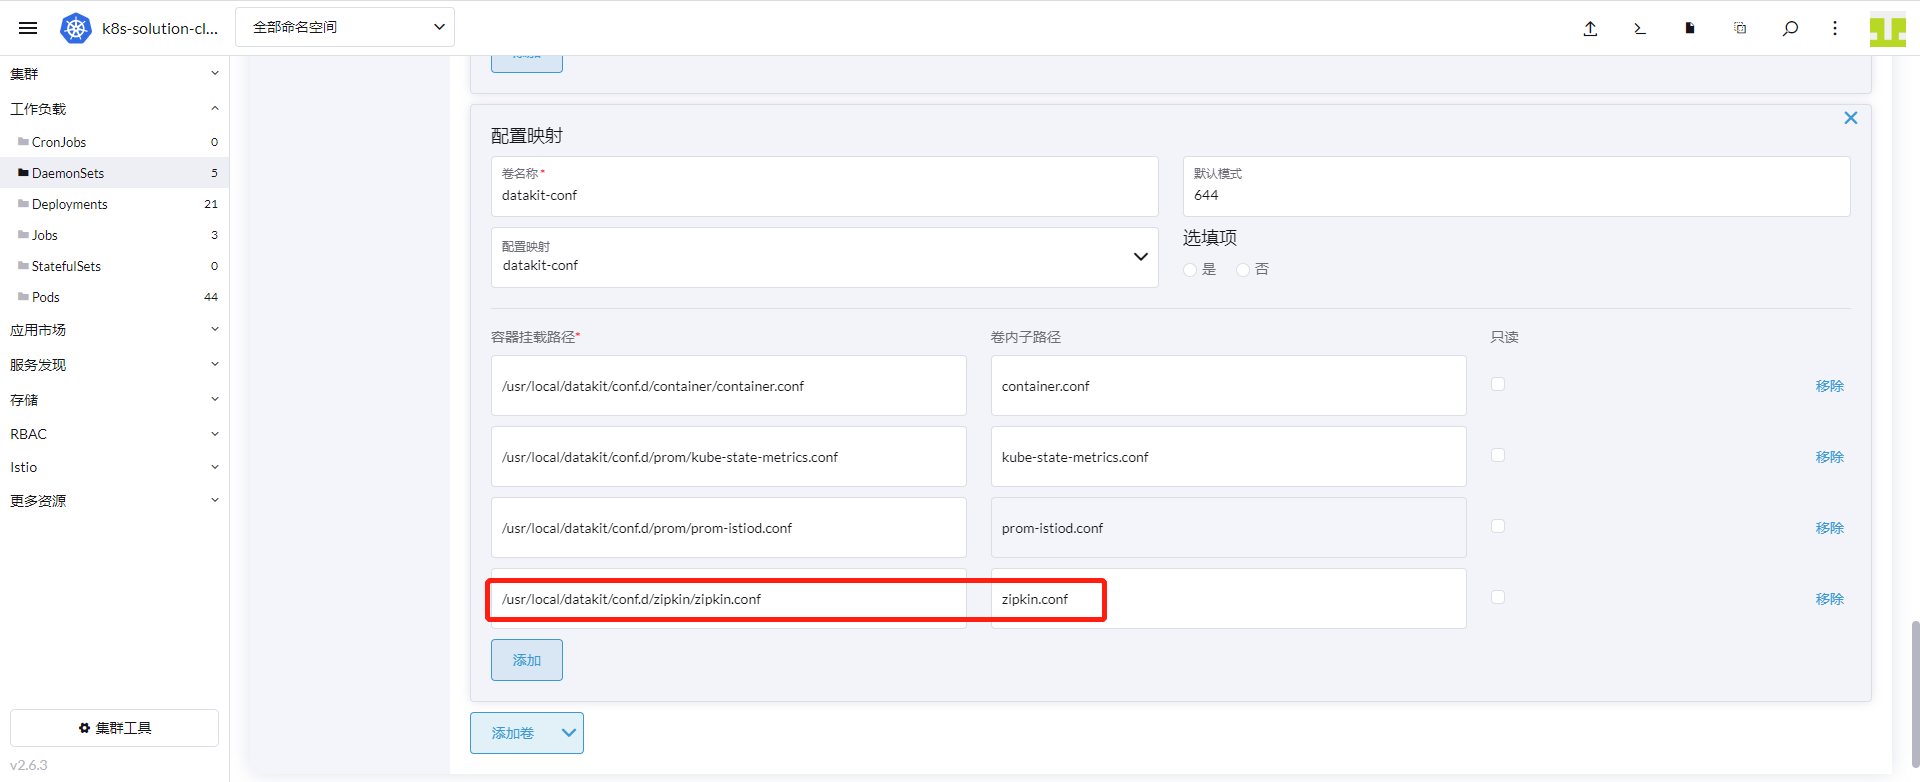
3.6 DataKit 서비스 매핑
Kubernets 클러스터에서 DataKit을 DaemonSet 방식으로 배포한 후, 특정 애플리케이션이 이전에 istio-system 네임스페이스의 zipkin 서비스(포트 9411)로 트레이스 데이터를 전송하도록 구성되어 있고 접근 주소가 zipkin.istio-system.svc.cluster.local:9411인 경우, Kubernetes의 ExternalName 서비스 유형을 사용해야 할 수 있습니다.
먼저 ClusterIP 서비스 유형을 정의하여 9529 포트를 9411로 변환한 다음, ExternalName 서비스를 사용하여 ClusterIP 서비스를 DNS 이름으로 매핑합니다. 이 두 단계의 변환을 통해 애플리케이션이 DataKit과 통신할 수 있게 됩니다.
- Cluster IP 서비스 정의
「Rancher」에 로그인 → 「클러스터」 → 「서비스 디스커버리」 → 「Service」로 이동하여 「생성」을 클릭하고 「클러스터 IP」를 선택합니다.
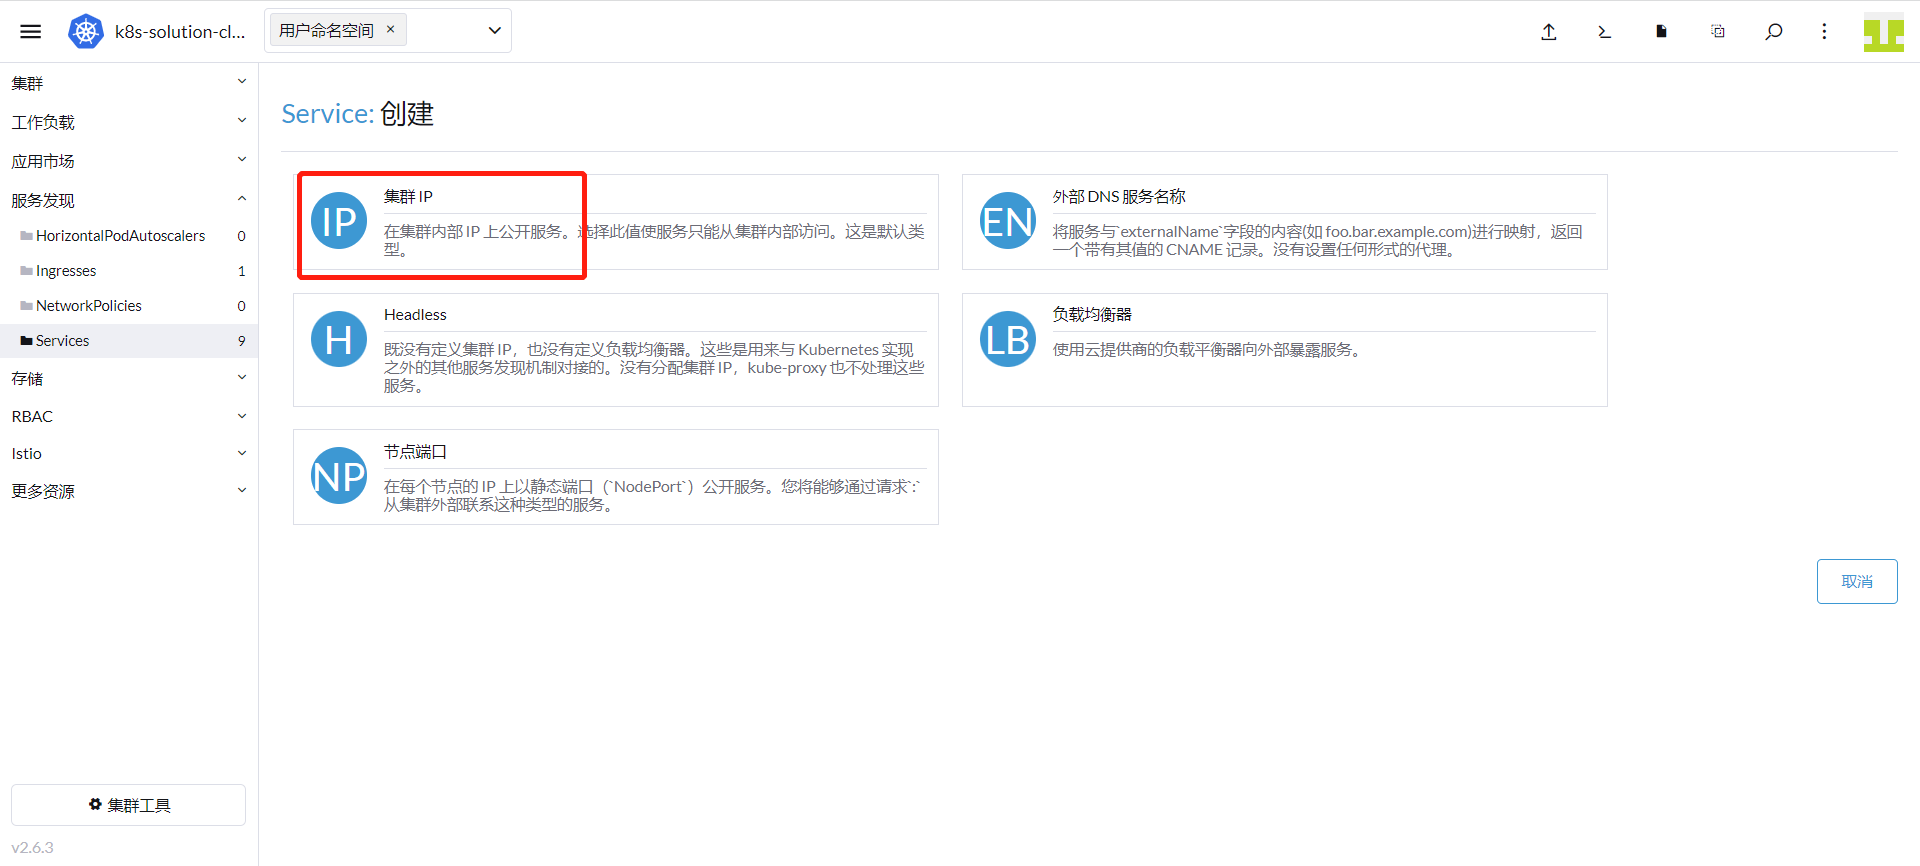
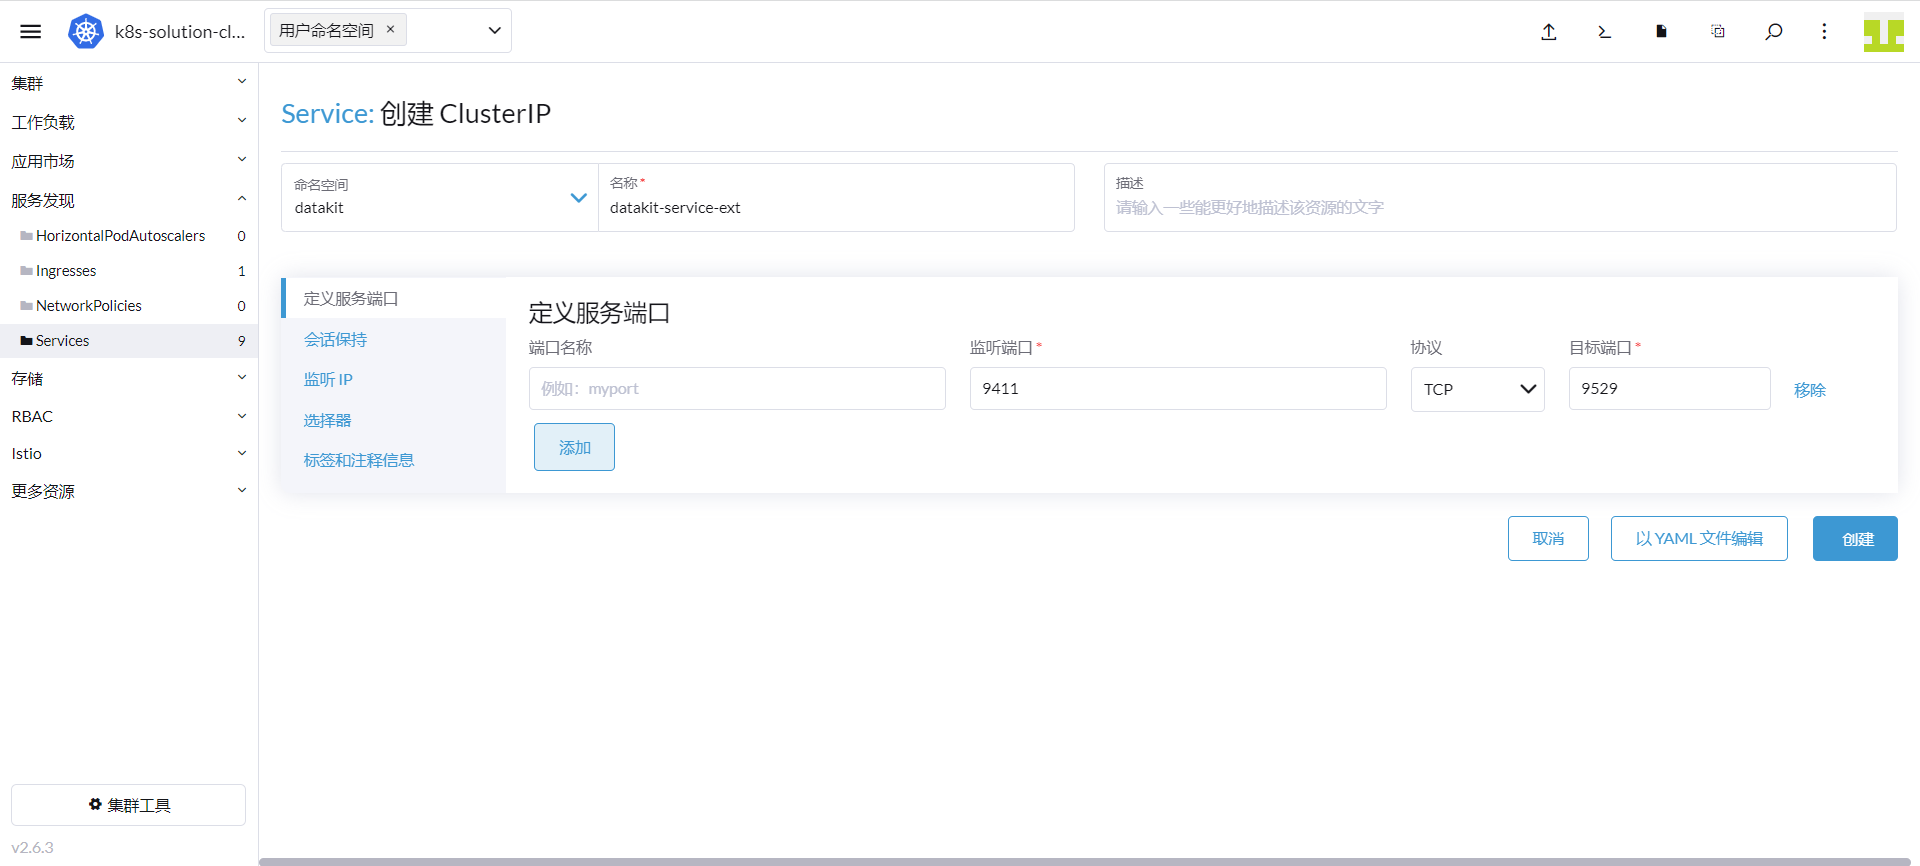
네임스페이스에 「datakit」를 입력하고 이름에 「datakit-service-ext」를 입력합니다. 리스닝 포트에 「9411」을 입력하고 대상 포트에 「9529」를 입력합니다.
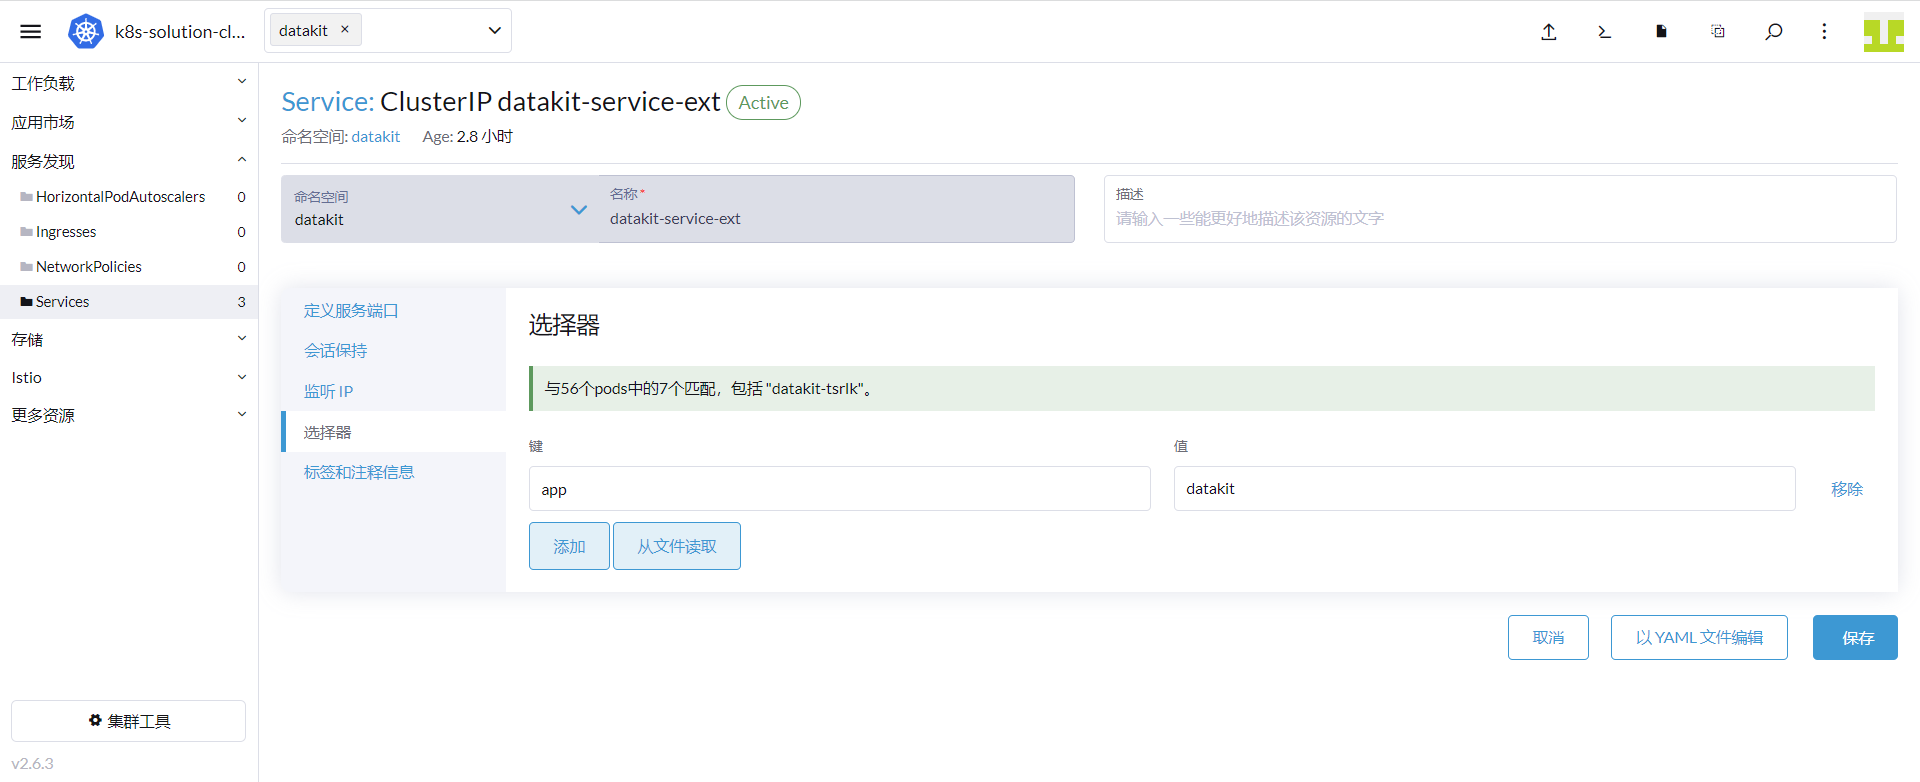
「선택기」를 클릭하고 키에 「app」을 입력하고 값에 「datakit」를 입력한 후 「저장」을 클릭합니다.
- ExternalName 서비스 정의
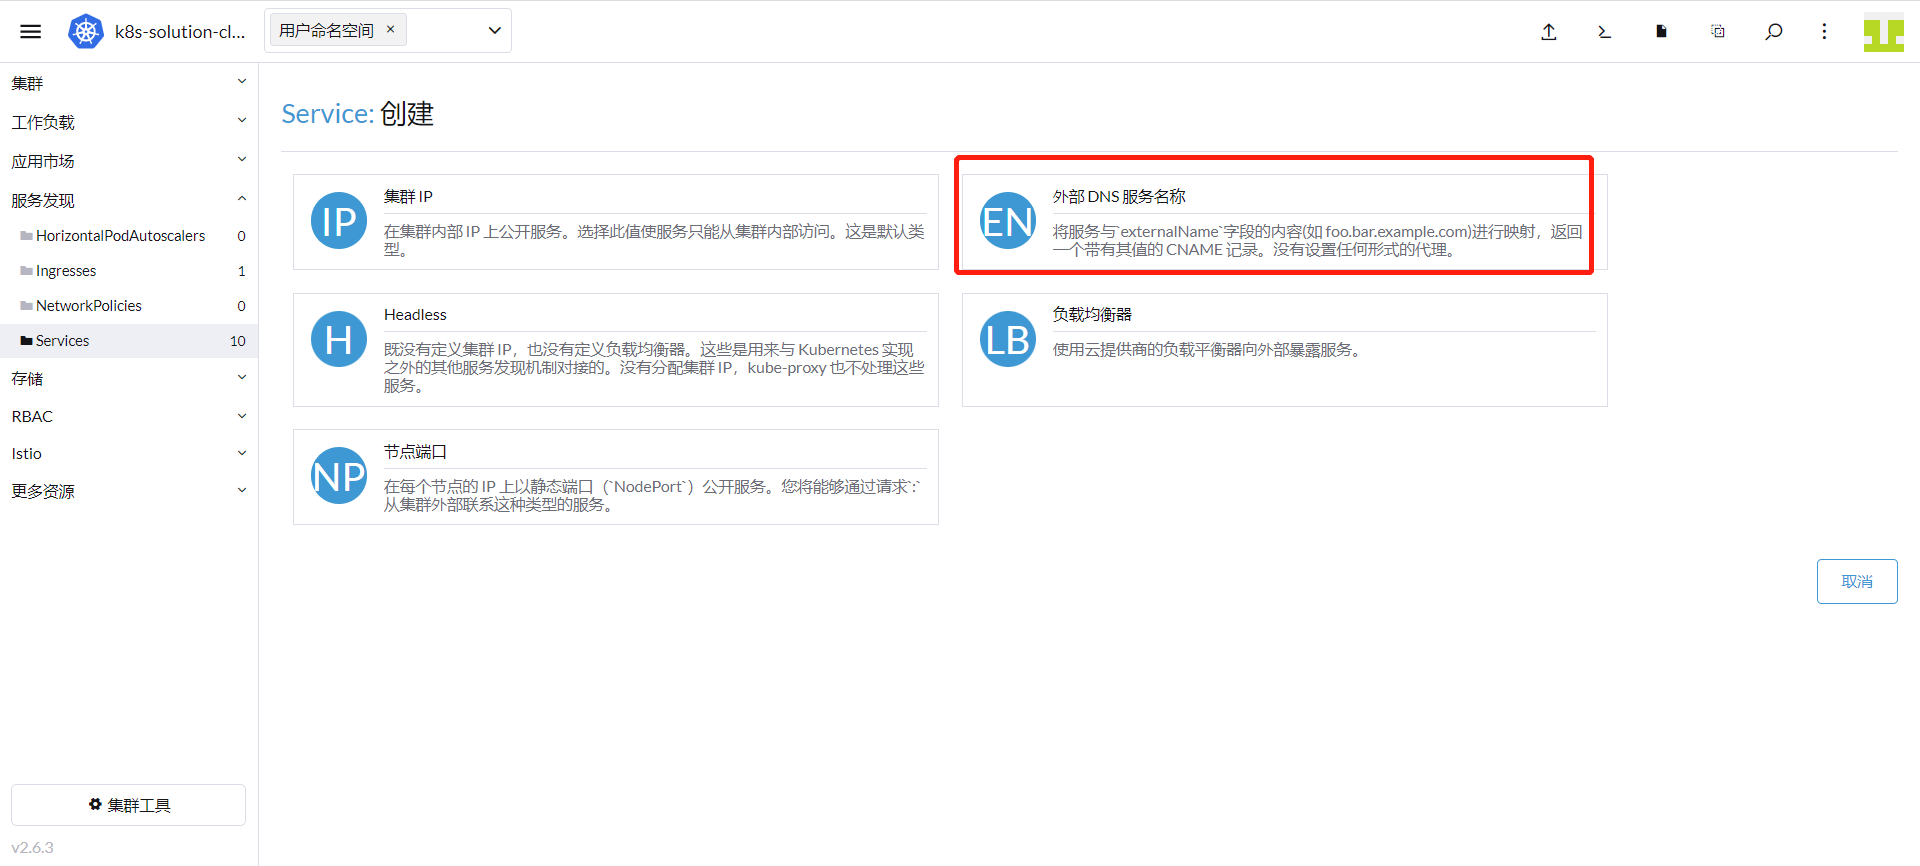
「클러스터」 → 「서비스 디스커버리」 → 「Service」로 이동하여 「생성」을 클릭하고 「외부 DNS 서비스 이름」을 선택합니다.
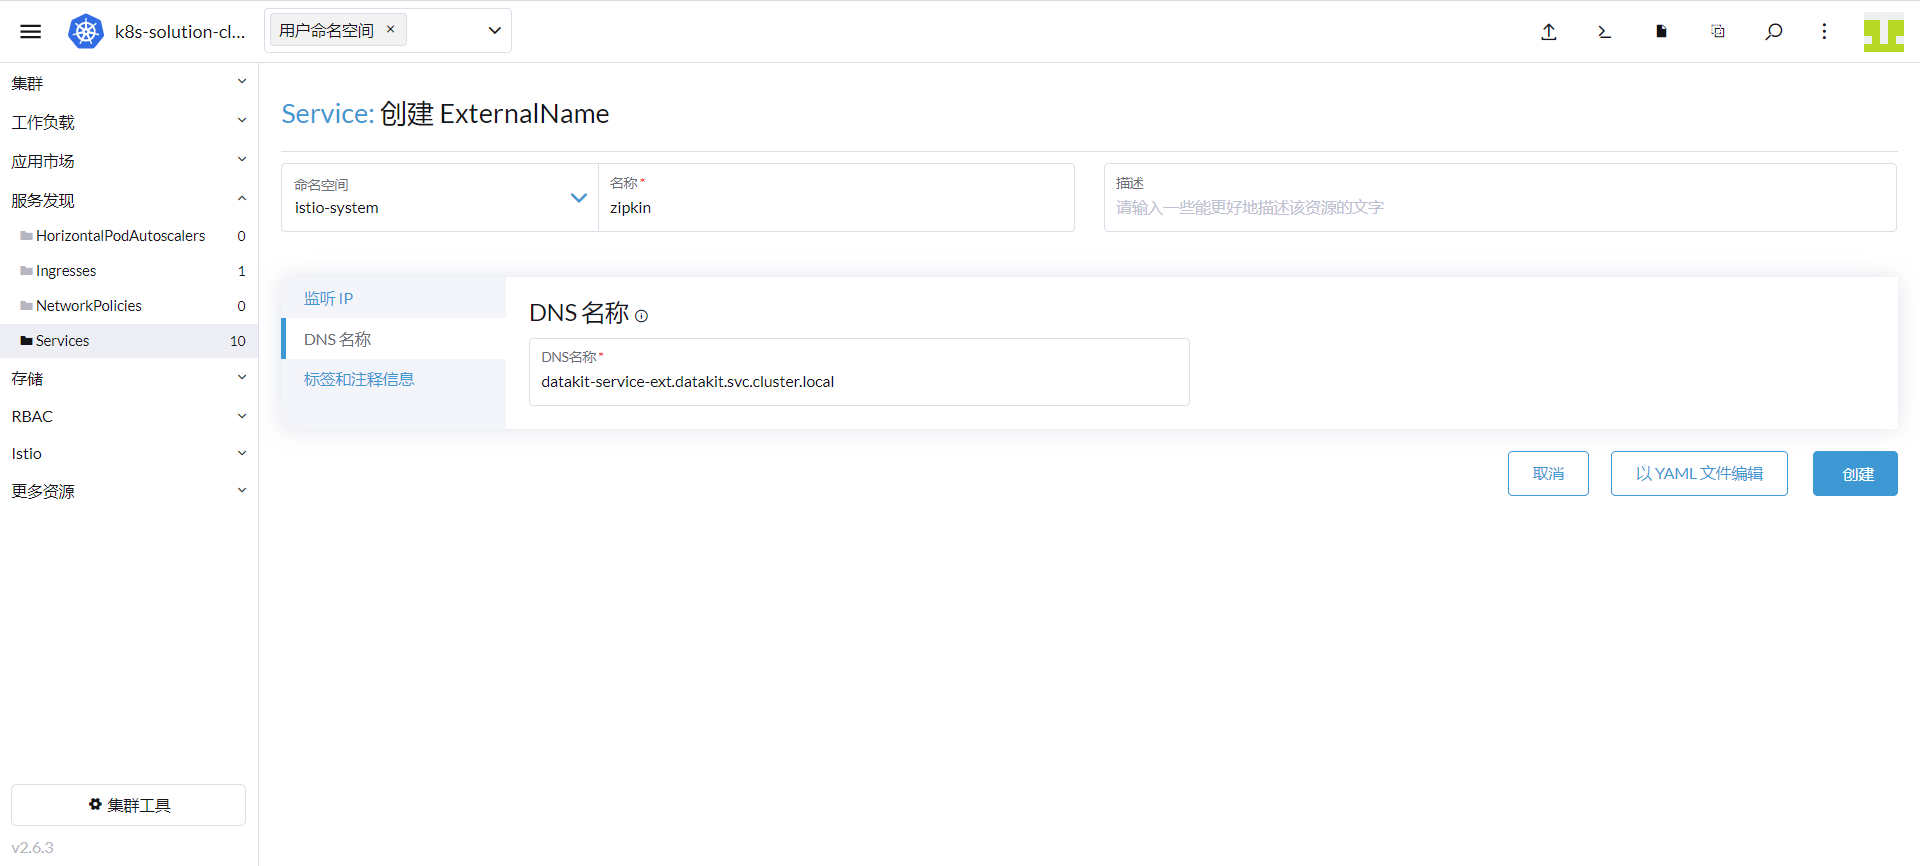
네임스페이스에 「istio-system」을 입력하고 이름에 「zipkin」을 입력합니다. DNS 이름에 「datakit-service-ext.datakit.svc.cluster.local」을 입력한 후 「생성」을 클릭합니다.
3.7 Gateway 리소스 생성
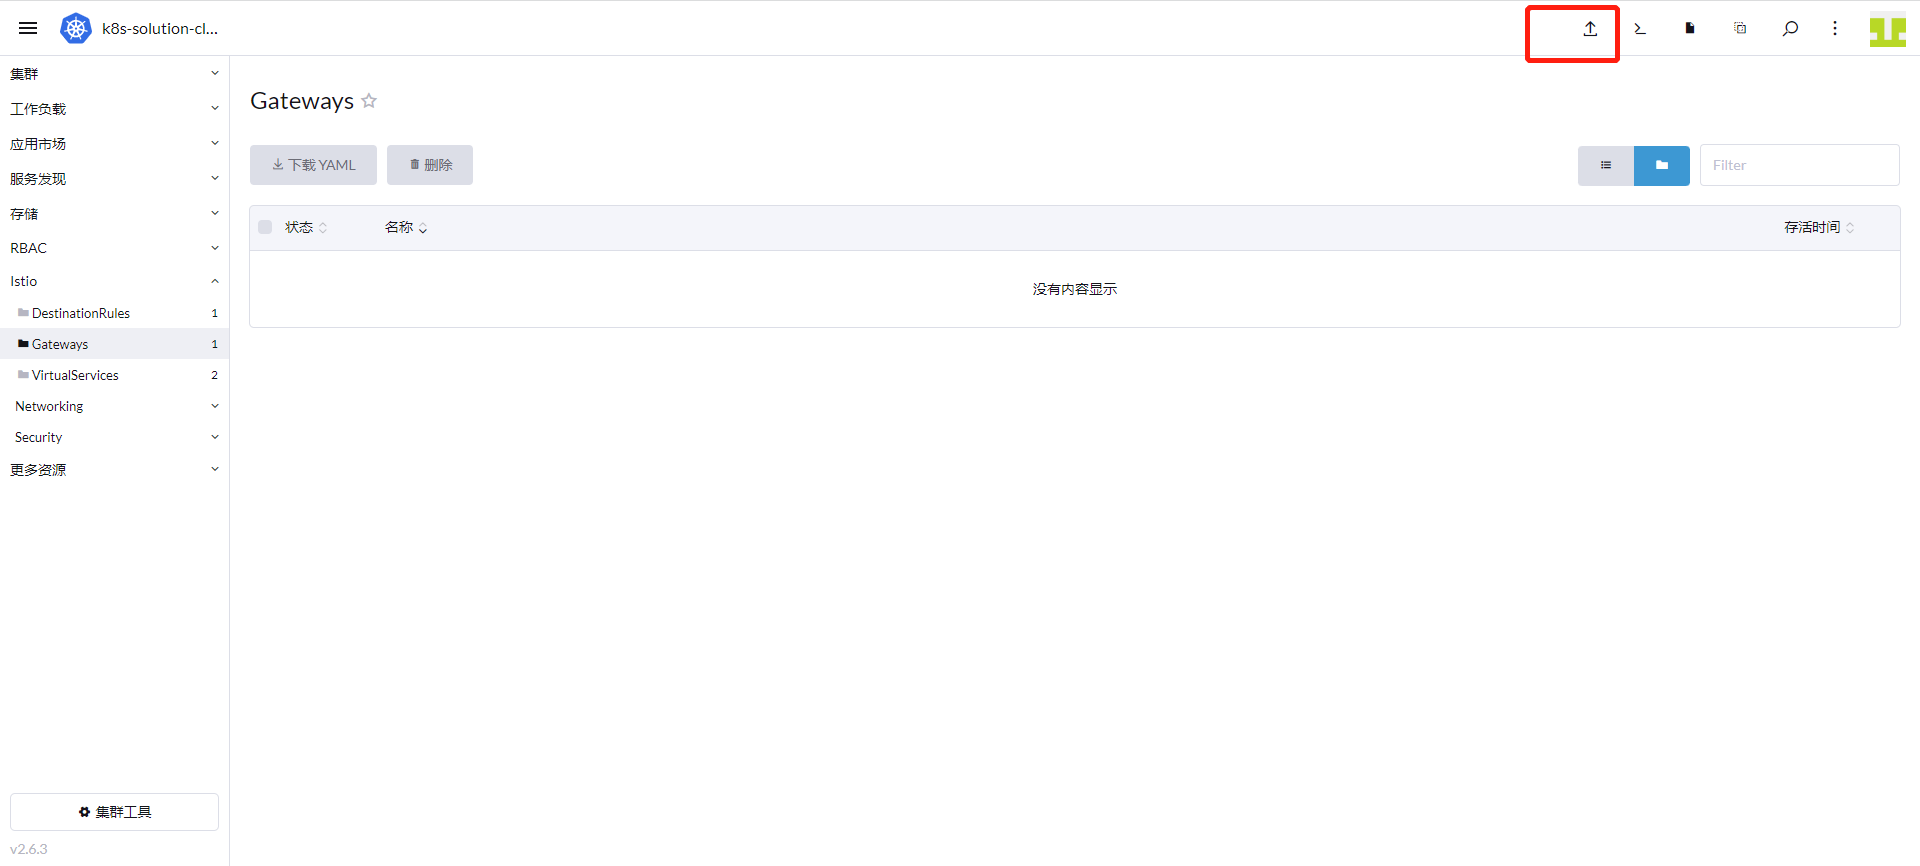
「Rancher」에 로그인 → 「클러스터」 → 「Istio」 → 「Gateways」로 이동하여 상단의 「YAML 가져오기」 아이콘을 클릭합니다.
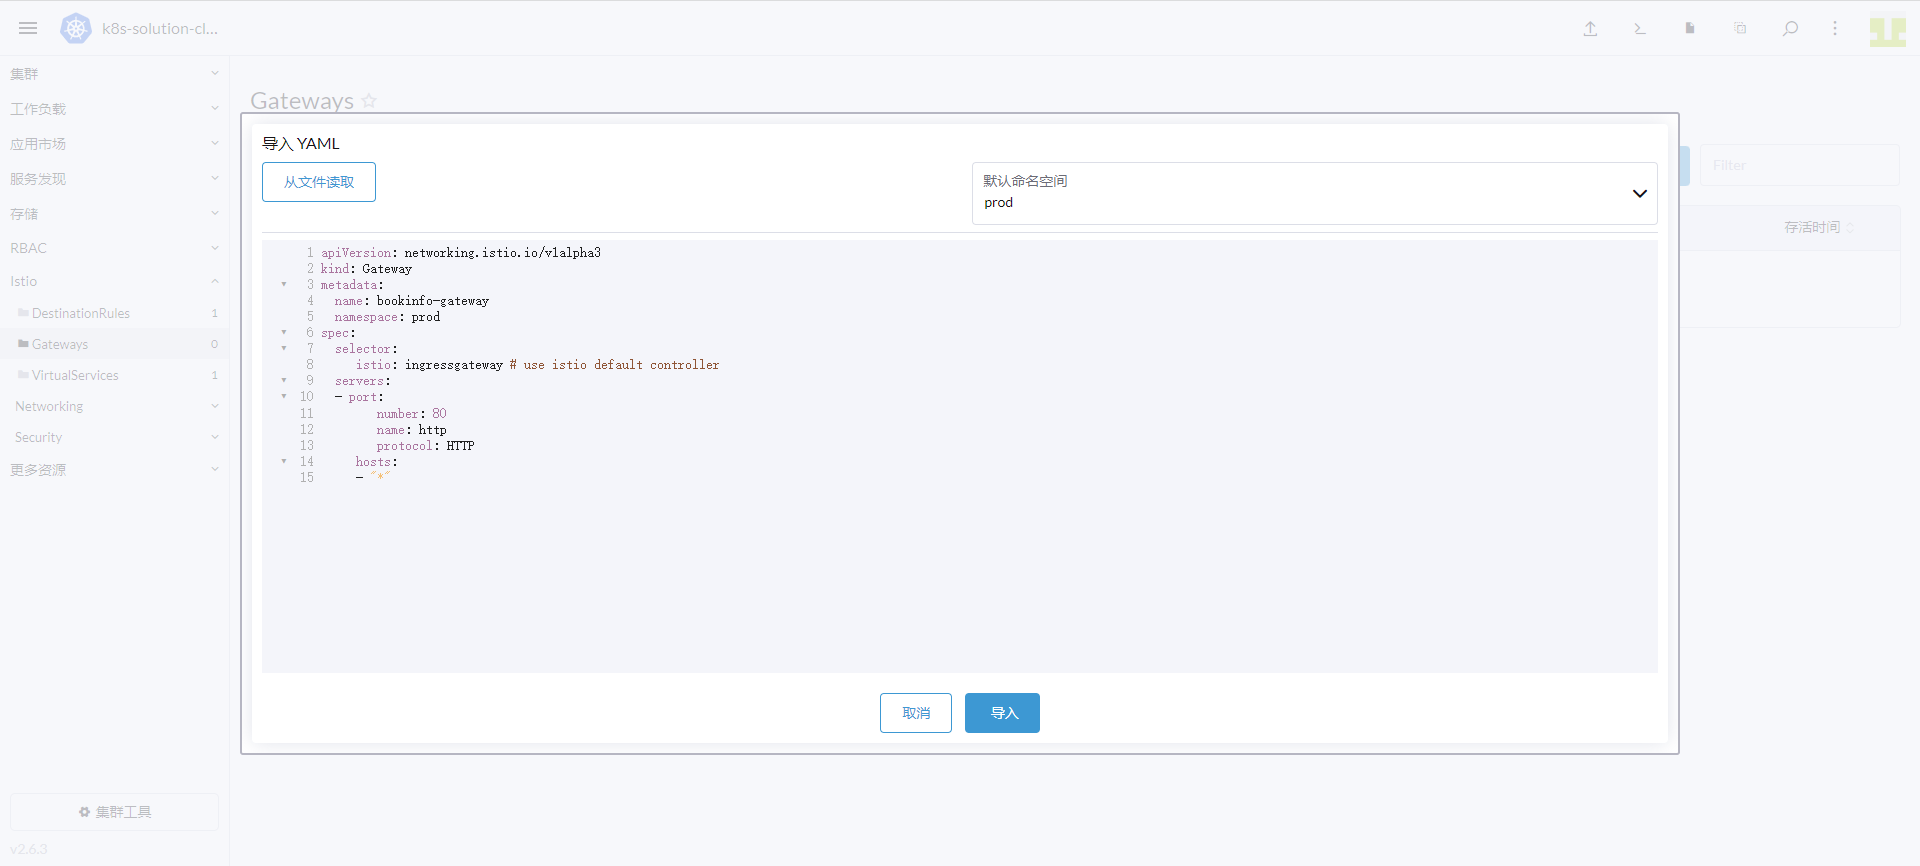
네임스페이스에 「prod」를 입력하고 다음 내용을 입력한 후 「가져오기」를 클릭합니다.
apiVersion: networking.istio.io/v1alpha3
kind: Gateway
metadata:
  name: bookinfo-gateway
  namespace: prod
spec:
  selector:
    istio: ingressgateway # use istio default controller
  servers:
    - port:
        number: 80
        name: http
        protocol: HTTP
      hosts:
        - "*"
3.8 가상 서비스 생성
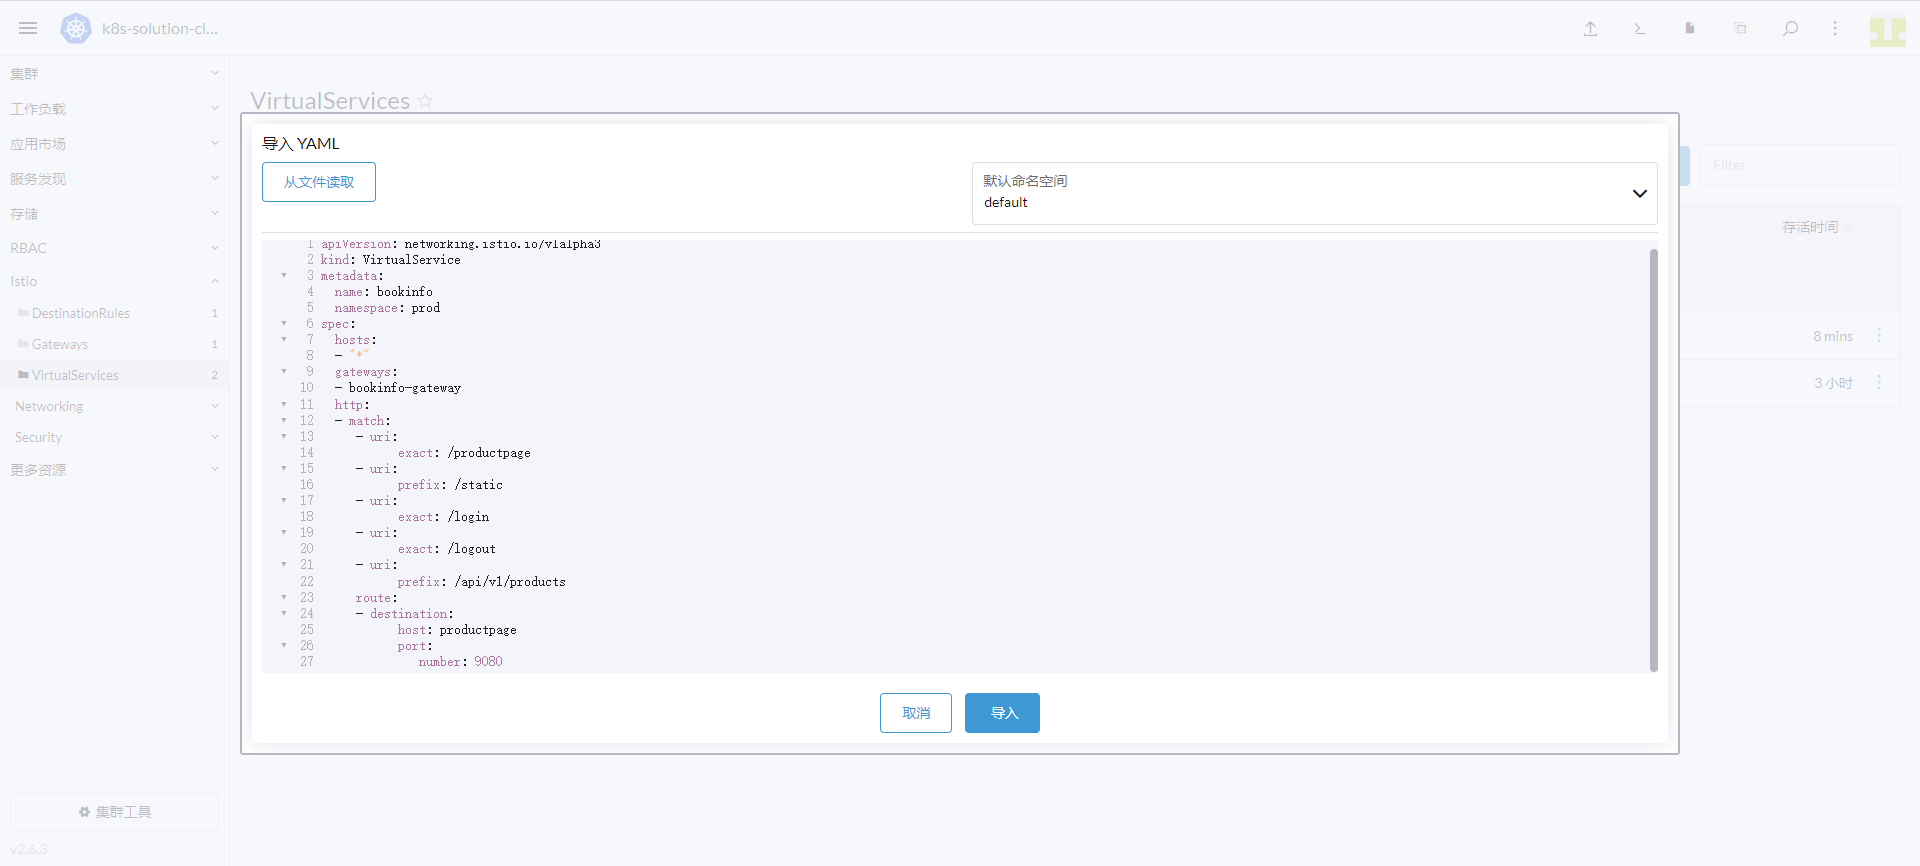
「Rancher」에 로그인 → 「클러스터」 → 「Istio」 → 「VirtualServices」로 이동하여 상단의 「YAML 가져오기」 아이콘을 클릭합니다.
네임스페이스에 「prod」를 입력하고 다음 내용을 입력한 후 「가져오기」를 클릭합니다.
apiVersion: networking.istio.io/v1alpha3
kind: VirtualService
metadata:
  name: bookinfo
  namespace: prod
spec:
  hosts:
    - "*"
  gateways:
    - bookinfo-gateway
  http:
    - match:
        - uri:
            exact: /productpage
        - uri:
            prefix: /static
        - uri:
            exact: /login
        - uri:
            exact: /logout
        - uri:
            prefix: /api/v1/products
      route:
        - destination:
            host: productpage
            port:
              number: 9080
3.9 productpage, details, ratings 생성
여기서는 Pod에 annotations을 추가하여 Pod의 메트릭을 수집합니다. 추가할 내용은 다음과 같습니다.
annotations:
  datakit/prom.instances: |
    [[inputs.prom]]
      url = "http://$IP:15020/stats/prometheus"
      source = "bookinfo-istio-product"
      metric_types = ["counter", "gauge"]
      interval = "60s"
      tags_ignore = ["cache","cluster_type","component","destination_app","destination_canonical_revision","destination_canonical_service","destination_cluster","destination_principal","group","grpc_code","grpc_method","grpc_service","grpc_type","reason","request_protocol","request_type","resource","responce_code_class","response_flags","source_app","source_canonical_revision","source_canonical-service","source_cluster","source_principal","source_version","wasm_filter"]
      metric_name_filter = ["istio_requests_total","pilot_k8s_cfg_events","istio_build","process_virtual_memory_bytes","process_resident_memory_bytes","process_cpu_seconds_total","envoy_cluster_assignment_stale","go_goroutines","pilot_xds_pushes","pilot_proxy_convergence_time_bucket","citadel_server_root_cert_expiry_timestamp","pilot_conflict_inbound_listener","pilot_conflict_outbound_listener_http_over_current_tcp","pilot_conflict_outbound_listener_tcp_over_current_tcp","pilot_conflict_outbound_listener_tcp_over_current_http","pilot_virt_services","galley_validation_failed","pilot_services","envoy_cluster_upstream_cx_total","envoy_cluster_upstream_cx_connect_fail","envoy_cluster_upstream_cx_active","envoy_cluster_upstream_cx_rx_bytes_total","envoy_cluster_upstream_cx_tx_bytes_total","istio_request_duration_milliseconds_bucket","istio_request_duration_seconds_bucket","istio_request_bytes_bucket","istio_response_bytes_bucket"]
      #measurement_prefix = ""
      measurement_name = "istio_prom"
      #[[inputs.prom.measurements]]
      # prefix = "cpu_"
      # name = "cpu"
      [inputs.prom.tags]
      namespace = "$NAMESPACE"
  proxy.istio.io/config: |
    tracing:
      zipkin:
        address: zipkin.istio-system:9411
      custom_tags:
        project:
          literal:
            value: "productpage"
        version:
          literal:
            value: "v1"
        env:
          literal:
            value: "test"
매개변수 설명
- url: Exporter 주소
- source: 수집기 이름
- metric_types: 메트릭 유형 필터
- measurement_name: 수집 후 메저먼트 이름
- interval: 메트릭 수집 주기, s 초
- $IP: Pod의 내부 IP 와일드카드
- $NAMESPACE: Pod가 속한 네임스페이스
- tags_ignore: 무시할 태그
다음은 productpage, details, ratings의 전체 배포 파일입니다.
전체 배포 파일
##################################################################################################
# Details service
##################################################################################################
apiVersion: v1
kind: Service
metadata:
  name: details
  namespace: prod
  labels:
    app: details
    service: details
spec:
  ports:
  - port: 9080
    name: http
  selector:
    app: details
---
apiVersion: v1
kind: ServiceAccount
metadata:
  name: bookinfo-details
  namespace: prod
  labels:
    account: details
---
apiVersion: apps/v1
kind: Deployment
metadata:
  name: details-v1
  namespace: prod
  labels:
    app: details
    version: v1
spec:
  replicas: 1
  selector:
    matchLabels:
      app: details
      version: v1
  template:
    metadata:
      labels:
        app: details
        version: v1
      annotations:
        datakit/prom.instances: |
          [[inputs.prom]]
            url = "http://$IP:15020/stats/prometheus"
            source = "bookinfo-istio-details"
            metric_types = ["counter", "gauge"]
            interval = "60s"
      tags_ignore = ["cache","cluster_type","component","destination_app","destination_canonical_revision","destination_canonical_service","destination_cluster","destination_principal","group","grpc_code","grpc_method","grpc_service","grpc_type","reason","request_protocol","request_type","resource","responce_code_class","response_flags","source_app","source_canonical_revision","source_canonical-service","source_cluster","source_principal","source_version","wasm_filter"]
            metric_name_filter = ["istio_requests_total","pilot_k8s_cfg_events","istio_build","process_virtual_memory_bytes","process_resident_memory_bytes","process_cpu_seconds_total","envoy_cluster_assignment_stale","go_goroutines","pilot_xds_pushes","pilot_proxy_convergence_time_bucket","citadel_server_root_cert_expiry_timestamp","pilot_conflict_inbound_listener","pilot_conflict_outbound_listener_http_over_current_tcp","pilot_conflict_outbound_listener_tcp_over_current_tcp","pilot_conflict_outbound_listener_tcp_over_current_http","pilot_virt_services","galley_validation_failed","pilot_services","envoy_cluster_upstream_cx_total","envoy_cluster_upstream_cx_connect_fail","envoy_cluster_upstream_cx_active","envoy_cluster_upstream_cx_rx_bytes_total","envoy_cluster_upstream_cx_tx_bytes_total","istio_request_duration_milliseconds_bucket","istio_request_duration_seconds_bucket","istio_request_bytes_bucket","istio_response_bytes_bucket"]
            #measurement_prefix = ""
            measurement_name = "istio_prom"
            #[[inputs.prom.measurements]]
            # prefix = "cpu_"
            # name = "cpu"
            [inputs.prom.tags]
            namespace = "$NAMESPACE"
        proxy.istio.io/config: |
          tracing:
            zipkin:
              address: zipkin.istio-system:9411
            custom_tags:
              project:
                literal:
                  value: "details"
              version:
                literal:
                  value: "v1"
              env:
                literal:
                  value: "test"
    spec:
      serviceAccountName: bookinfo-details
      containers:
      - name: details
        image: docker.io/istio/examples-bookinfo-details-v1:1.16.2
        imagePullPolicy: IfNotPresent
        ports:
        - containerPort: 9080
        securityContext:
          runAsUser: 1000
---
##################################################################################################
# Ratings service
##################################################################################################
apiVersion: v1
kind: Service
metadata:
  name: ratings
  namespace: prod
  labels:
    app: ratings
    service: ratings
spec:
  ports:
  - port: 9080
    name: http
  selector:
    app: ratings
---
apiVersion: v1
kind: ServiceAccount
metadata:
  name: bookinfo-ratings
  namespace: prod
  labels:
    account: ratings
---
apiVersion: apps/v1
kind: Deployment
metadata:
  name: ratings-v1
  namespace: prod
  labels:
    app: ratings
    version: v1
spec:
  replicas: 1
  selector:
    matchLabels:
      app: ratings
      version: v1
  template:
    metadata:
      labels:
        app: ratings
        version: v1
      annotations:
        datakit/prom.instances: |
          [[inputs.prom]]
            url = "http://$IP:15020/stats/prometheus"
            source = "bookinfo-istio-ratings"
            metric_types = ["counter", "gauge"]
            interval = "60s"
      tags_ignore = ["cache","cluster_type","component","destination_app","destination_canonical_revision","destination_canonical_service","destination_cluster","destination_principal","group","grpc_code","grpc_method","grpc_service","grpc_type","reason","request_protocol","request_type","resource","responce_code_class","response_flags","source_app","source_canonical_revision","source_canonical-service","source_cluster","source_principal","source_version","wasm_filter"]
            metric_name_filter = ["istio_requests_total","pilot_k8s_cfg_events","istio_build","process_virtual_memory_bytes","process_resident_memory_bytes","process_cpu_seconds_total","envoy_cluster_assignment_stale","go_goroutines","pilot_xds_pushes","pilot_proxy_convergence_time_bucket","citadel_server_root_cert_expiry_timestamp","pilot_conflict_inbound_listener","pilot_conflict_outbound_listener_http_over_current_tcp","pilot_conflict_outbound_listener_tcp_over_current_tcp","pilot_conflict_outbound_listener_tcp_over_current_http","pilot_virt_services","galley_validation_failed","pilot_services","envoy_cluster_upstream_cx_total","envoy_cluster_upstream_cx_connect_fail","envoy_cluster_upstream_cx_active","envoy_cluster_upstream_cx_rx_bytes_total","envoy_cluster_upstream_cx_tx_bytes_total","istio_request_duration_milliseconds_bucket","istio_request_duration_seconds_bucket","istio_request_bytes_bucket","istio_response_bytes_bucket"]
            #measurement_prefix = ""
            measurement_name = "istio_prom"
            #[[inputs.prom.measurements]]
            # prefix = "cpu_"
            # name = "cpu"
            [inputs.prom.tags]
            namespace = "$NAMESPACE"
        proxy.istio.io/config: |
          tracing:
            zipkin:
              address: zipkin.istio-system:9411
            custom_tags:
              project:
                literal:
                  value: "ratings"
              version:
                literal:
                  value: "v1"
              env:
                literal:
                  value: "test"
    spec:
      serviceAccountName: bookinfo-ratings
      containers:
      - name: ratings
        image: docker.io/istio/examples-bookinfo-ratings-v1:1.16.2
        imagePullPolicy: IfNotPresent
        ports:
        - containerPort: 9080
        securityContext:
          runAsUser: 1000
---
##################################################################################################
# Productpage services
##################################################################################################
apiVersion: v1
kind: Service
metadata:
  name: productpage
  namespace: prod
  labels:
    app: productpage
    service: productpage
spec:
  ports:
  - port: 9080
    name: http
  selector:
    app: productpage
---
apiVersion: v1
kind: ServiceAccount
metadata:
  name: bookinfo-productpage
  namespace: prod
  labels:
    account: productpage
---
apiVersion: apps/v1
kind: Deployment
metadata:
  name: productpage-v1
  namespace: prod
  labels:
    app: productpage
    version: v1
spec:
  replicas: 1
  selector:
    matchLabels:
      app: productpage
      version: v1
  template:
    metadata:
      labels:
        app: productpage
        version: v1
      annotations:
        datakit/prom.instances: |
          [[inputs.prom]]
            url = "http://$IP:15020/stats/prometheus"
            source = "bookinfo-istio-product"
            metric_types = ["counter", "gauge"]
            interval = "60s"
      tags_ignore = ["cache","cluster_type","component","destination_app","destination_canonical_revision","destination_canonical_service","destination_cluster","destination_principal","group","grpc_code","grpc_method","grpc_service","grpc_type","reason","request_protocol","request_type","resource","responce_code_class","response_flags","source_app","source_canonical_revision","source_canonical-service","source_cluster","source_principal","source_version","wasm_filter"]
            metric_name_filter = ["istio_requests_total","pilot_k8s_cfg_events","istio_build","process_virtual_memory_bytes","process_resident_memory_bytes","process_cpu_seconds_total","envoy_cluster_assignment_stale","go_goroutines","pilot_xds_pushes","pilot_proxy_convergence_time_bucket","citadel_server_root_cert_expiry_timestamp","pilot_conflict_inbound_listener","pilot_conflict_outbound_listener_http_over_current_tcp","pilot_conflict_outbound_listener_tcp_over_current_tcp","pilot_conflict_outbound_listener_tcp_over_current_http","pilot_virt_services","galley_validation_failed","pilot_services","envoy_cluster_upstream_cx_total","envoy_cluster_upstream_cx_connect_fail","envoy_cluster_upstream_cx_active","envoy_cluster_upstream_cx_rx_bytes_total","envoy_cluster_upstream_cx_tx_bytes_total","istio_request_duration_milliseconds_bucket","istio_request_duration_seconds_bucket","istio_request_bytes_bucket","istio_response_bytes_bucket"]
            #measurement_prefix = ""
            measurement_name = "istio_prom"
            #[[inputs.prom.measurements]]
            # prefix = "cpu_"
            # name = "cpu"
            [inputs.prom.tags]
            namespace = "$NAMESPACE"
        proxy.istio.io/config: |
          tracing:
            zipkin:
              address: zipkin.istio-system:9411
            custom_tags:
              project:
                literal:
                  value: "productpage"
              version:
                literal:
                  value: "v1"
              env:
                literal:
                  value: "test"
    spec:
      serviceAccountName: bookinfo-productpage
      containers:
      - name: productpage
        image: docker.io/istio/examples-bookinfo-productpage-v1:1.16.2
        imagePullPolicy: IfNotPresent
        ports:
        - containerPort: 9080
        volumeMounts:
        - name: tmp
          mountPath: /tmp
        securityContext:
          runAsUser: 1000
      volumes:
      - name: tmp
        emptyDir: {}
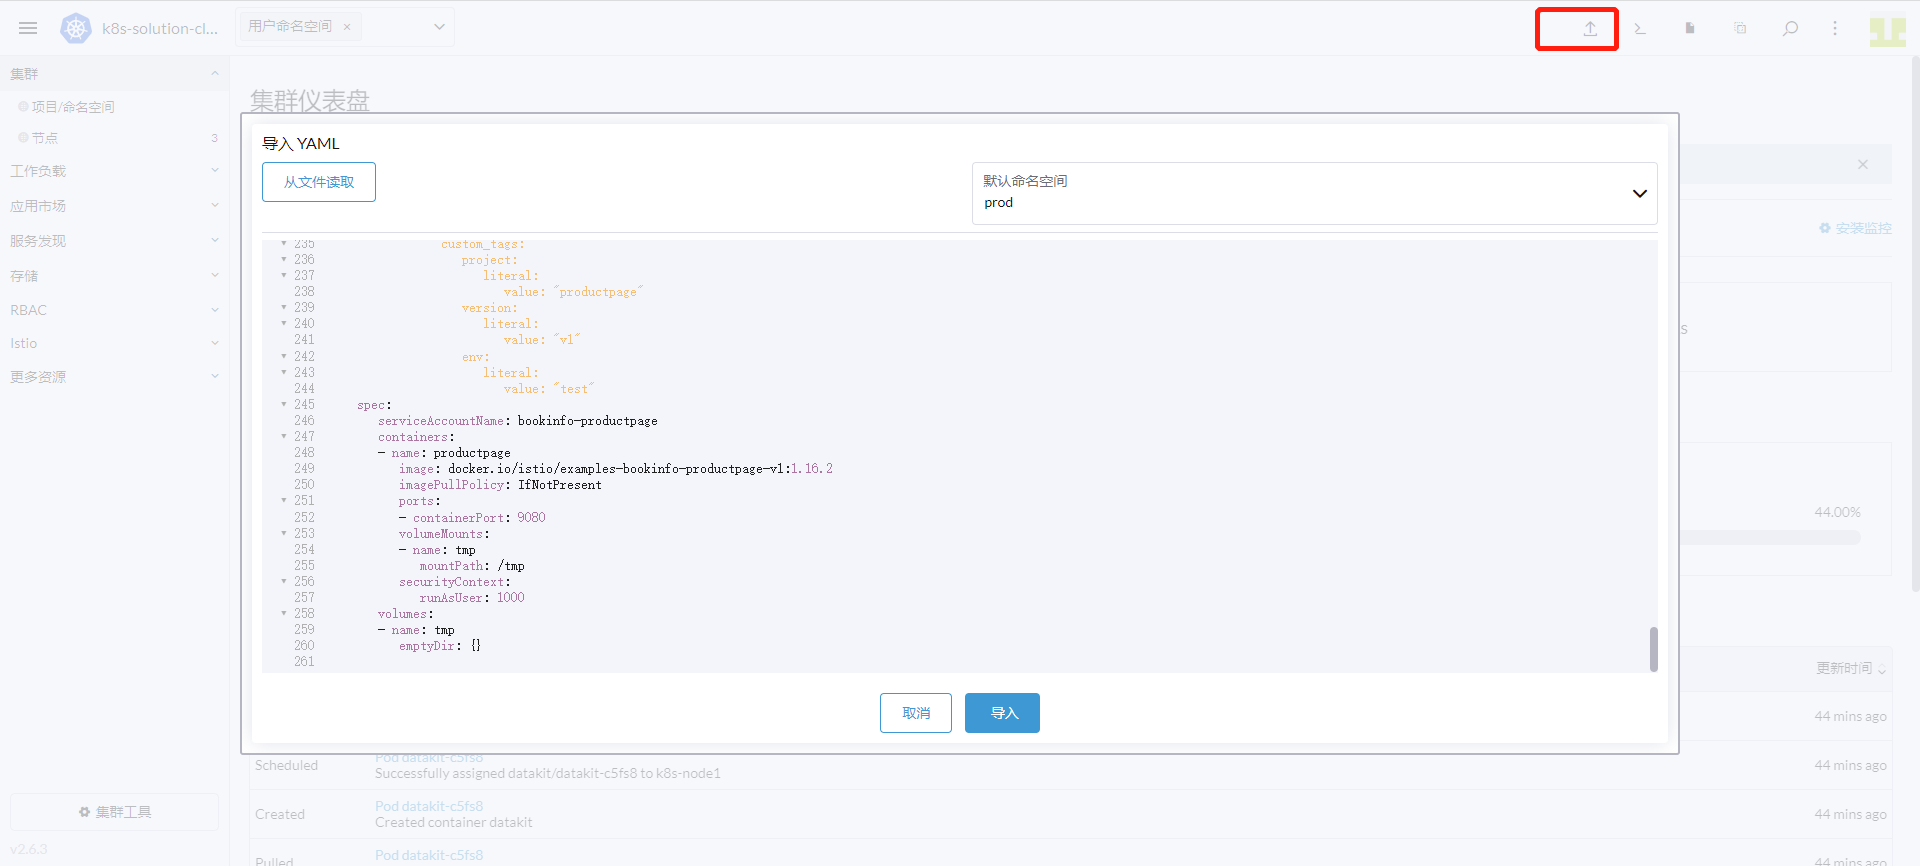
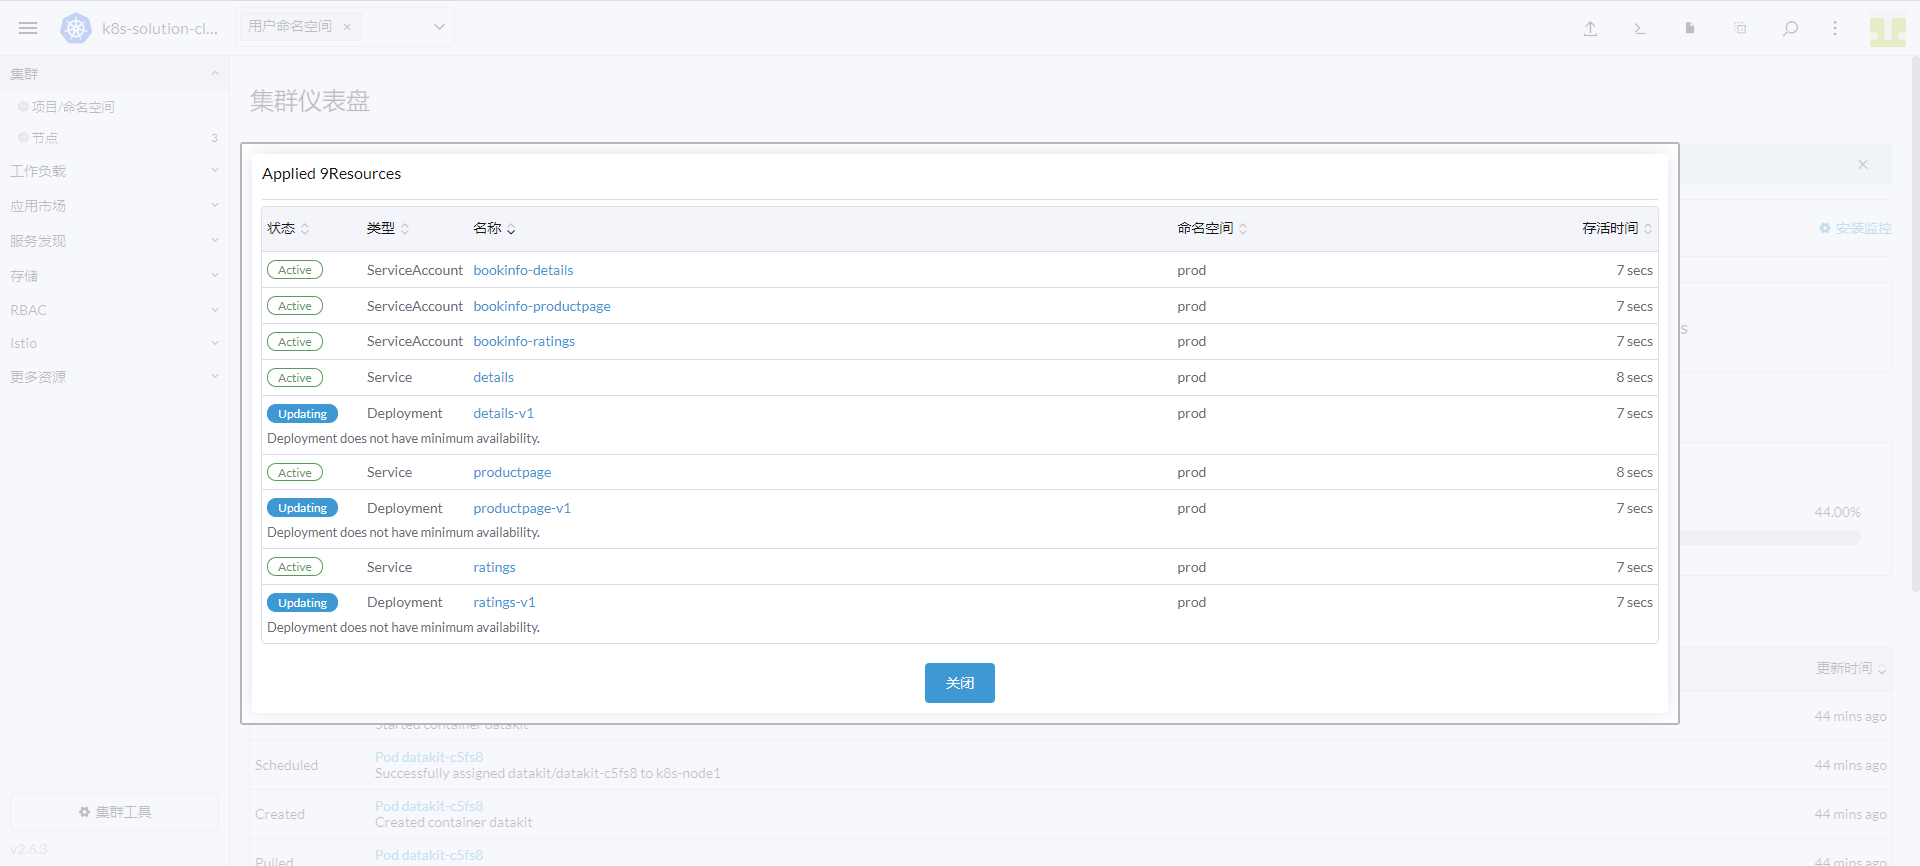
상단의 「YAML 가져오기」 아이콘을 클릭합니다. 네임스페이스에 「prod」를 입력하고 위 내용을 입력한 후 「가져오기」를 클릭합니다.
3.10 reviews 파이프라인 배포
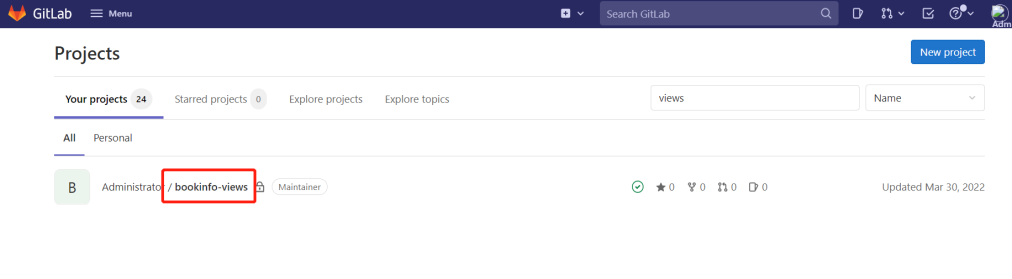
Gitlab에 로그인하여 bookinfo-views 프로젝트를 생성합니다.
gitlab 통합 문서를 참조하여 Gitlab과 DataKit을 연결합니다. 여기서는 Gitlab CI만 구성합니다.
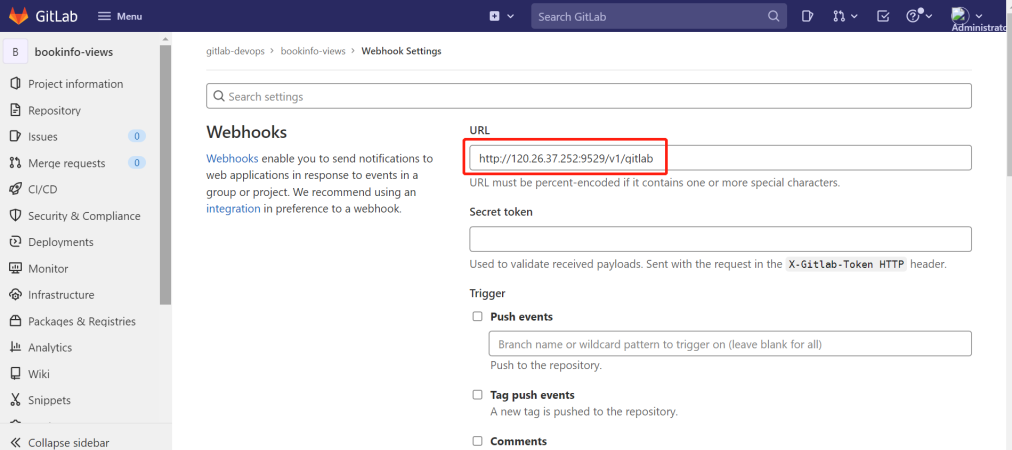
「Gitlab」에 로그인하여 「bookinfo-views」 → 「Settings」 → 「Webhooks」로 이동합니다. URL에 DataKit이 있는 호스트 IP와 DataKit의 9529 포트를 입력하고 /v1/gitlab을 추가합니다. 아래 그림과 같습니다:
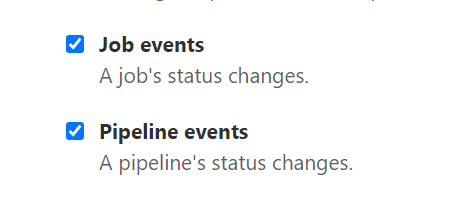
Job events 및 Pipeline events를 선택하고 Add webhook을 클릭합니다.
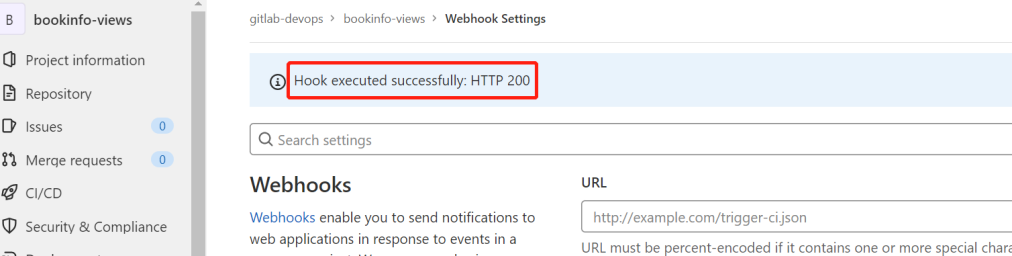
방금 생성한 Webhooks 오른쪽의 Test를 클릭하고 「Pipeline events」를 선택합니다. 아래 그림과 같이 HTTP 200이 표시되면 구성이 성공한 것입니다.
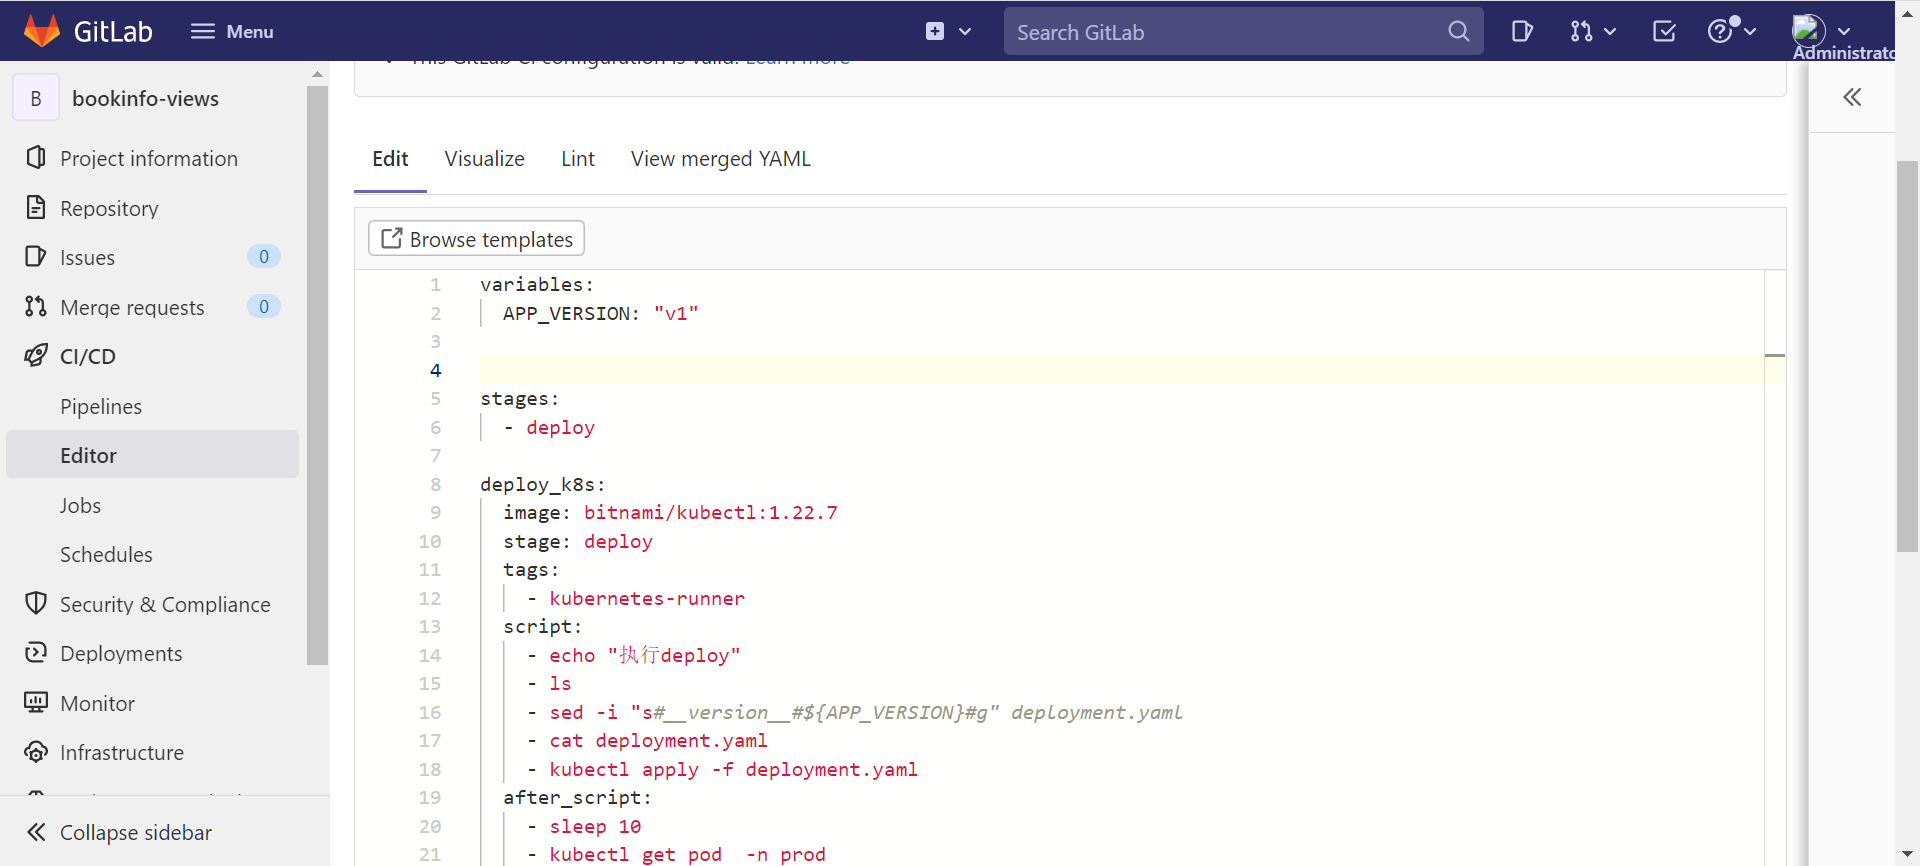
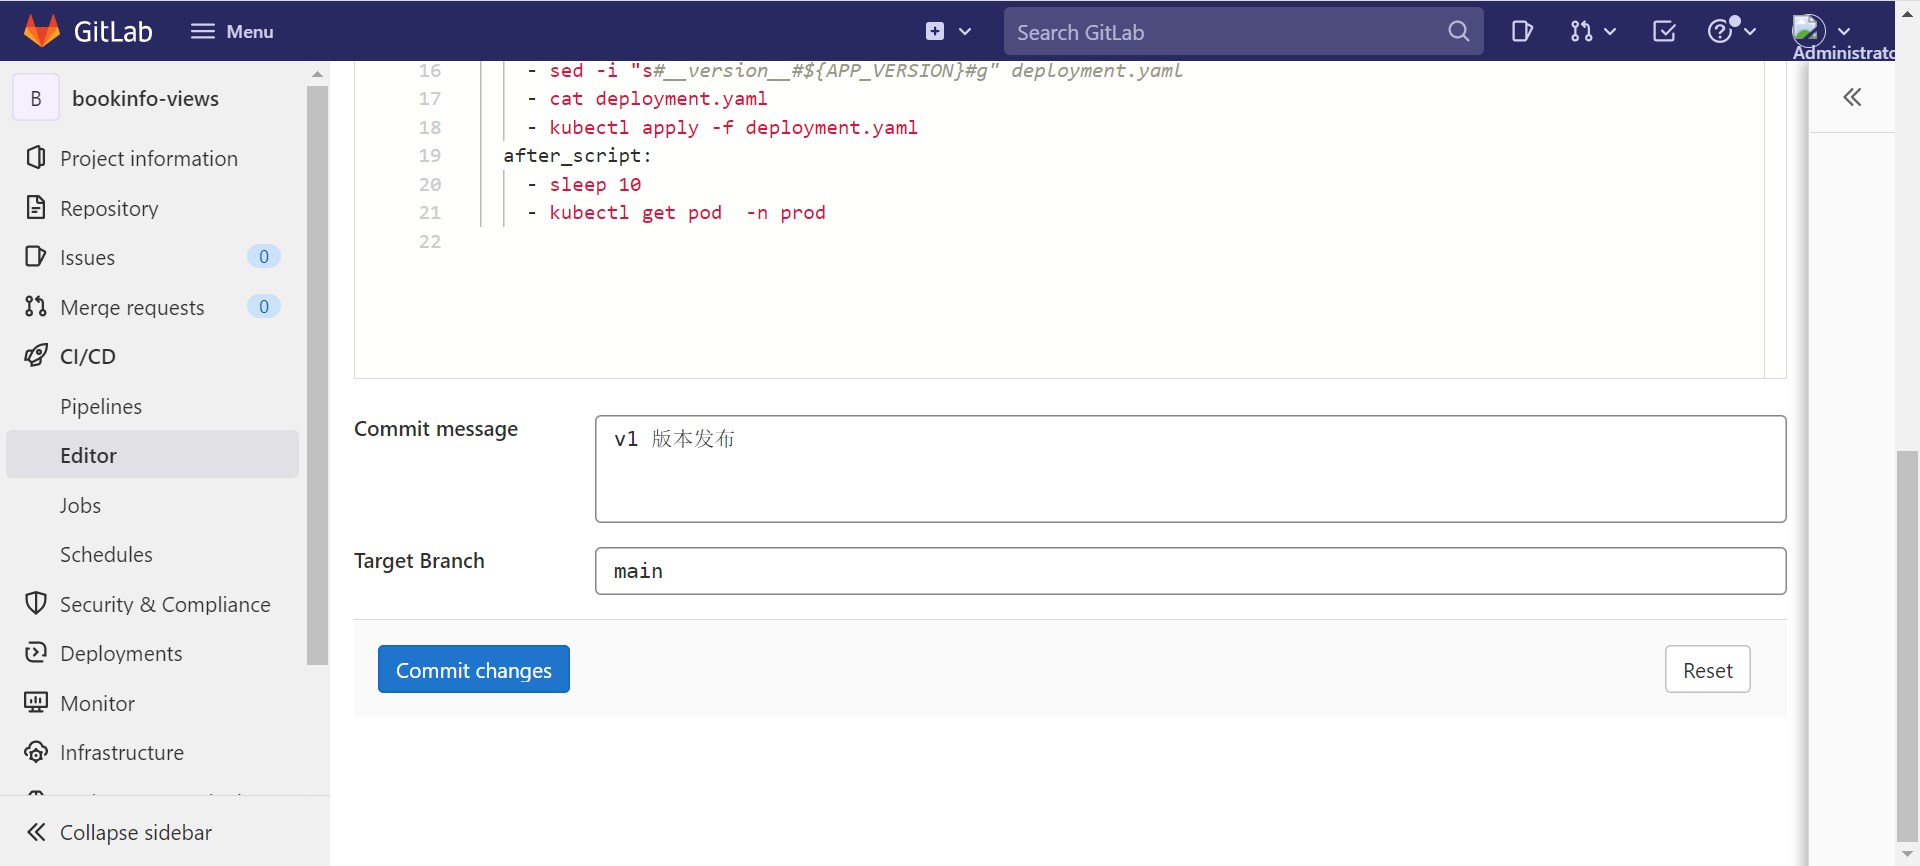
「bookinfo-views」 프로젝트로 이동하여 루트 디렉터리에 deployment.yaml 및 .gitlab-ci.yml 파일을 생성합니다. annotations에는 project, env, version 레이블이 정의되어 있어 프로젝트 및 버전을 구분하는 데 사용됩니다.
구성 파일
apiVersion: v1
kind: Service
metadata:
  name: reviews
  namespace: prod
  labels:
    app: reviews
    service: reviews
spec:
  ports:
    - port: 9080
      name: http
  selector:
    app: reviews
---
apiVersion: v1
kind: ServiceAccount
metadata:
  name: bookinfo-reviews
  namespace: prod
  labels:
    account: reviews
---
apiVersion: apps/v1
kind: Deployment
metadata:
  name: reviews-__version__
  namespace: prod
  labels:
    app: reviews
    version: __version__
spec:
  replicas: 1
  selector:
    matchLabels:
      app: reviews
      version: __version__
  template:
    metadata:
      labels:
        app: reviews
        version: __version__
      annotations:
        datakit/prom.instances: |
          [[inputs.prom]]
            url = "http://$IP:15020/stats/prometheus"
            source = "bookinfo-istio-review"
            metric_types = ["counter", "gauge"]
            interval = "60s"
            tags_ignore = ["cache","cluster_type","component","destination_app","destination_canonical_revision","destination_canonical_service","destination_cluster","destination_principal","group","grpc_code","grpc_method","grpc_service","grpc_type","reason","request_protocol","request_type","resource","responce_code_class","response_flags","source_app","source_canonical_revision","source_canonical-service","source_cluster","source_principal","source_version","wasm_filter"]
            metric_name_filter = ["istio_requests_total","pilot_k8s_cfg_events","istio_build","process_virtual_memory_bytes","process_resident_memory_bytes","process_cpu_seconds_total","envoy_cluster_assignment_stale","go_goroutines","pilot_xds_pushes","pilot_proxy_convergence_time_bucket","citadel_server_root_cert_expiry_timestamp","pilot_conflict_inbound_listener","pilot_conflict_outbound_listener_http_over_current_tcp","pilot_conflict_outbound_listener_tcp_over_current_tcp","pilot_conflict_outbound_listener_tcp_over_current_http","pilot_virt_services","galley_validation_failed","pilot_services","envoy_cluster_upstream_cx_total","envoy_cluster_upstream_cx_connect_fail","envoy_cluster_upstream_cx_active","envoy_cluster_upstream_cx_rx_bytes_total","envoy_cluster_upstream_cx_tx_bytes_total","istio_request_duration_milliseconds_bucket","istio_request_duration_seconds_bucket","istio_request_bytes_bucket","istio_response_bytes_bucket"]
            #measurement_prefix = ""
            measurement_name = "istio_prom"
            #[[inputs.prom.measurements]]
            # prefix = "cpu_"
            # name = "cpu"
            [inputs.prom.tags]
            namespace = "$NAMESPACE"
        proxy.istio.io/config: |
          tracing:
            zipkin:
              address: zipkin.istio-system:9411
            custom_tags:
              project:
                literal:
                  value: "reviews"
              version:
                literal:
                  value: __version__
              env:
                literal:
                  value: "test"
    spec:
      serviceAccountName: bookinfo-reviews
      containers:
        - name: reviews
          image: docker.io/istio/examples-bookinfo-reviews-__version__:1.16.2
          imagePullPolicy: IfNotPresent
          env:
            - name: LOG_DIR
              value: "/tmp/logs"
          ports:
            - containerPort: 9080
          volumeMounts:
            - name: tmp
              mountPath: /tmp
            - name: wlp-output
              mountPath: /opt/ibm/wlp/output
          securityContext:
            runAsUser: 1000
      volumes:
        - name: wlp-output
          emptyDir: {}
        - name: tmp
          emptyDir: {}
variables:
  APP_VERSION: "v1"

stages:
  - deploy

deploy_k8s:
  image: bitnami/kubectl:1.22.7
  stage: deploy
  tags:
    - kubernetes-runner
  script:
    - echo "deploy 실행"
    - ls
    - sed -i "s#__version__#${APP_VERSION}#g" deployment.yaml
    - cat deployment.yaml
    - kubectl apply -f deployment.yaml
  after_script:
    - sleep 10
    - kubectl get pod  -n prod
.gitlab-ci.yml 파일에서 APP_VERSION 값을 "v1"으로 변경하고 코드를 한 번 커밋한 후, "v2"로 변경하고 다시 코드를 커밋합니다.
3.11 productpage 접속
Rancher 상단의 「명령줄」 아이콘을 클릭하고 「kubectl get svc -n istio-system」을 입력한 후 Enter 키를 누릅니다.
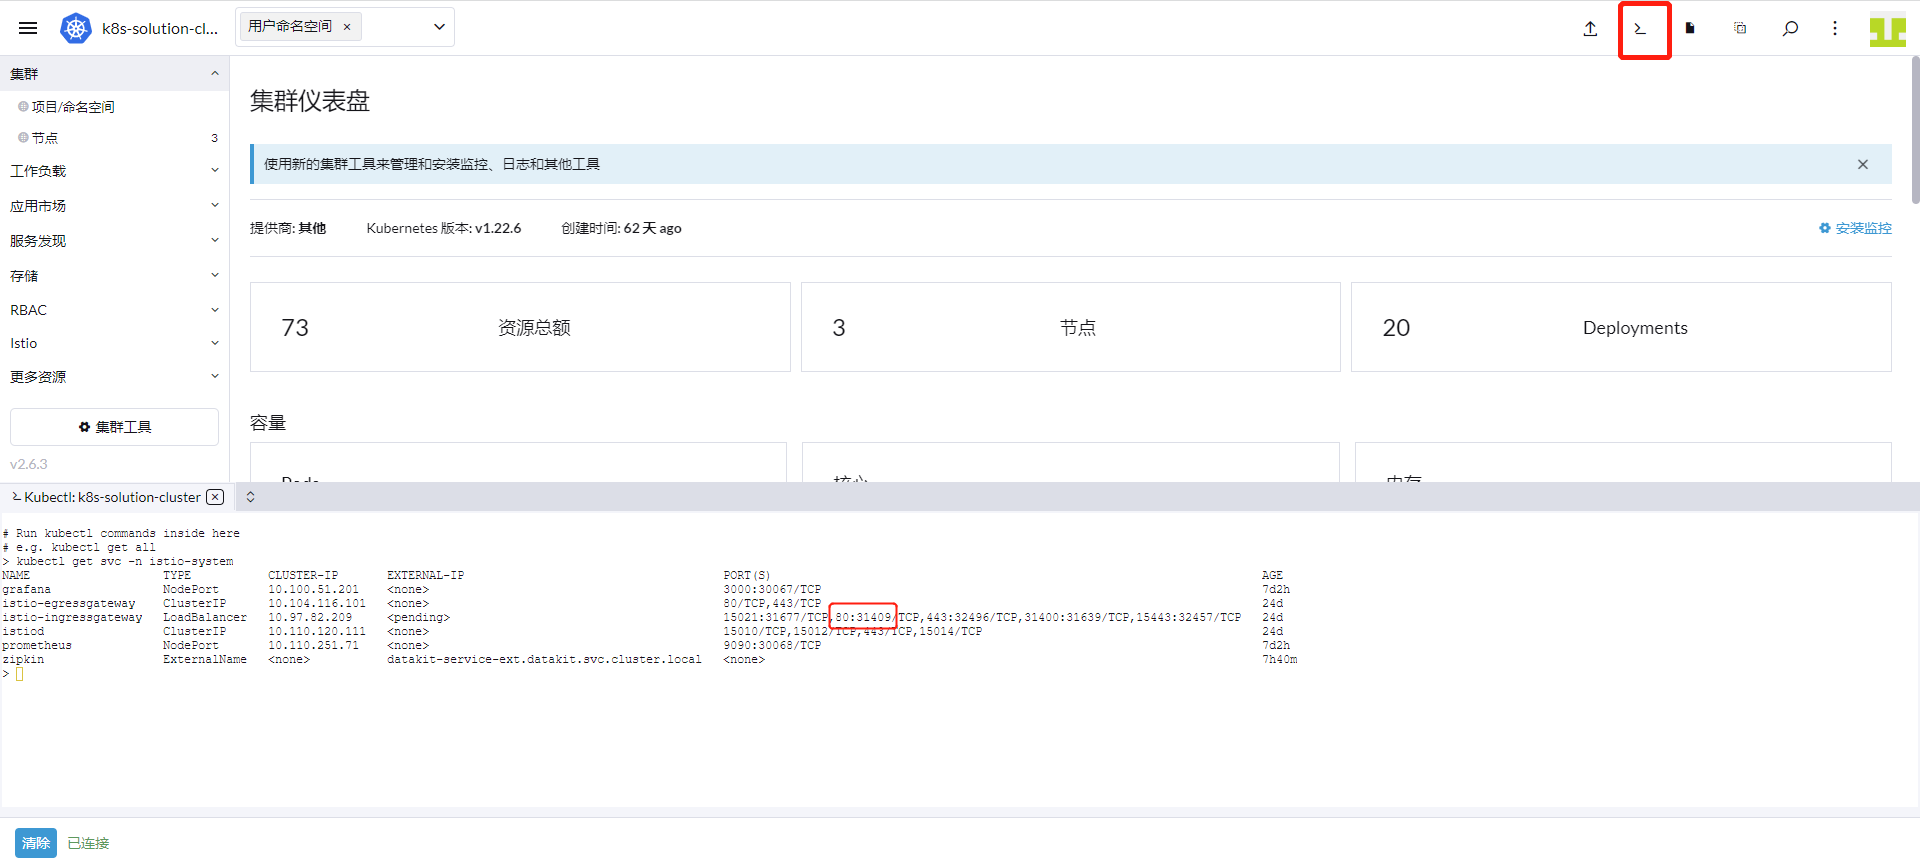
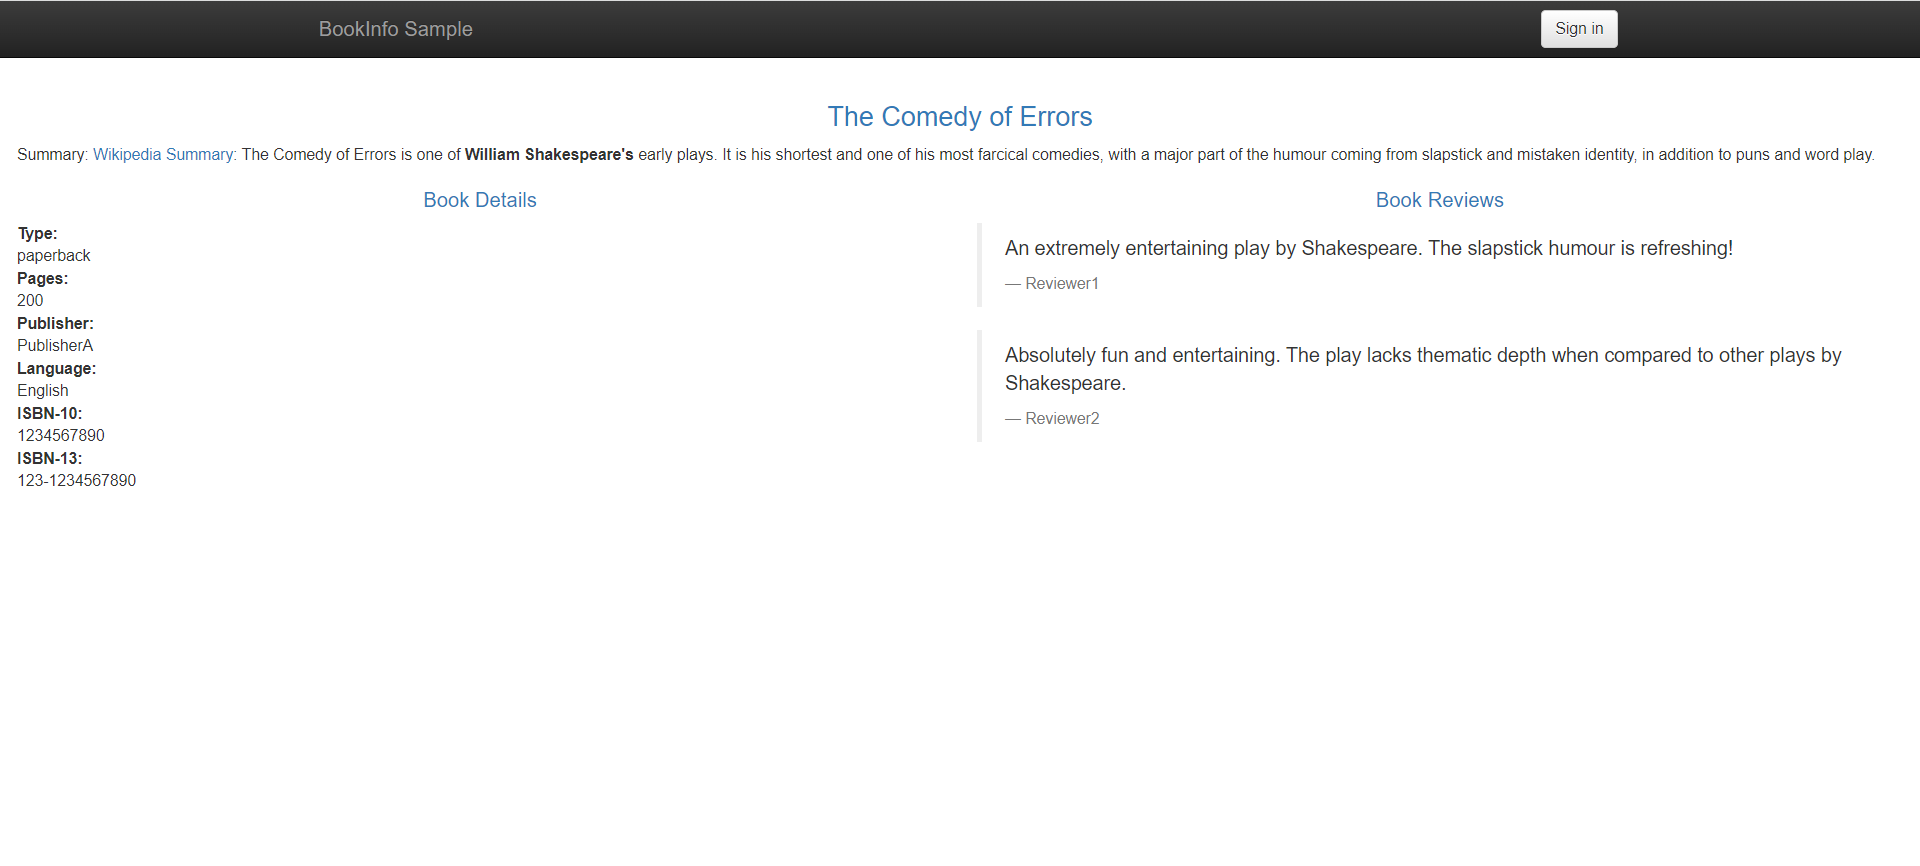
위 그림에서 포트가 31409임을 확인할 수 있습니다. 서버 IP를 기반으로 productpage 접속 경로는 http://8.136.193.105:31409/productpage입니다.
4단계: Istio 관측 가능성
위 단계에서 Istiod 및 bookinfo 애플리케이션에 대한 메트릭 수집을 이미 수행했습니다. Guance은 Istio 실행 상태를 관측할 수 있는 4개의 모니터링 뷰를 기본 제공합니다.
4.1 Istio Workload 모니터링 뷰
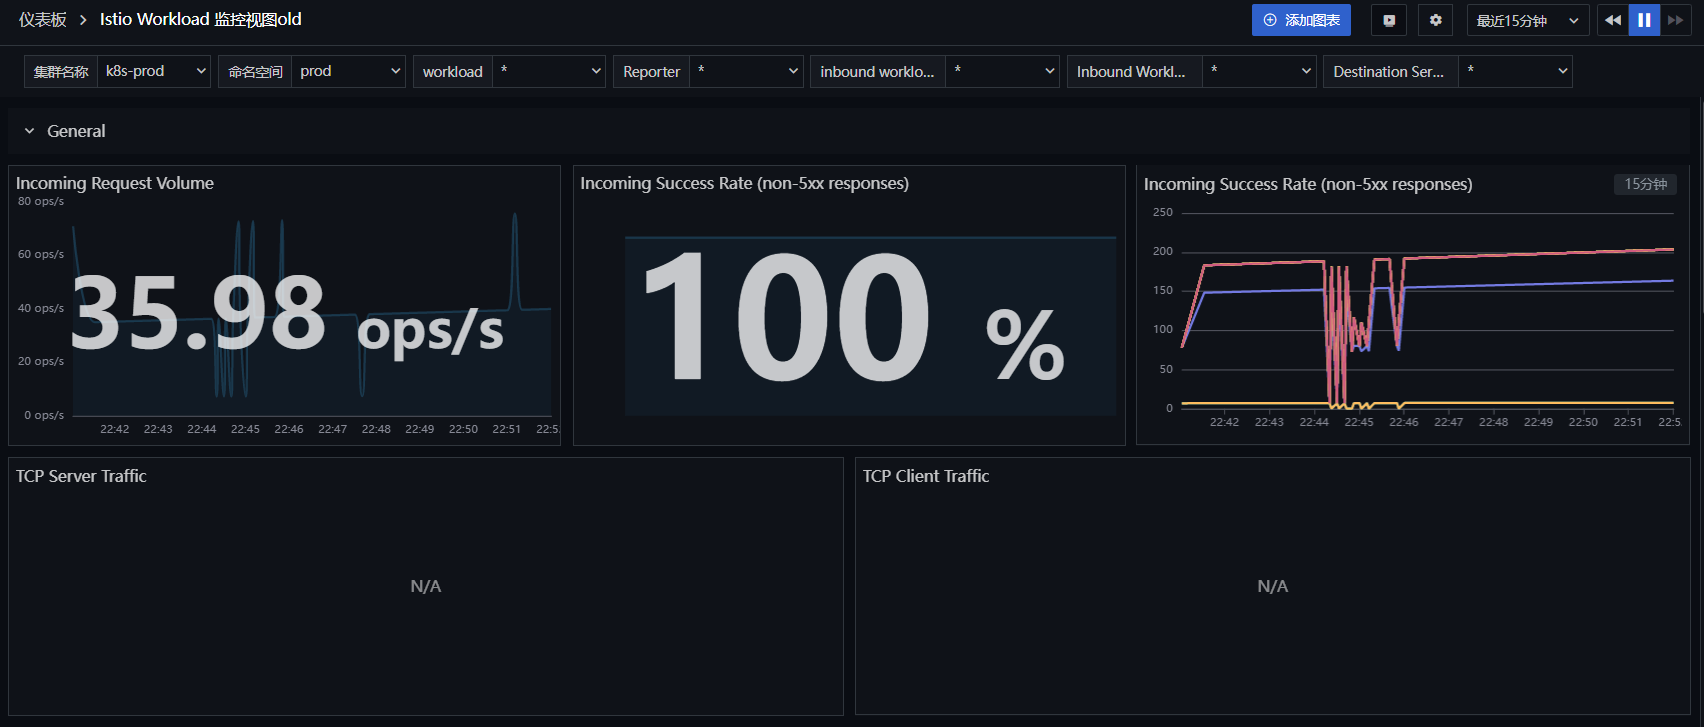
「Guance」에 로그인하여 「시나리오」 모듈로 이동합니다. 「대시보드 생성」을 클릭하고 「Istio」를 입력한 후 「Istio Workload 모니터링 뷰」를 선택하고 「확인」을 클릭합니다. 그런 다음 새로 생성된 「Istio Workload 모니터링 뷰」를 클릭하여 관측합니다.
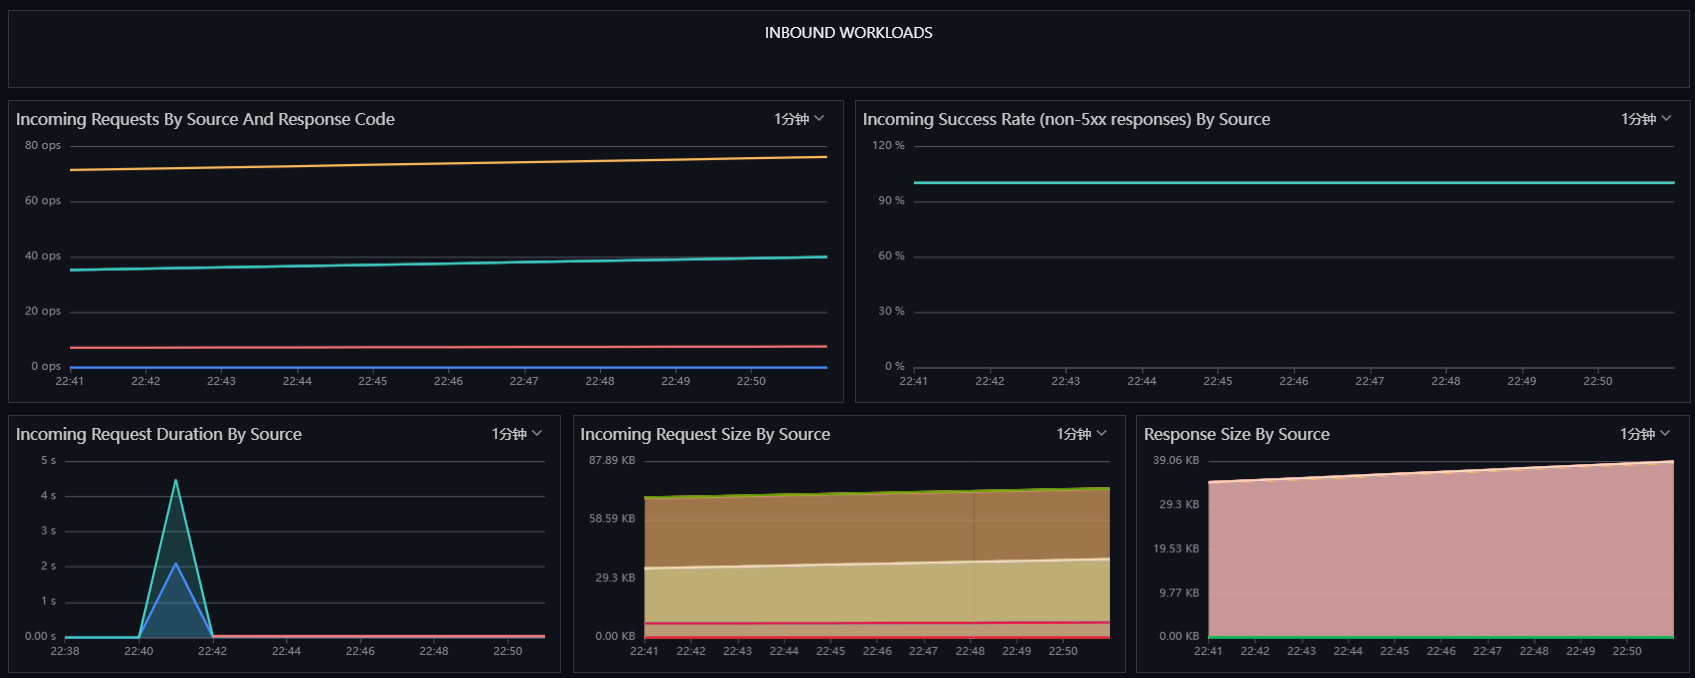
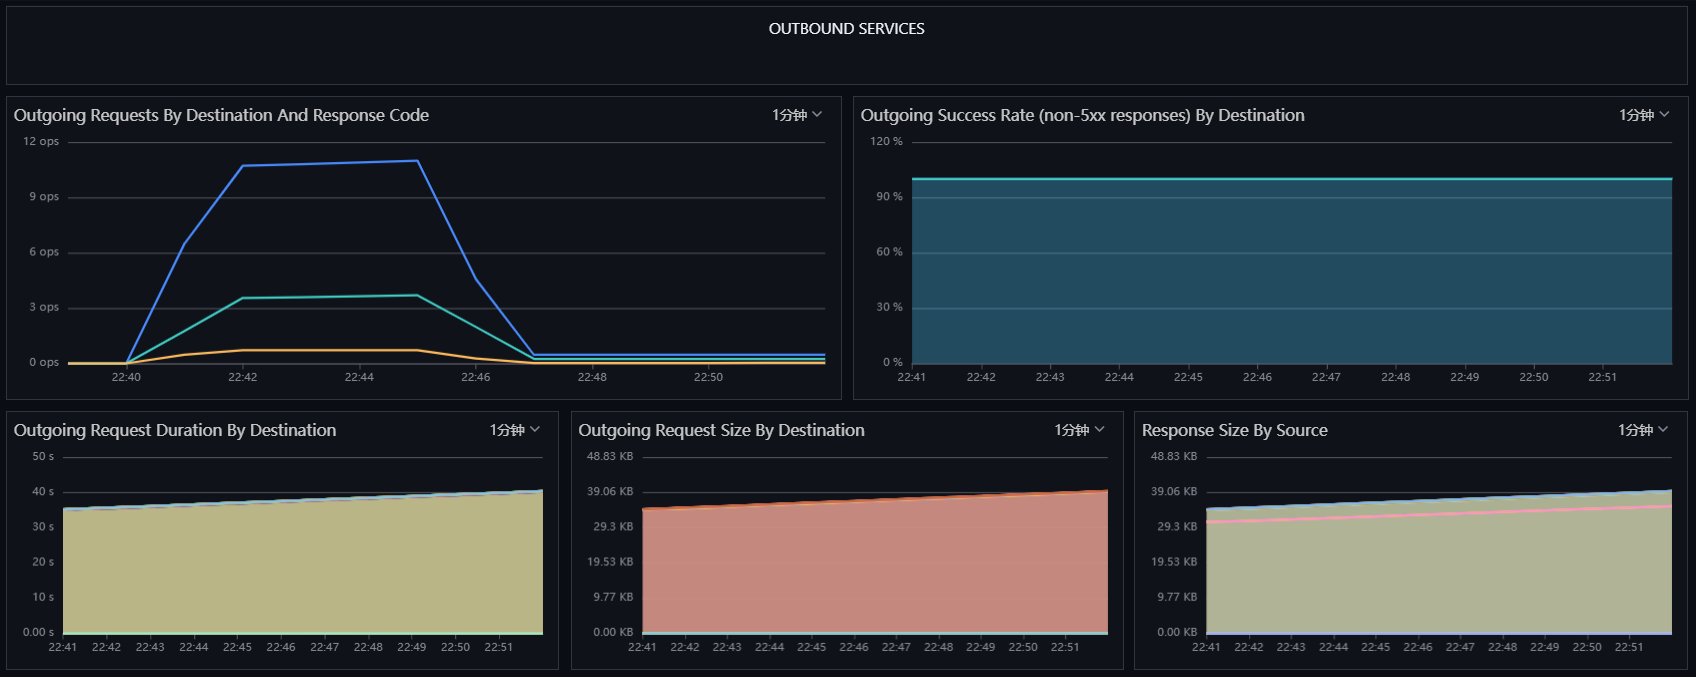
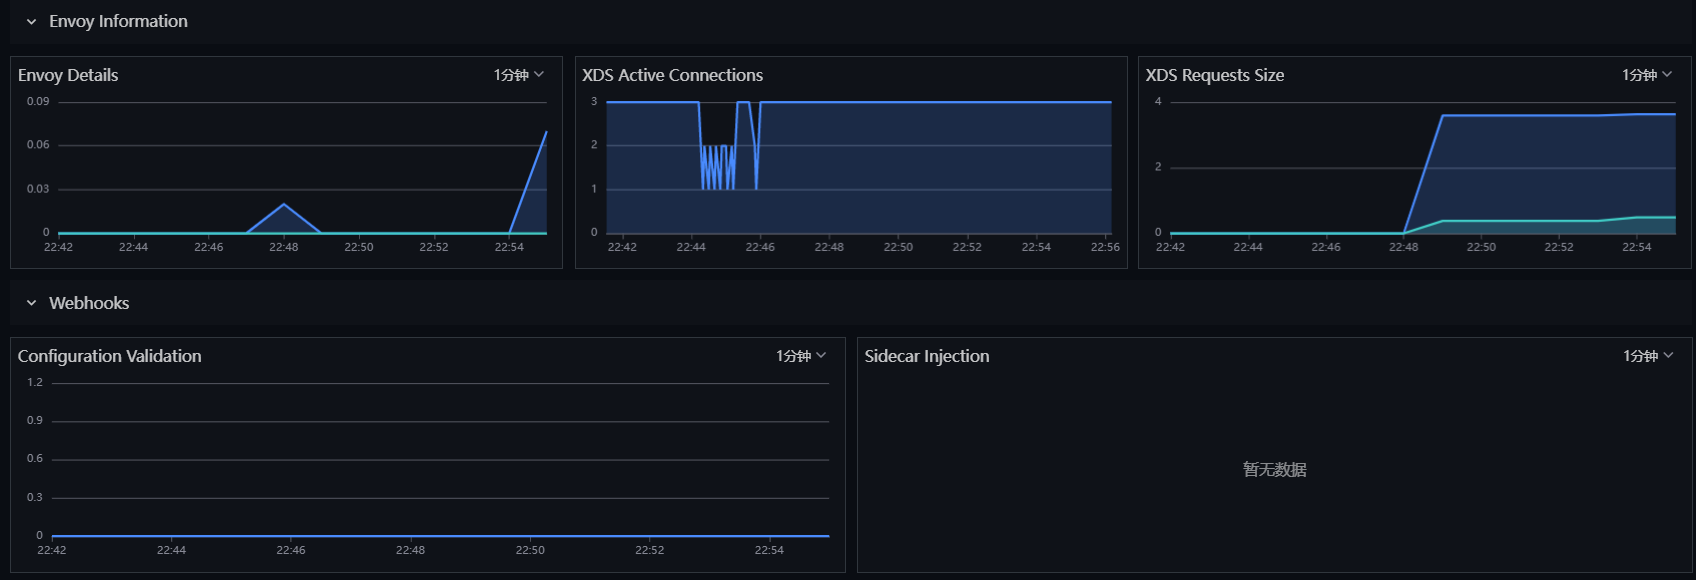
4.2 Istio Control Plane 모니터링 뷰
「Guance」에 로그인하여 「시나리오」 모듈로 이동합니다. 「대시보드 생성」을 클릭하고 「Istio」를 입력한 후 「Istio Control Plane 모니터링 뷰」를 선택하고 「확인」을 클릭합니다. 그런 다음 새로 생성된 「Istio Control Plane 모니터링 뷰」를 클릭하여 관측합니다.
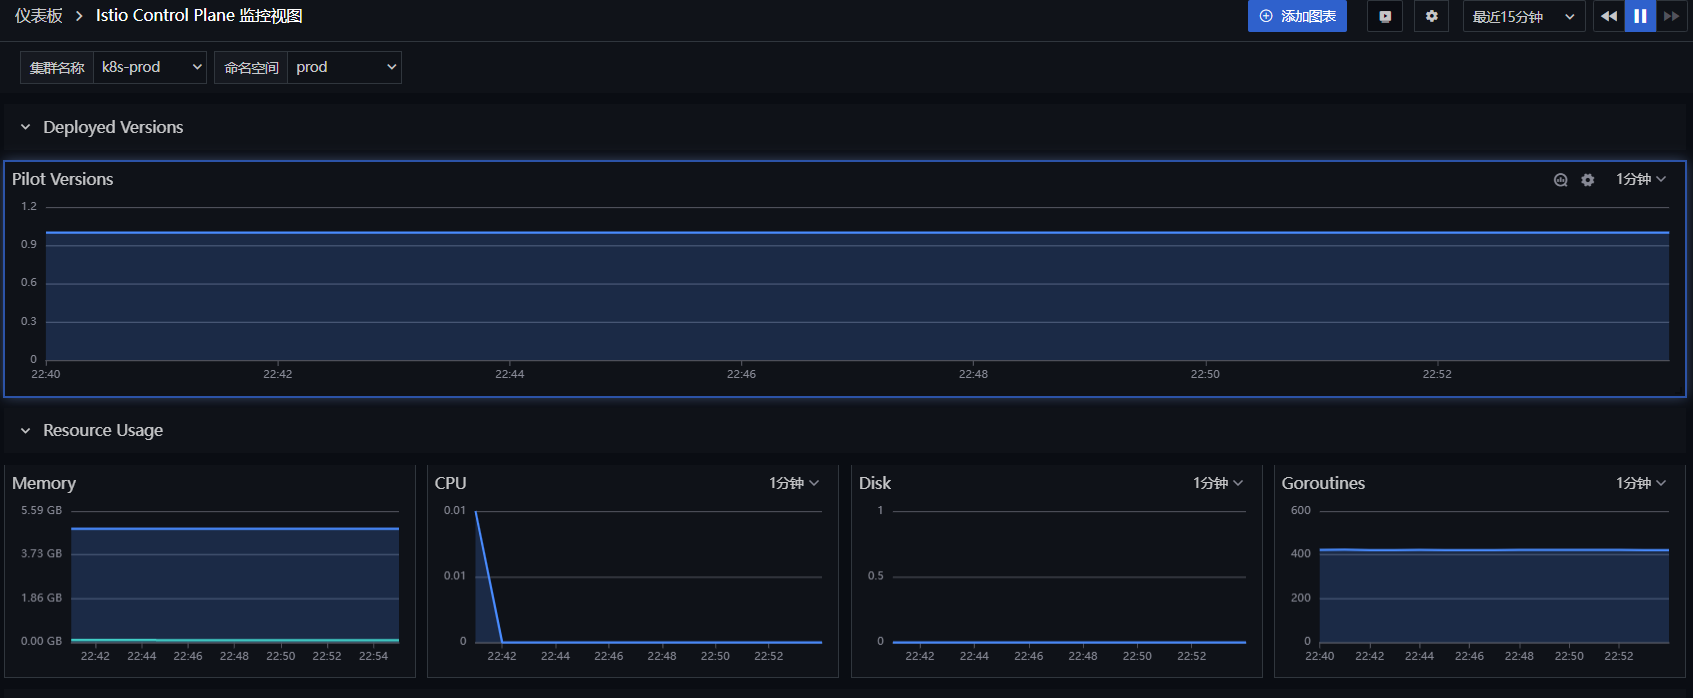
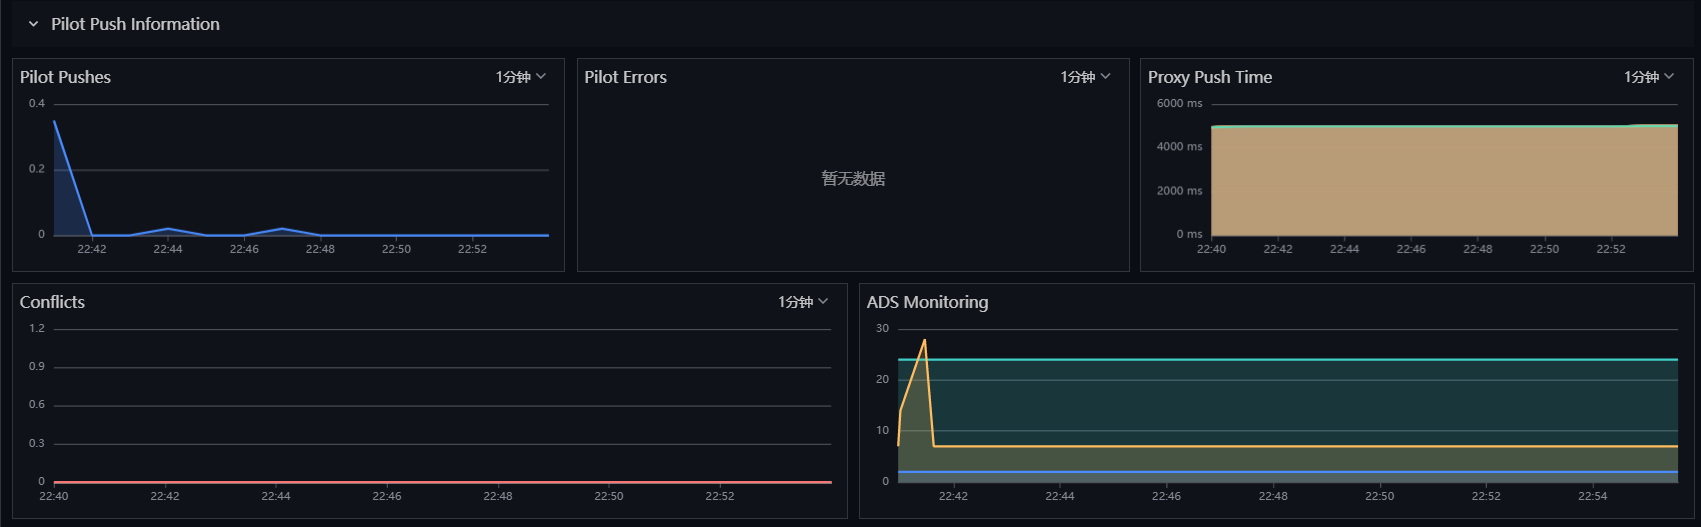
4.3 Istio Service 모니터링 뷰
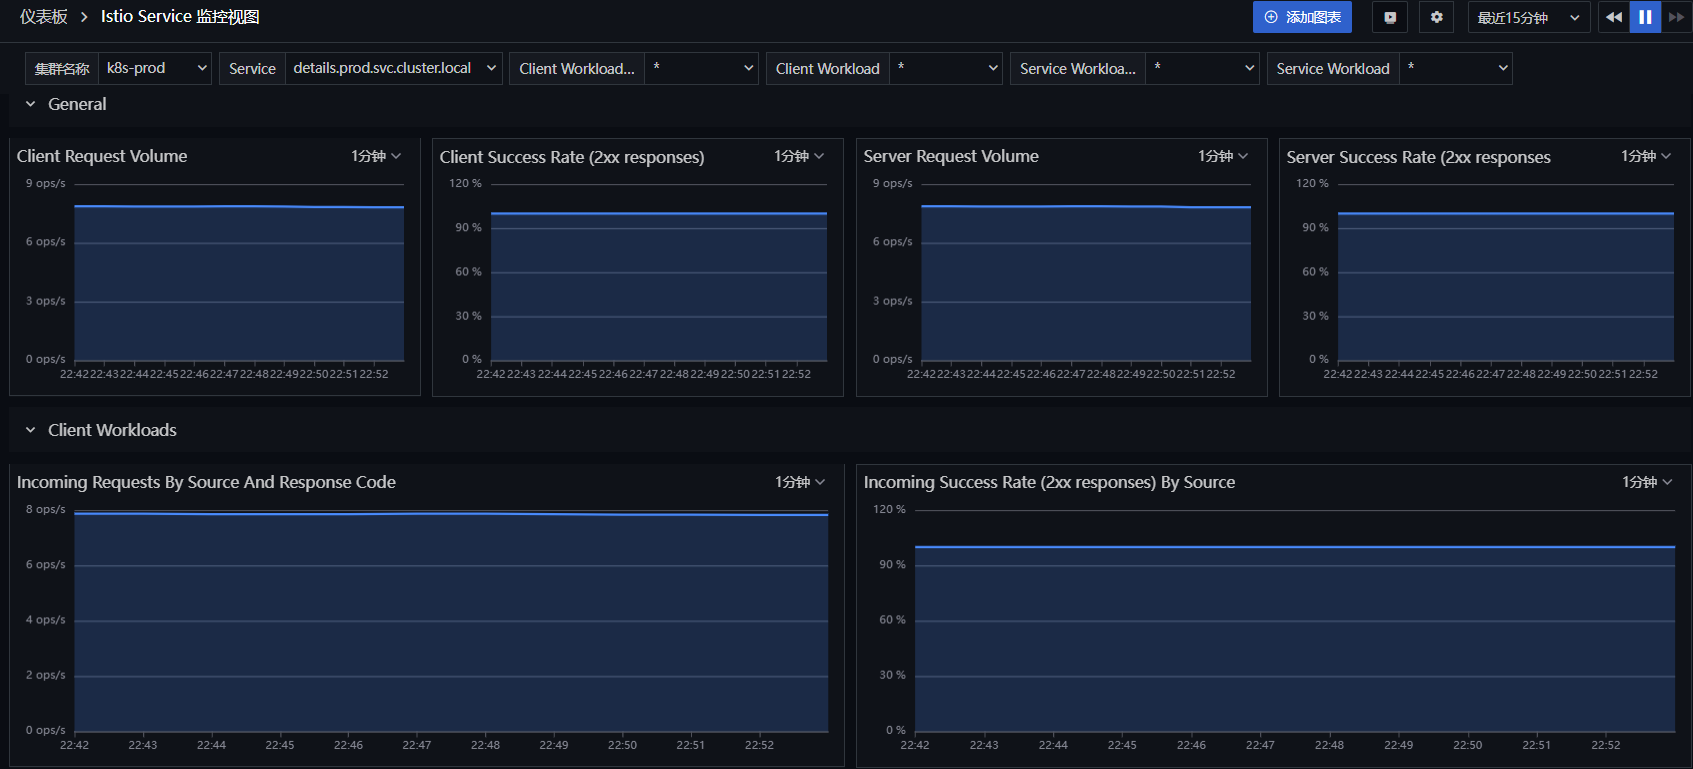
「Guance」에 로그인하여 「시나리오」 모듈로 이동합니다. 「대시보드 생성」을 클릭하고 「Istio」를 입력한 후 「Istio Service 모니터링 뷰」를 선택하고 「확인」을 클릭합니다. 그런 다음 새로 생성된 「Istio Service 모니터링 뷰」를 클릭하여 관측합니다.
4.4 Istio Mesh 모니터링 뷰
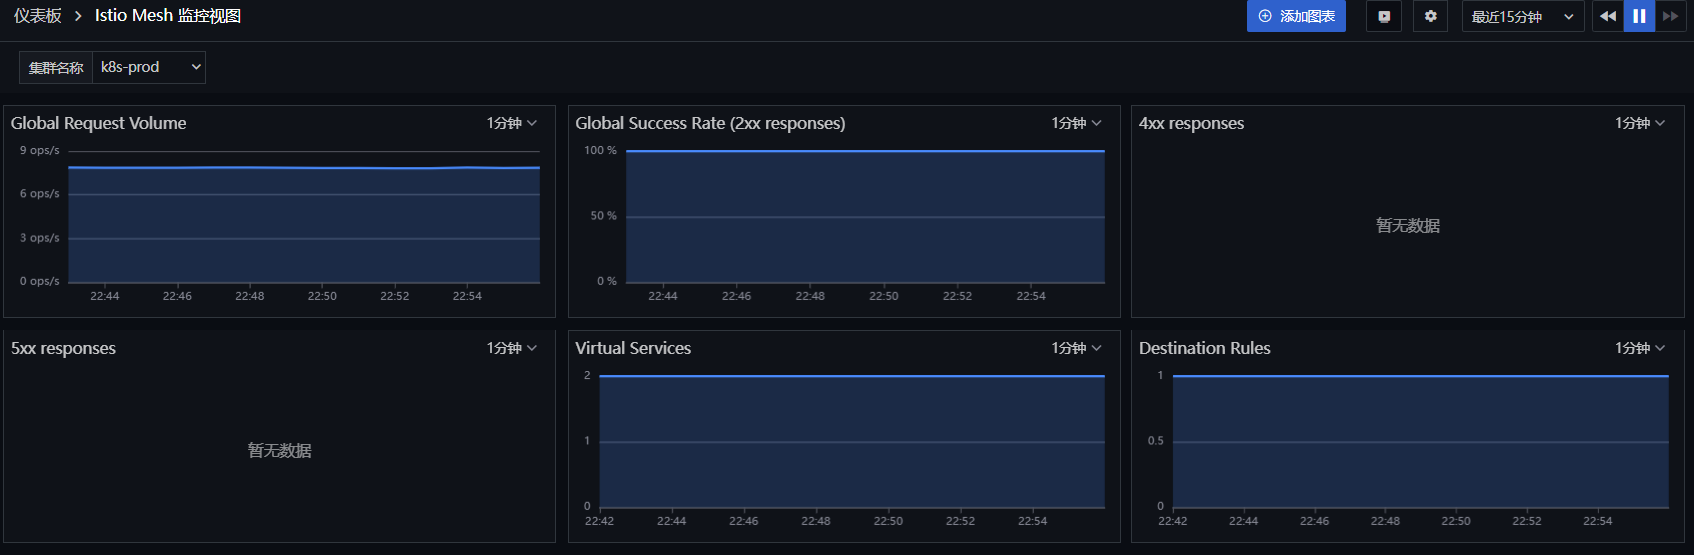
「Guance」에 로그인하여 「시나리오」 모듈로 이동합니다. 「대시보드 생성」을 클릭하고 「Istio」를 입력한 후 「Istio Mesh 모니터링 뷰」를 선택하고 「확인」을 클릭합니다. 그런 다음 새로 생성된 「Istio Mesh 모니터링 뷰」를 클릭하여 관측합니다.
5단계: RUM 관측 가능성
5.1 RUM 애플리케이션 생성
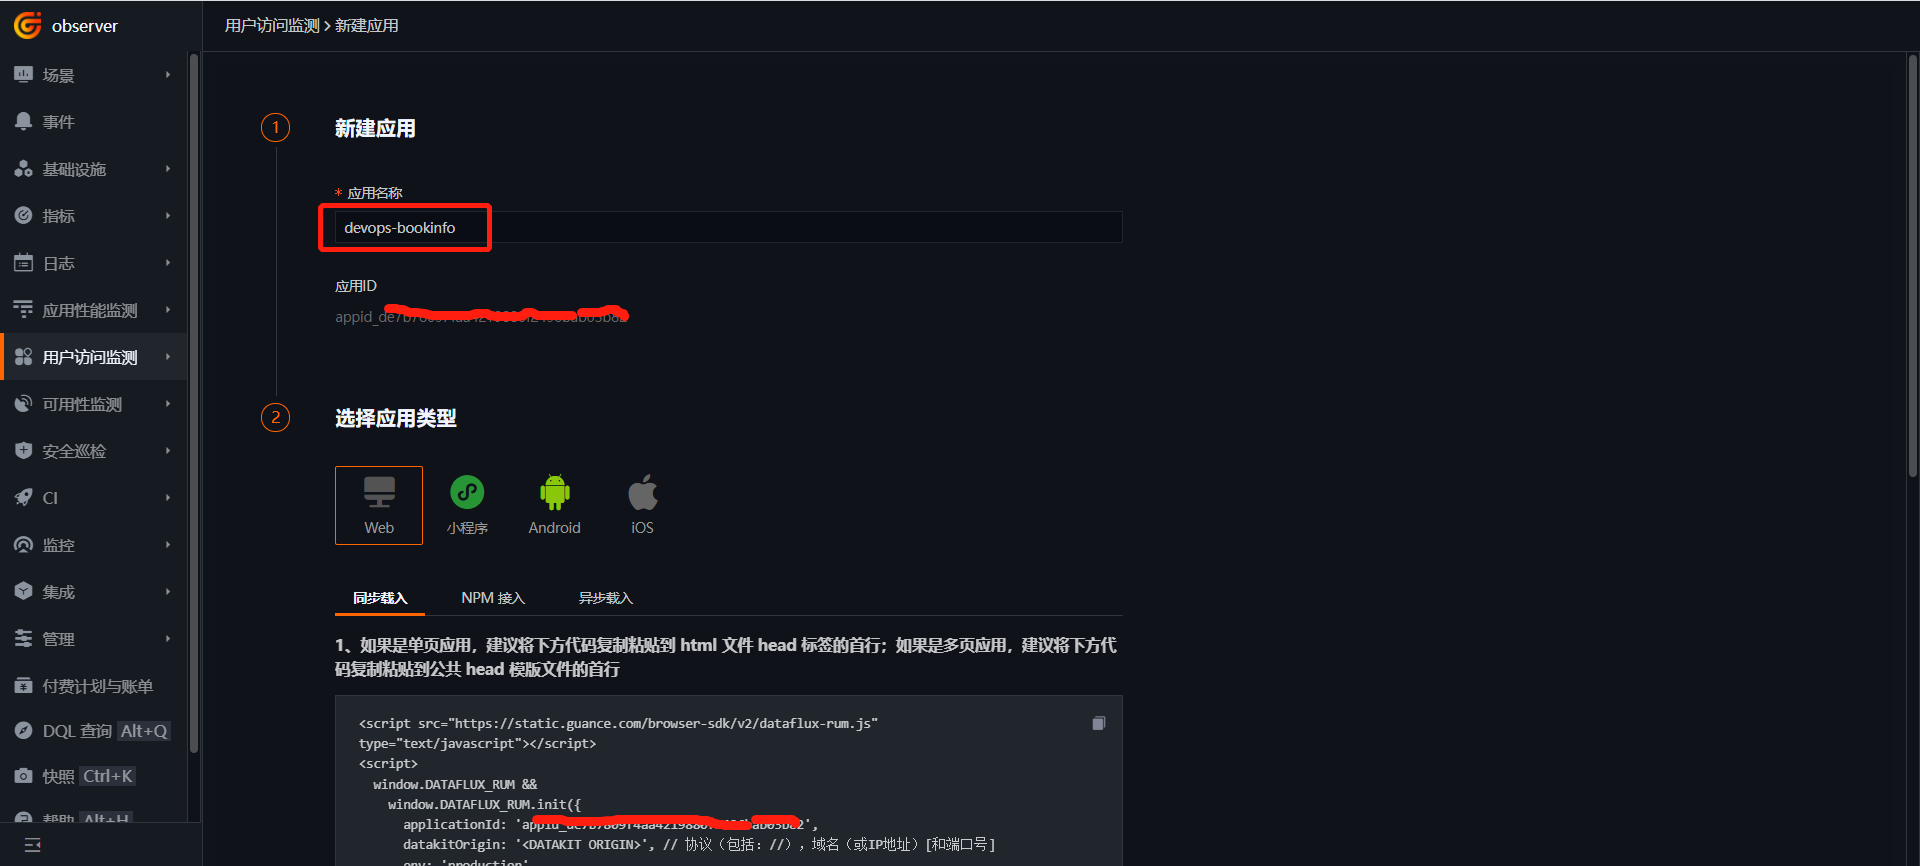
「Guance」에 로그인하여 「실제 사용자 모니터링(RUM)」으로 이동합니다. devops-bookinfo 애플리케이션을 생성하고 아래 JS를 복사합니다.
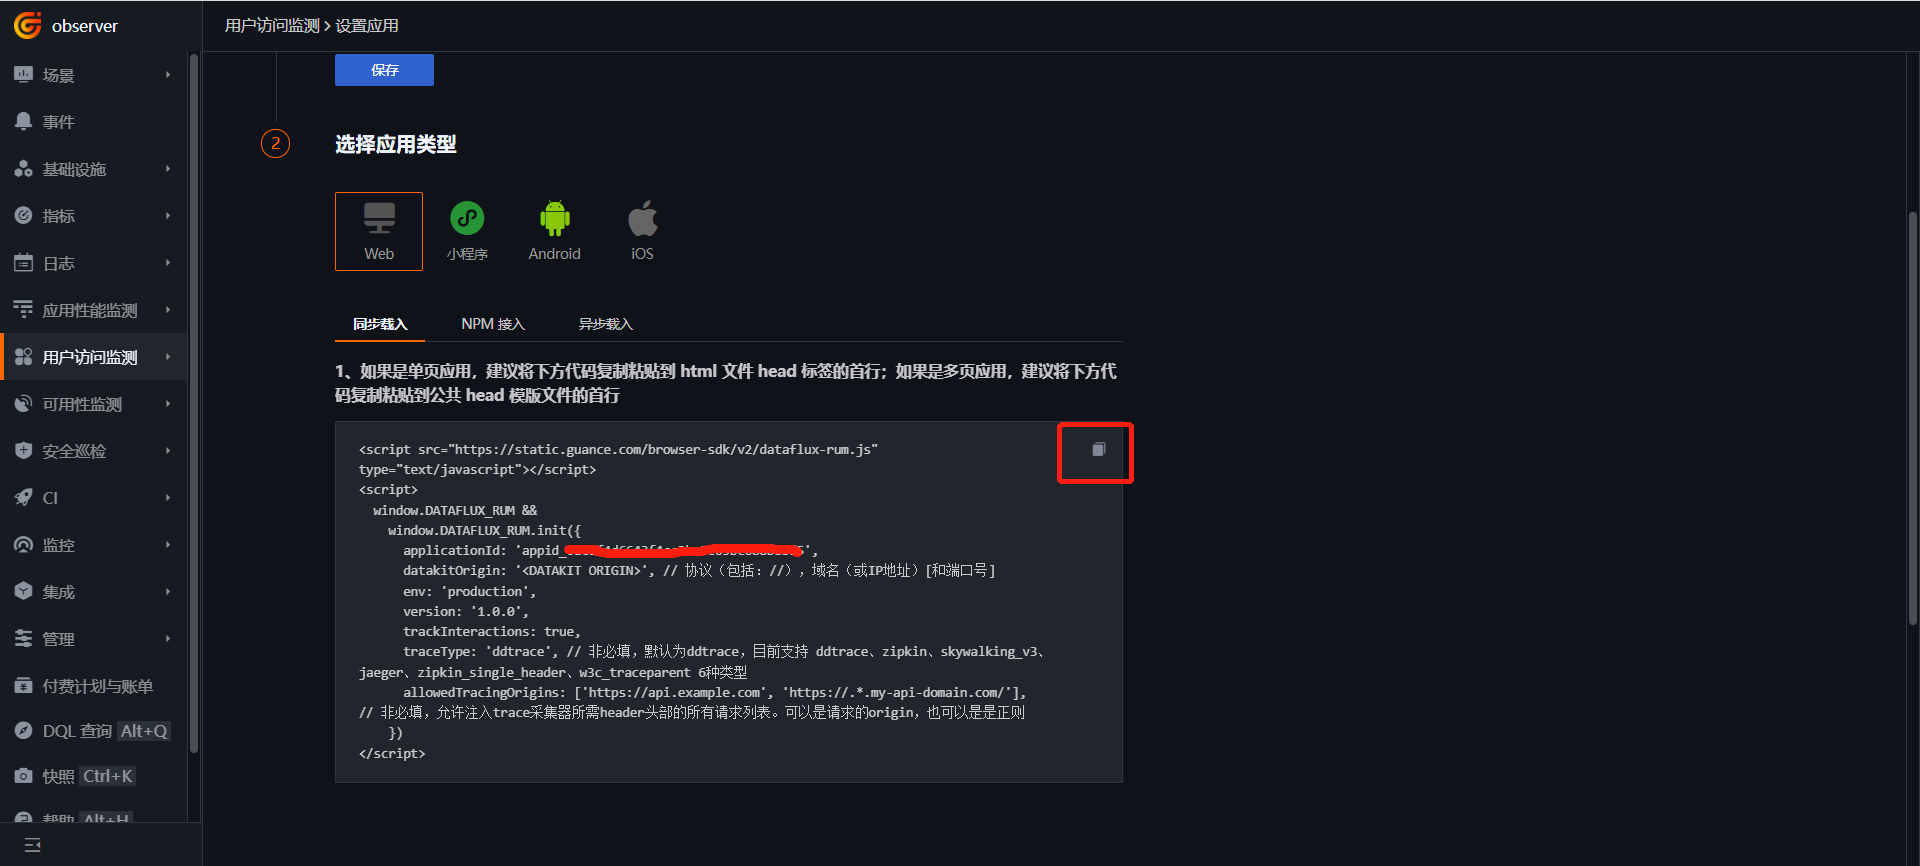
5.2 productpage 이미지 생성
istio-1.13.2-linux-amd64.tar.gz를 다운로드하여 압축을 풉니다. 위 JS는 productpage 프로젝트의 모든 페이지에서 접근할 수 있는 위치에 배치해야 합니다. 이 프로젝트에서는 위 JS를 istio-1.13.2\samples\bookinfo\src\productpage\templates\productpage.html 파일에 복사합니다. 여기서 datakitOrigin 값은 DataKit의 주소입니다.
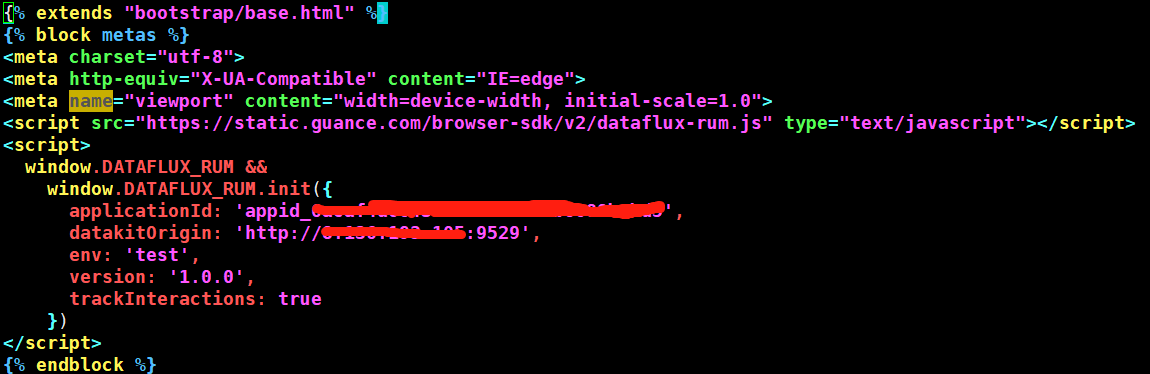
매개변수 설명
- datakitOrigin: 데이터 전송 주소로, DataKit의 도메인 또는 IP입니다. 필수 항목입니다.
- env: 애플리케이션 환경입니다. 필수 항목입니다.
- version: 애플리케이션 버전입니다. 필수 항목입니다.
- trackInteractions: 사용자 행동 통계 활성화 여부(예: 버튼 클릭, 정보 제출 등). 필수 항목입니다.
- traceType: 트레이스 유형, 기본값은 ddtrace입니다. 선택 사항입니다.
- allowedTracingOrigins: APM과 RUM 간 트레이스 연결을 구현합니다. 백엔드 서비스의 도메인 또는 IP를 입력합니다. 선택 사항입니다.
이미지를 생성하고 이미지 레지스트리에 업로드합니다.
cd istio-1.13.2\samples\bookinfo\src\productpage
docker build -t 172.16.0.238/df-demo/product-page:v1  .
docker push 172.16.0.238/df-demo/product-page:v1
5.3 productpage 이미지 교체
「클러스터」 → 「워크로드」 → 「Deployments」로 이동하여 「productpage-v1」을 찾아 「구성 편집」을 클릭합니다.
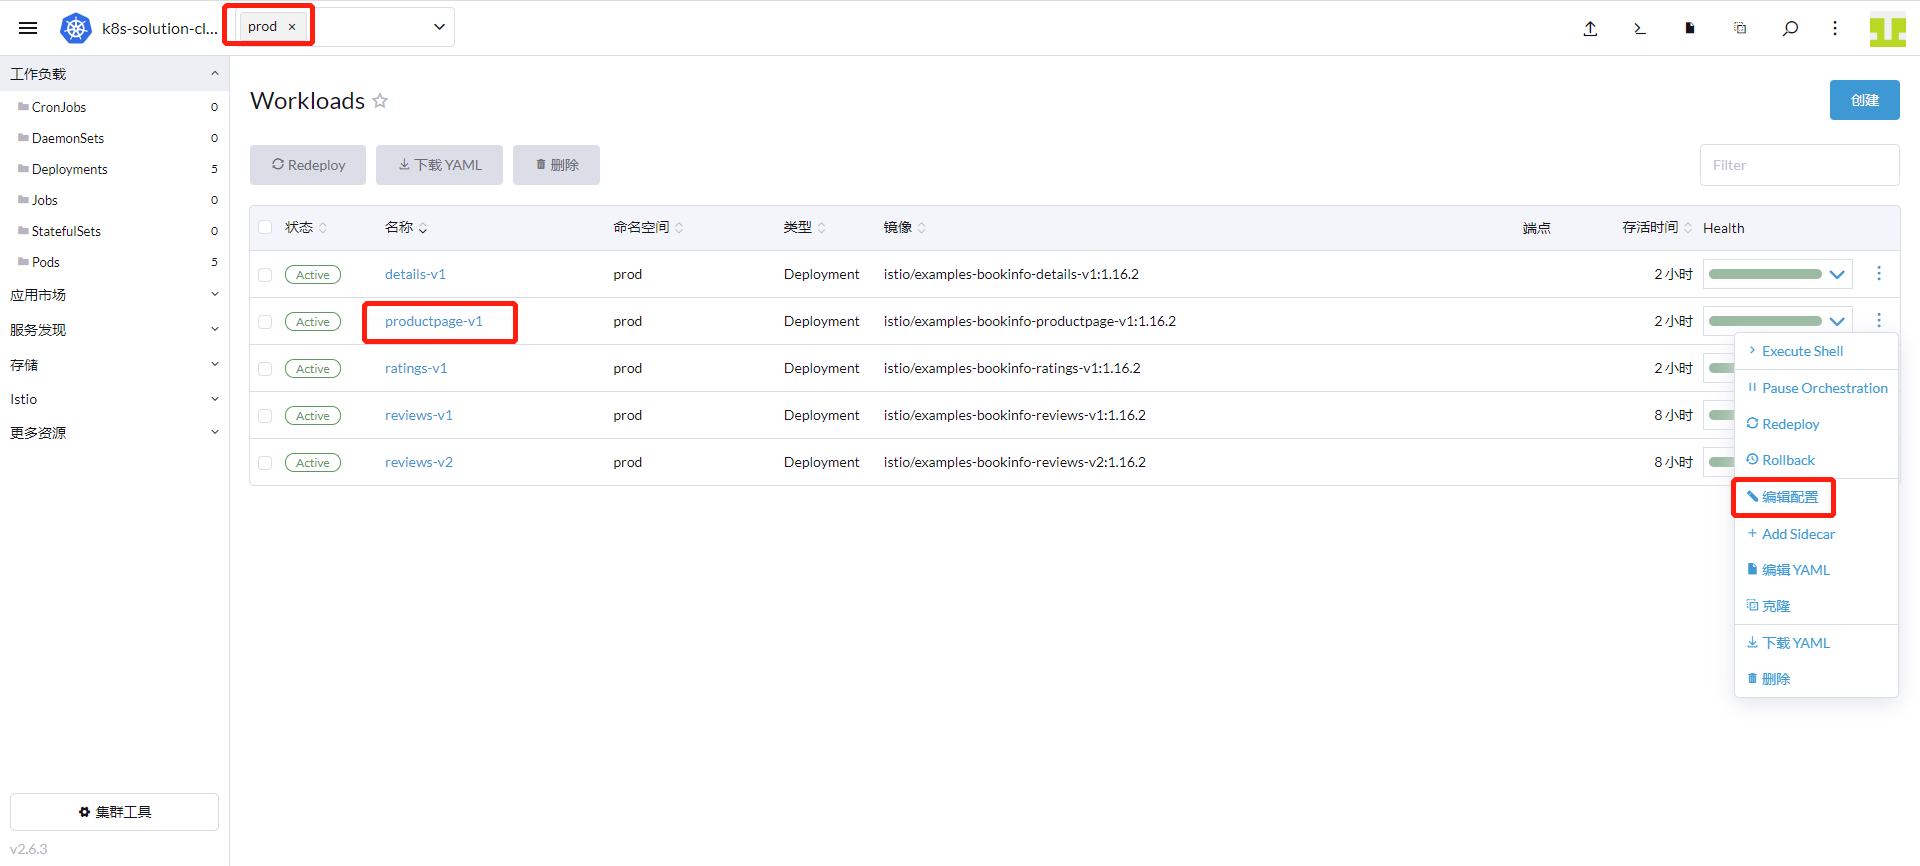
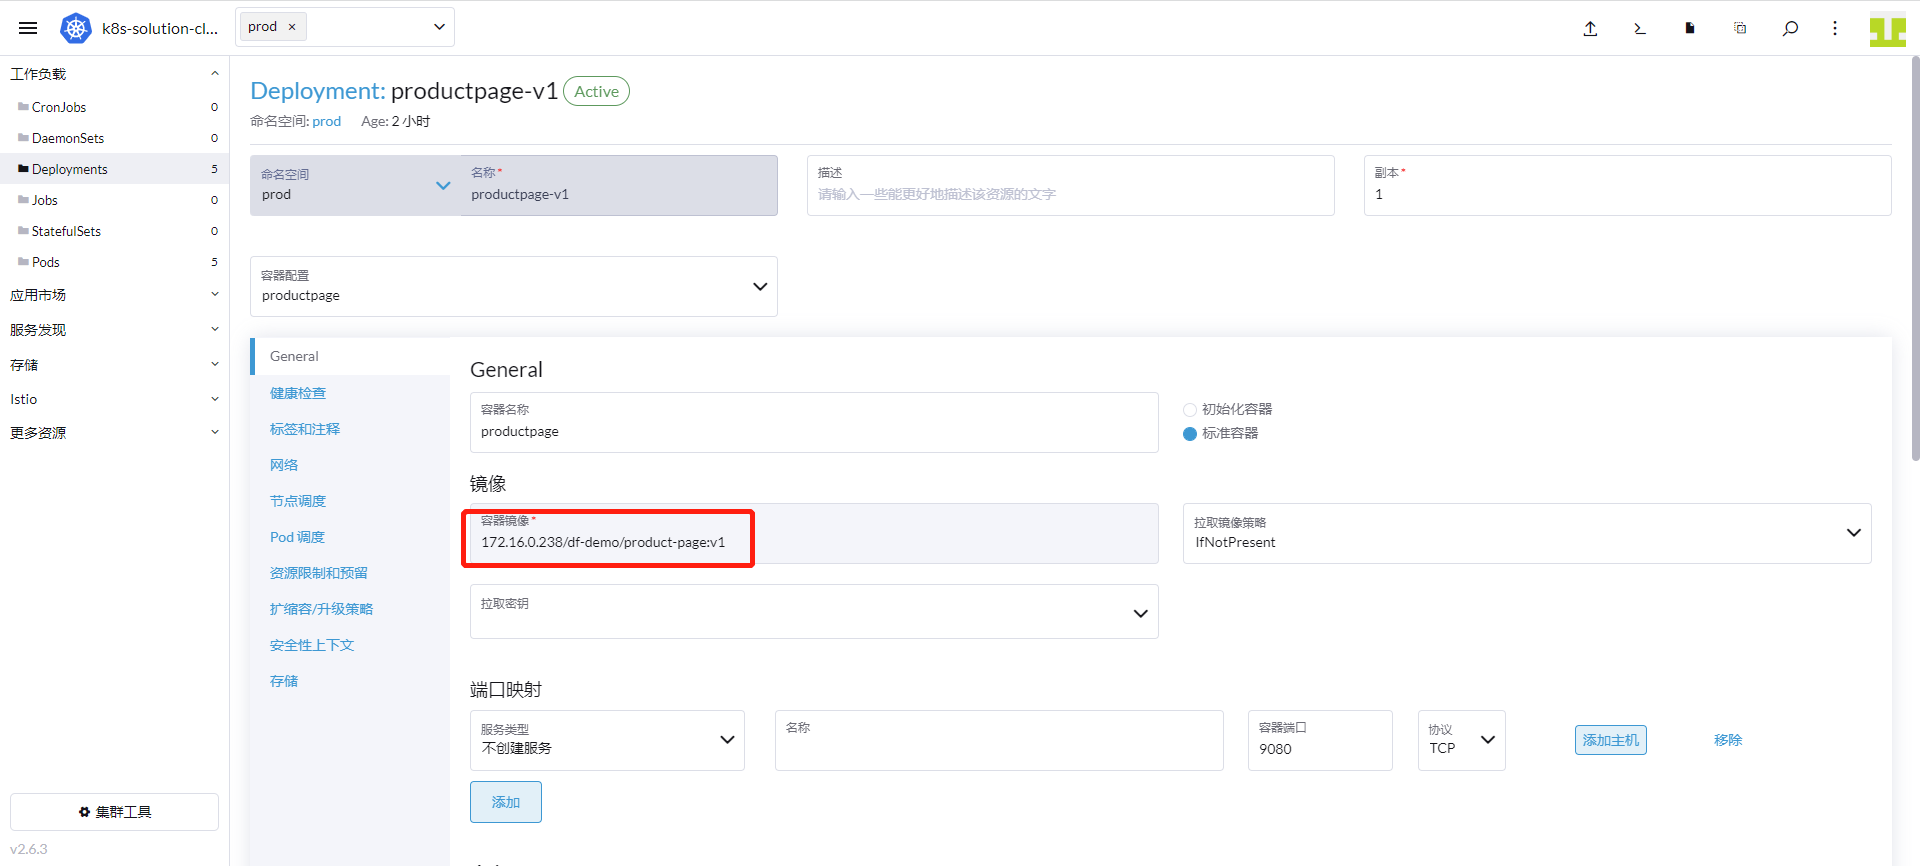
이미지 image: docker.io/istio/examples-bookinfo-productpage-v1:1.16.2를 다음 이미지로 교체합니다. image: 172.16.0.238/df-demo/product-page:v1, 「저장」을 클릭합니다.
5.4 RUM
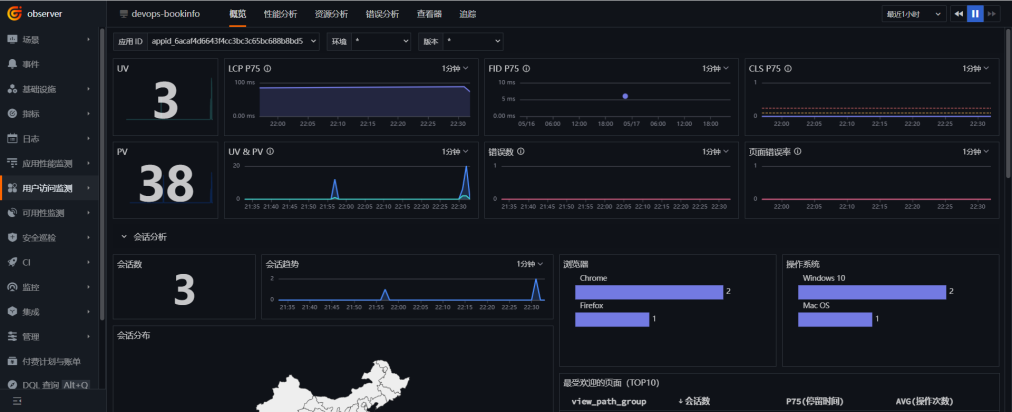
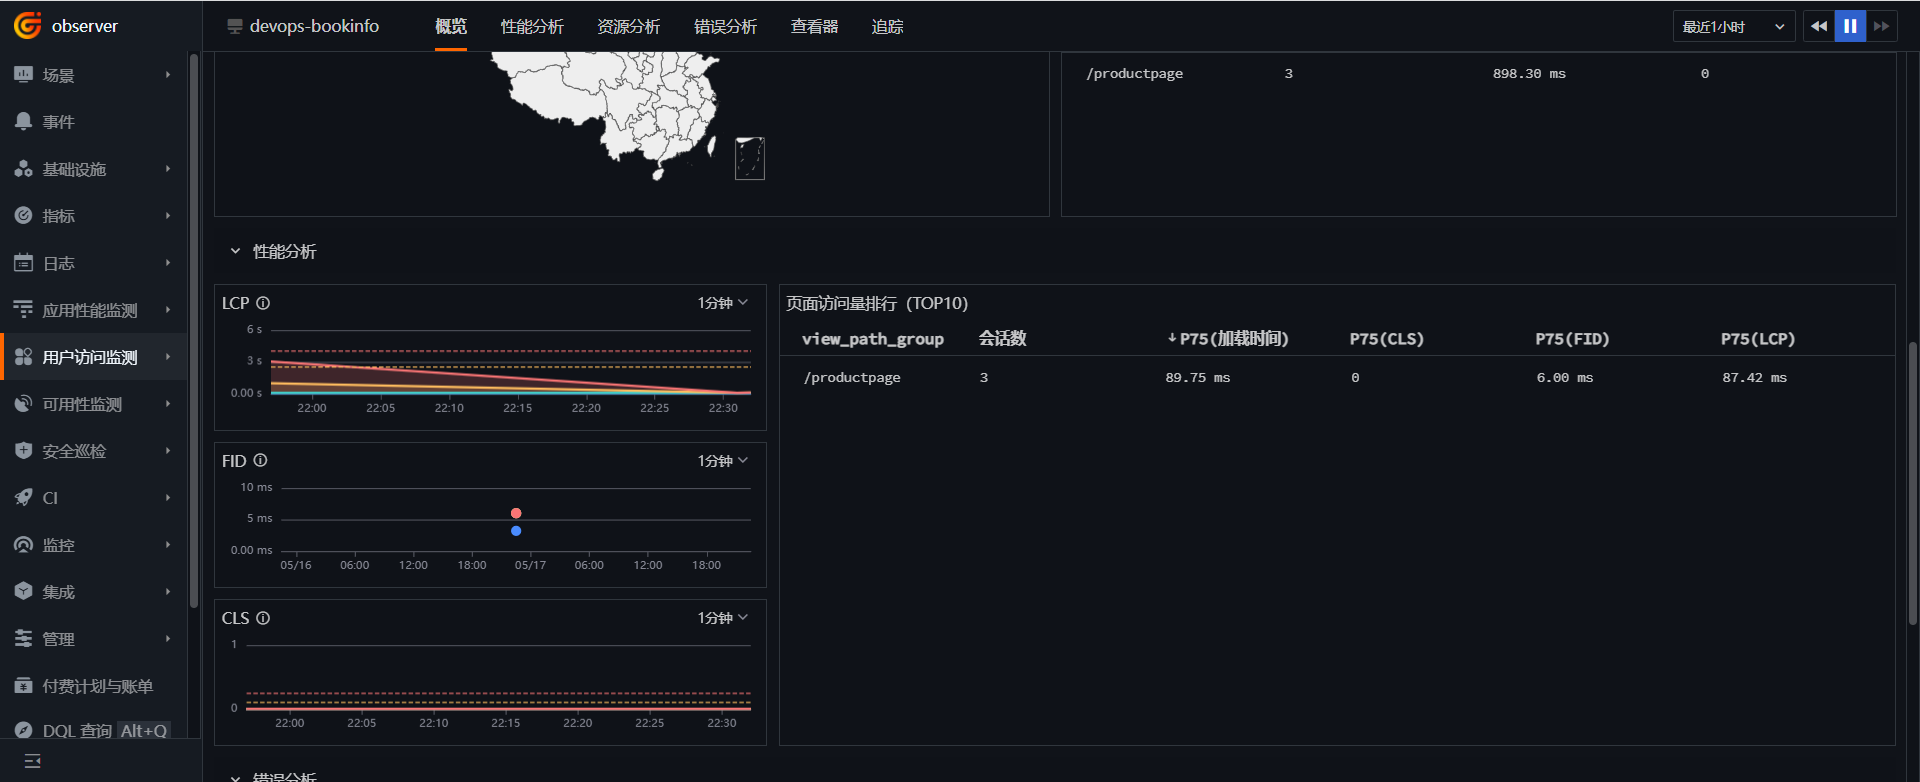
「Guance」에 로그인하여 「실제 사용자 모니터링(RUM)」으로 이동합니다. devops-bookinfo 애플리케이션을 찾아 클릭하여 들어가서 UV, PV, 세션 수, 방문한 페이지 등의 정보를 확인합니다.
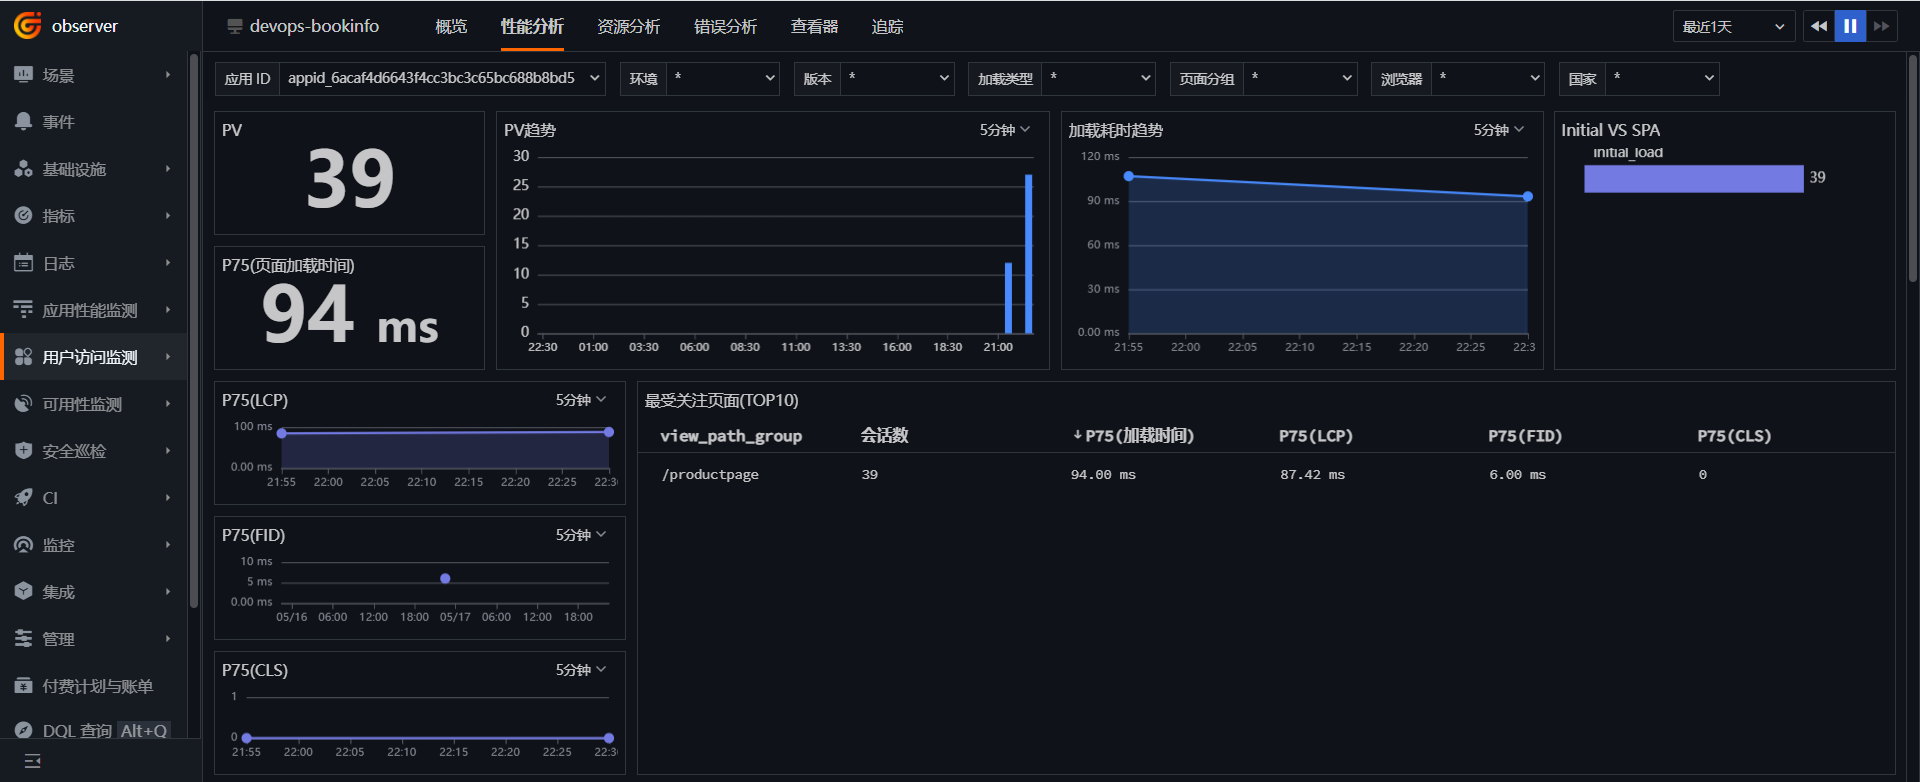
성능 분석
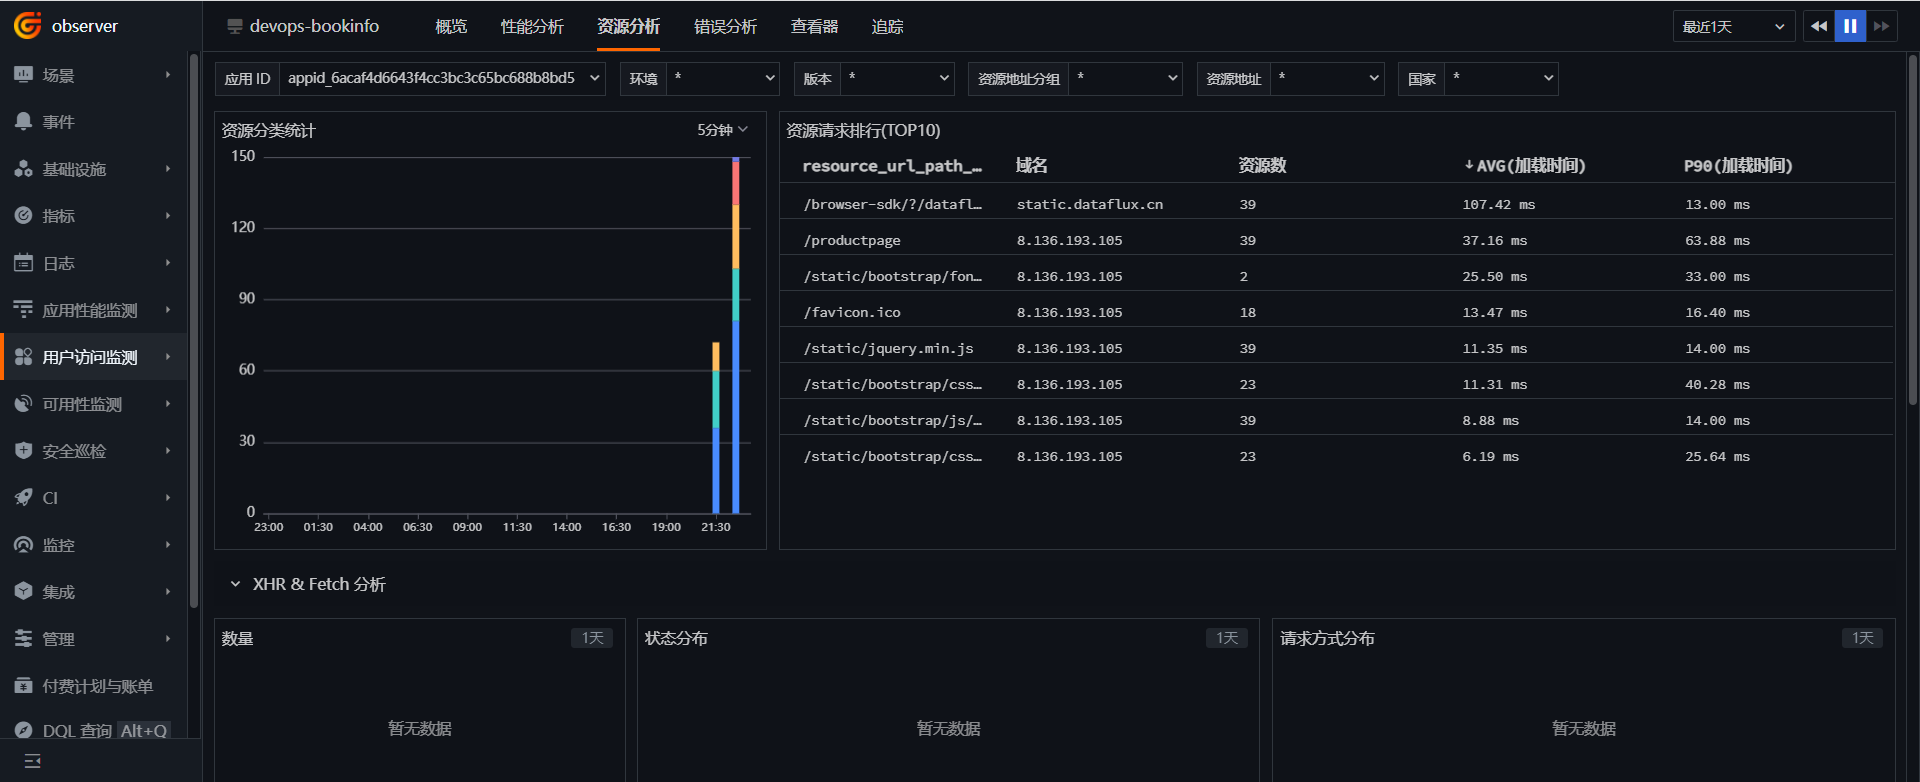
리소스 분석
6단계: 로그 관측 가능성
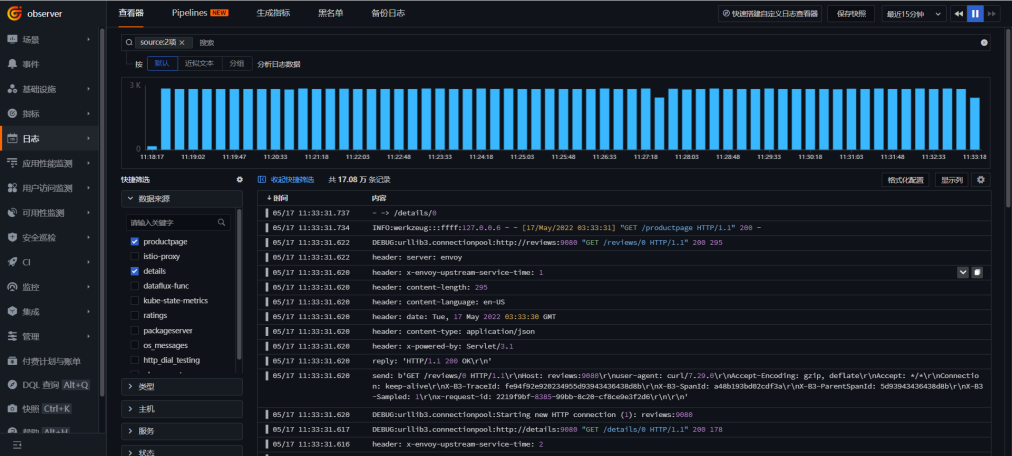
DataKit 배포 시 구성에 따라 기본적으로 /dev/stdout으로 출력되는 로그를 수집합니다. 「Guance」에 로그인하여 「로그」로 이동하여 로그 정보를 확인합니다. 또한 Guance은 RUM, APM 및 로그 간의 연동 기능을 제공하므로 공식 문서를 참조하여 해당 구성을 수행하시기 바랍니다.
7단계: Gitlab CI 관측 가능성
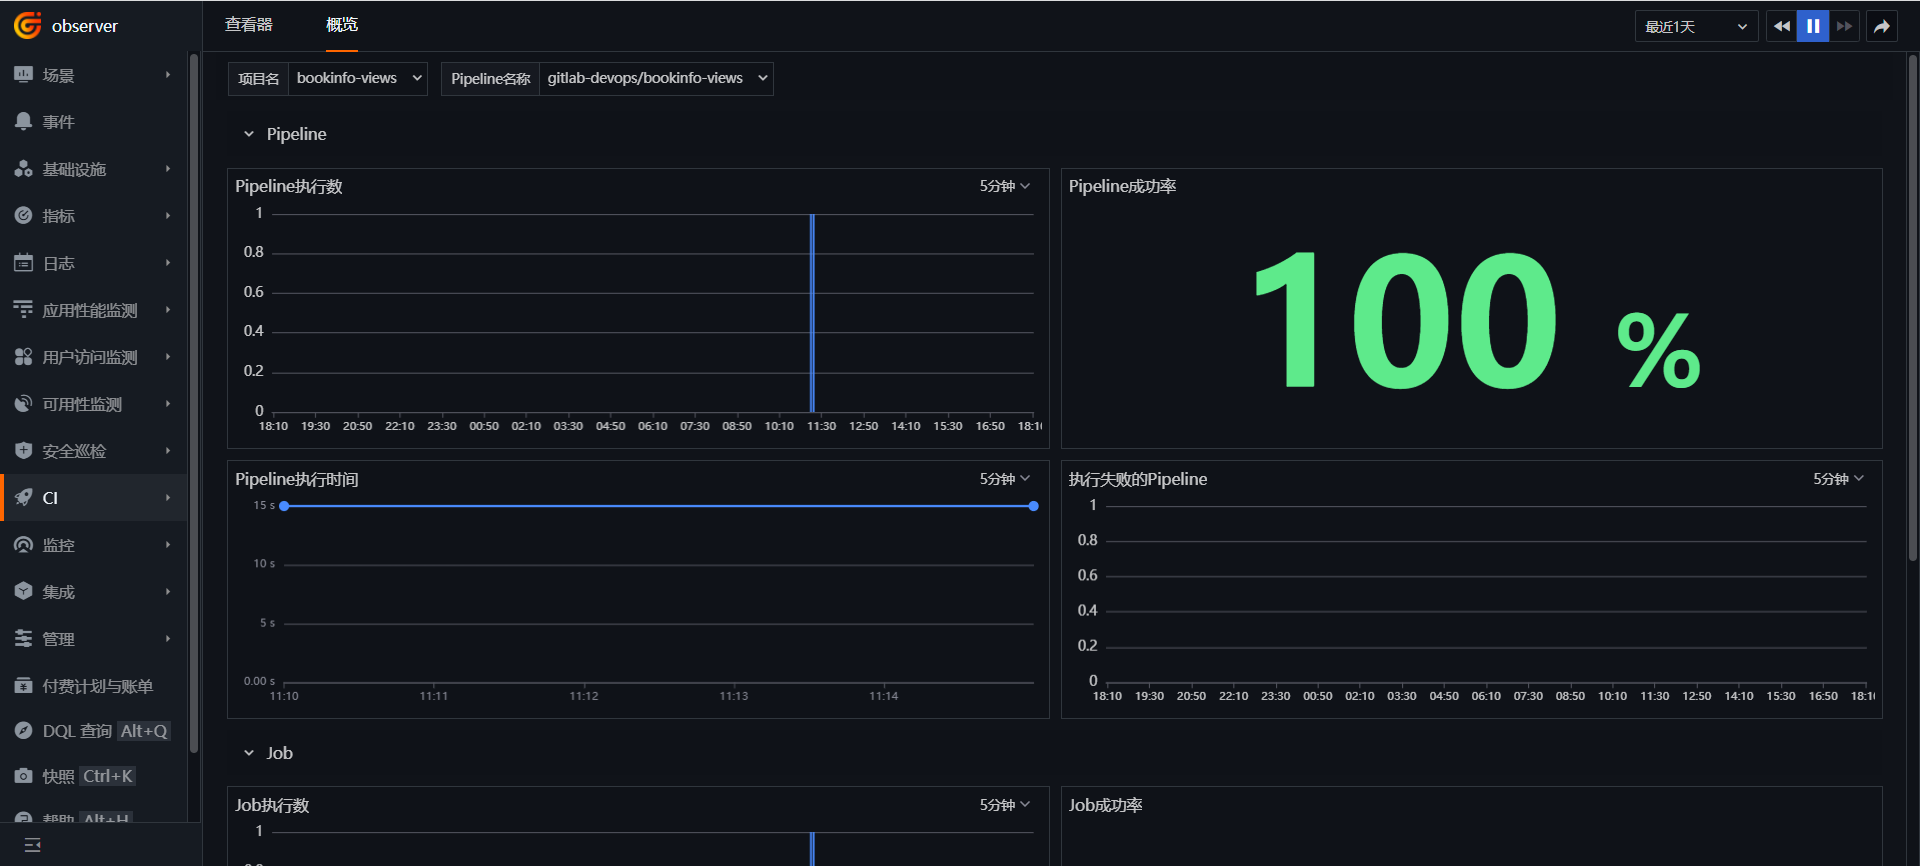
「Guance」에 로그인하여 「CI」로 이동합니다. 「개요」를 클릭하고 bookinfo-views 프로젝트를 선택하여 Pipeline 및 Job의 실행 상태를 확인합니다.
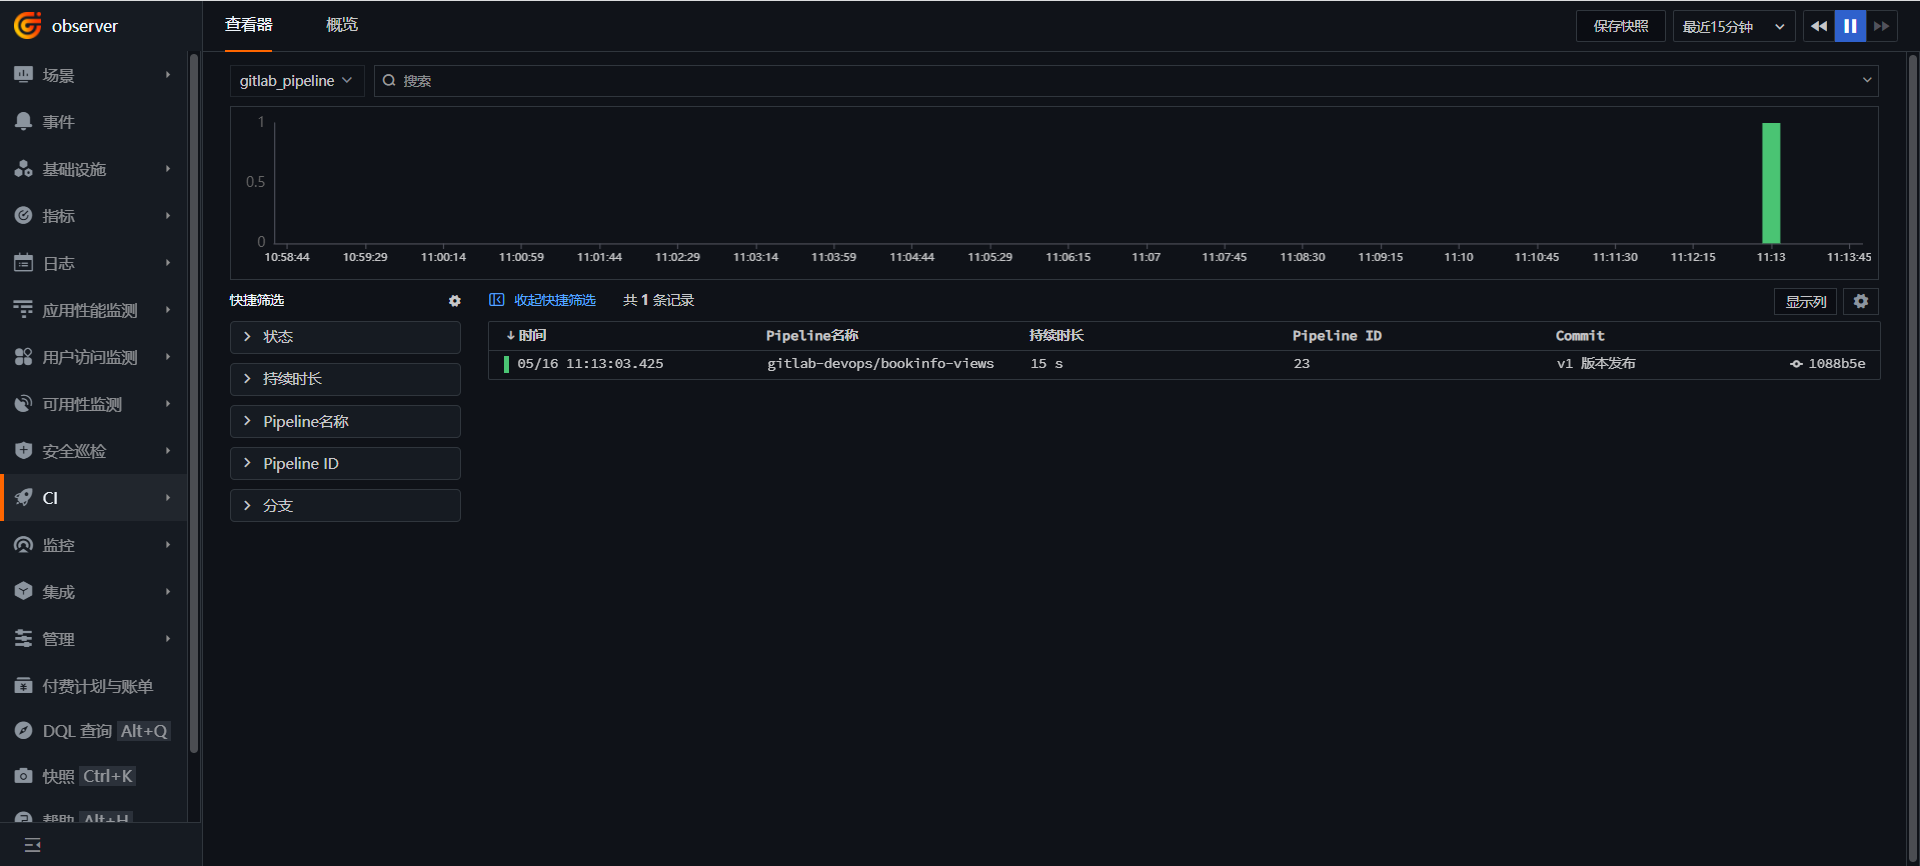
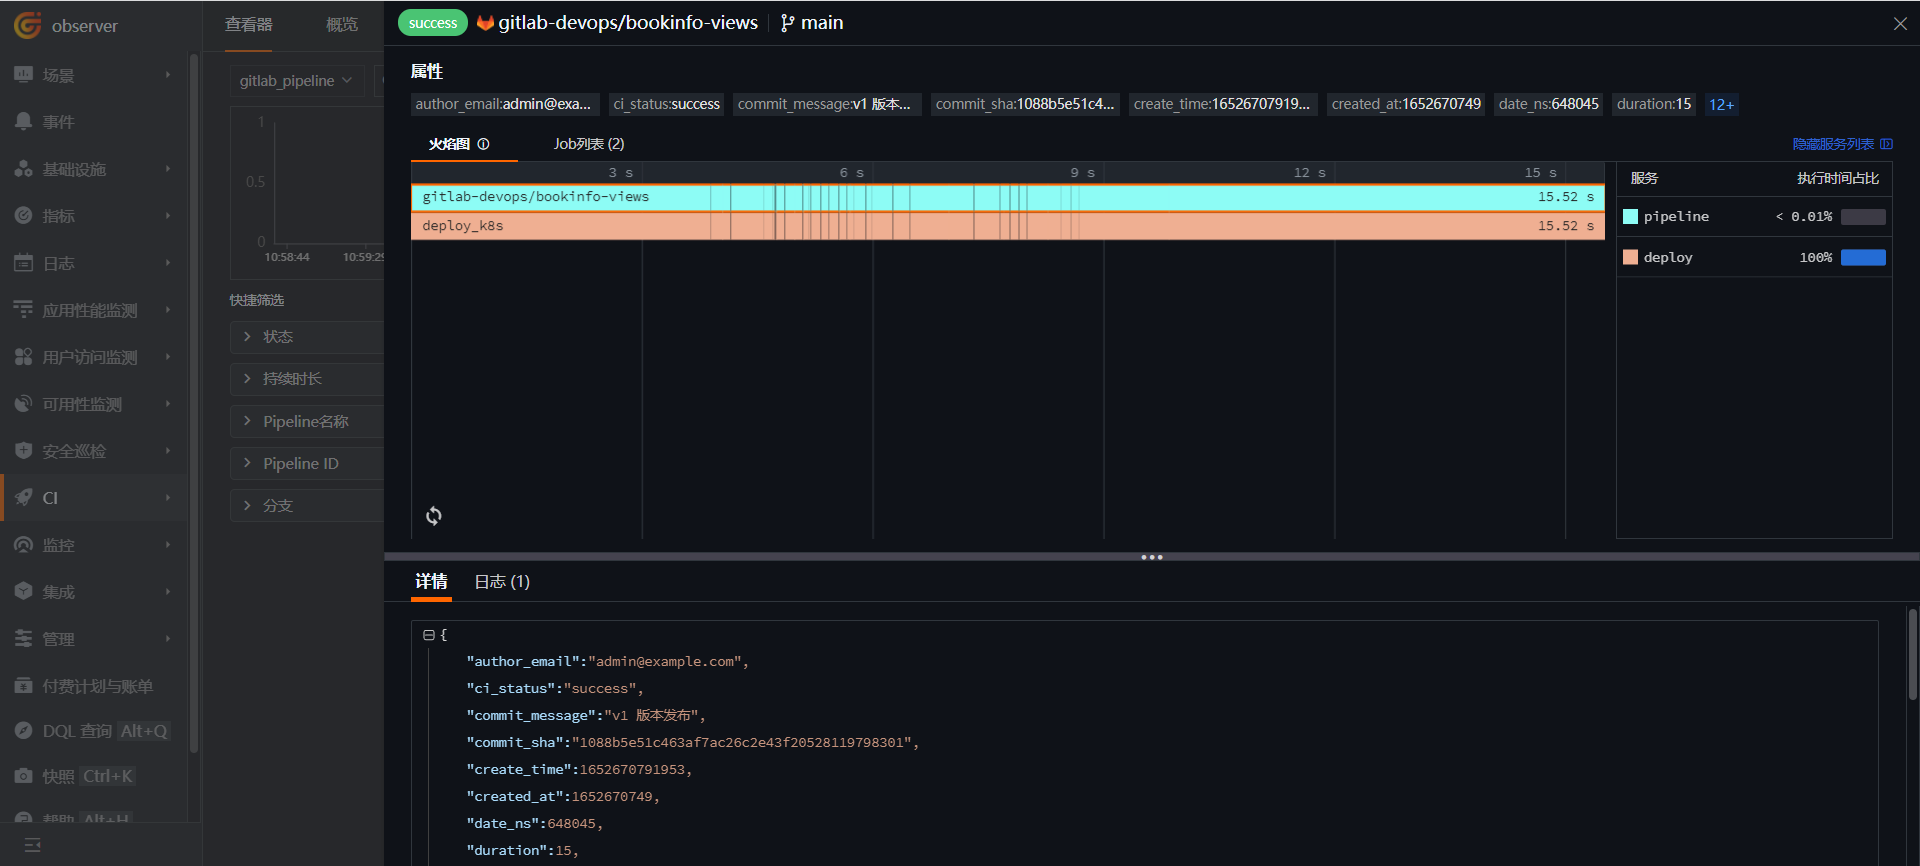
「CI」로 이동하여 「탐색기」를 클릭하고 gitlab_pipeline을 선택합니다.
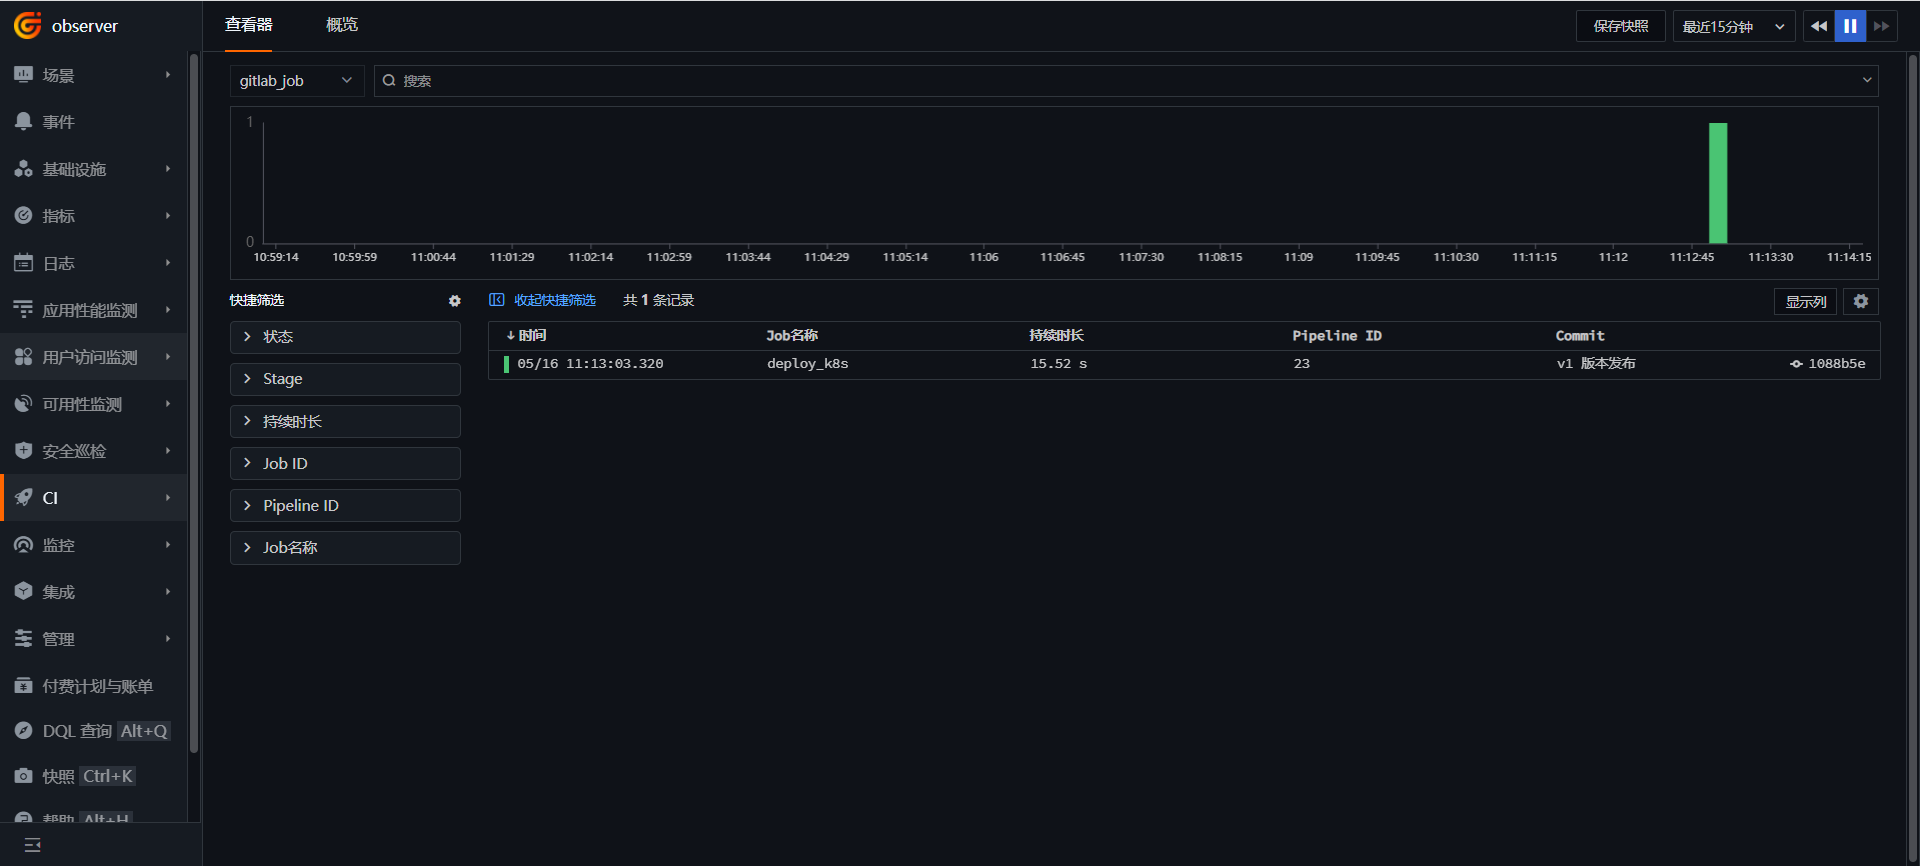
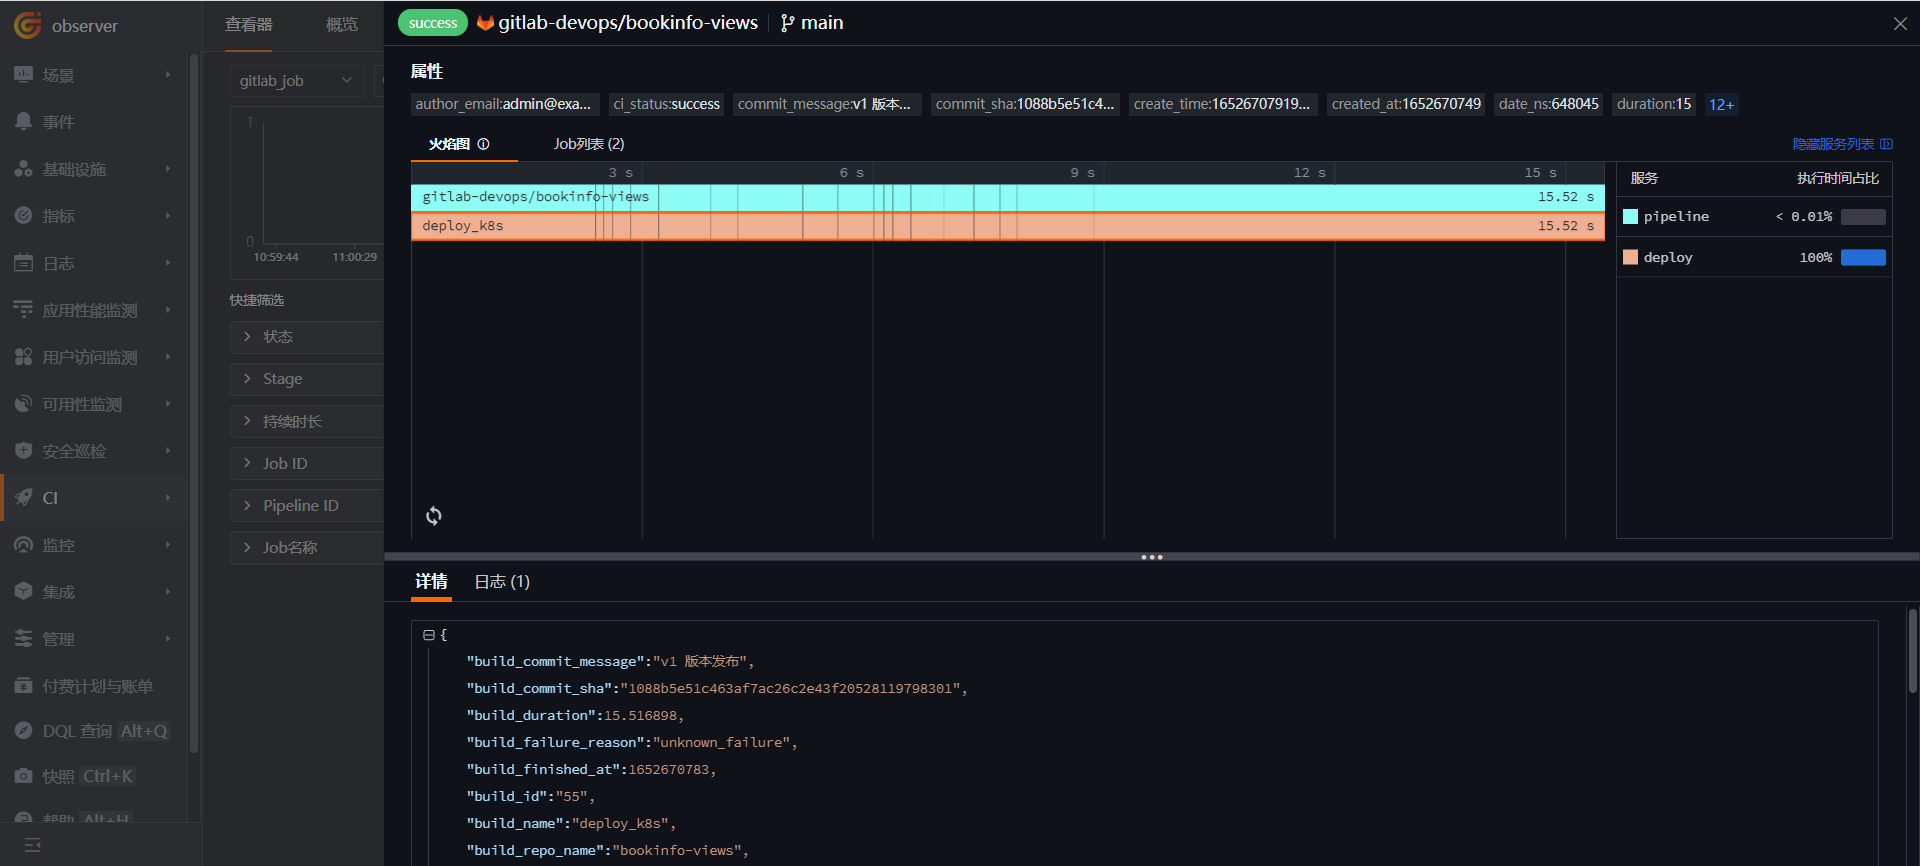
「CI」로 이동하여 「탐색기」를 클릭하고 gitlab_job을 선택합니다.
8단계: 카나리아 배포 관측 가능성
절차는 먼저 DestinationRule 및 VirtualService를 생성하여 트래픽을 reviews-v1 버전으로만 전달하고, reviews-v2를 배포한 후 10%의 트래픽을 reviews-v2로 전환합니다. Guance을 통해 검증이 완료되면 모든 트래픽을 reviews-v2로 전환하고 reviews-v1을 제거합니다.
8.1 DestinationRule 생성
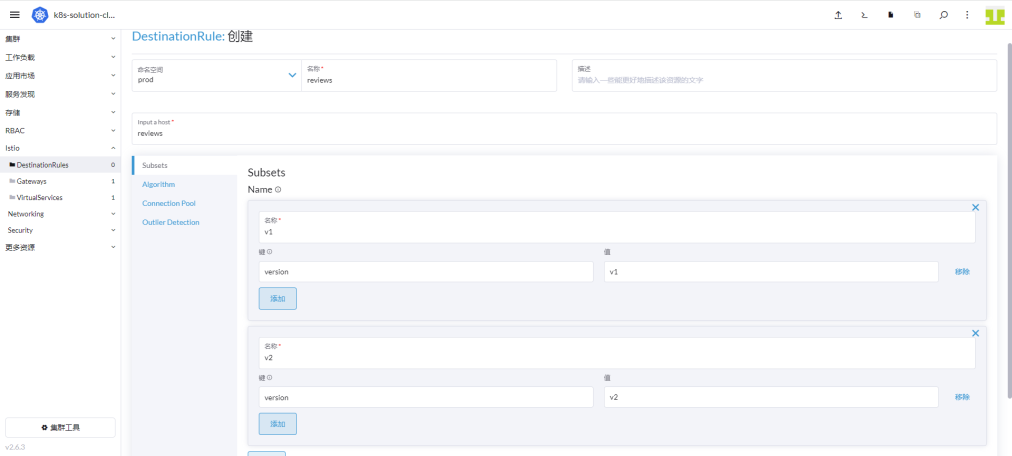
「Rancher」에 로그인 → 「클러스터」 → 「Istio」 → 「DestinationRule」로 이동하여 「생성」을 클릭합니다.
네임스페이스에 「prod」를 입력하고 이름에 「reviews」를 입력합니다. Input a host에 「reviews」를 입력하고 「Subset v1」 및 「Subset v2」를 추가합니다. 자세한 내용은 아래 그림과 같으며, 마지막으로 「생성」을 클릭합니다.
8.2 VirtualService 생성
「Rancher」에 로그인 → 「클러스터」 → 「Istio」 → 「VirtualServices」로 이동하여 상단의 「YAML 가져오기」 아이콘을 클릭하고 다음 내용을 입력한 후 「가져오기」를 클릭합니다.
apiVersion: networking.istio.io/v1alpha3
kind: VirtualService
metadata:
  name: reviews
  namespace: prod
spec:
  hosts:
    - reviews
  http:
    - route:
        - destination:
            host: reviews
            subset: v1
8.3 reviews-v2 버전 배포
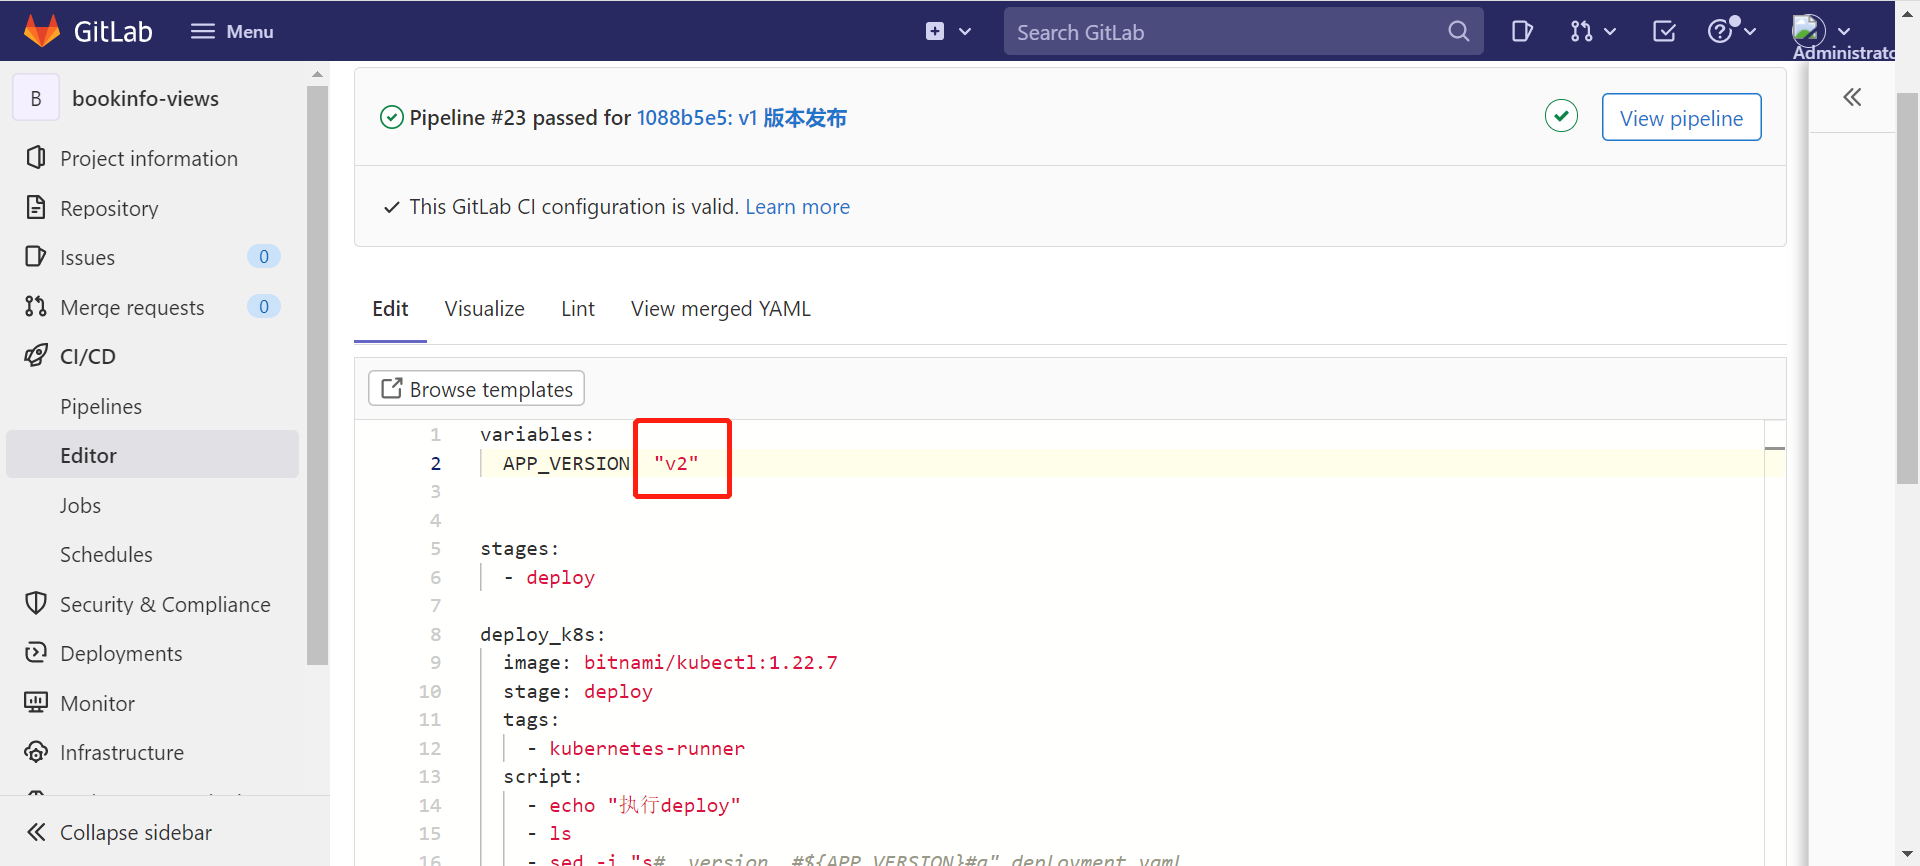
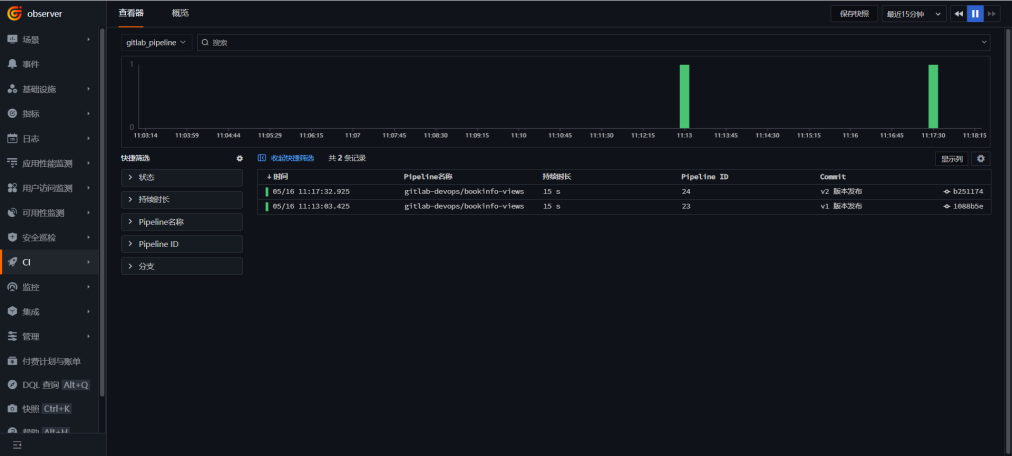
「gitlab」에 로그인하여 bookinfo-views 프로젝트를 찾습니다. .gitlab-ci.yml 파일에서 APP_VERSION 값을 v2로 변경하고 코드를 한 번 커밋합니다.
「Guance」에 로그인하여 「CI」 → 「탐색기」로 이동하면 v2 버전이 배포된 것을 확인할 수 있습니다.
8.4 트래픽을 reviews-v2 버전으로 전환
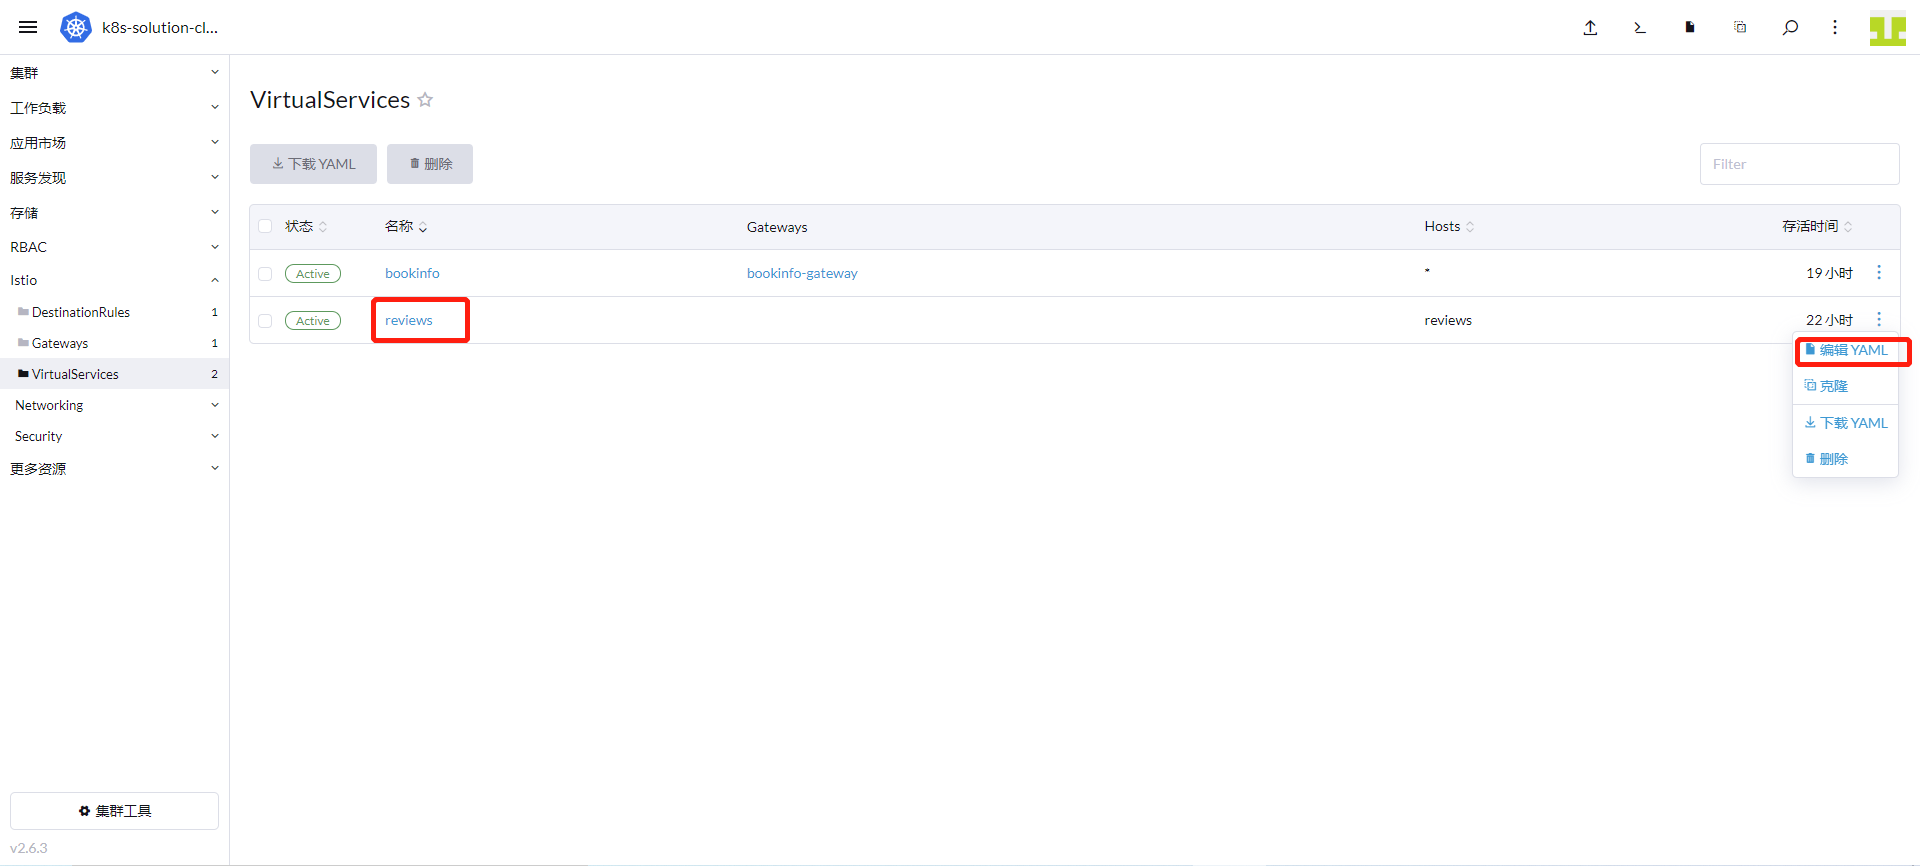
「Rancher」 → 「클러스터」 → 「Istio」 → 「VirtualServices」로 이동하여 reviews 오른쪽의 「YAML 편집」을 클릭합니다.
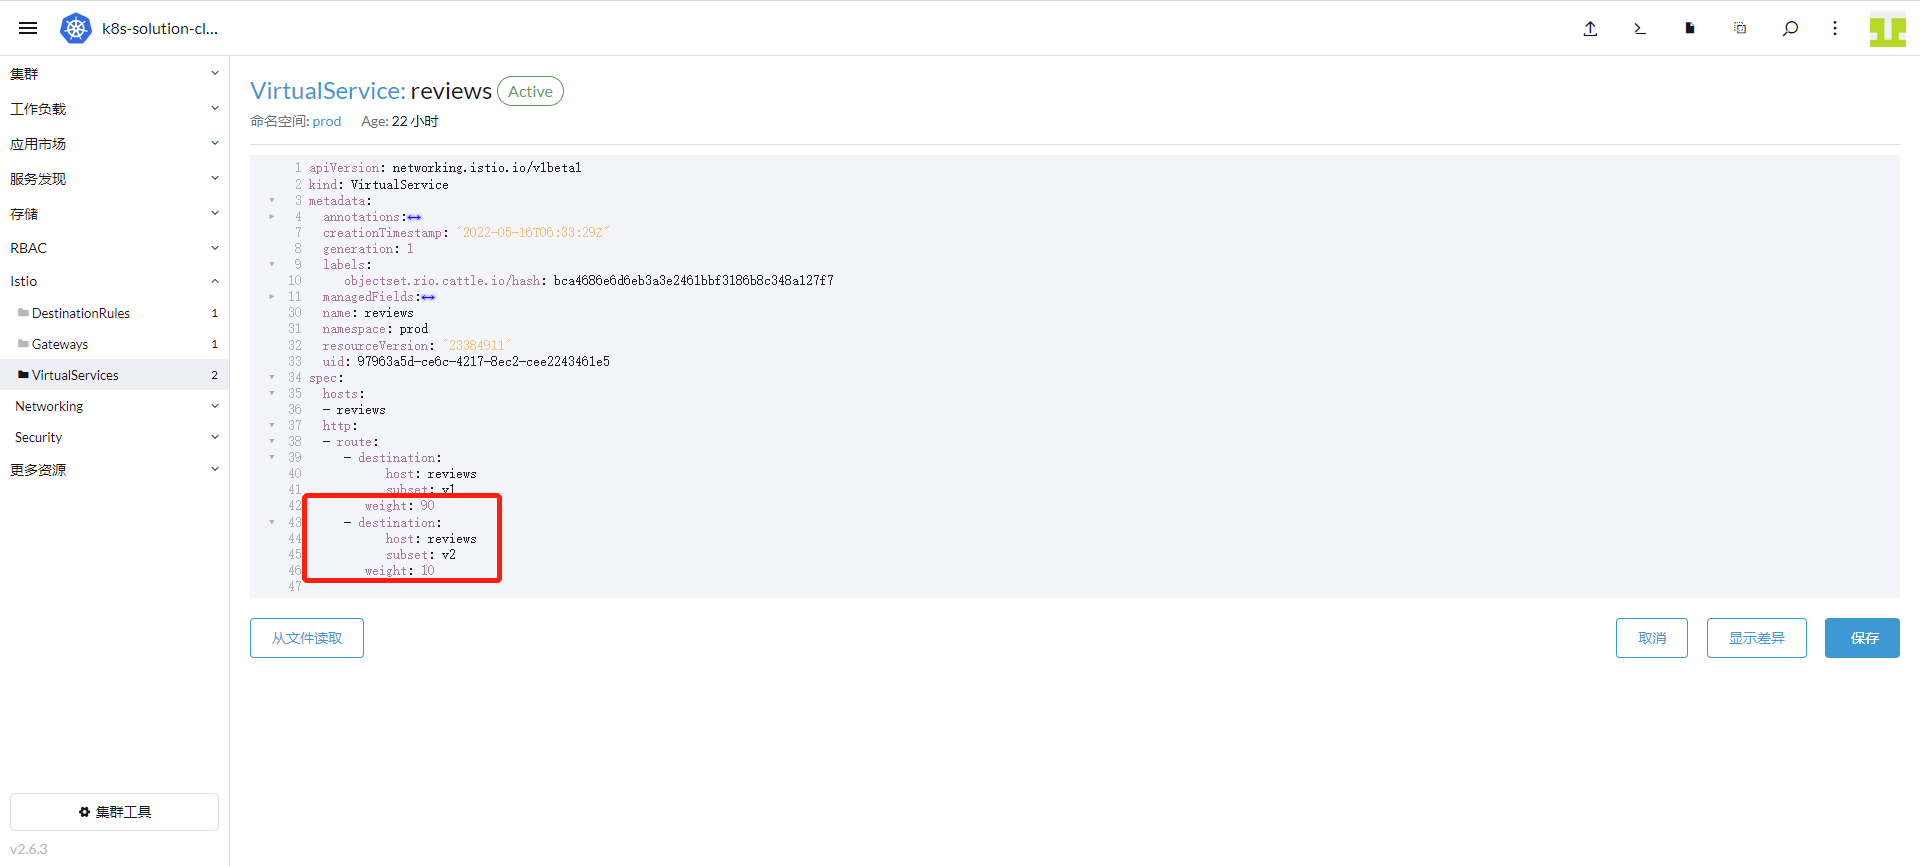
v1 가중치는 90, v2 가중치는 10으로 설정한 후 「저장」을 클릭합니다.
8.5 reviews-v2 실행 상태 관측
「Guance」에 로그인하여 「APM」 모듈로 이동하고 오른쪽 상단의 아이콘을 클릭합니다.
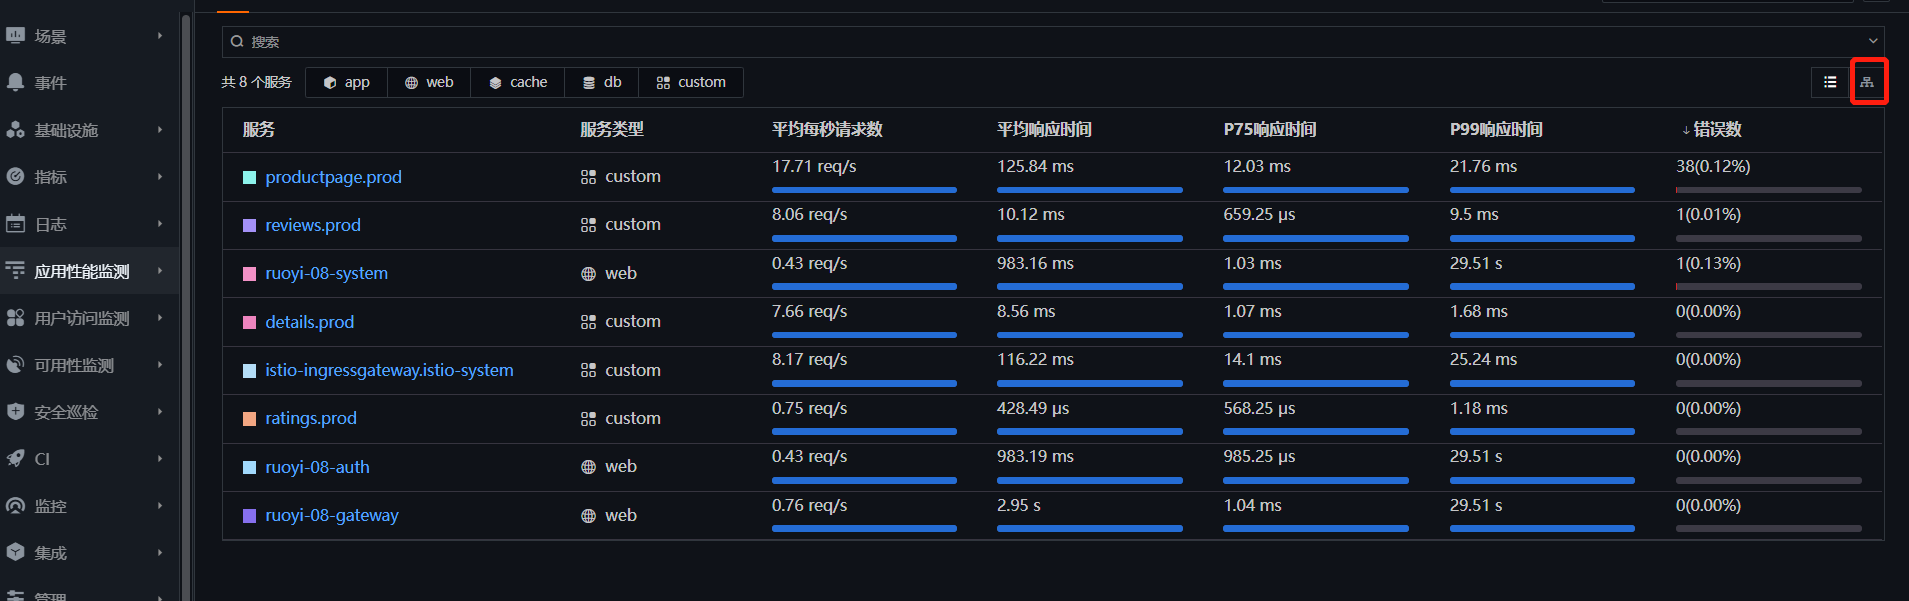
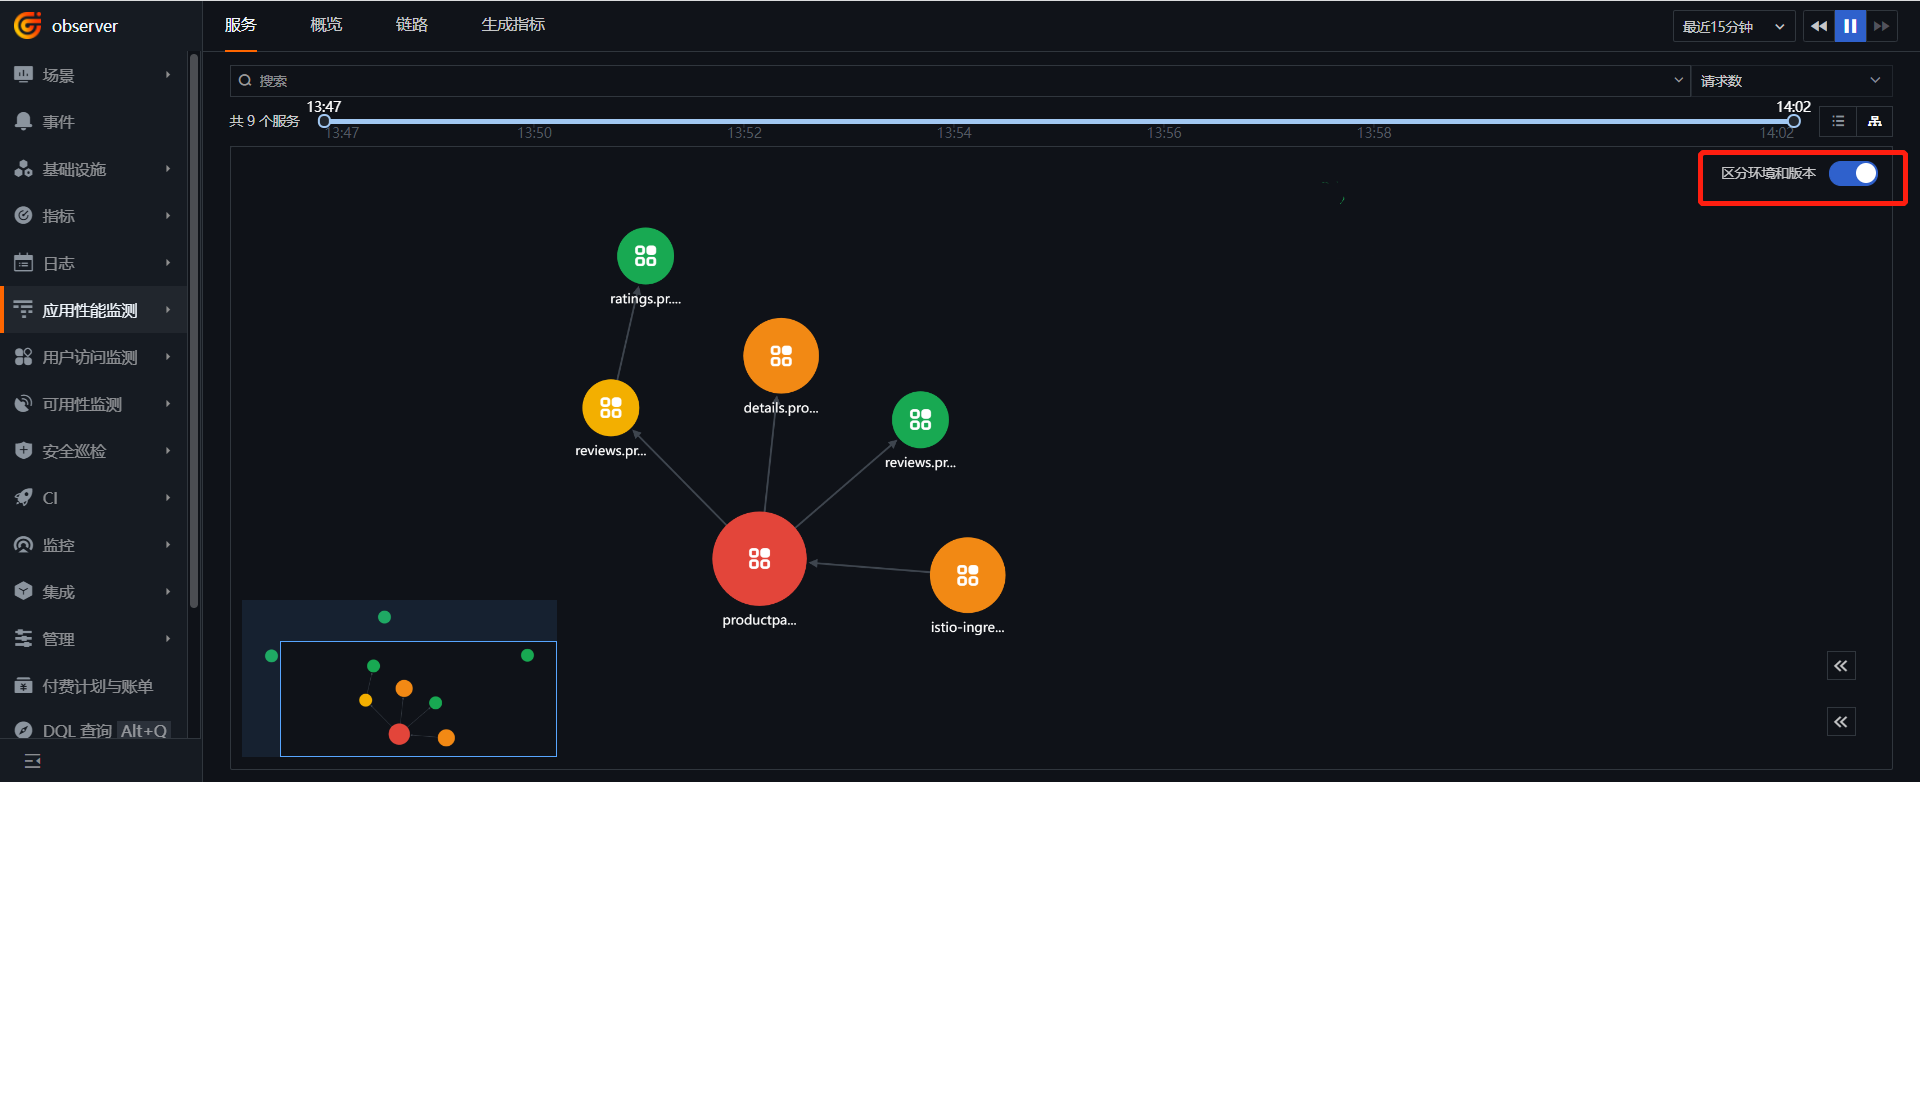
「환경 및 버전 구분」을 활성화하고 bookinfo의 호출 토폴로지 뷰를 확인합니다.
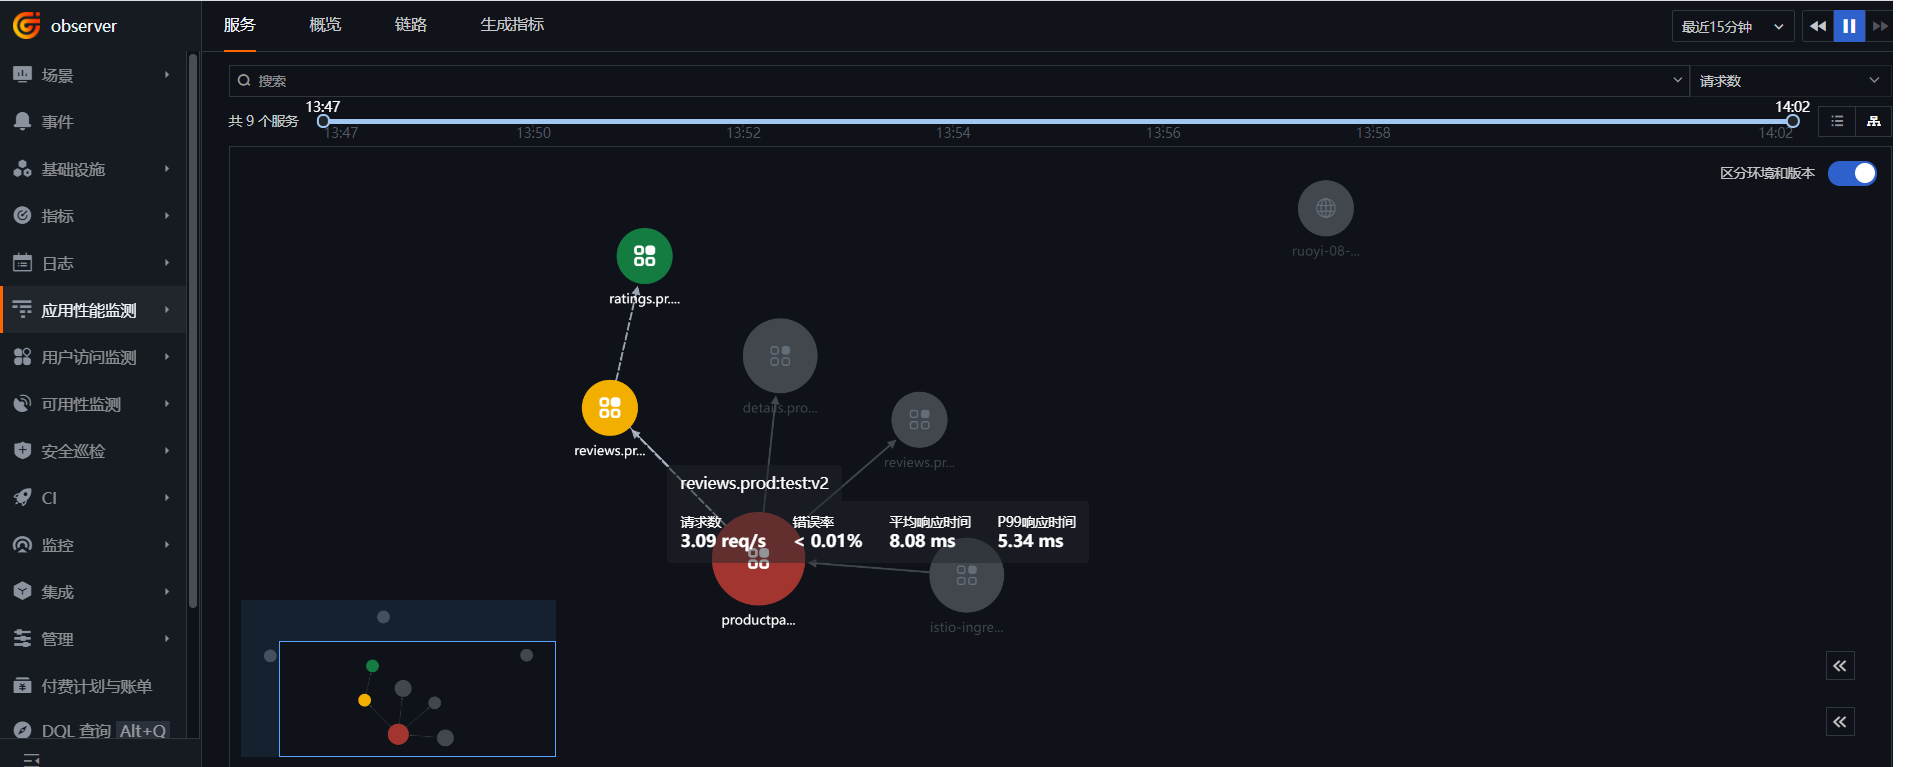
reviews-v2를 마우스로 클릭하면 v2가 ratings에 연결되어 있고 reviews-v1은 ratings를 호출하지 않는 것을 확인할 수 있습니다.
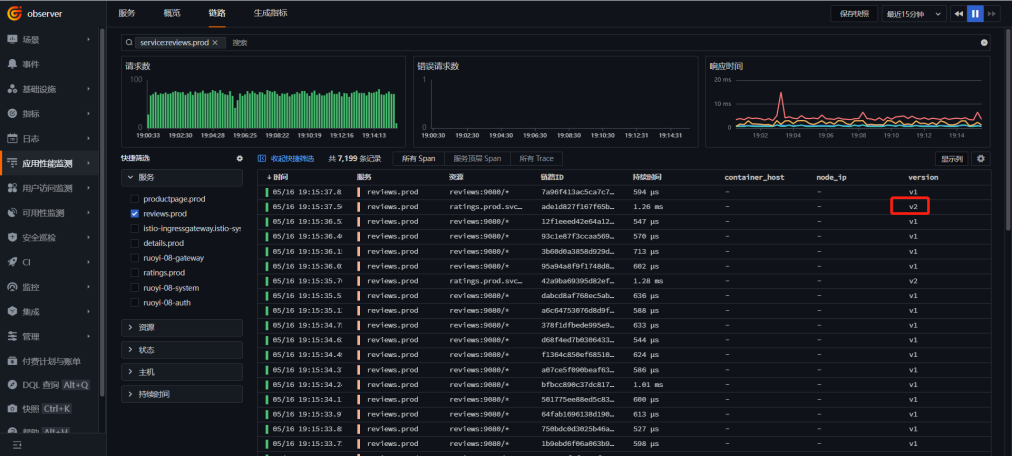
「트레이스」를 클릭하고 「reviews.prod」 서비스를 선택한 후 "v2" 버전이 포함된 트레이스를 클릭하여 들어갑니다.
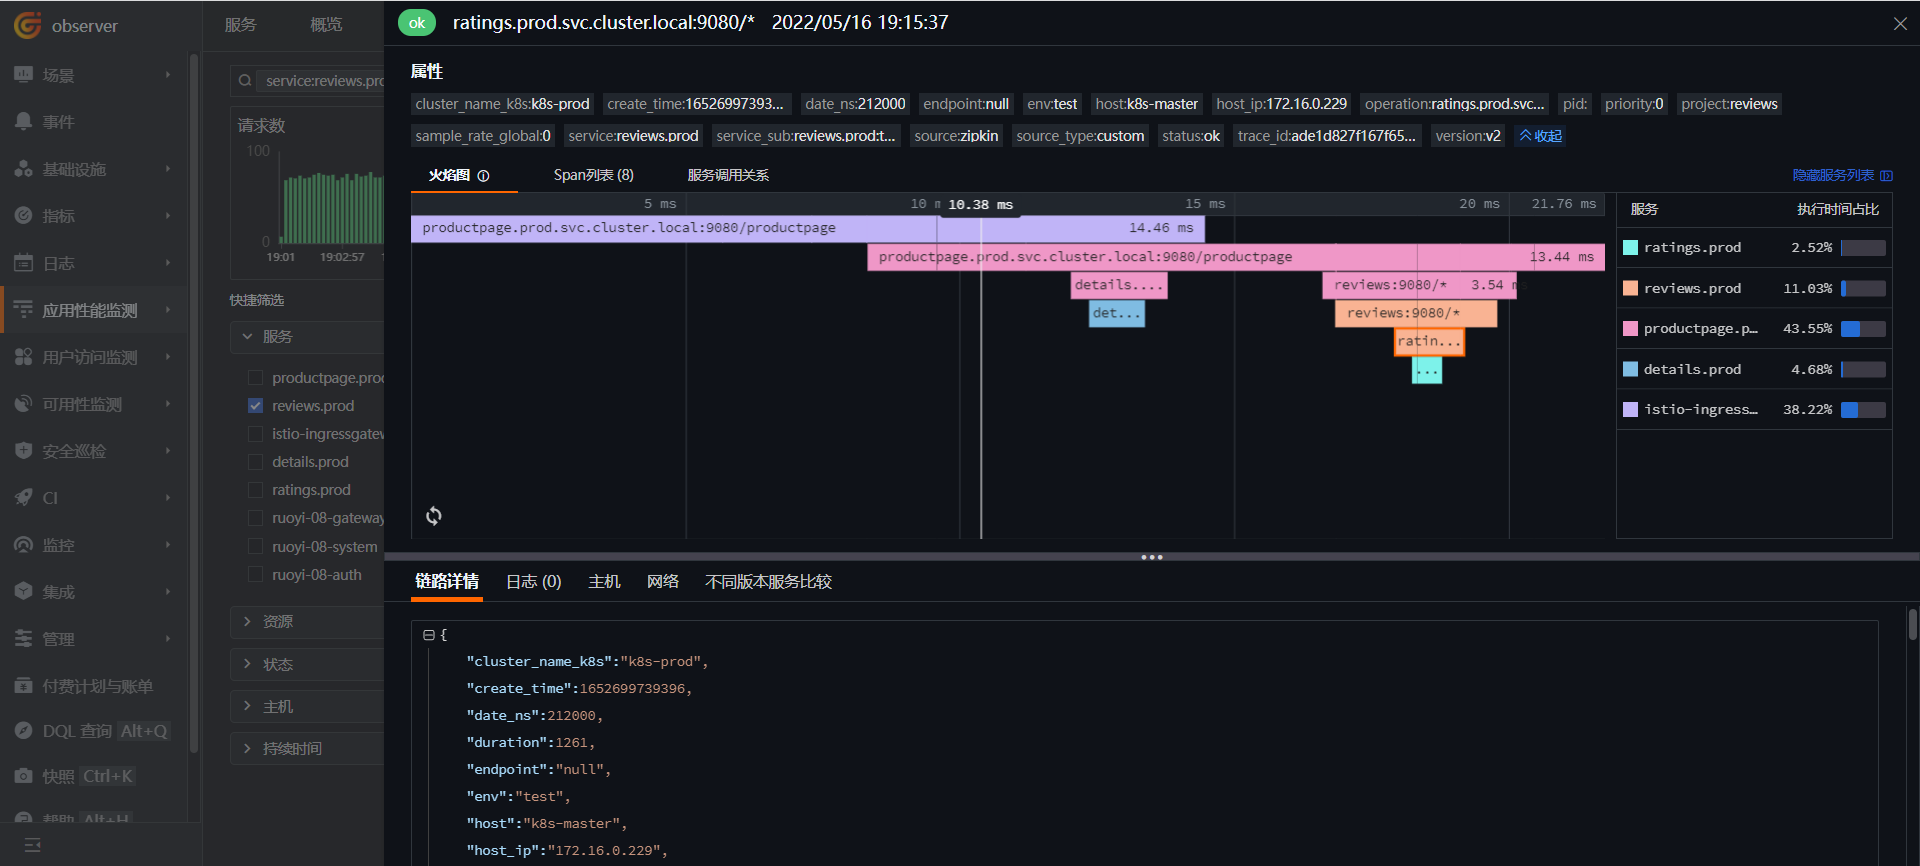
플레임 그래프를 확인합니다.
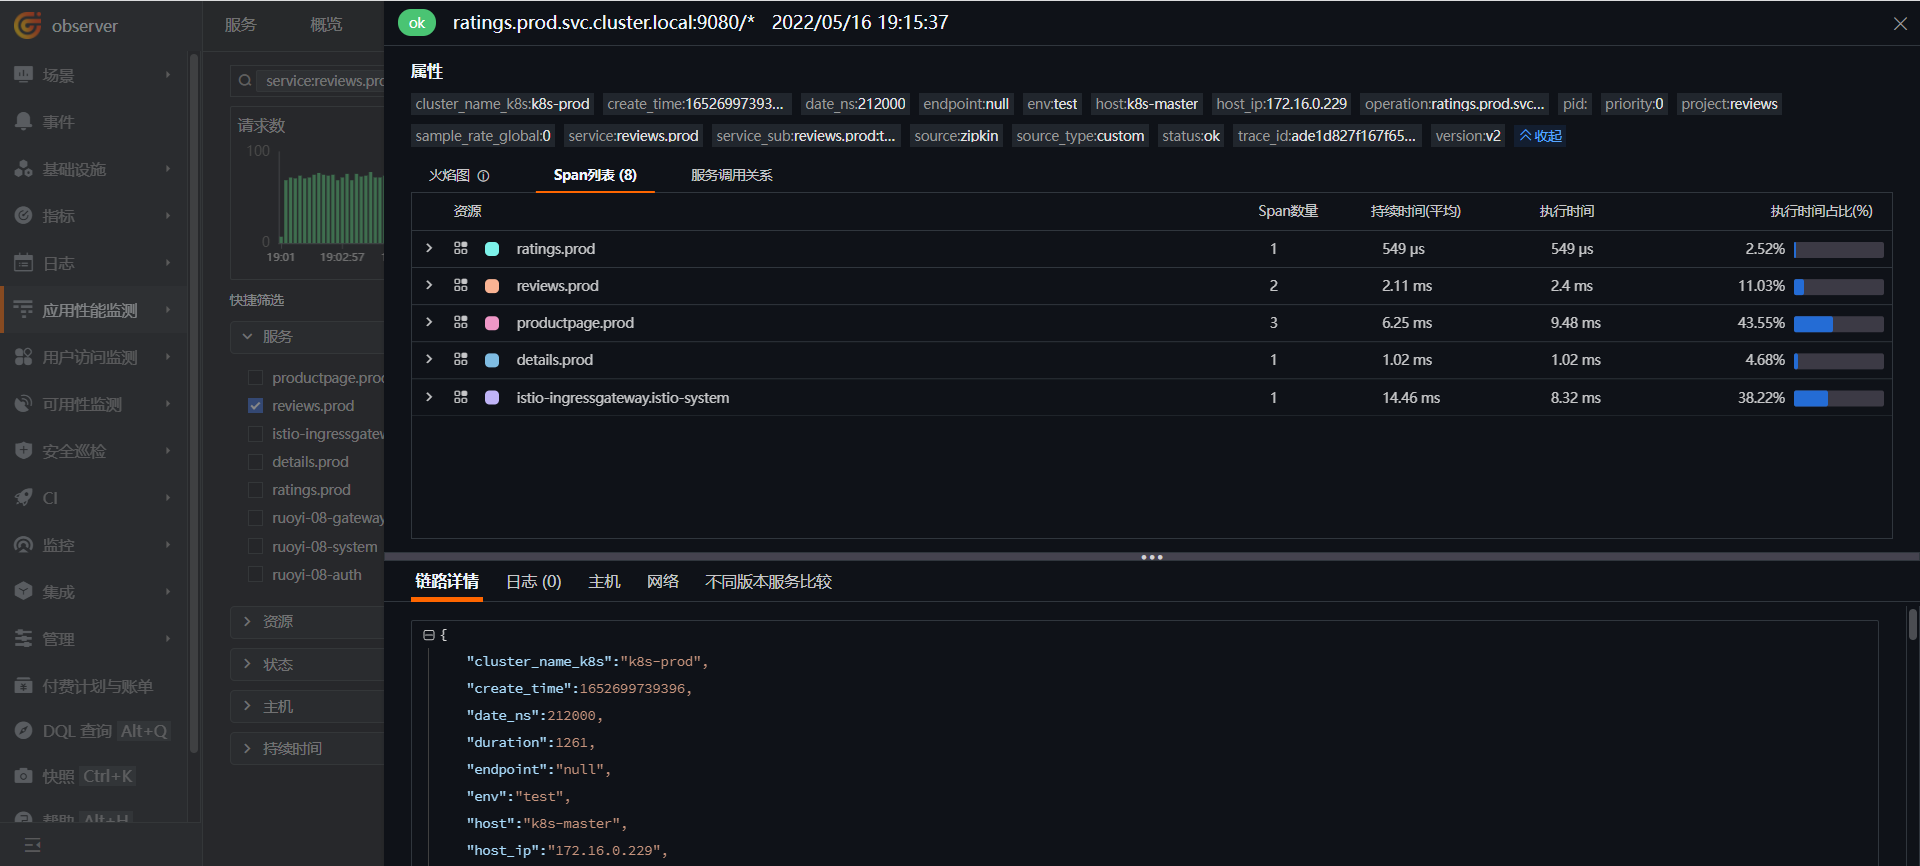
Span 목록을 확인합니다.
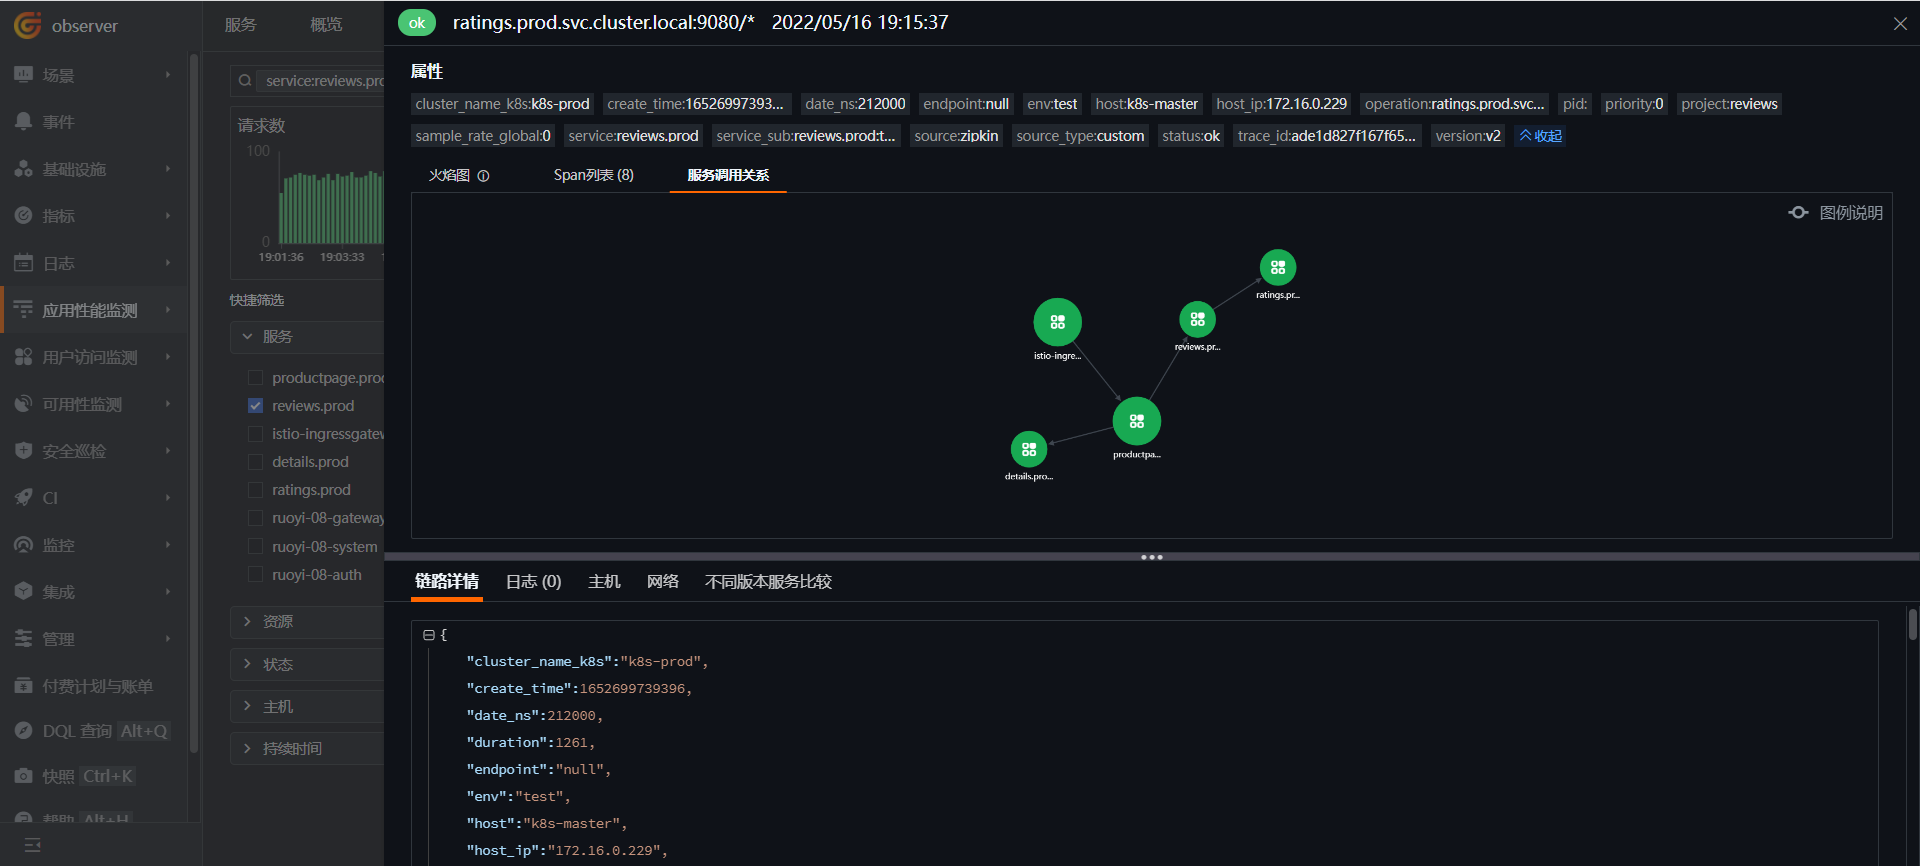
서비스 호출 관계를 확인합니다.
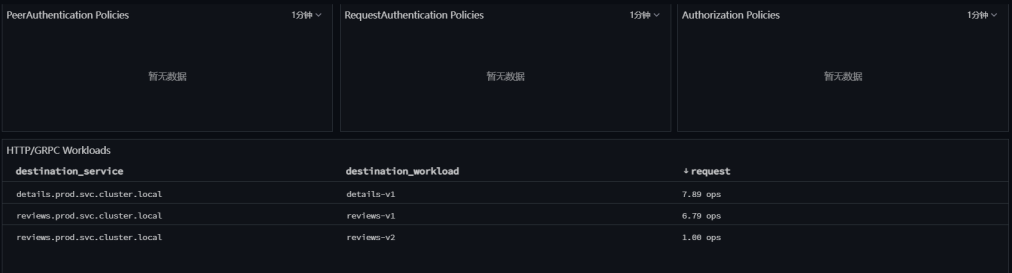
Istio Mesh 모니터링 뷰에서도 서비스 호출 상태를 확인할 수 있으며, v1 및 v2 버전의 트래픽 비율은 기본적으로 9:1입니다.
8.6 배포 완료
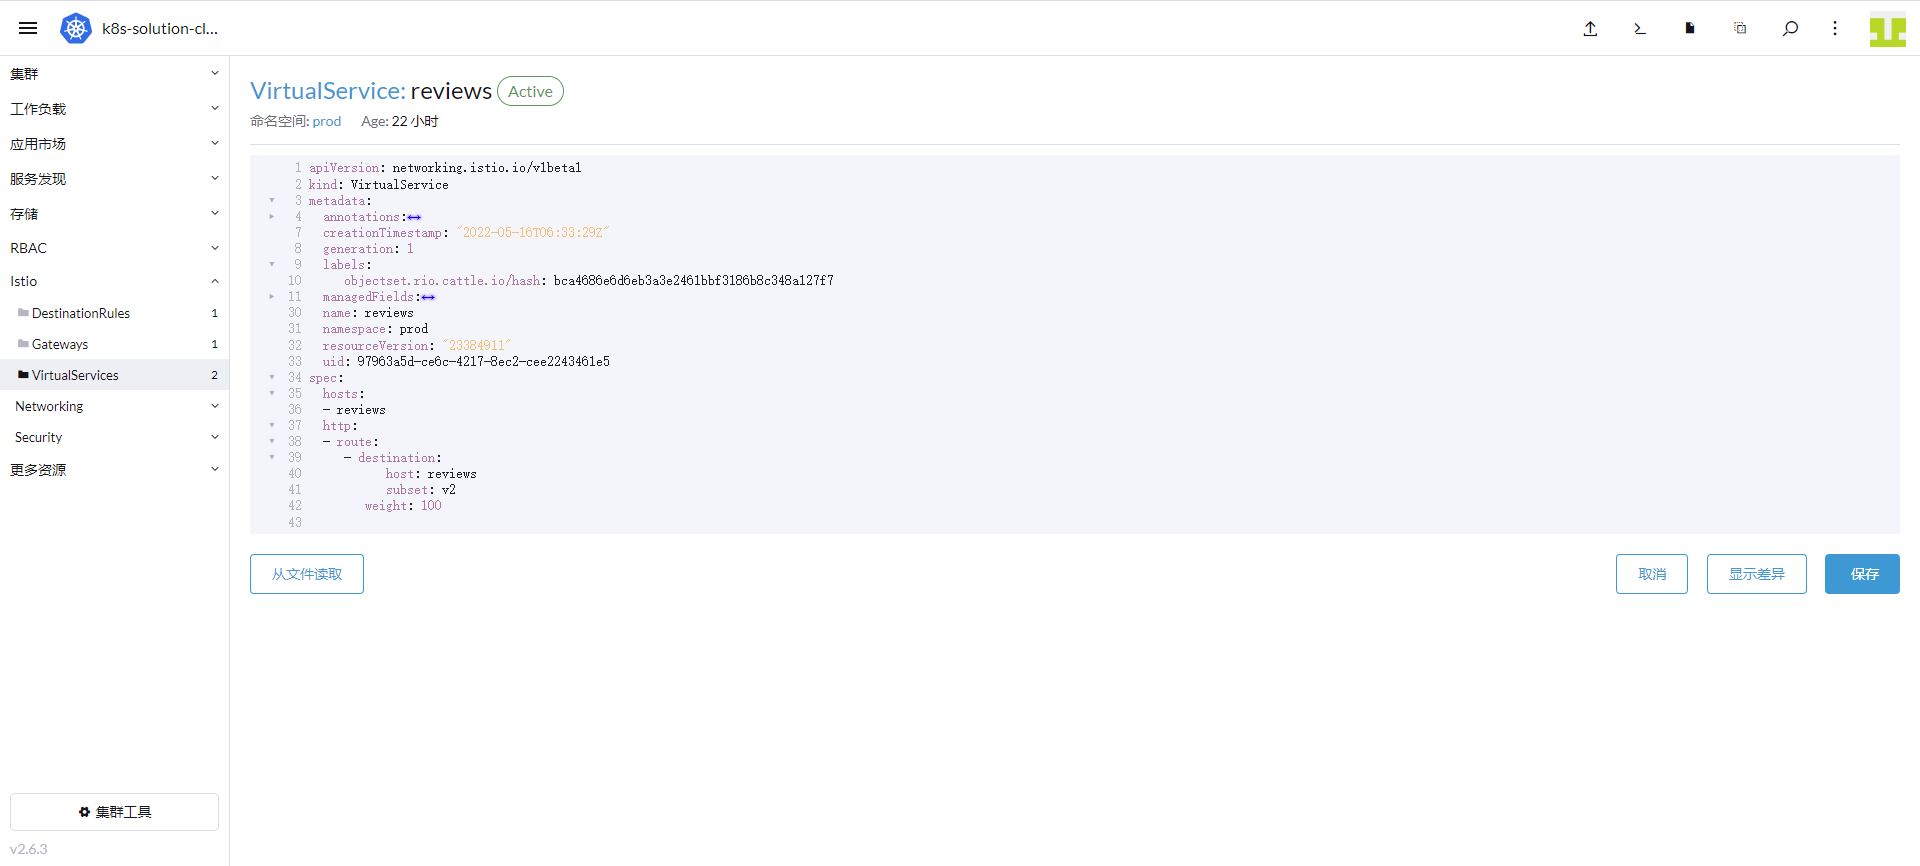
Guance에서의 작업을 통해 이번 배포가 예상대로 진행되었습니다. 「Rancher」 → 「클러스터」 → 「Istio」 → 「VirtualServices」로 이동하여 reviews 오른쪽의 「YAML 편집」을 클릭하고 "v2" 가중치를 100으로 설정하고 "v1"을 제거한 후 「저장」을 클릭합니다.
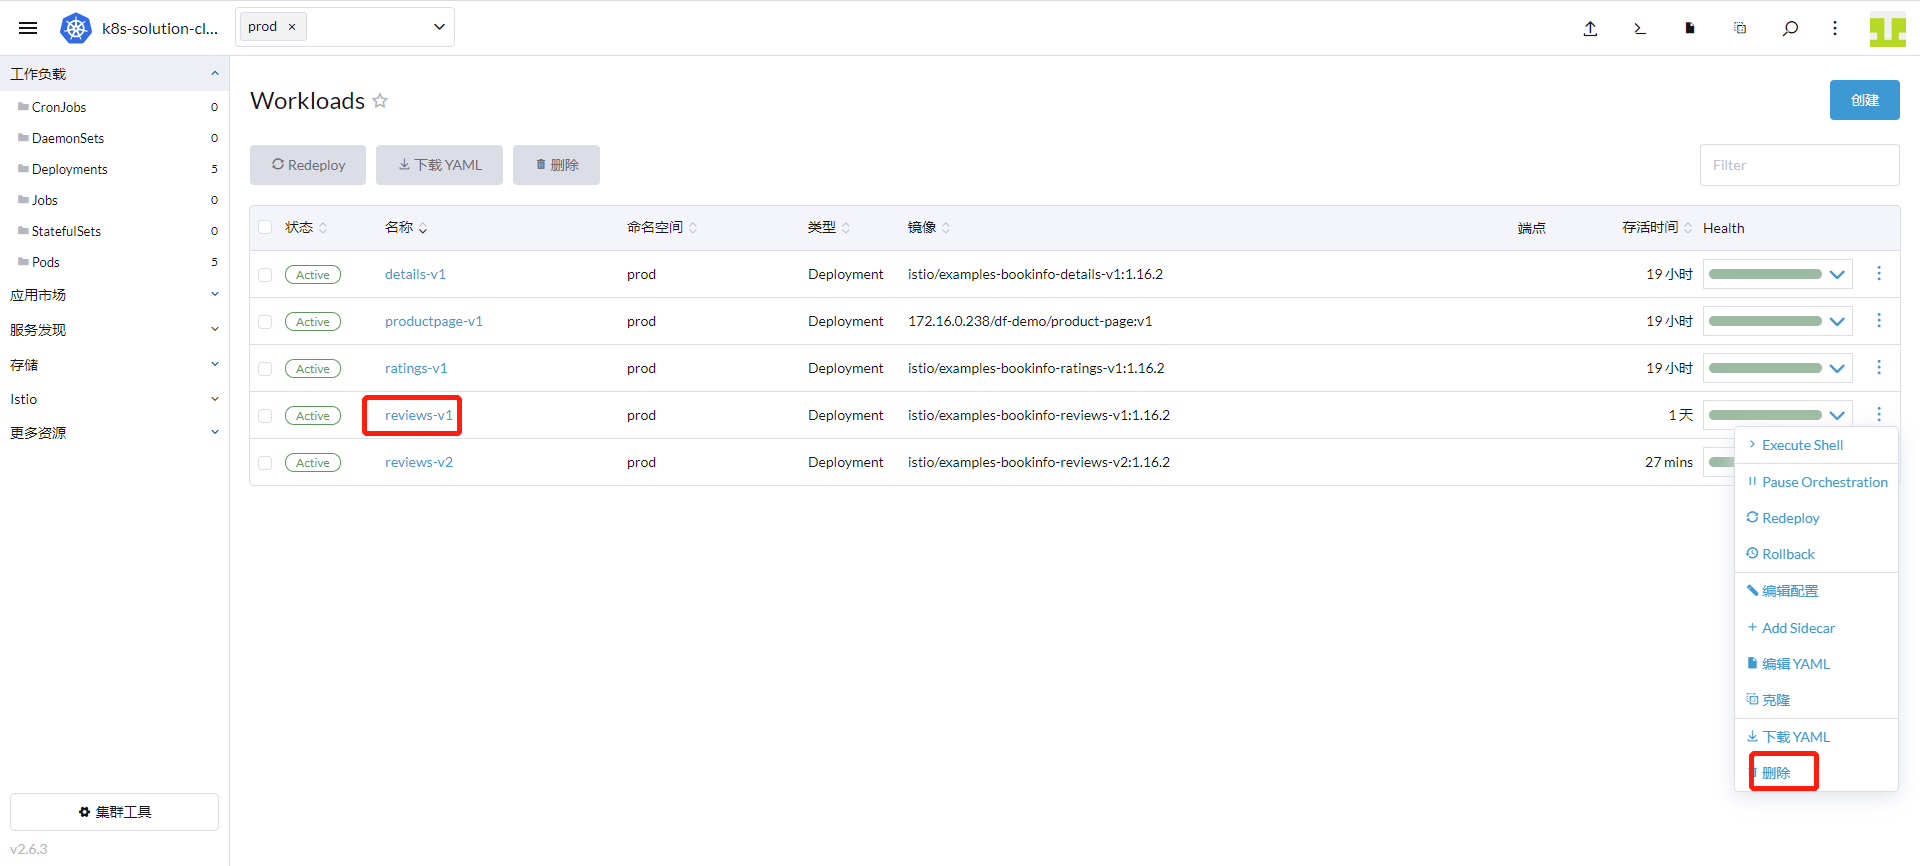
「클러스터」 → 「워크로드」 → 「Deployments」로 이동하여 "reviews-v1"을 찾아 「삭제」를 클릭합니다.