Real User Monitoring (RUM)
Real User Monitoring (RUM) is a real-time monitoring technology used to monitor user behavior and performance in web, mobile, and desktop applications.
- User behavior: RUM captures real user operations in web, mobile, and desktop applications, including page load time, network requests, user interactions, and error information.
- Performance analysis: Helps developers and enterprises analyze application performance, identify performance bottlenecks, and optimize user experience.
- Error management: Tracks and records errors and exceptions in applications in real time to help quickly locate and resolve issues.
- User experience: By analyzing user behavior from multiple dimensions (such as user journeys and Session Replay), you can gain a deeper understanding of user habits and improve application quality.
- Multi-platform support: Applicable to web, mobile applications (iOS, Android), Windows desktop applications, and the real-time monitoring needs of a range of platforms.
Data Sources
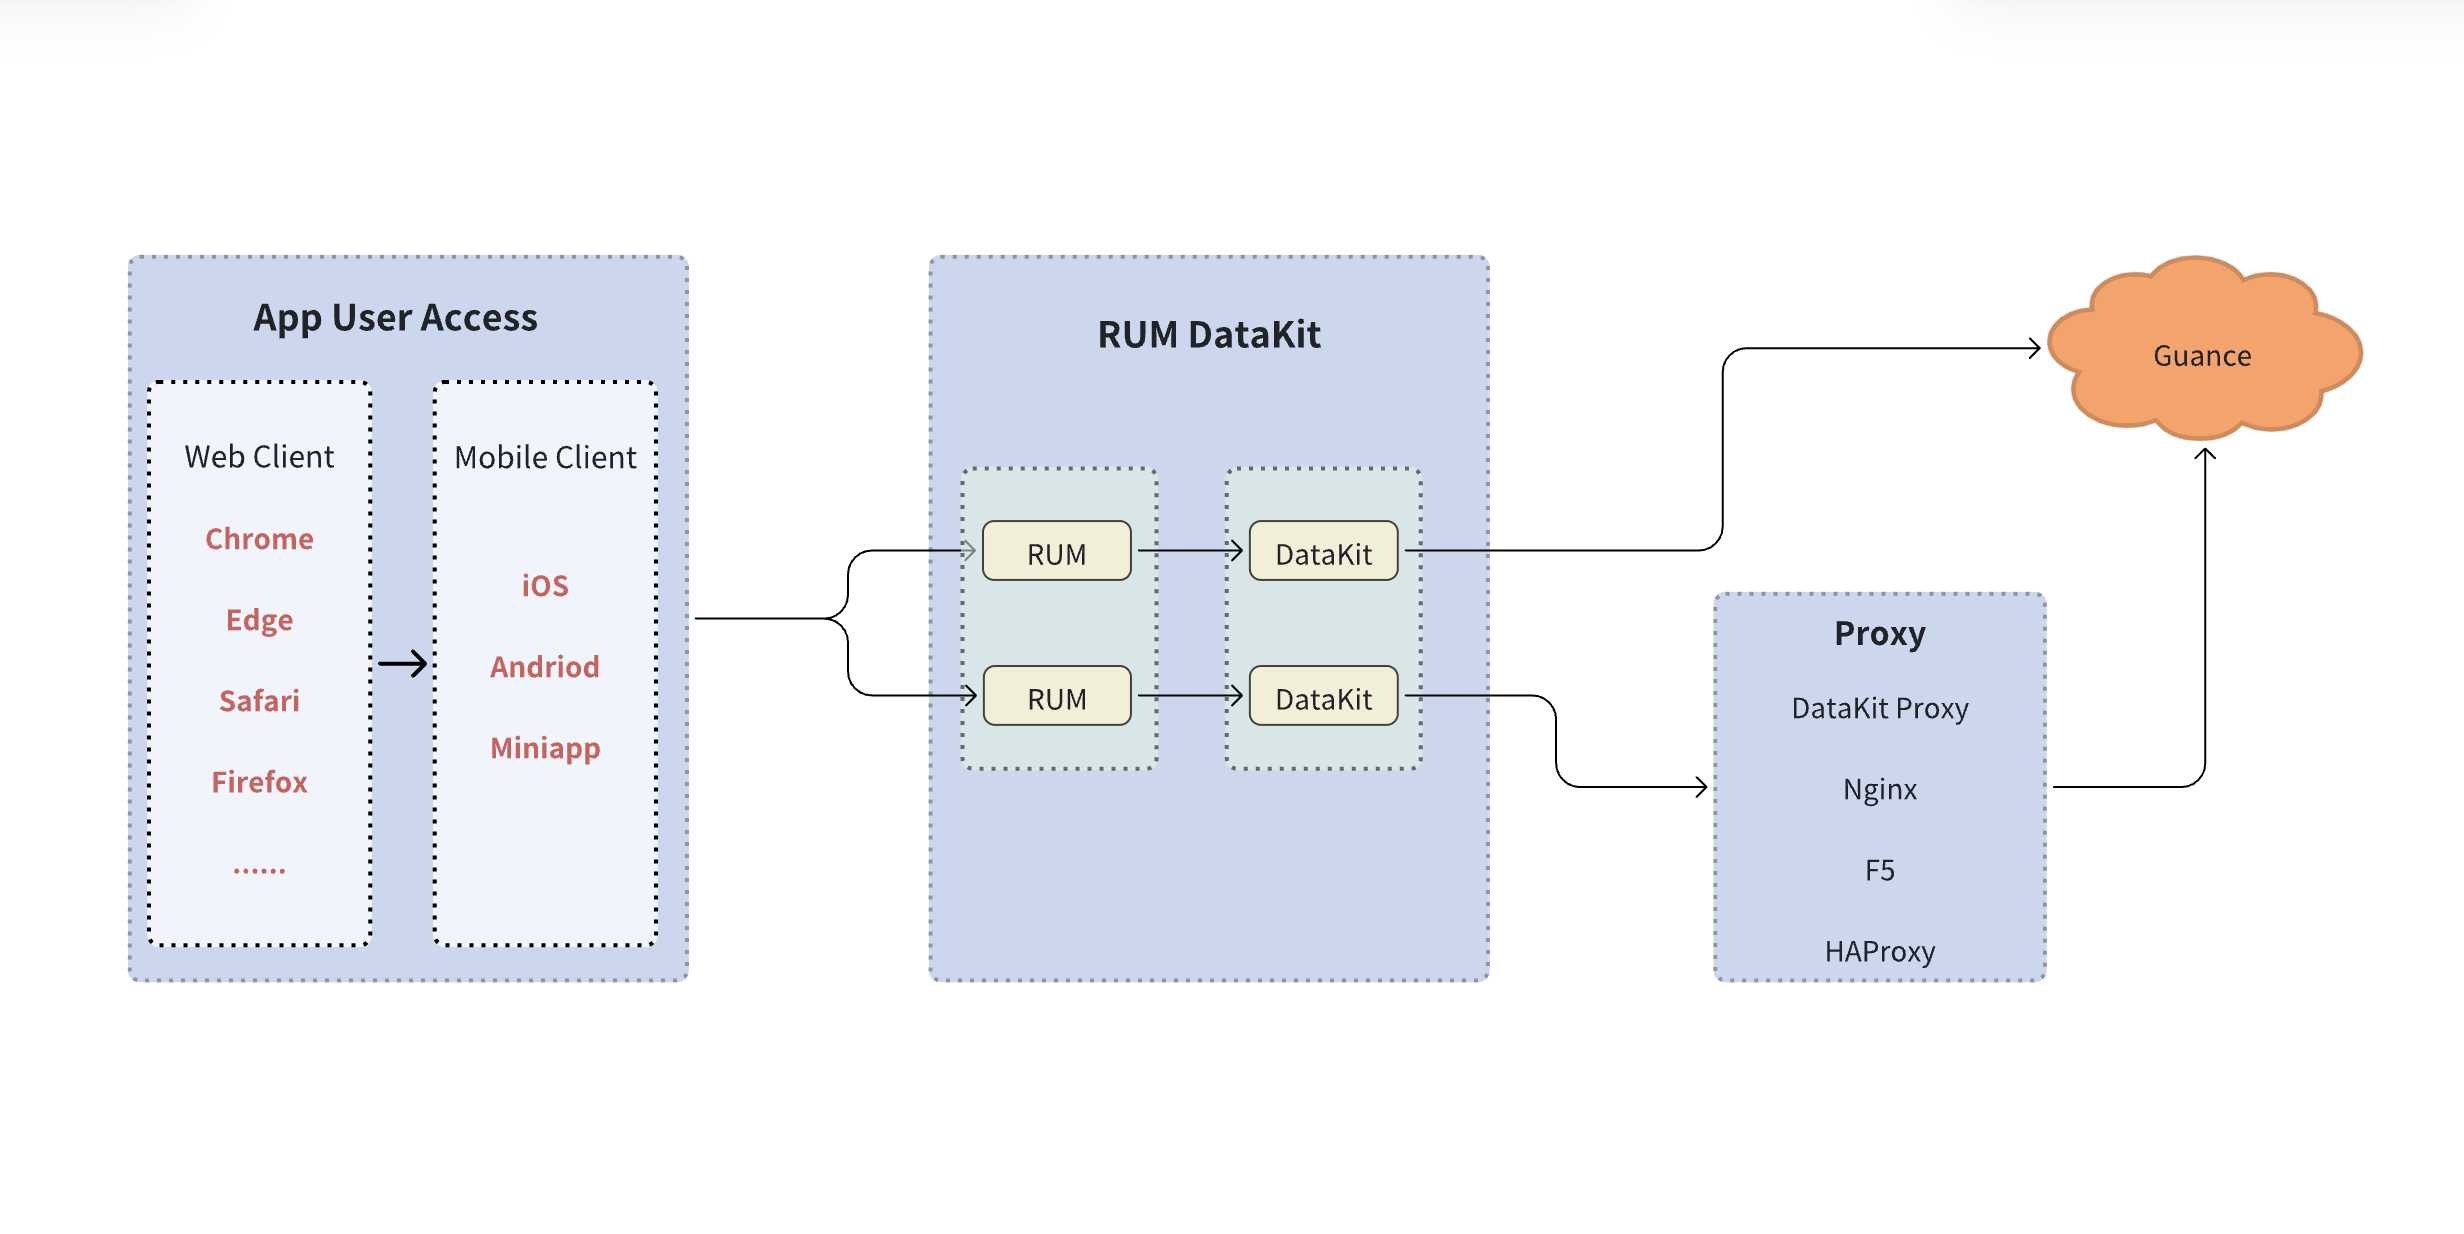
Through automated deployment of RUM Headless, user access data is collected from Web, Android, iOS, Windows, Mini Apps, and third-party frameworks.
How to Enable
- Deploy a public DataKit as the Agent to report client data to the workspace;
- Install DataKit;
- After the installation is complete, enable the RUM Collector;
- Add an application to start collecting user access data.
Application List
On the RUM > Application List page, created applications are displayed as cards, making it easy to browse and locate the applications you want to analyze. For how to create applications, see Configure.
Using the "Workspace" selector at the top, you can view applications from multiple authorized workspaces in the same site. Each card displays the source workspace. Applications with the same name or the same application ID in different workspaces are still displayed separately. List search, filtering, and statistics are based on the currently selected workspace scope.
When you enter the Explorer, Analysis Dashboards, or Session Heatmap, the workspace scope of the query and the source information of the selected application are retained. For how to select applications in cross-workspace queries, see Workspace and Application Scope.
When multiple workspaces are selected, or when only a workspace other than the current login workspace is selected, the page is read-only. You cannot create, edit, or delete applications, or modify SourceMap and settings. To manage applications, go to the workspace to which the applications belong and select only the current workspace. For related conditions, see Cross-Workspace Query.
Configure
Go to RUM > Application List > New Application.
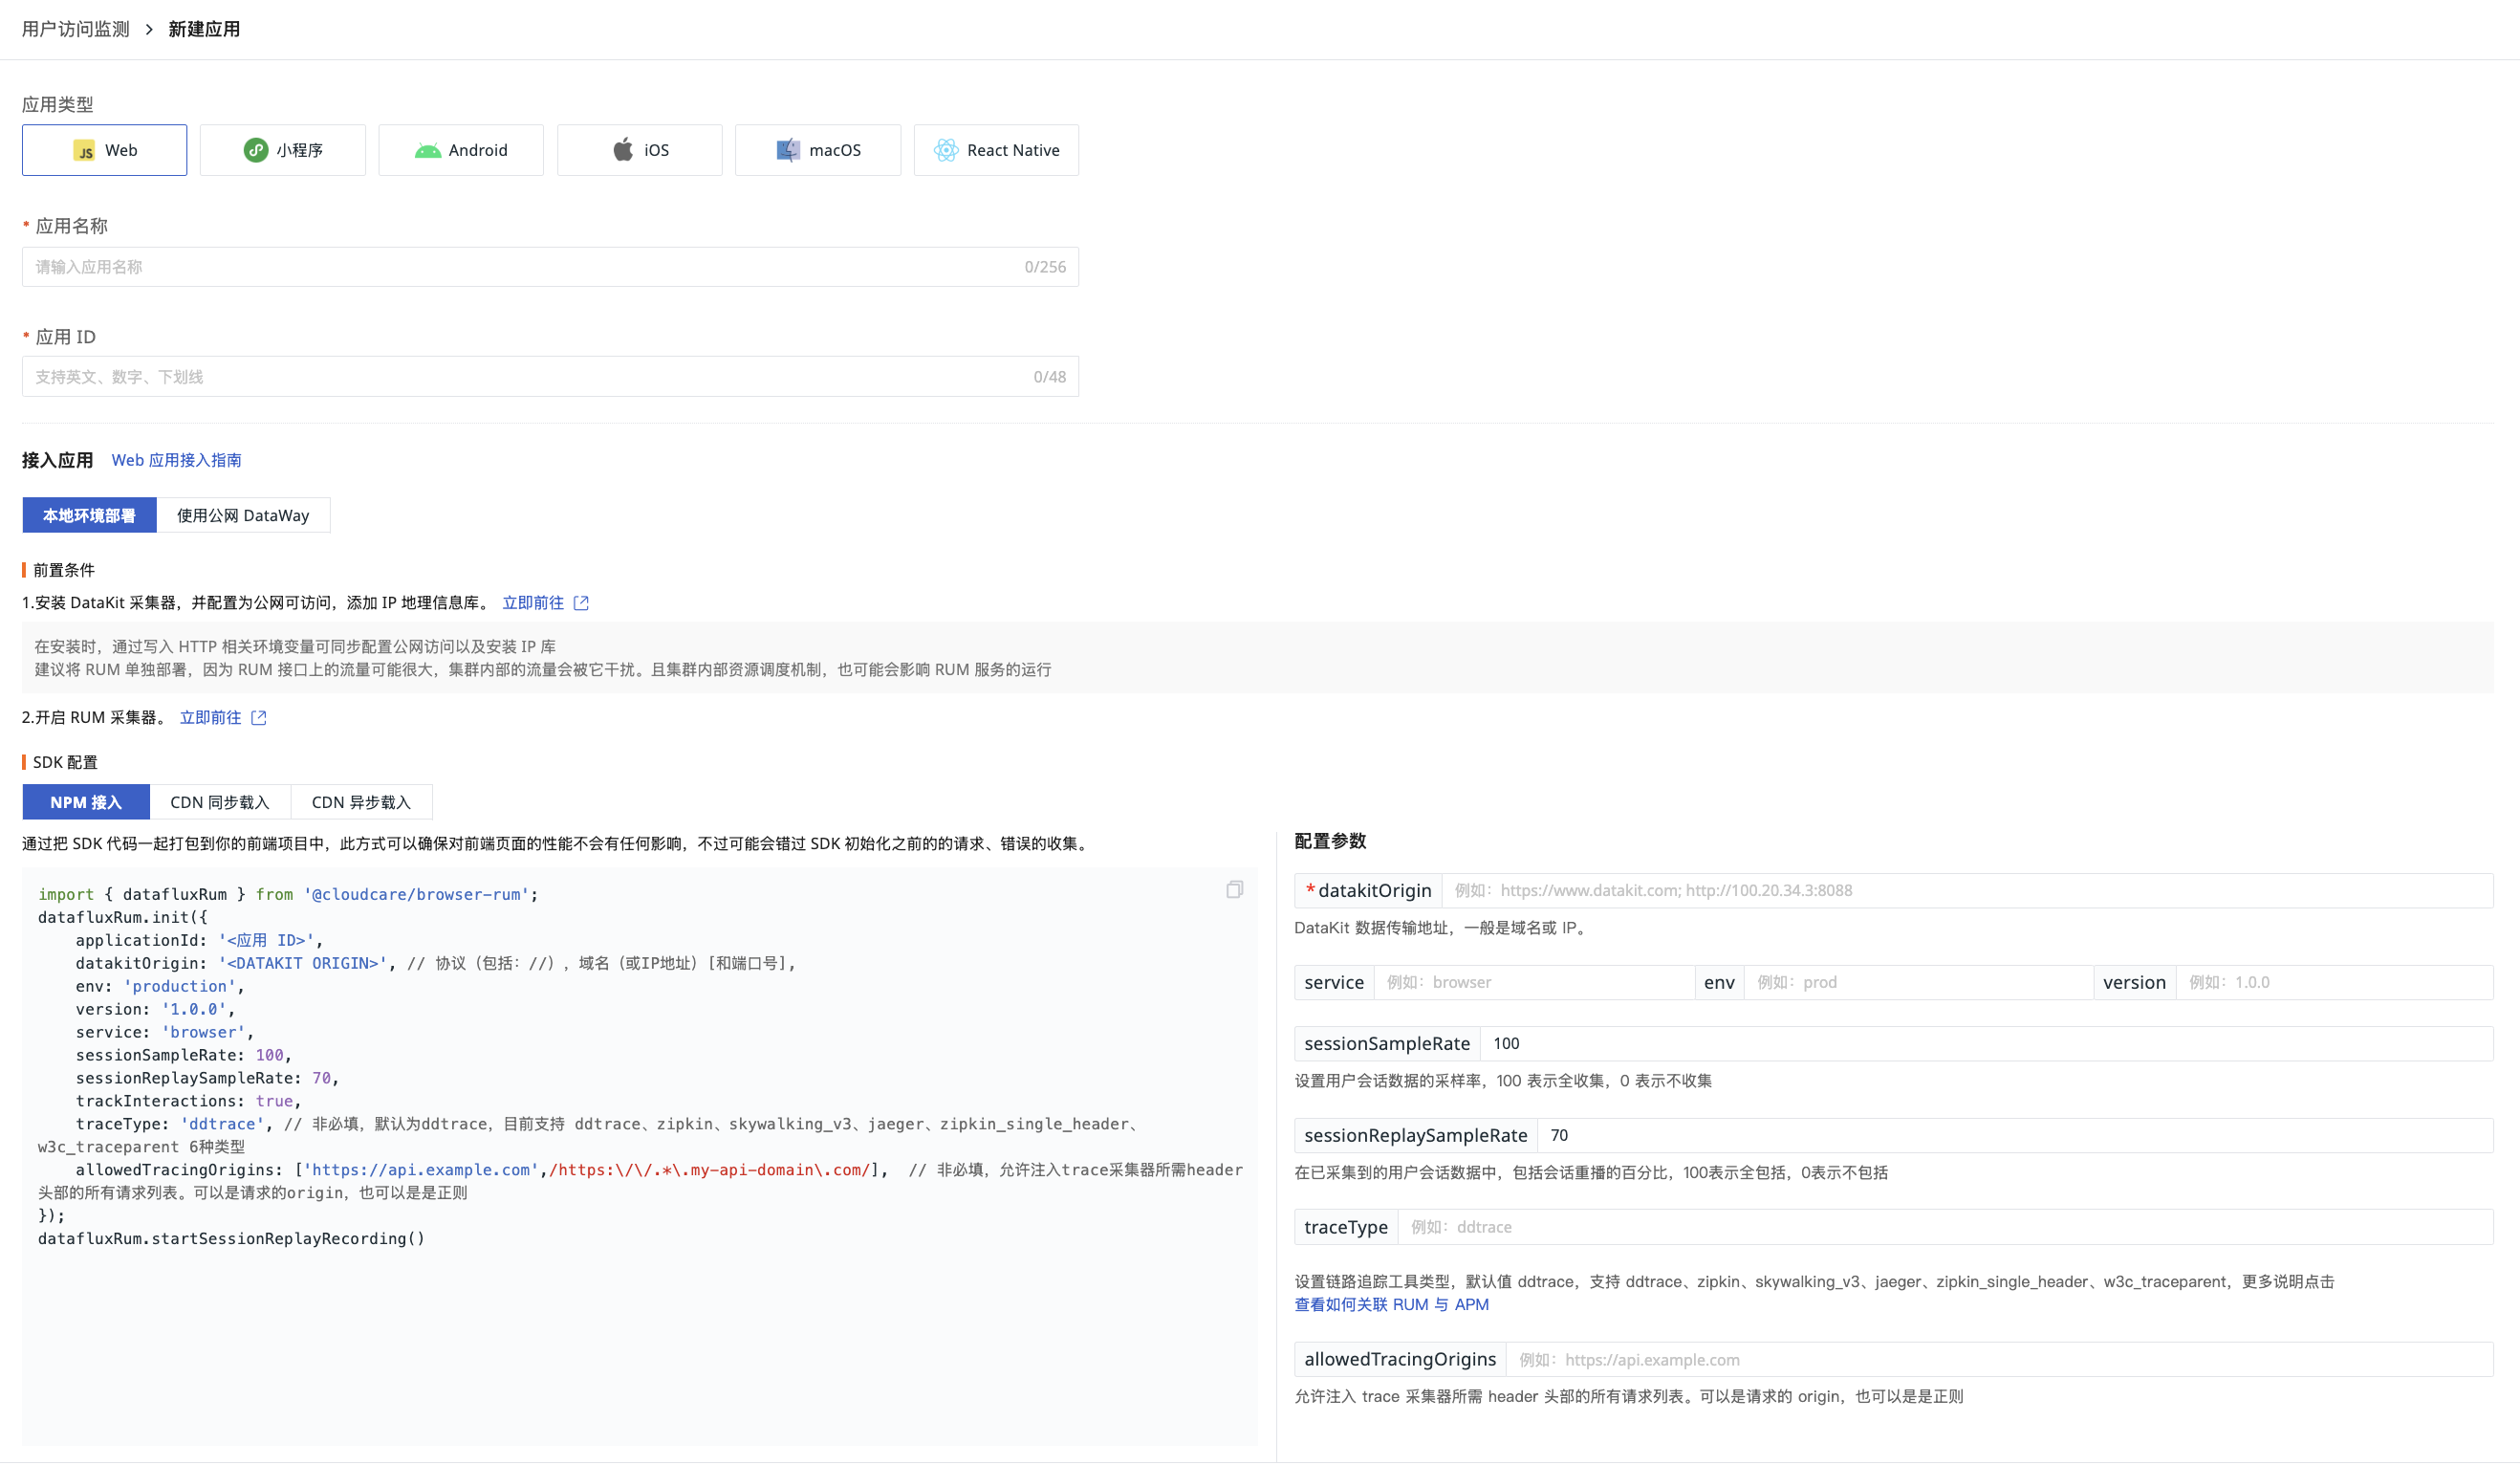
Add an Application
Web
Android
iOS/tvOS/macOS
Mini Apps
React Native
Flutter
UniApp
Windows
C++
Unity
Changing the Application ID
- After the SDK update succeeds, the new analysis views and Explorer list only display data associated with the latest
app_id; data under the old application ID will no longer be displayed. - Update RUM metrics detection monitors to the latest application ID configuration promptly, or recreate metric detection based on the new
app_iddata. - Data under the old application ID can be viewed and analyzed through the built-in RUM views, custom dashboards, or DQL tools.
- If the associated analysis dashboard was not added when configuring a custom application, you cannot jump to the analysis dashboard.
Session Replay
RUM is centered on user operations and sessions, and can capture user sessions in applications such as Web, Mini Apps, Android, and iOS. Session Replay uses modern browser APIs to capture user operation data in real time and replay operation paths, effectively reproducing and resolving errors.
Data Analysis
Explorer
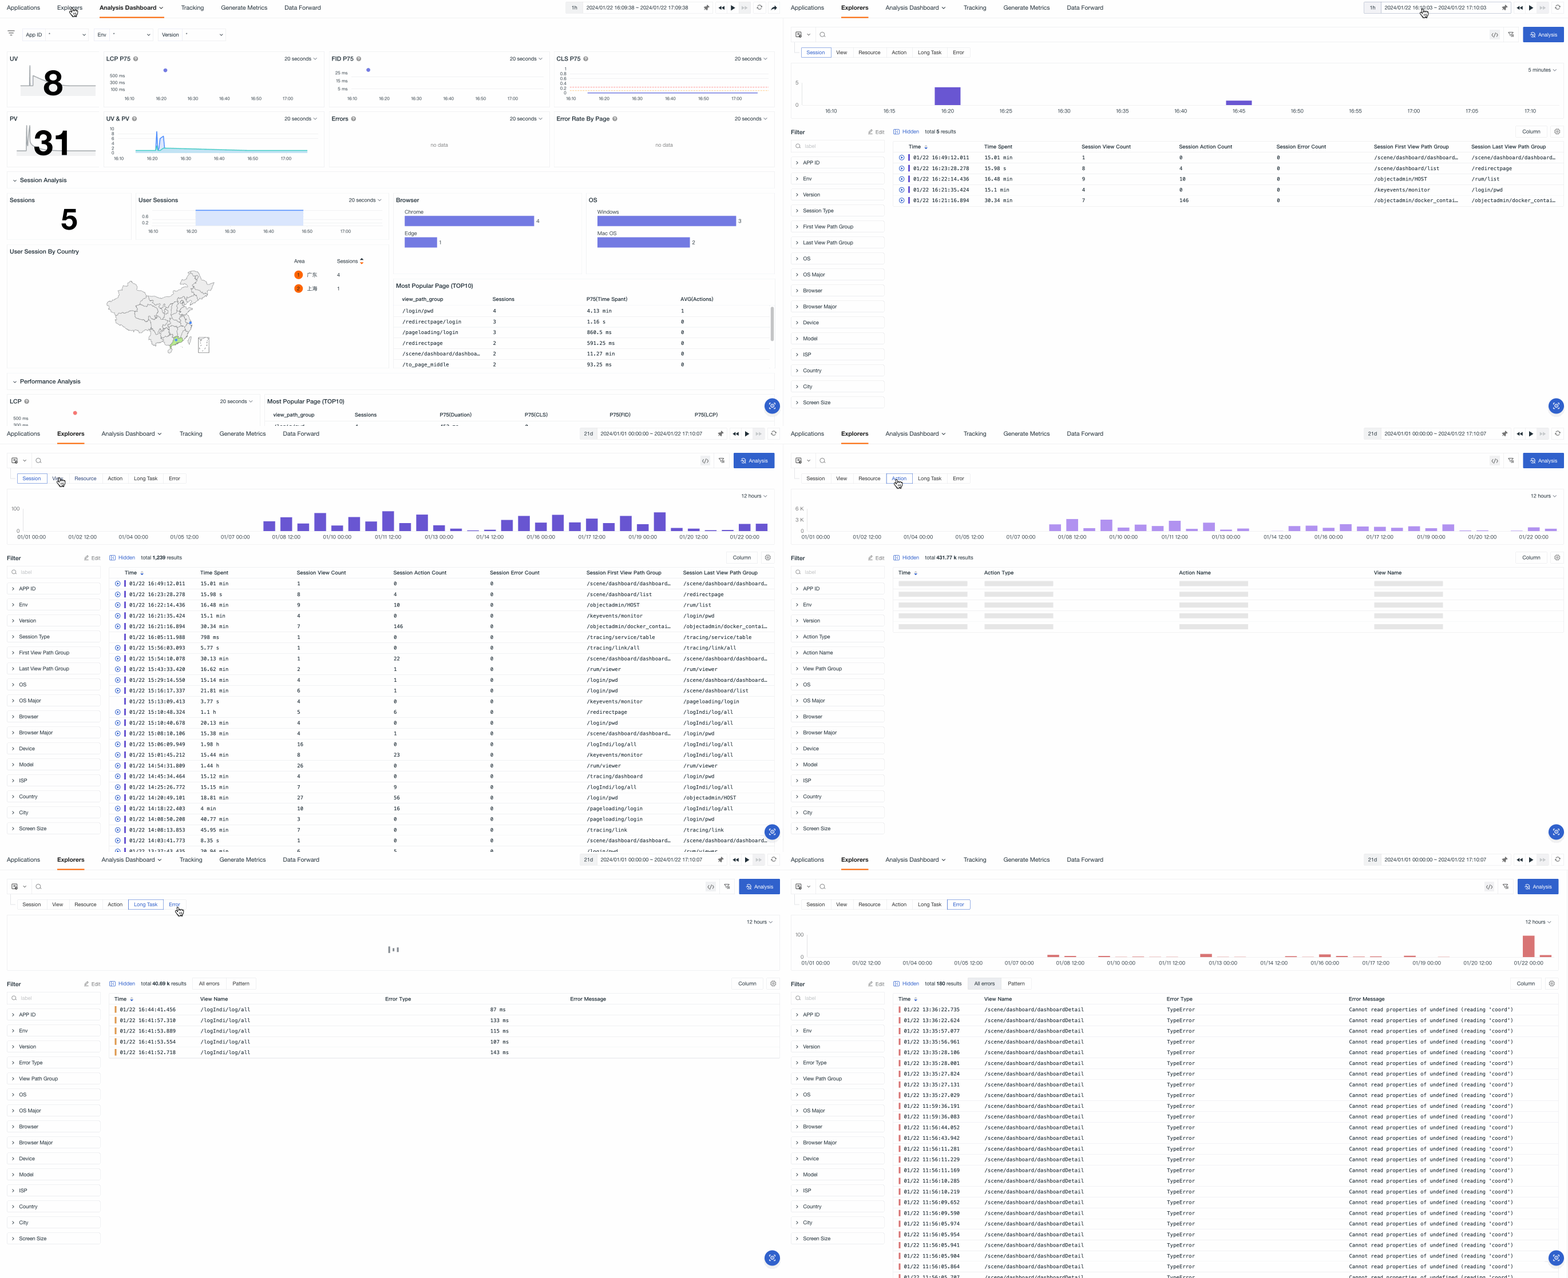
After data collection is complete, in addition to using analysis dashboards, you can use the Explorer to gain in-depth insight into detailed data such as user sessions (Session), page performance (View), and errors (Error), so as to fully understand and optimize the running status and user experience of your applications.
Analysis Dashboards
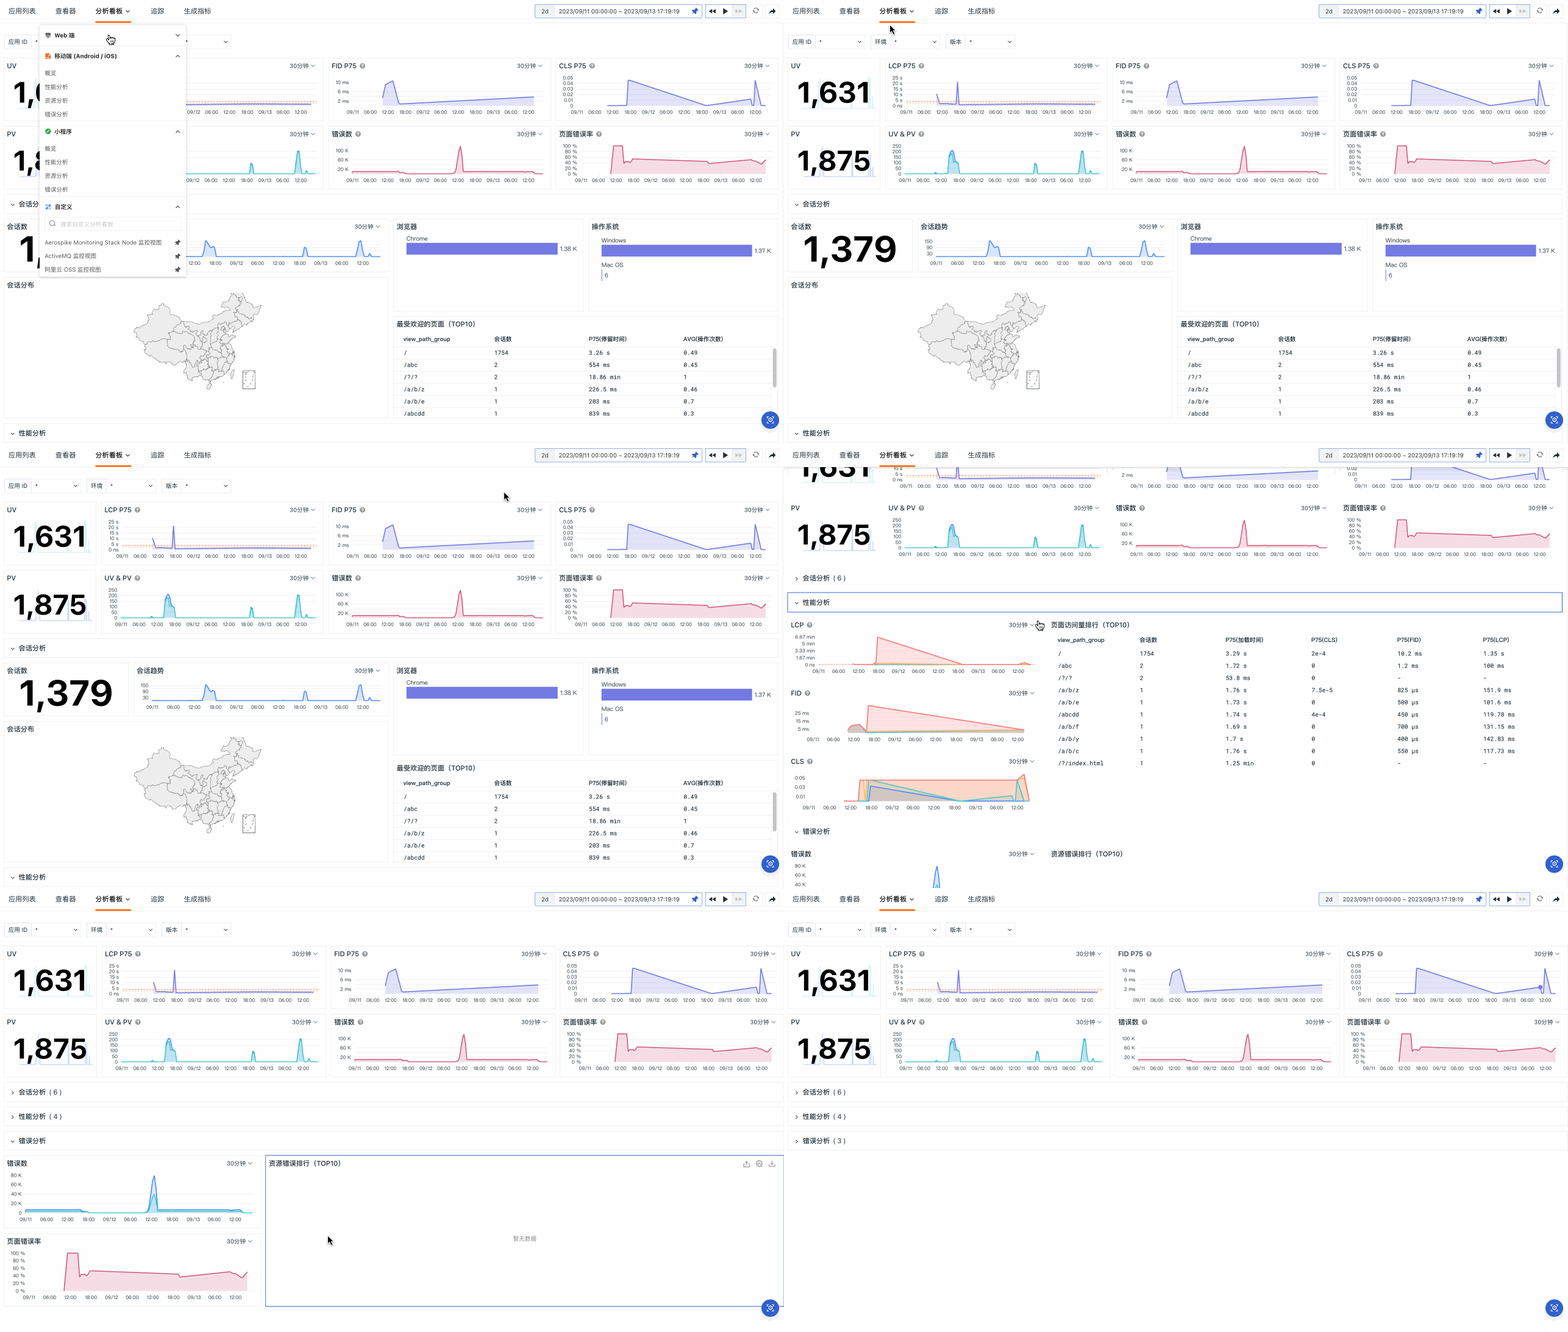
RUM > Analysis Dashboards covers multiple analysis scenarios for different platforms, presenting metric data from three aspects: performance, resources, and errors. Through key performance metrics, you can understand the real frontend experience of users, quickly locate problems in user access, and improve user access performance.
Distributed Tracing
RUM supports configuring custom tracing tasks to monitor trace flows in real time for precise root cause analysis. It ensures complete trace context propagation across different environments, preventing trace interruption caused by context loss. It also enables zero-code end-to-end testing through a browser extension, making it easy to verify and troubleshoot issues quickly.
Generate Metrics
With massive amounts of raw data, RUM > Generate Metrics can quickly simplify multi-dimensional analysis workflows, helping Dev & Ops teams and business teams process data efficiently. Based on existing data in the current workspace, this feature automatically generates metrics and is linked with custom dashboards in real time. It supports periodic statistics by dimension, accelerating data insight and improving decision-making efficiency.