Deploy and Manage DataKit with Rancher for Rapid Observability in Kubernetes Ecosystem
Introduction
As an enterprise grows, the number of servers, Kubernetes environments, and microservice applications increases. The challenge is how to efficiently observe these resources while saving on manpower and costs. By deploying the DataKit from the Rancher app store with one click, Guance provides a large set of out-of-the-box observability features for K8s clusters managed by Rancher.
This article uses the well-known service mesh microservice architecture Bookinfo as an example to explain in detail how to use Guance to quickly enhance end-to-end observability across the entire microservice chain, including K8s, Istio, CI/CD, and canary releases.
Guance is a leading company dedicated to cloud-native observability. Using a single platform and deploying the DataKit Agent, you can link metrics, traces, and logs from hosts and applications. After logging into Guance, you can actively observe the health of your K8s runtime and microservice applications in real time.
Case Assumption
Assume a company has several cloud servers, two Kubernetes clusters (one production, one test). The test environment has one Master node and two Node nodes. Harbor, Gitlab, and the Istio project Bookinfo are deployed on the cloud servers and the Kubernetes test environment.
Now use Guance to observe hosts, Kubernetes clusters, Gitlab CI, canary releases, RUM, APM, Istio, and more.
Prerequisites
- Install Kubernetes 1.18+.
- Install Rancher and have permission to operate Kubernetes clusters.
- Install Gitlab.
- Install Helm 3.0+.
- Deploy a Harbor repository or other image repository.
Steps
Warning
The version information used in this example is as follows: DataKit 1.4.0, Kubernetes 1.22.6, Rancher 2.6.3, Gitlab 14.9.4, Istio 1.13.2. Configuration may vary with different versions.
Step 1: Install DataKit Using Rancher
For easier management, install DataKit in the datakit namespace.
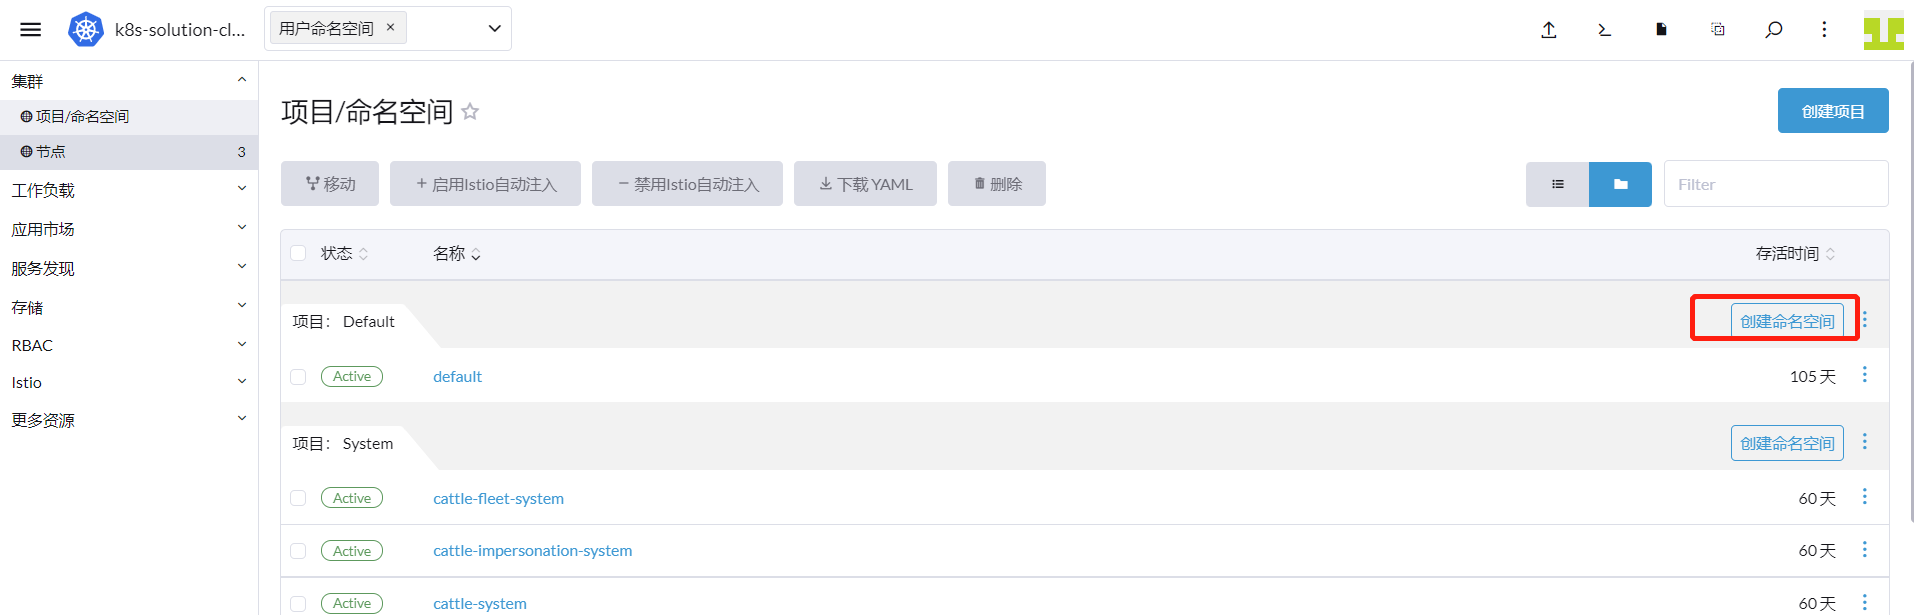
Log in to Rancher → Cluster → Projects/Namespaces, and click Create Namespace.
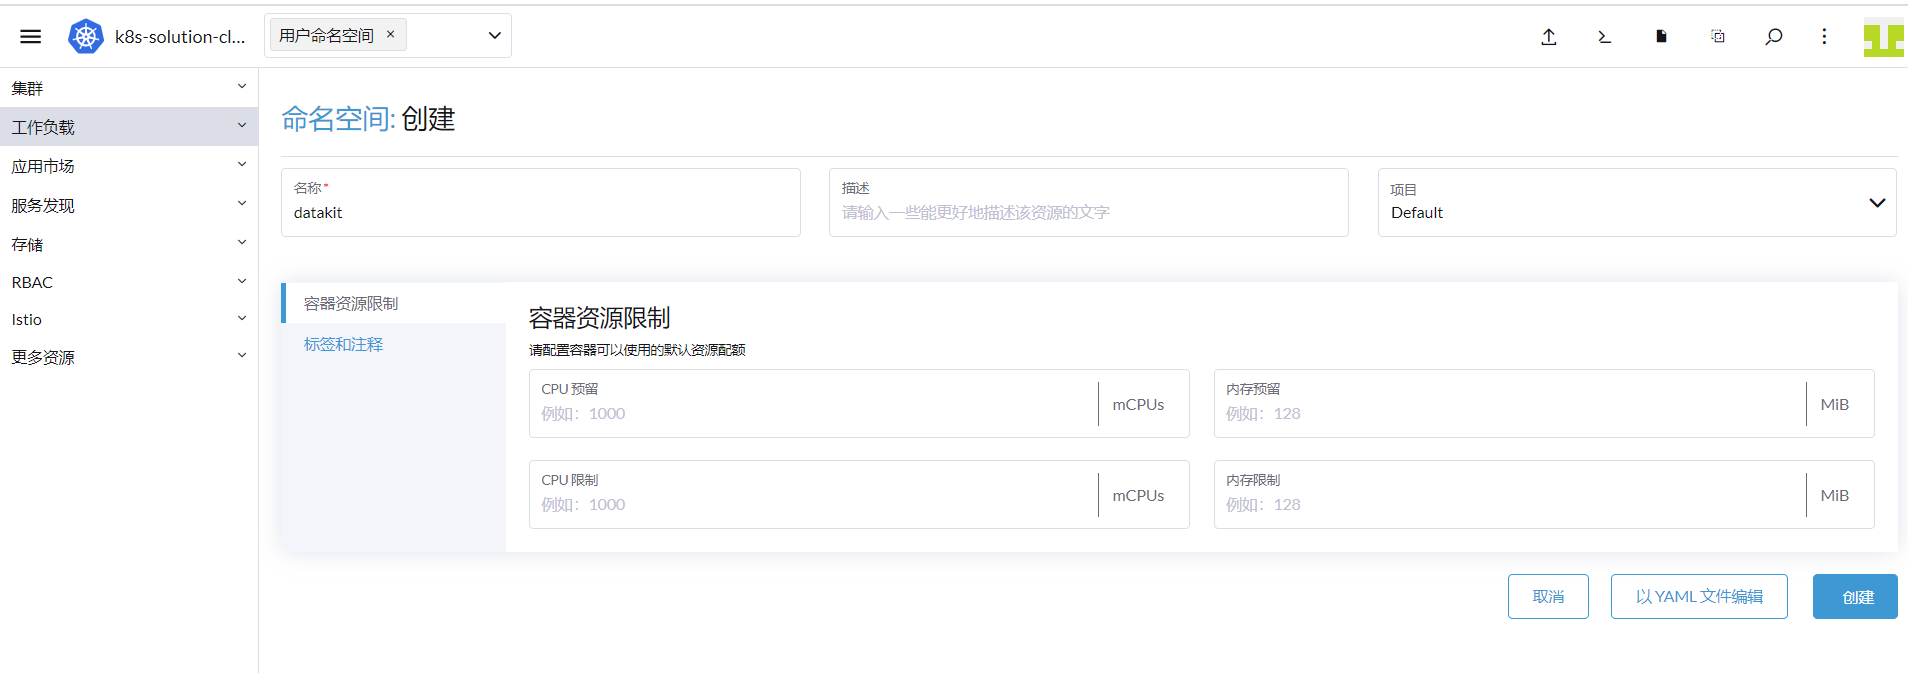
Enter datakit as the name and click Create.
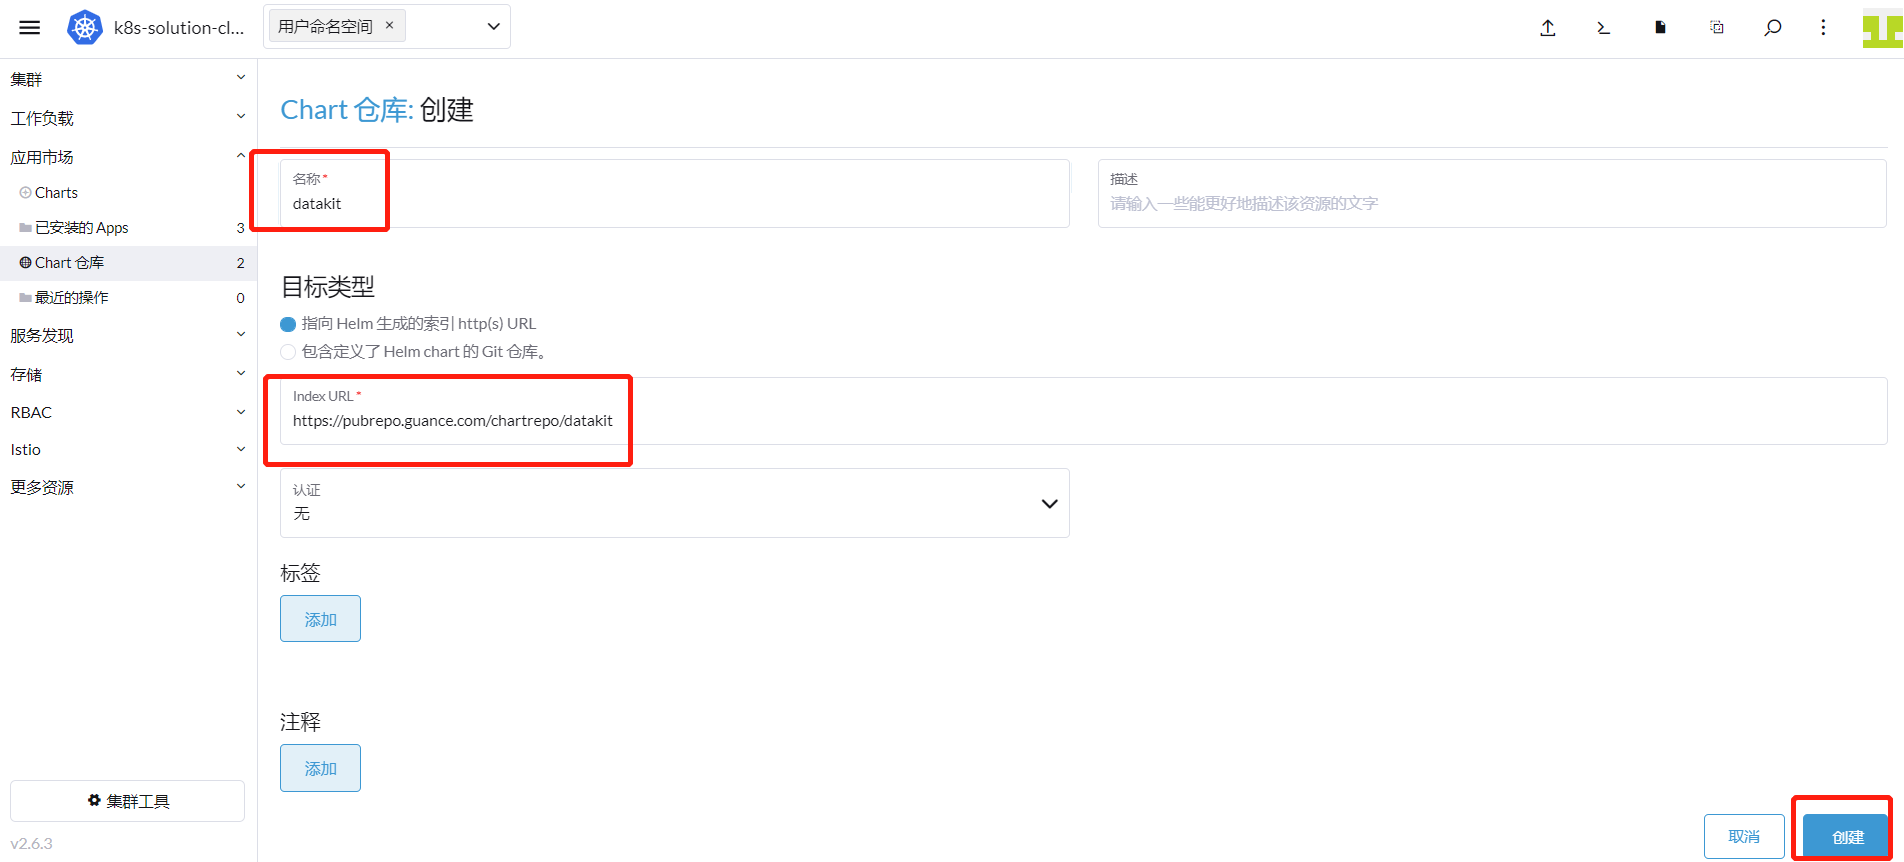
Go to Cluster → App Marketplace → Chart Repositories, and click Create.
Enter datakit as the name, enter https://pubrepo.guance.com/chartrepo/datakit as the URL, and click Create.
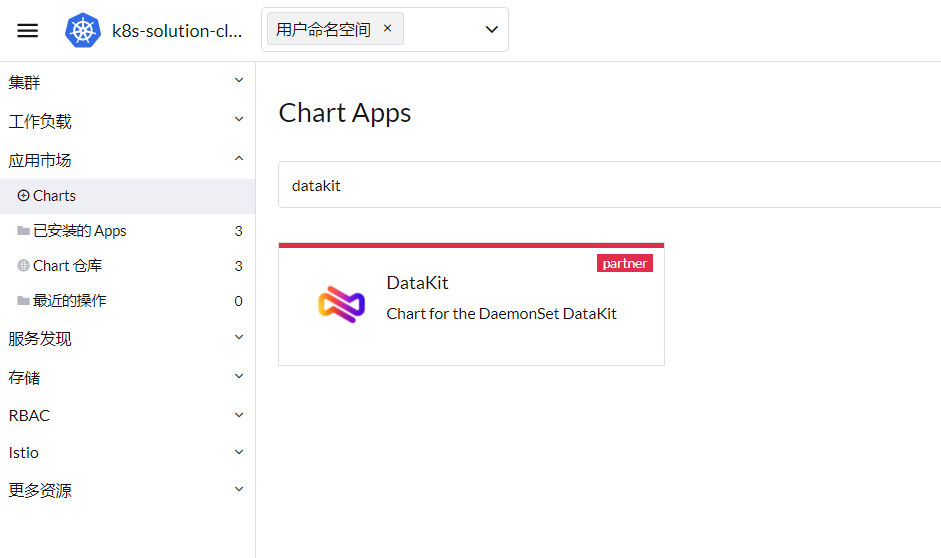
Go to Cluster → App Marketplace → Charts, select datakit. The chart labeled DataKit appears; click into it.
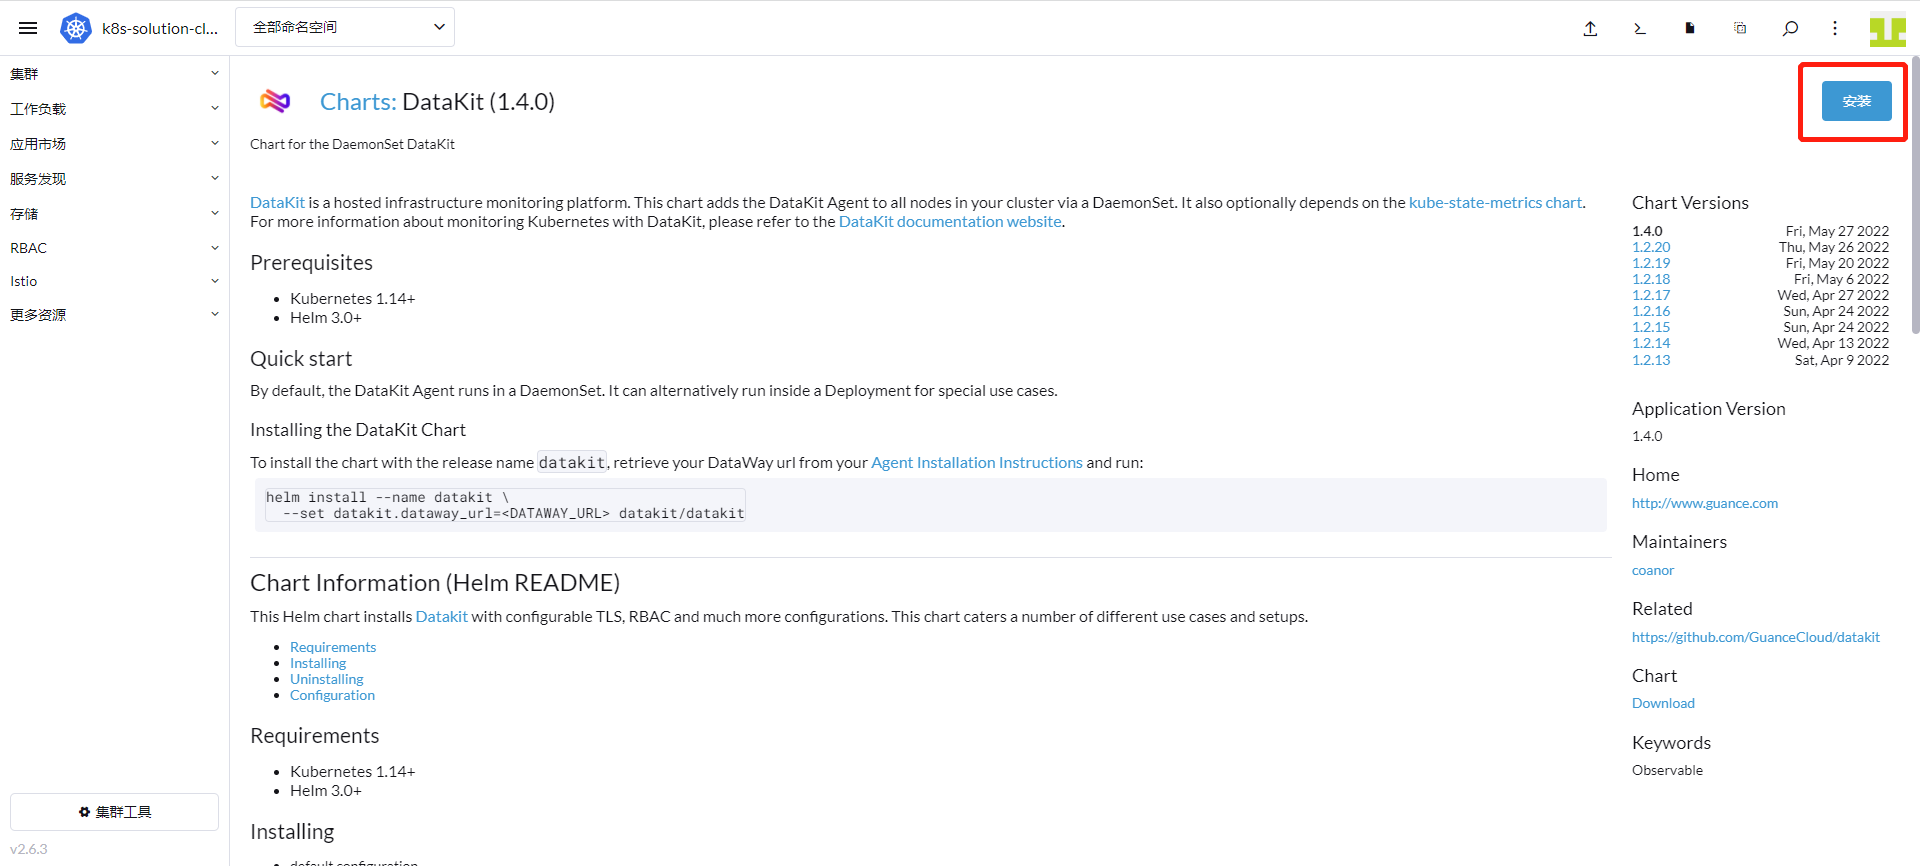
Click Install.
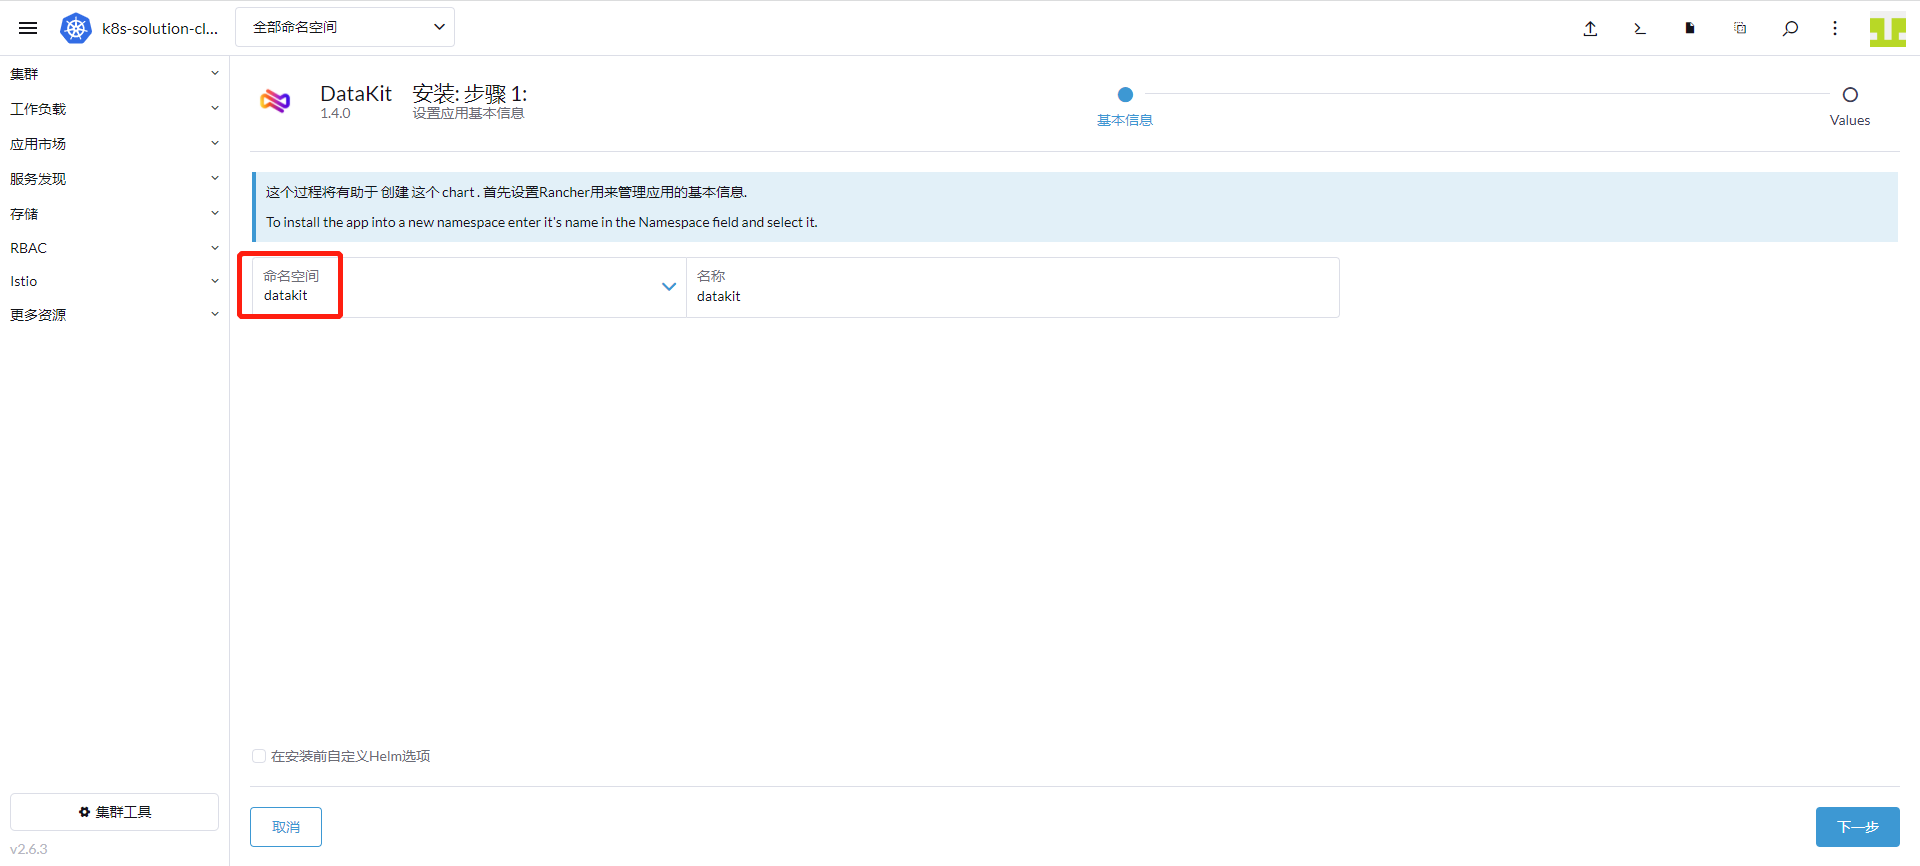
Select the datakit namespace and click Next.
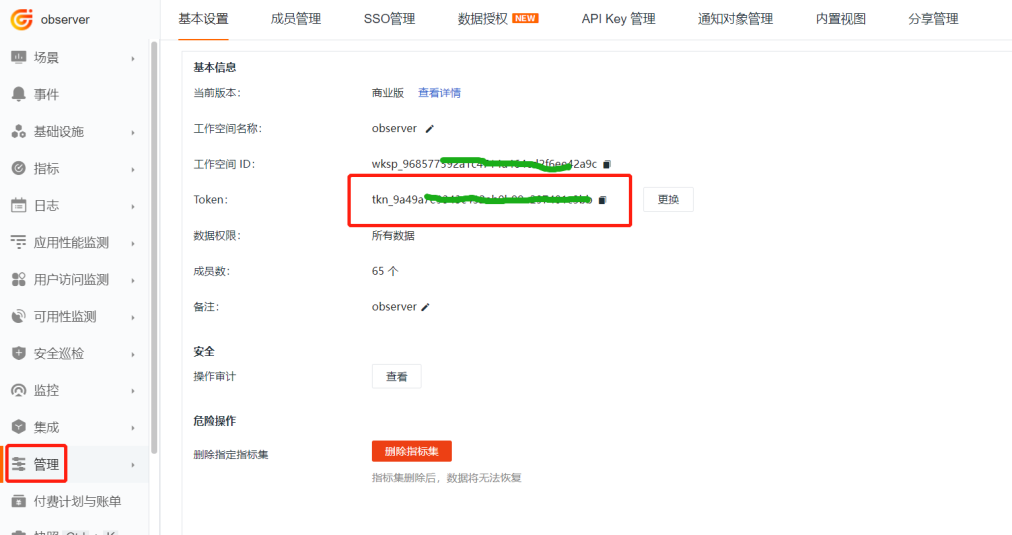
Log in to Guance, go to the Management module, find the token shown below, and click the copy icon next to it.
Switch back to the Rancher interface:
- Replace the token in the image below with the token you just copied.
- Under Enable The Default Inputs, add
,ebpfat the end (note: comma-separated). - Under DataKit Global Tags, add
,cluster_name_k8s=k8s-prodat the end (wherek8s-prodis your cluster name; you can define it yourself. This sets a global tag for metrics collected from the cluster).
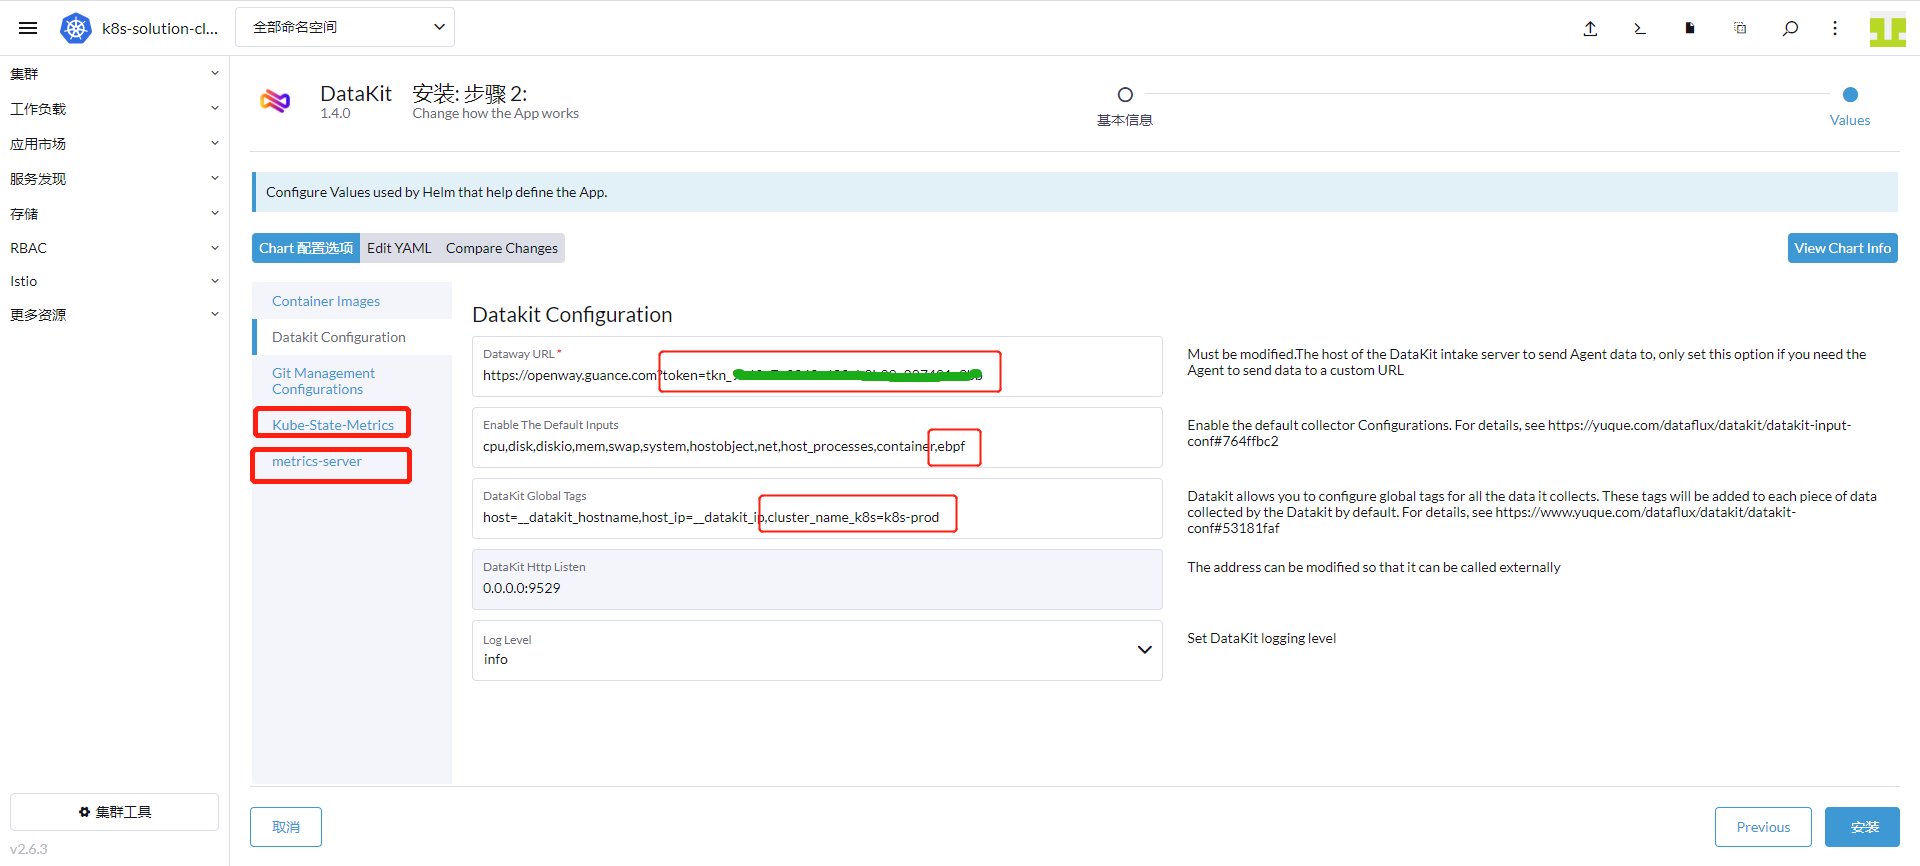
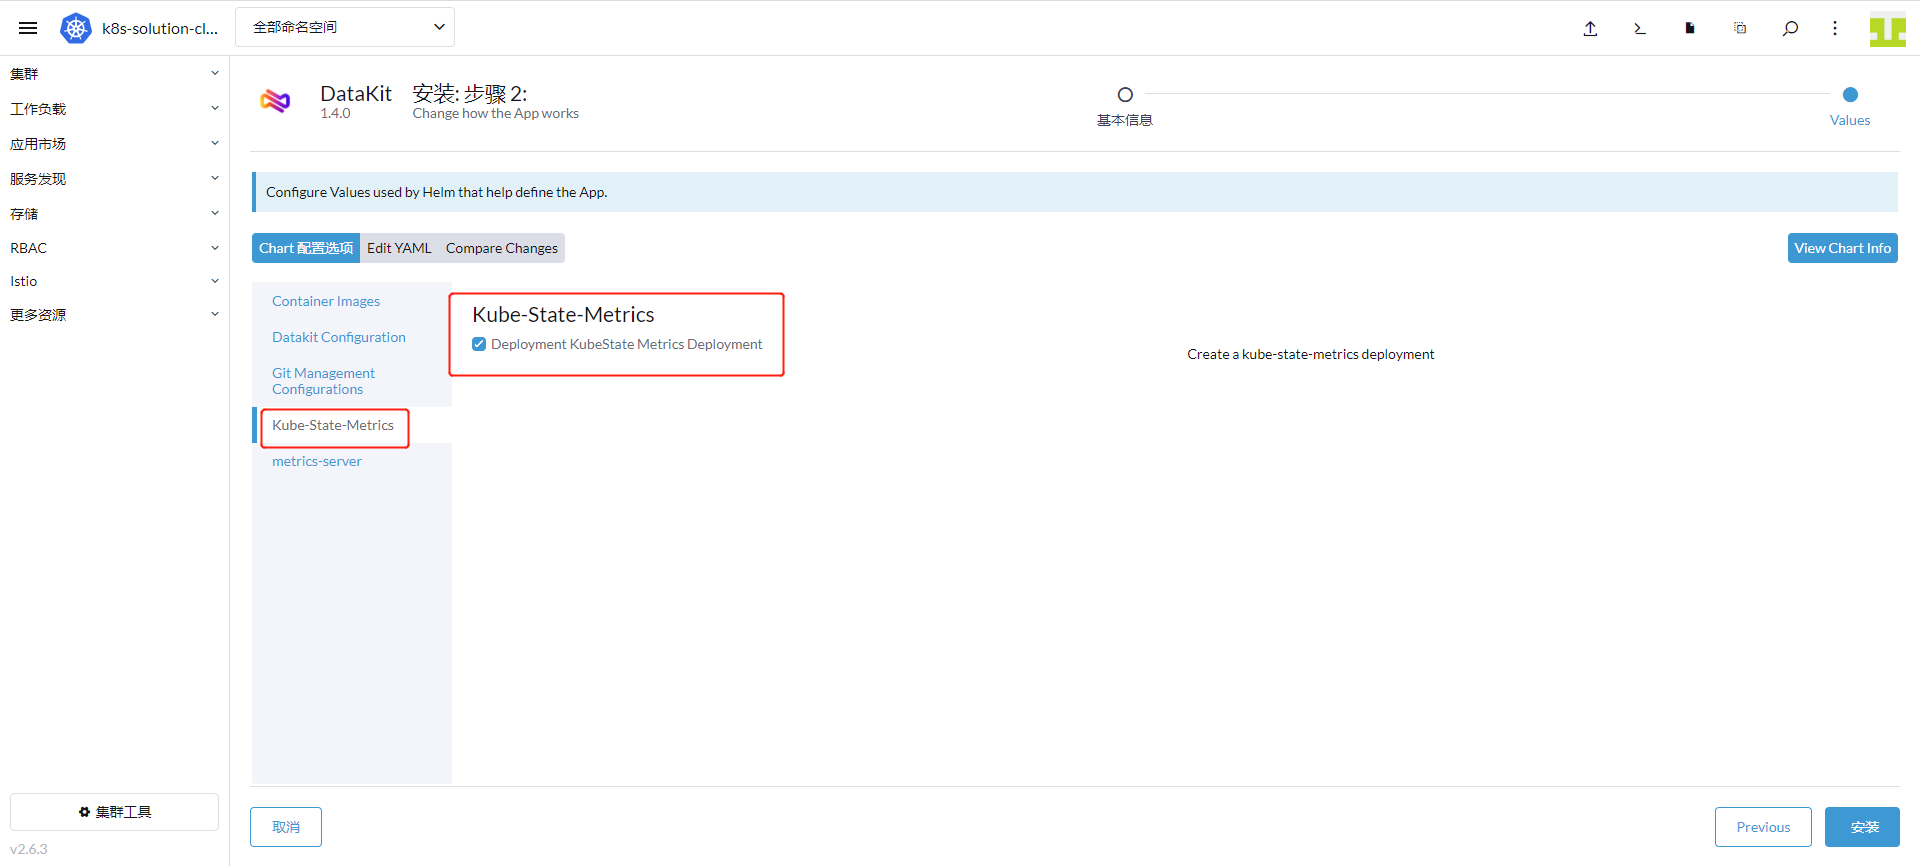
Click Kube-State-Metrics and select Install.
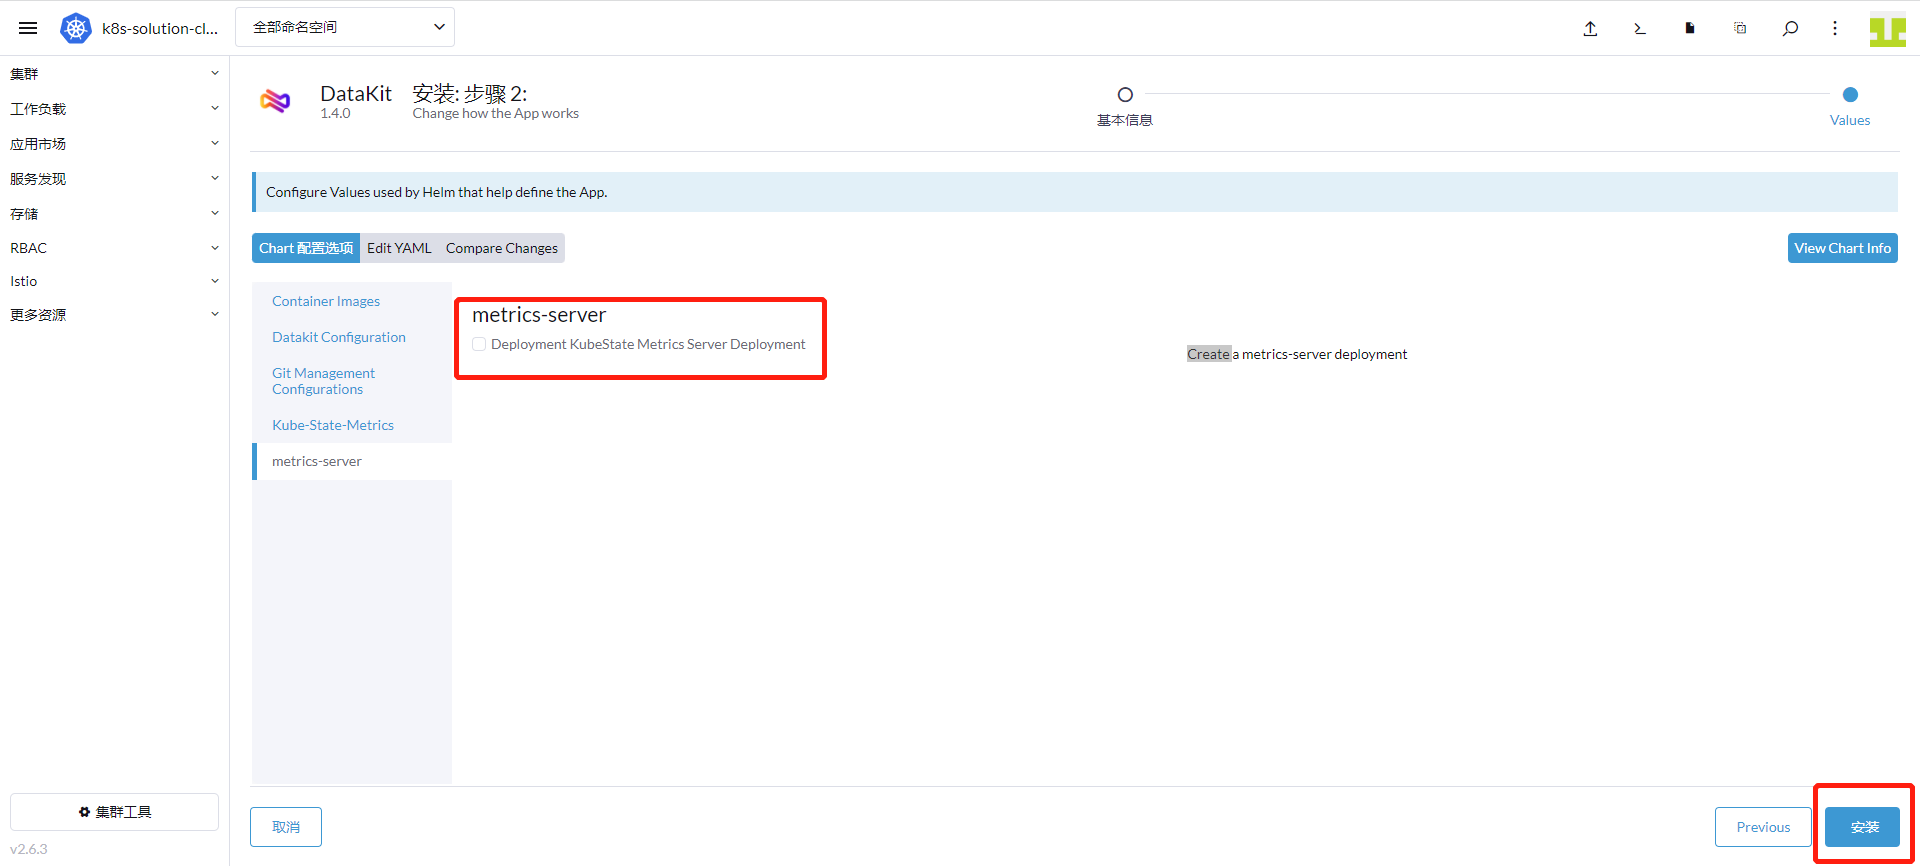
Click metrics-server, select Install, and then click the Install button.
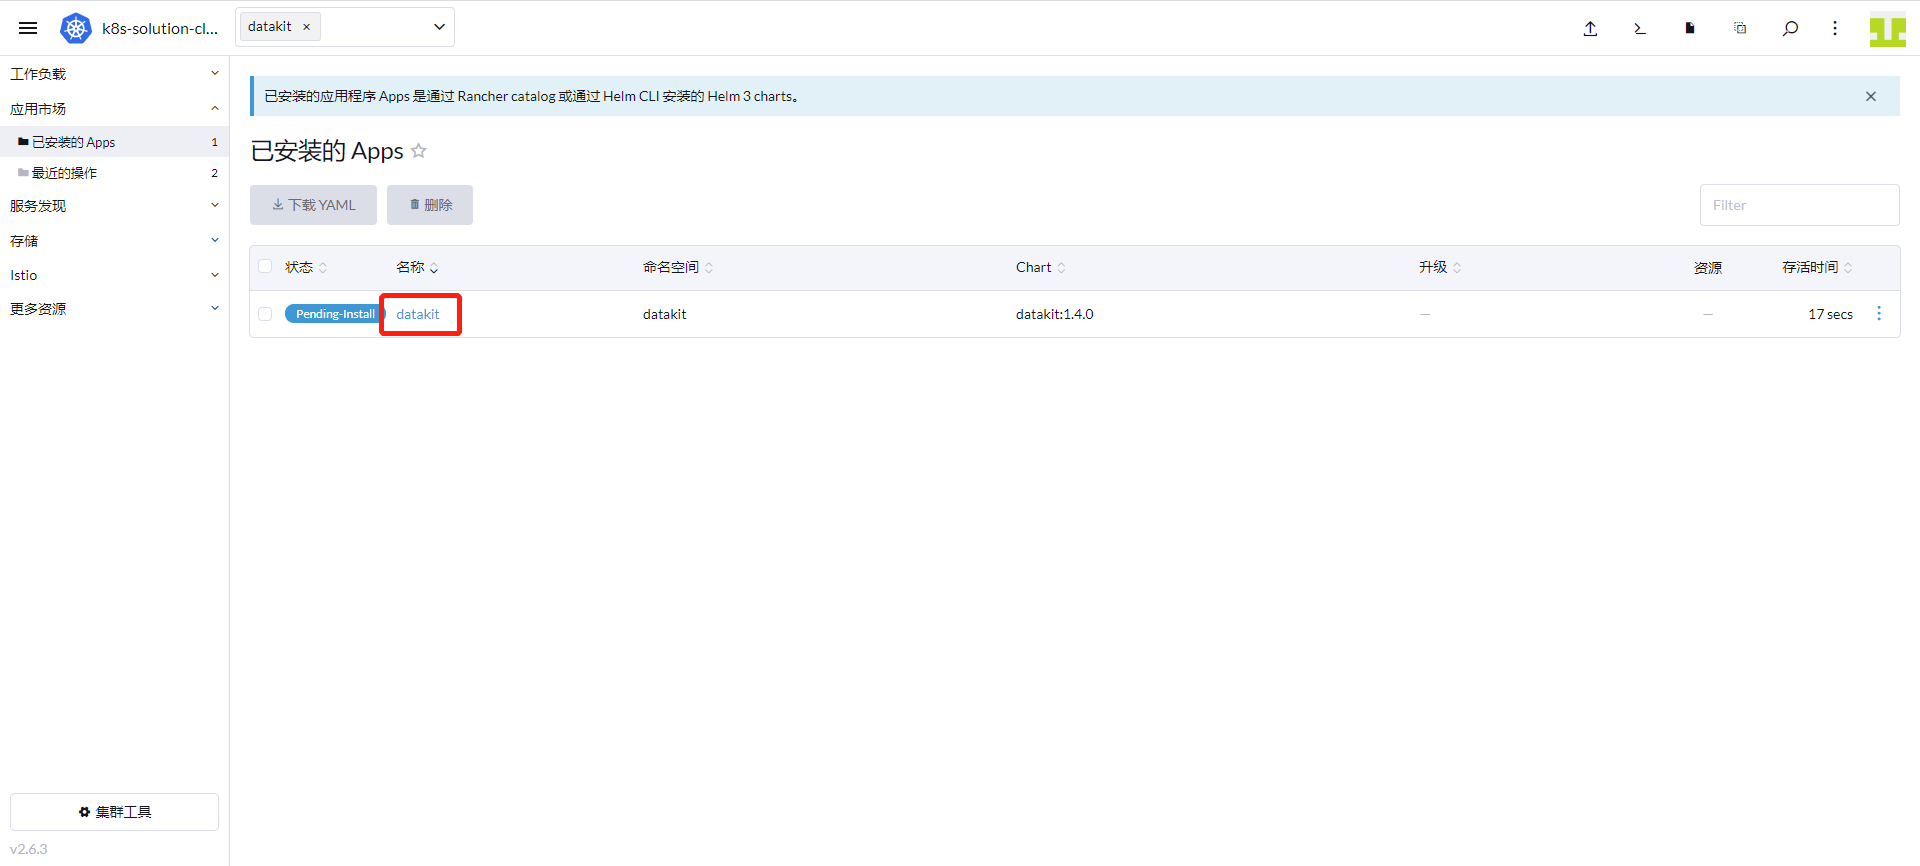
Go to Cluster → App Marketplace → Installed Apps to verify that DataKit is installed successfully.
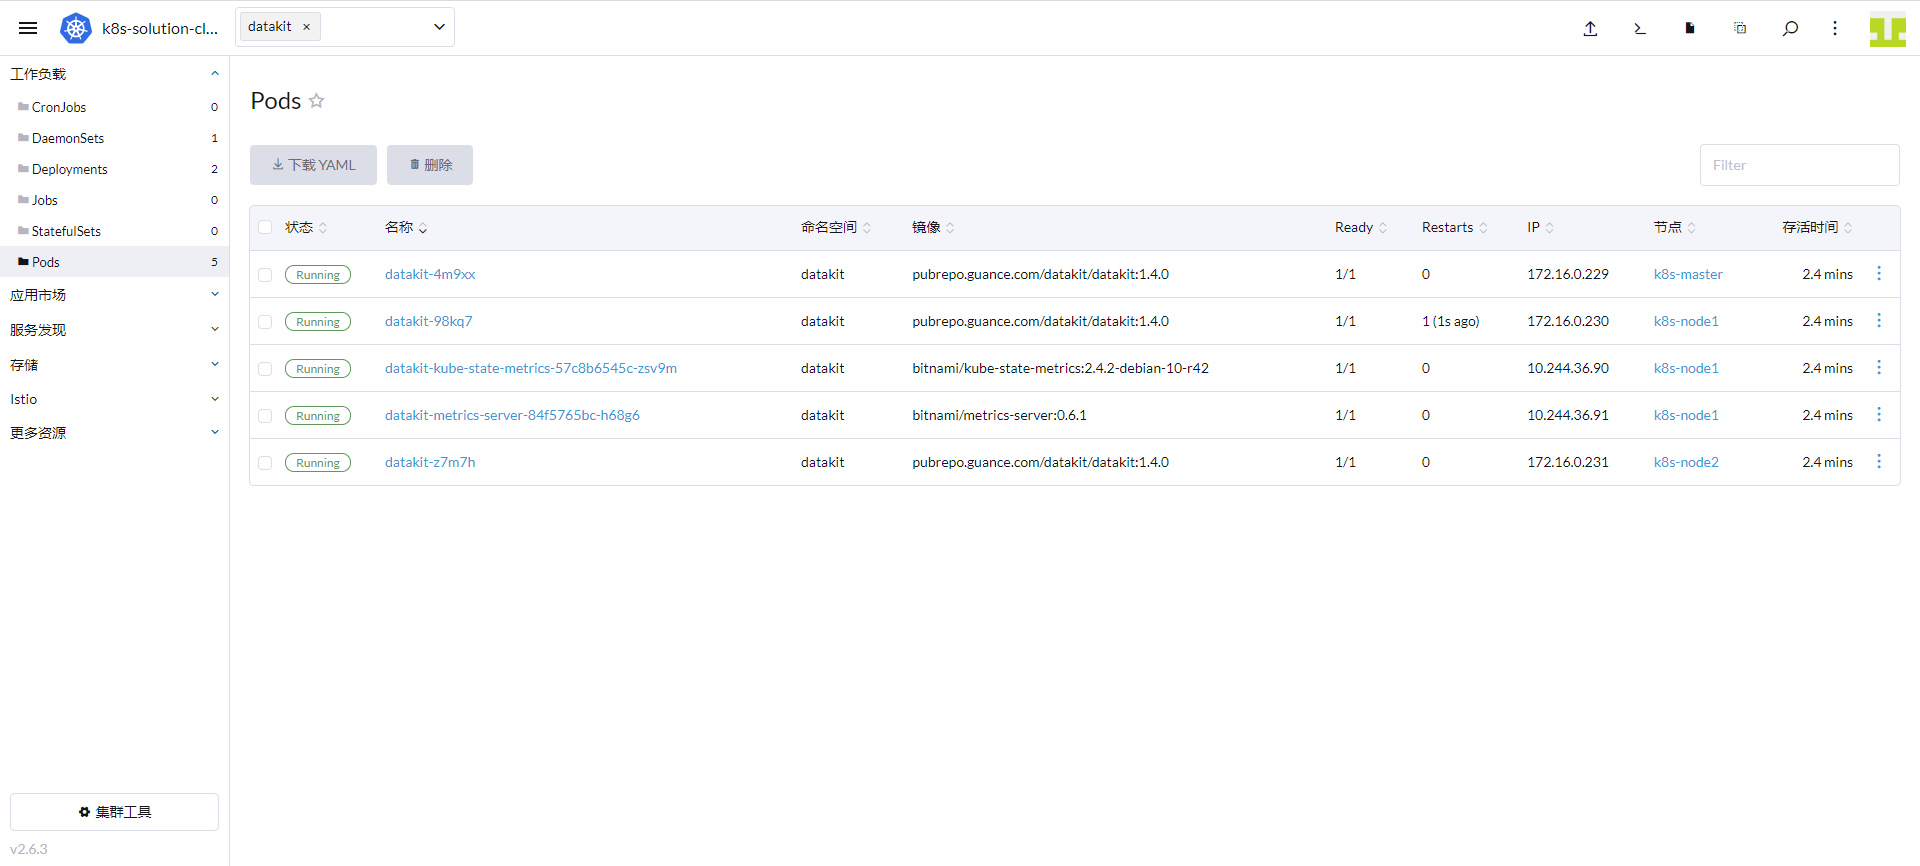
Go to Cluster → Workloads → Pods, and you can see that the datakit namespace is running 3 DataKit pods, 1 kube-state-metrics pod, and 1 metrics-server pod.
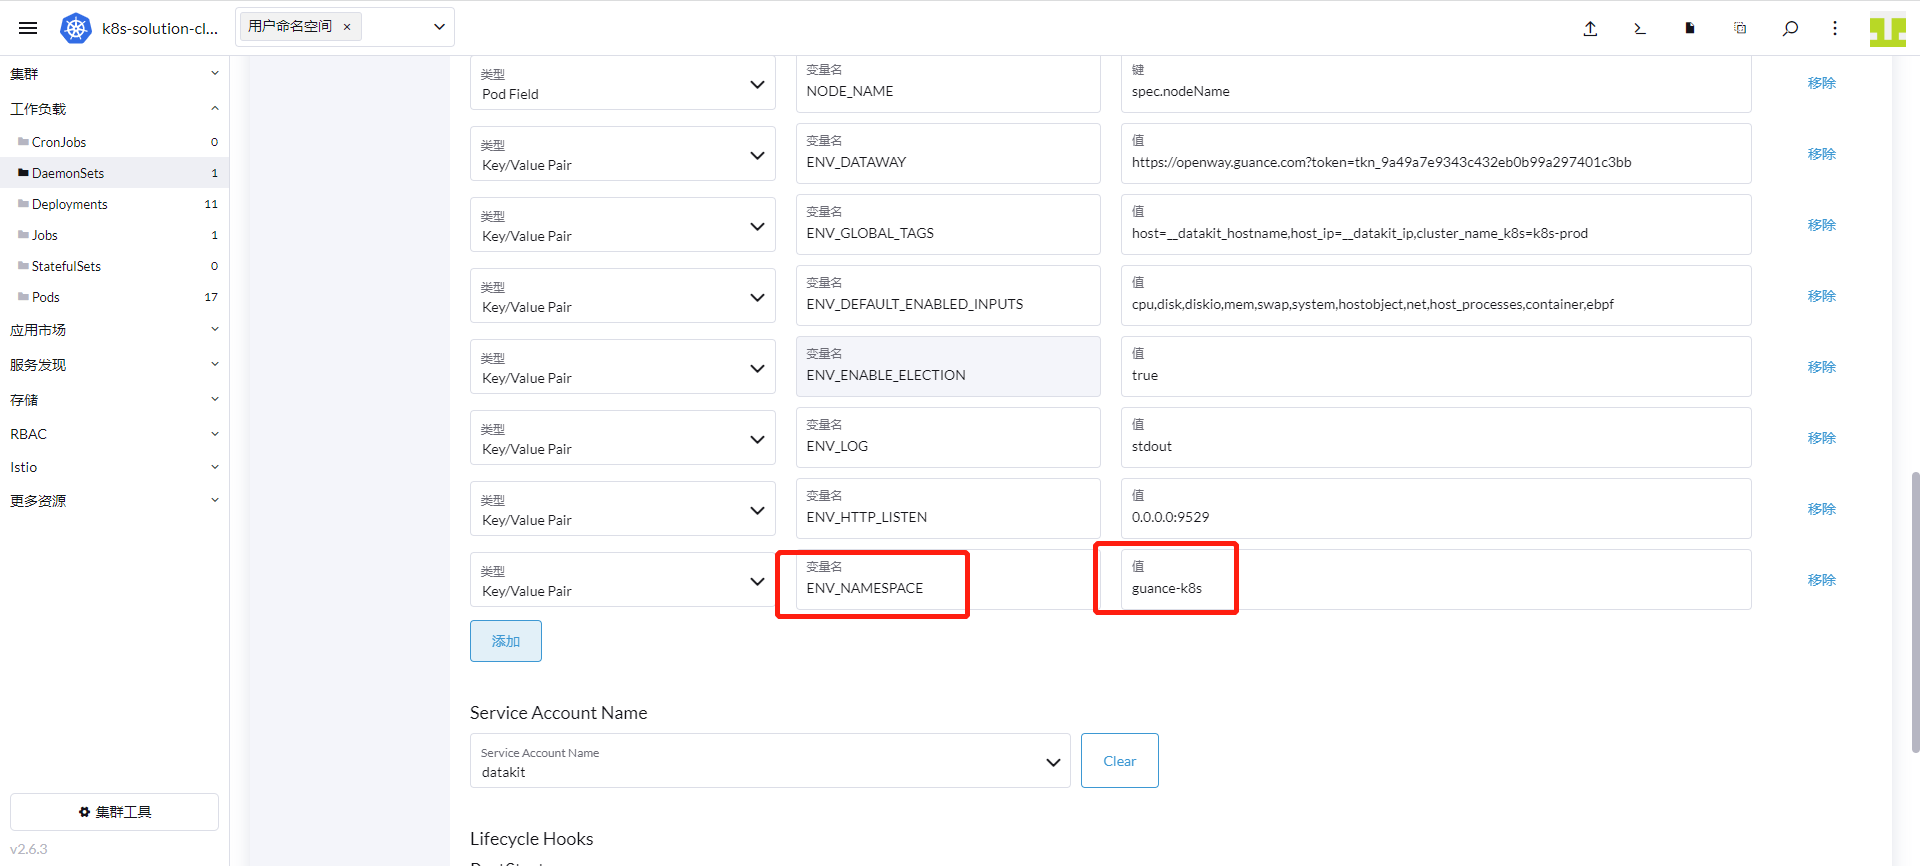
Since the company has multiple clusters, you need to add the ENV_NAMESPACE environment variable. This variable differentiates leader elections between clusters; the value cannot be the same across clusters.
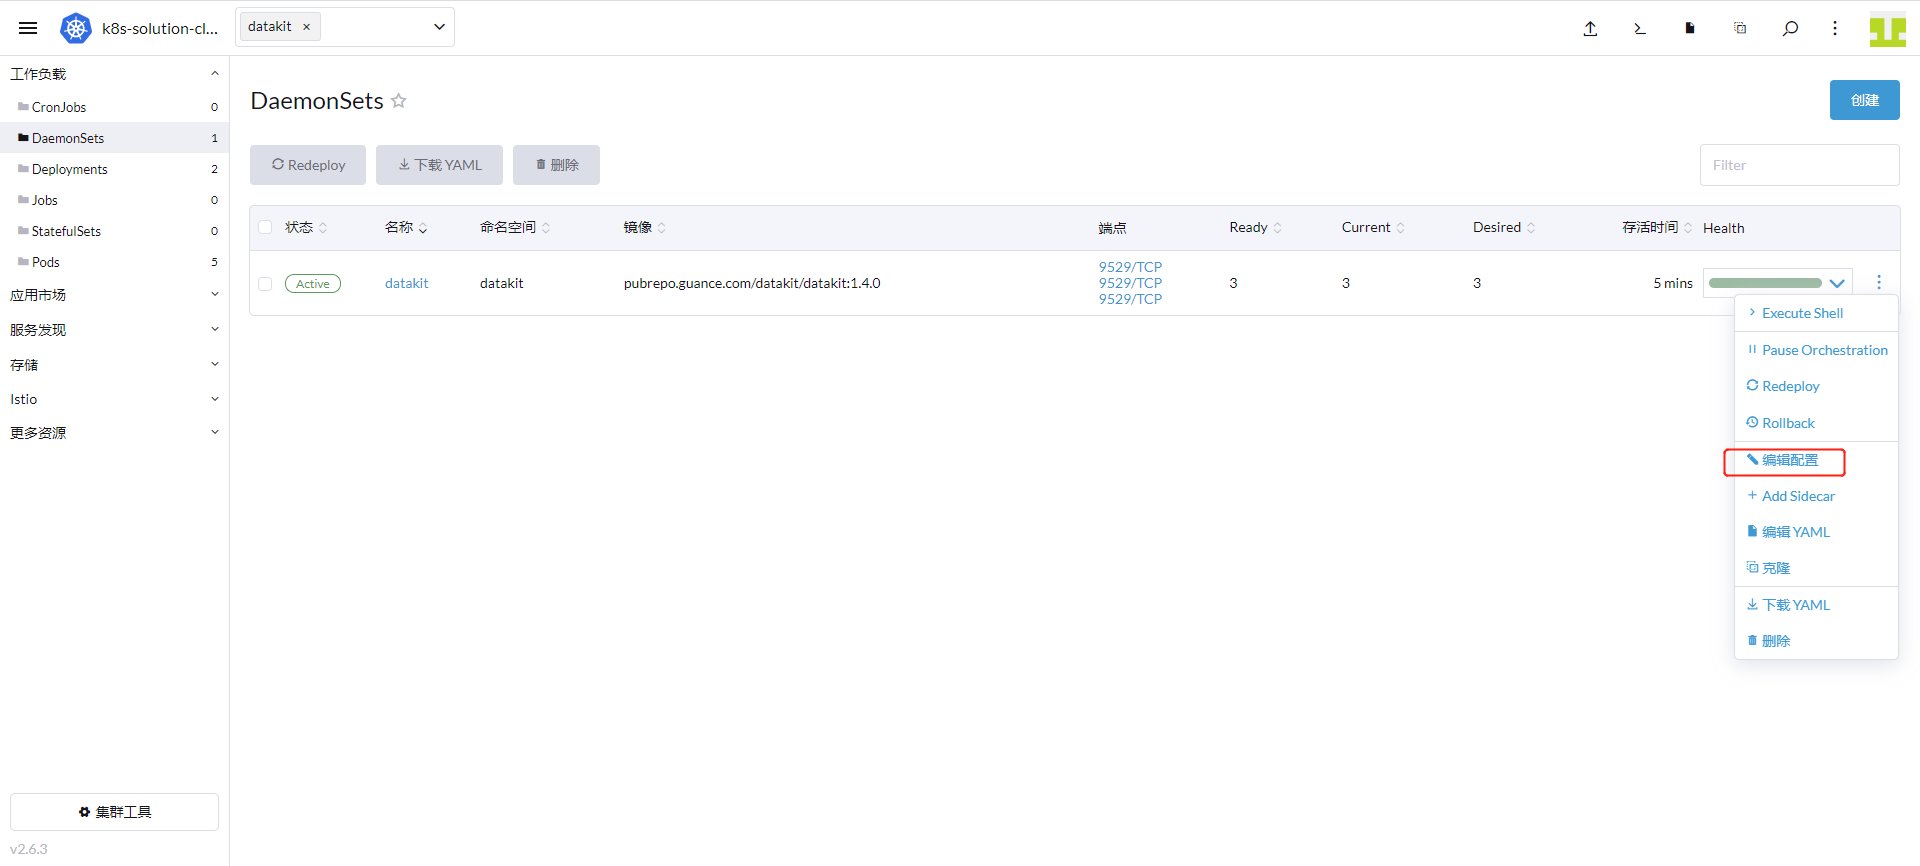
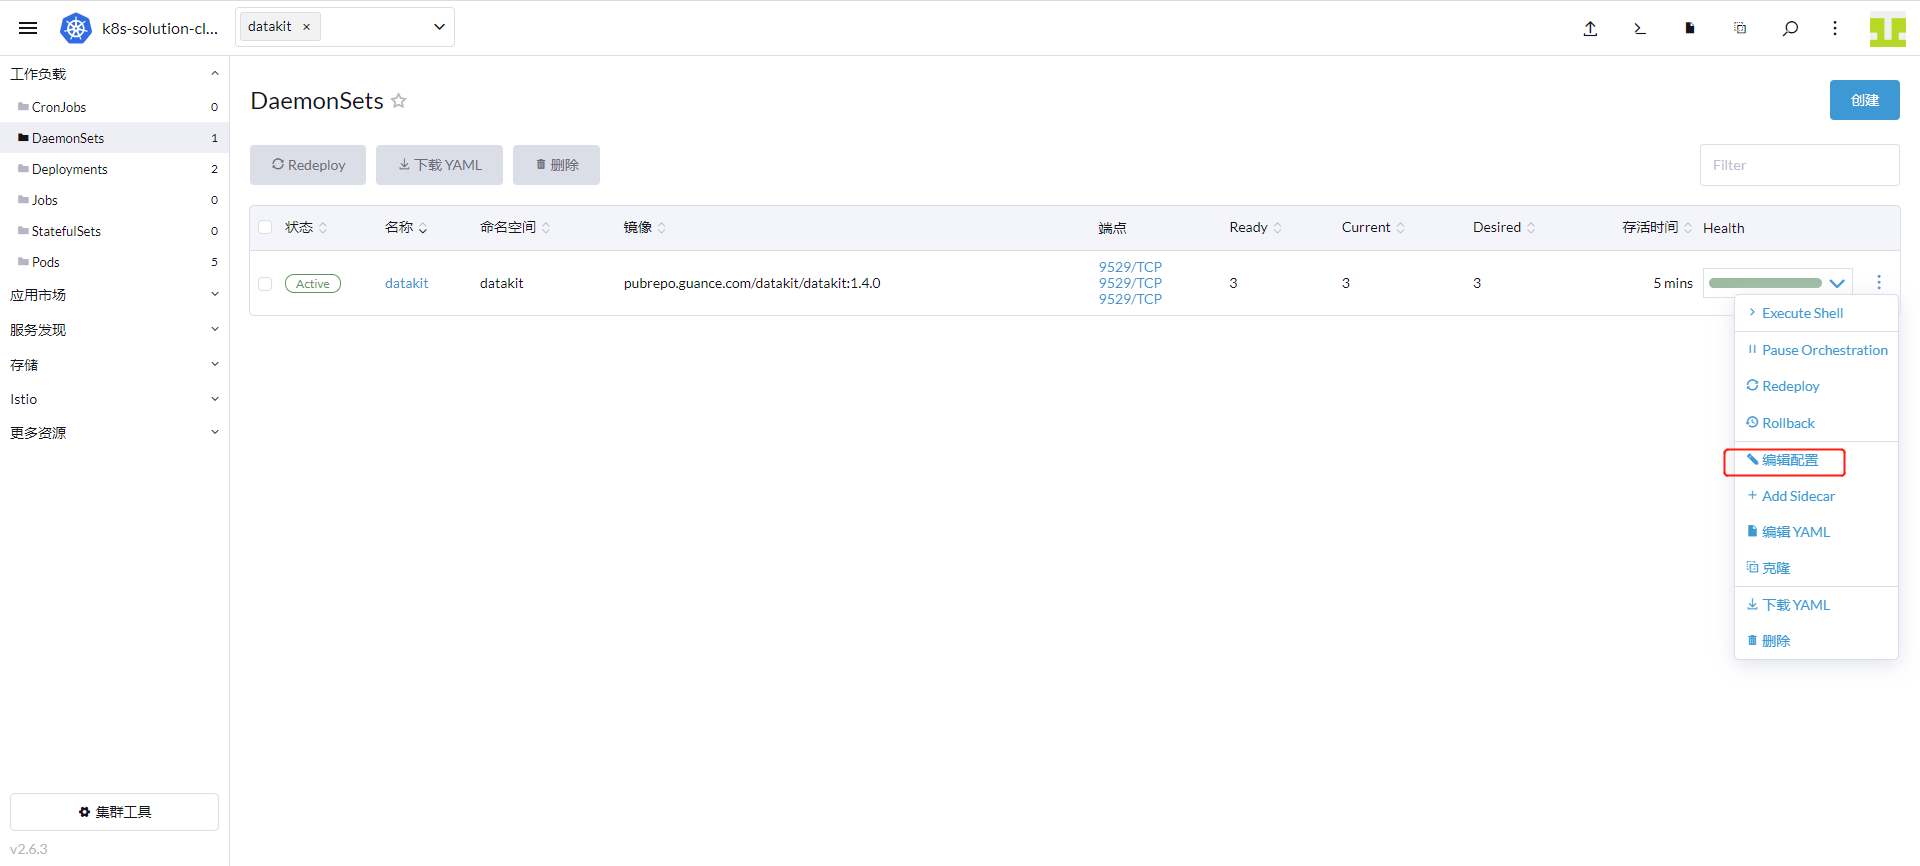
Go to Cluster → Workloads → DaemonSets, click the action menu on the right of the datakit row, and select Edit Config.
Enter ENV_NAMESPACE as the variable name, guance-k8s as the value, and click Save.
Step 2: Enable Kubernetes Observability
2.1 eBPF Observability
- Enable the collector
The ebpf collector has already been enabled when deploying DataKit.
- eBPF View
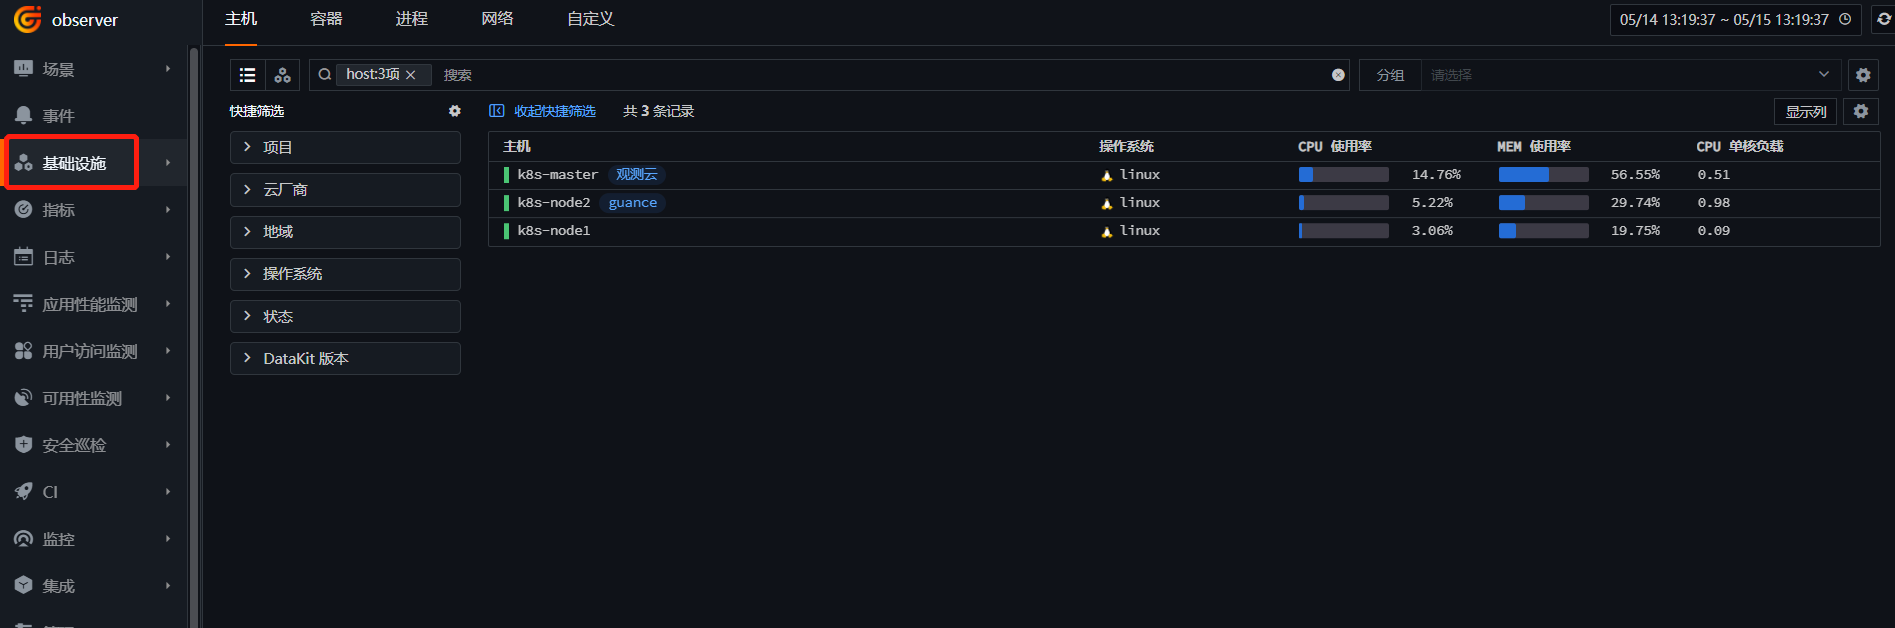
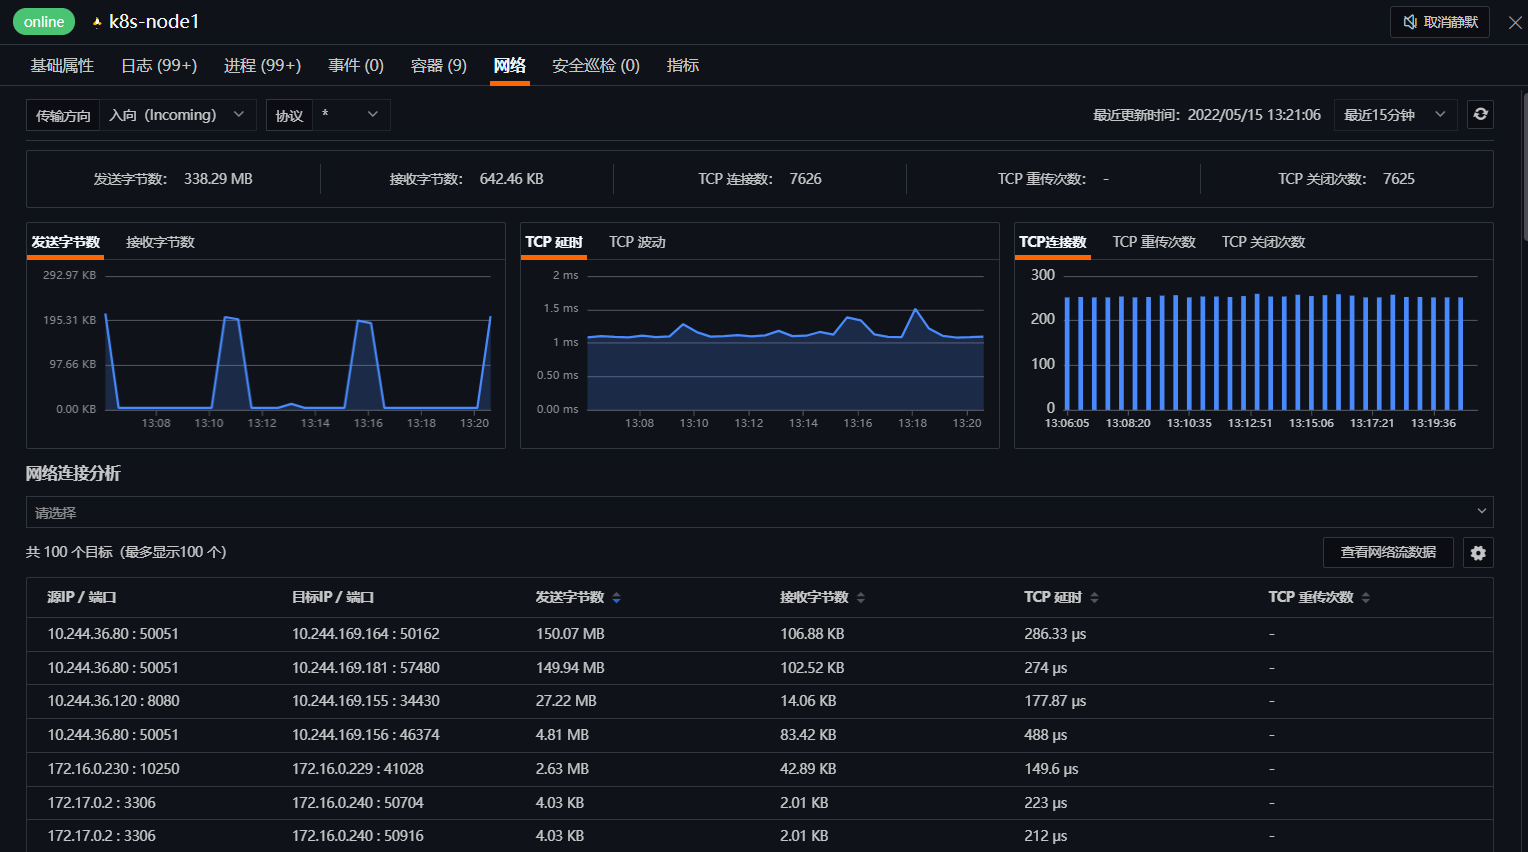
Log in to Guance → Infrastructure and click k8s-node1.
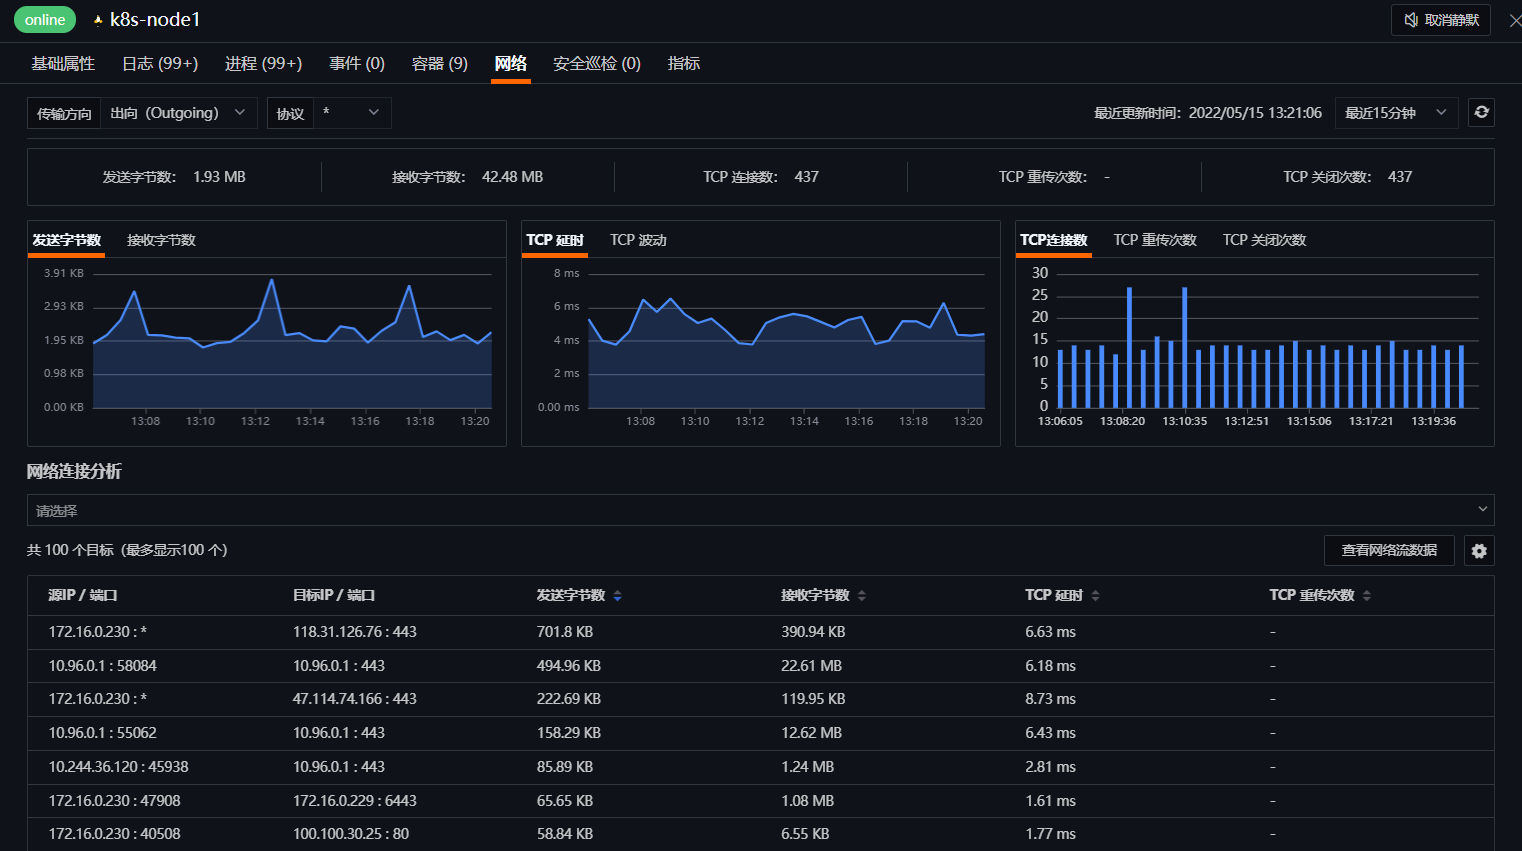
Click Network to view the eBPF monitoring dashboard.
2.2 Container Observability
- Enable the collector
DataKit has the Container collector enabled by default. Here we introduce how to configure the custom collector.
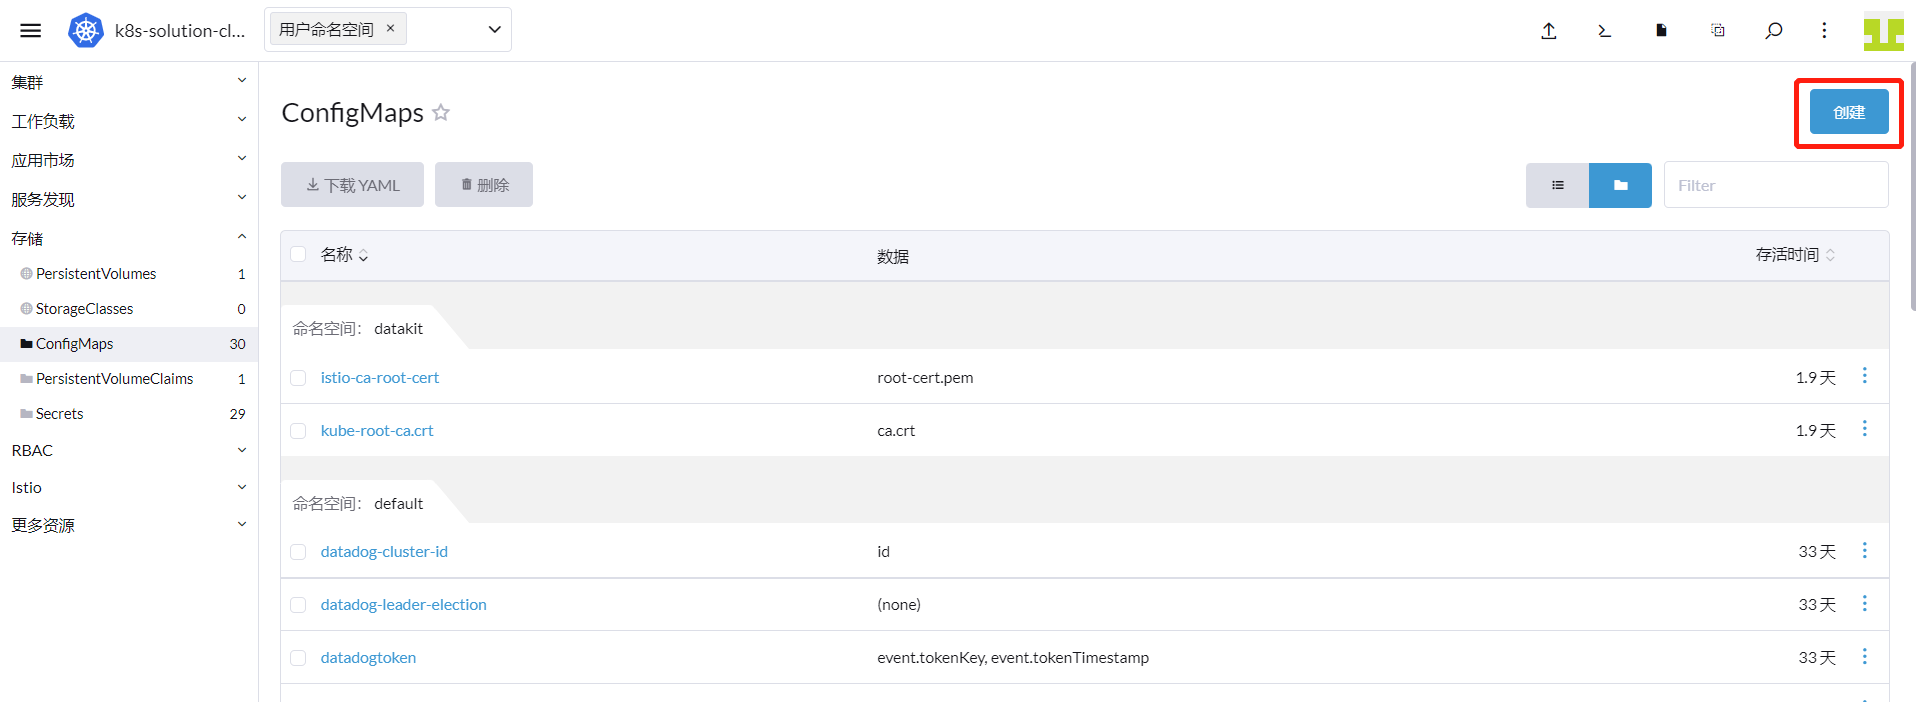
Log in to Rancher → Cluster → Storage → ConfigMaps, and click Create.
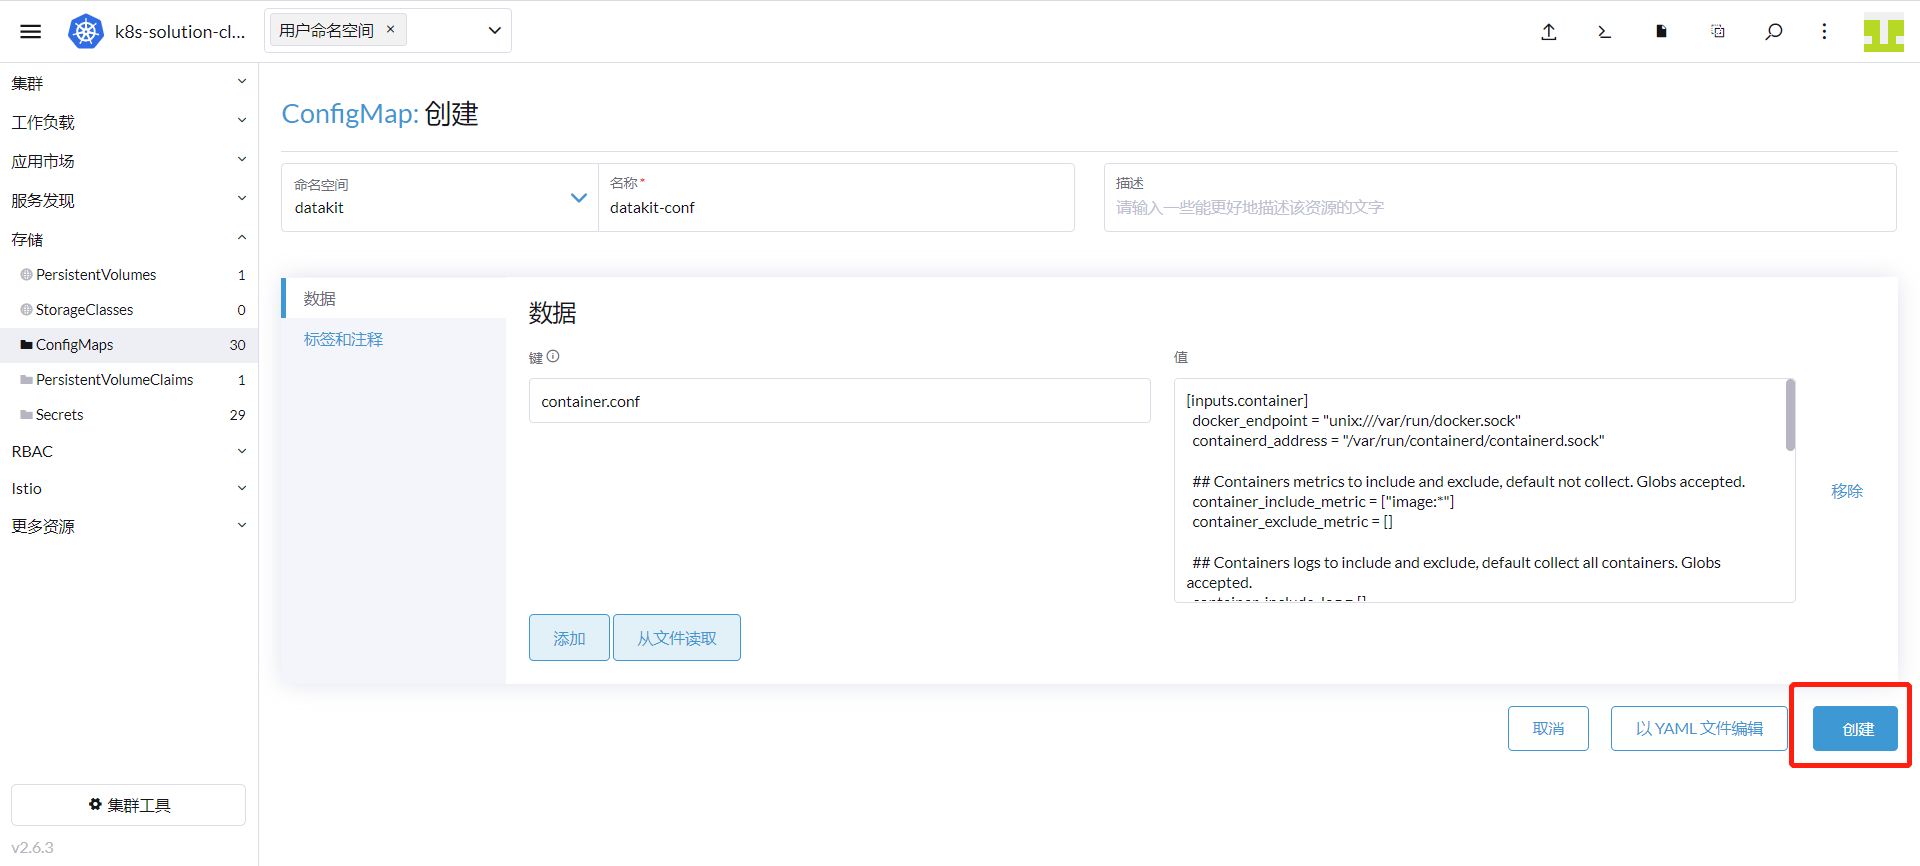
Enter datakit as the namespace, datakit-conf as the name, container.conf as the key, and the following content as the value.
Note: In production, it is recommended to set
container_include_log = []andcontainer_exclude_log = ["image:*"], then add annotations to the Pods whose logs you want to collect so that only the specified container logs are collected.
      [inputs.container]
        docker_endpoint = "unix:///var/run/docker.sock"
        containerd_address = "/var/run/containerd/containerd.sock"

        enable_container_metric = true
        enable_k8s_metric = true
        enable_pod_metric = true

        ## Containers logs to include and exclude, default collect all containers. Globs accepted.
        container_include_log = []
        container_exclude_log = ["image:pubrepo.guance.com/datakit/logfwd*", "image:pubrepo.guance.com/datakit/datakit*"]

        exclude_pause_container = true

        ## Removes ANSI escape codes from text strings
        logging_remove_ansi_escape_codes = false

        kubernetes_url = "https://kubernetes.default:443"

        ## Authorization level:
        ##   bearer_token  - bearer_token_string  - TLS
        ## Use bearer token for authorization. ('bearer_token' takes priority)
        ## linux at:   /run/secrets/kubernetes.io/serviceaccount/token
        ## windows at: C:\var\run\secrets\kubernetes.io\serviceaccount\token
        bearer_token = "/run/secrets/kubernetes.io/serviceaccount/token"
        # bearer_token_string = "<your-token-string>"

        [inputs.container.tags]
          # some_tag = "some_value"
          # more_tag = "some_other_value"
Fill in the content as shown below, then click Create.
Go to Cluster → Workloads → DaemonSets, find datakit, and click Edit Config.
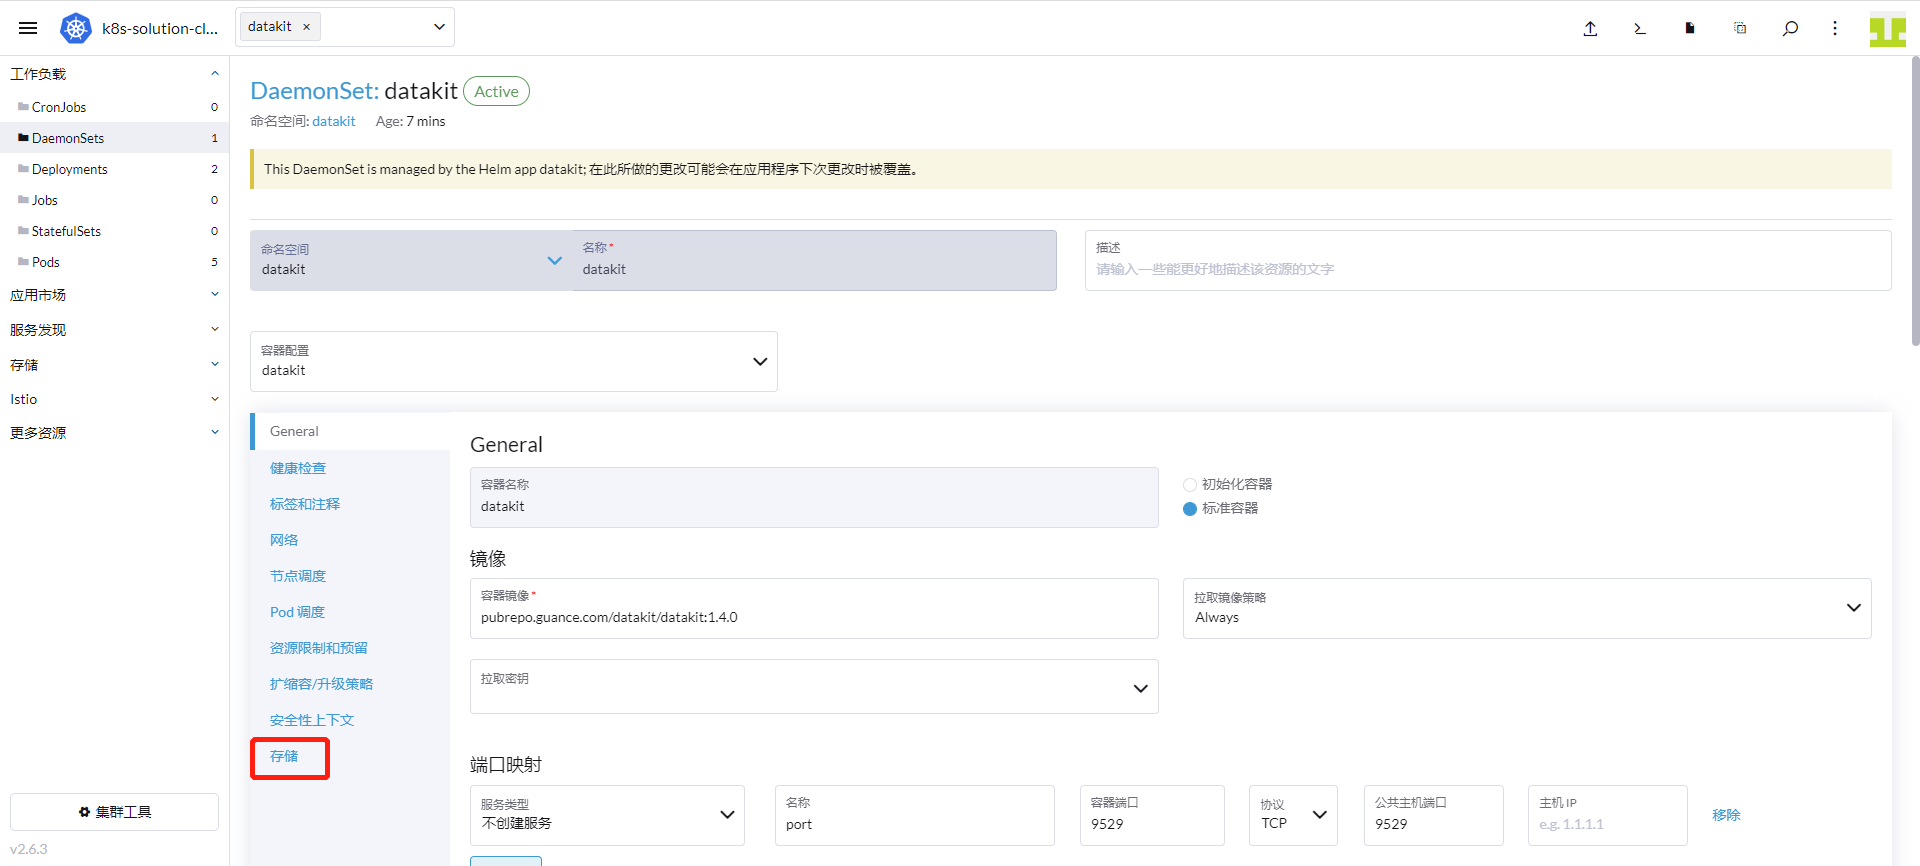
Click Storage.
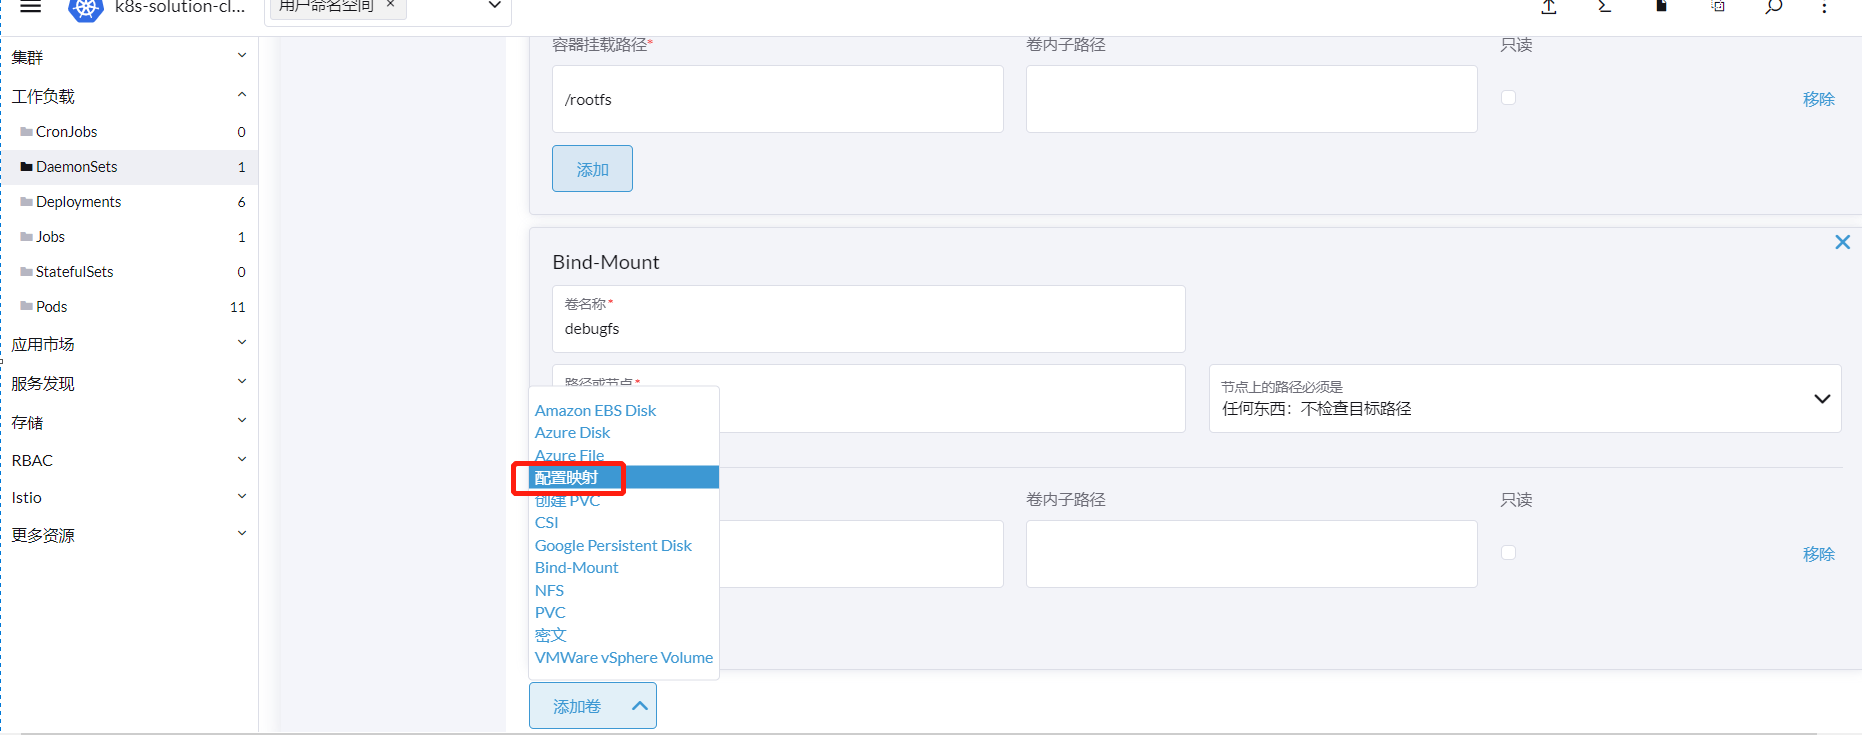
Click Add Volume → ConfigMap.
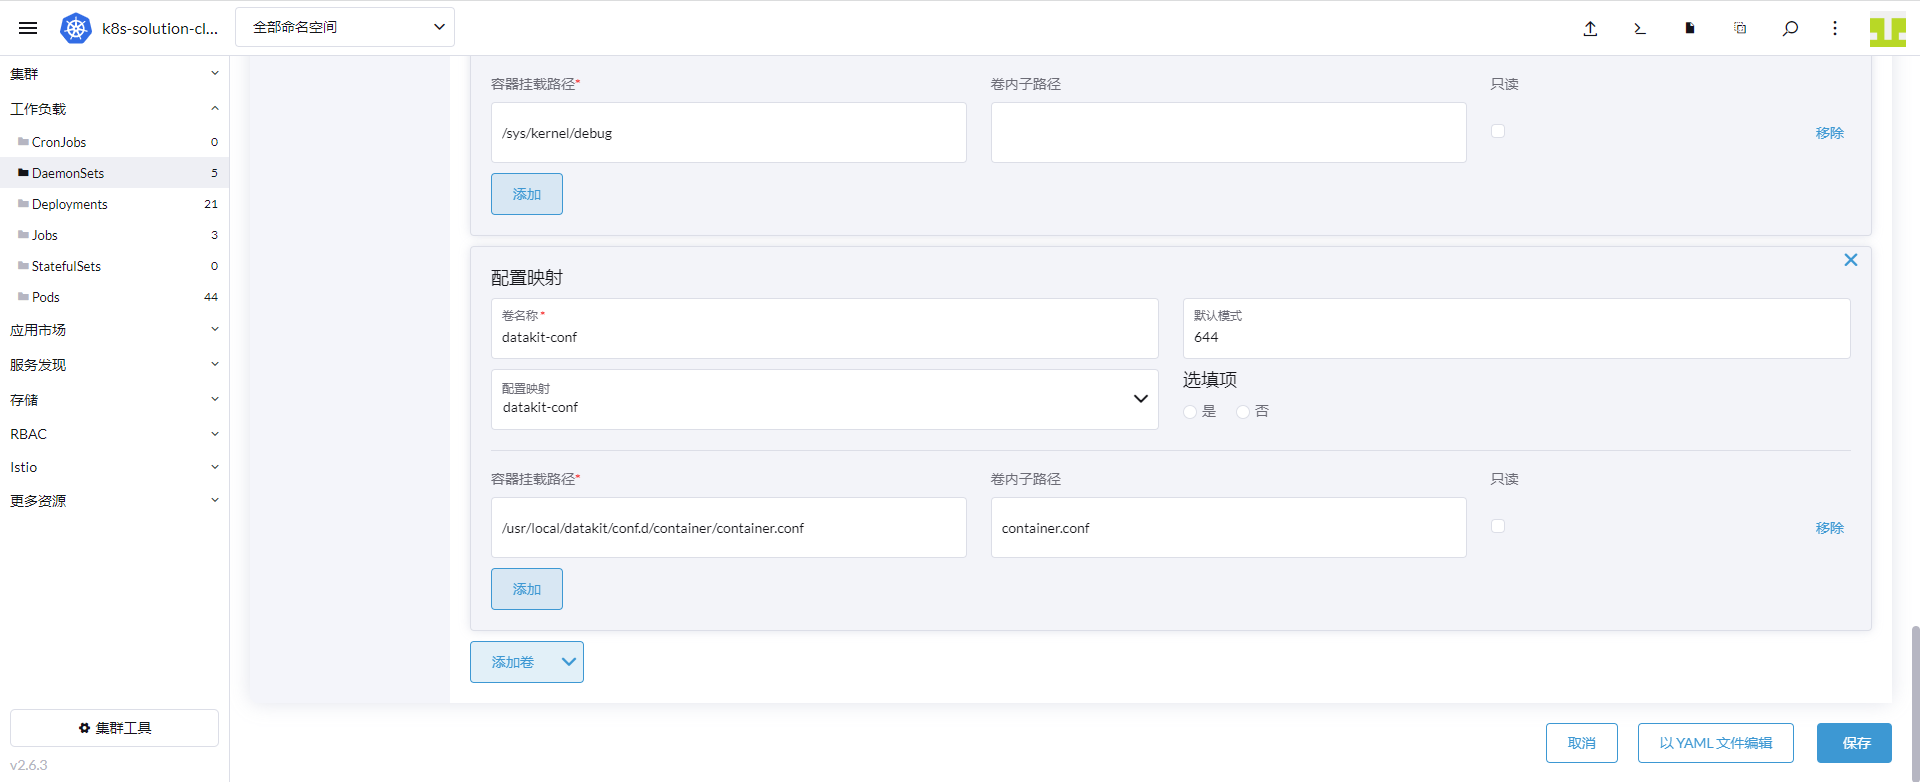
Enter datakit-conf as the volume name, select datakit.conf as the ConfigMap, enter container.conf as the sub-path within the volume, and enter /usr/local/datakit/conf.d/container/container.conf as the mount path. Click Save.
- Container Monitoring Dashboard
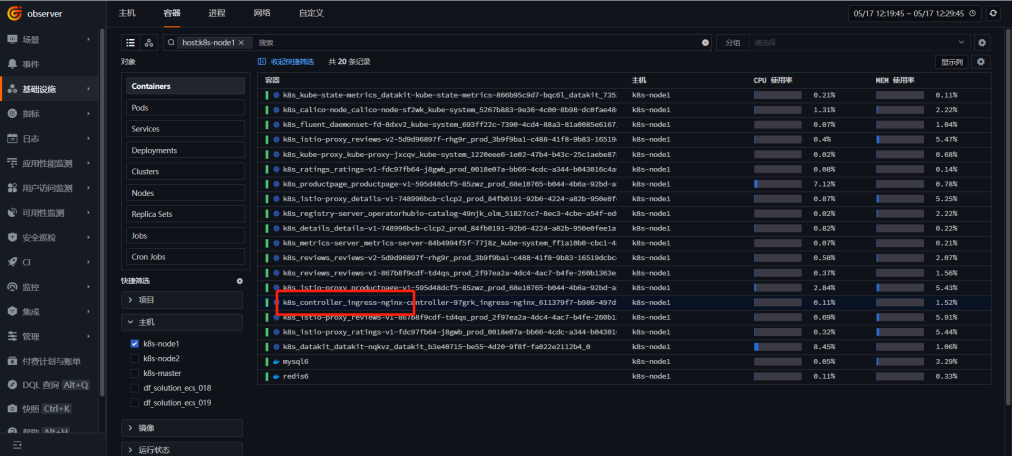
Log in to Guance → Infrastructure → Containers, enter host:k8s-node1 to show containers on the k8s-node1 node, and click ingress.
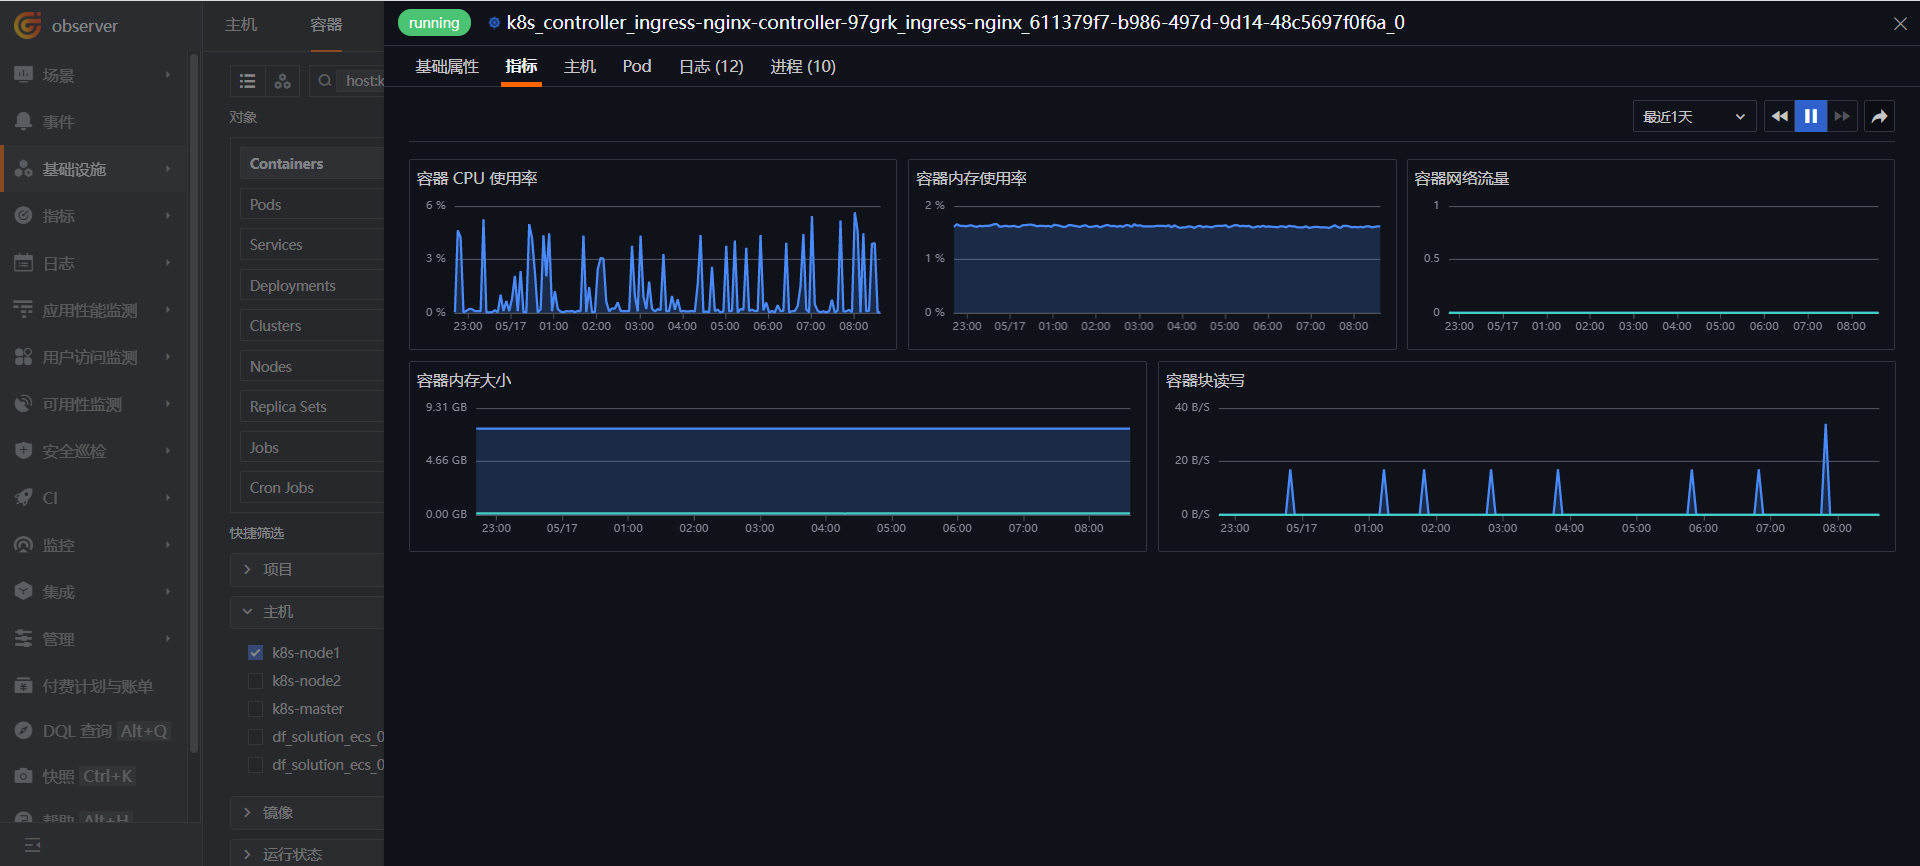
Click Metrics to view the DataKit Container monitoring dashboard.
2.3 Kubernetes Monitoring Dashboard
- Deploy the collector
metrics-server and kube-state-metrics have already been installed when installing DataKit.
- Deploy the Kubernetes Monitoring Dashboard
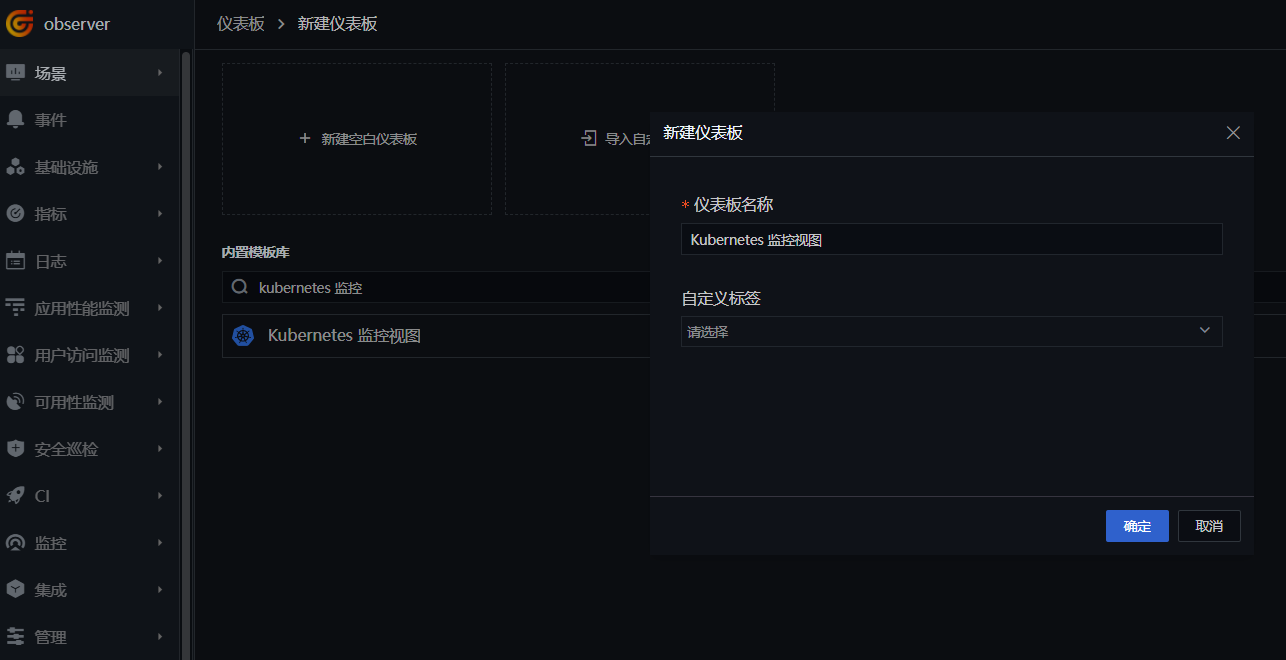
Log in to Guance, go to the Scenarios module, click Create Dashboard, enter kubernetes monitoring, select Kubernetes Monitoring Dashboard, and click OK.
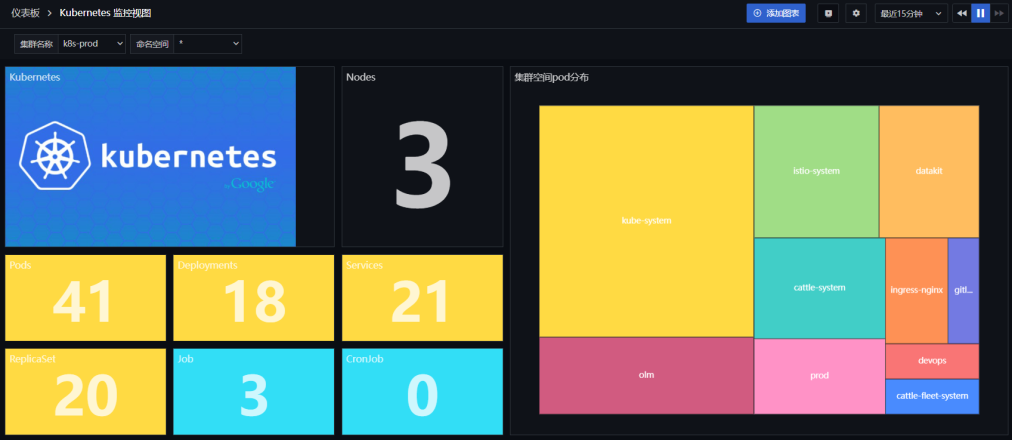
Click the newly created Kubernetes Monitoring Dashboard to view cluster information.
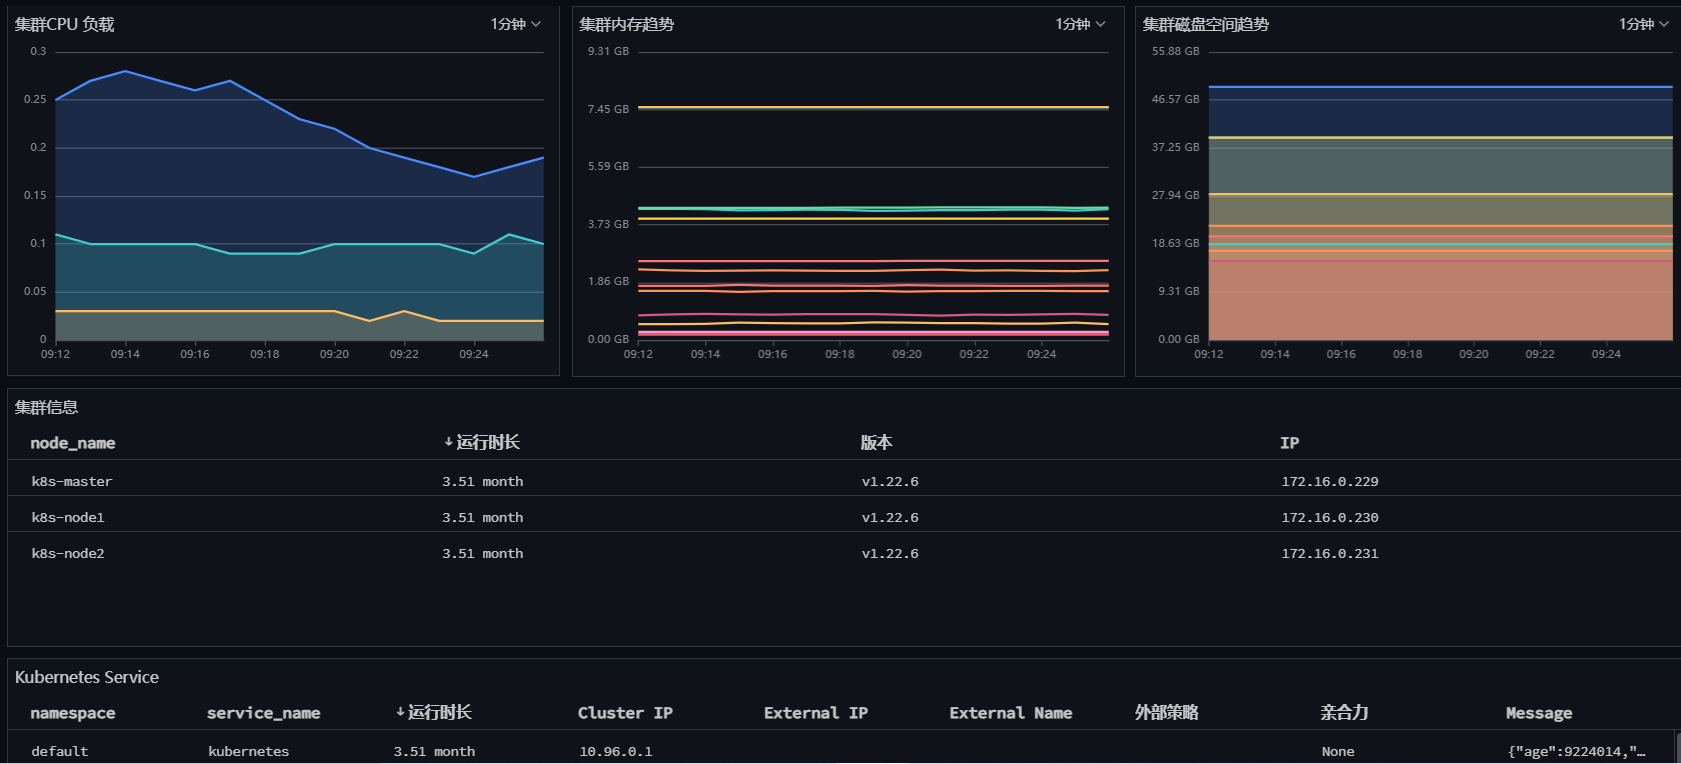
2.4 Kubernetes Overview with Kube State Metrics Dashboard
- Enable the collector
Log in to Rancher → Cluster → Storage → ConfigMaps, find datakit-conf, and click Edit Config.
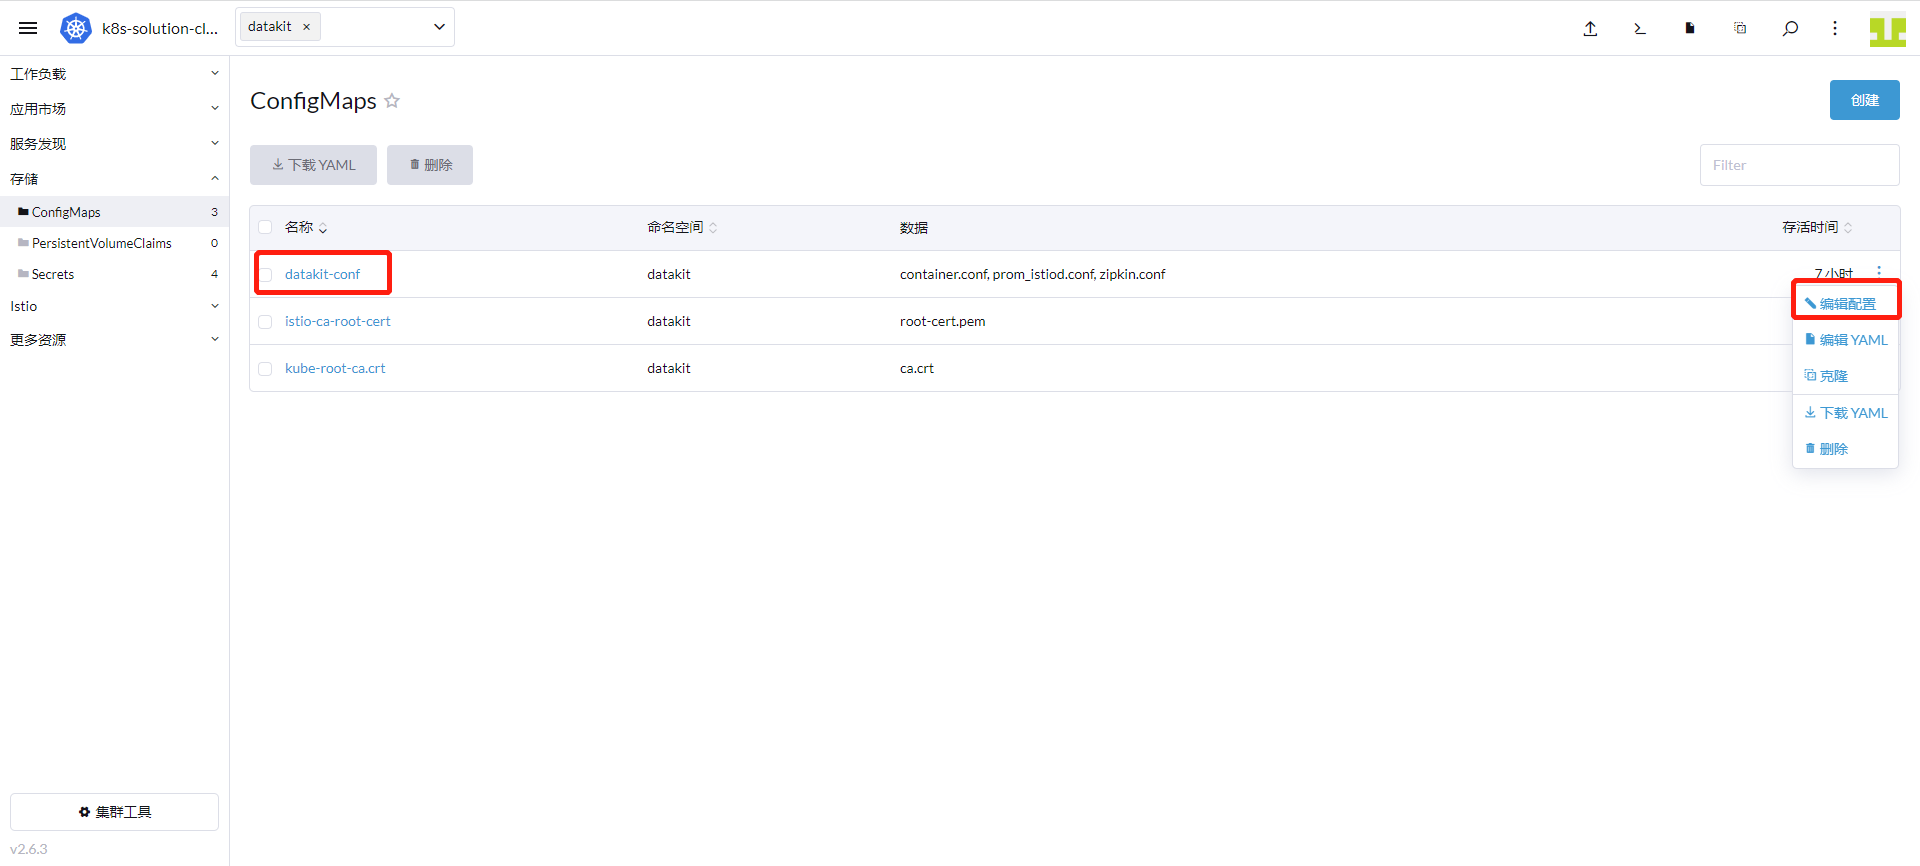
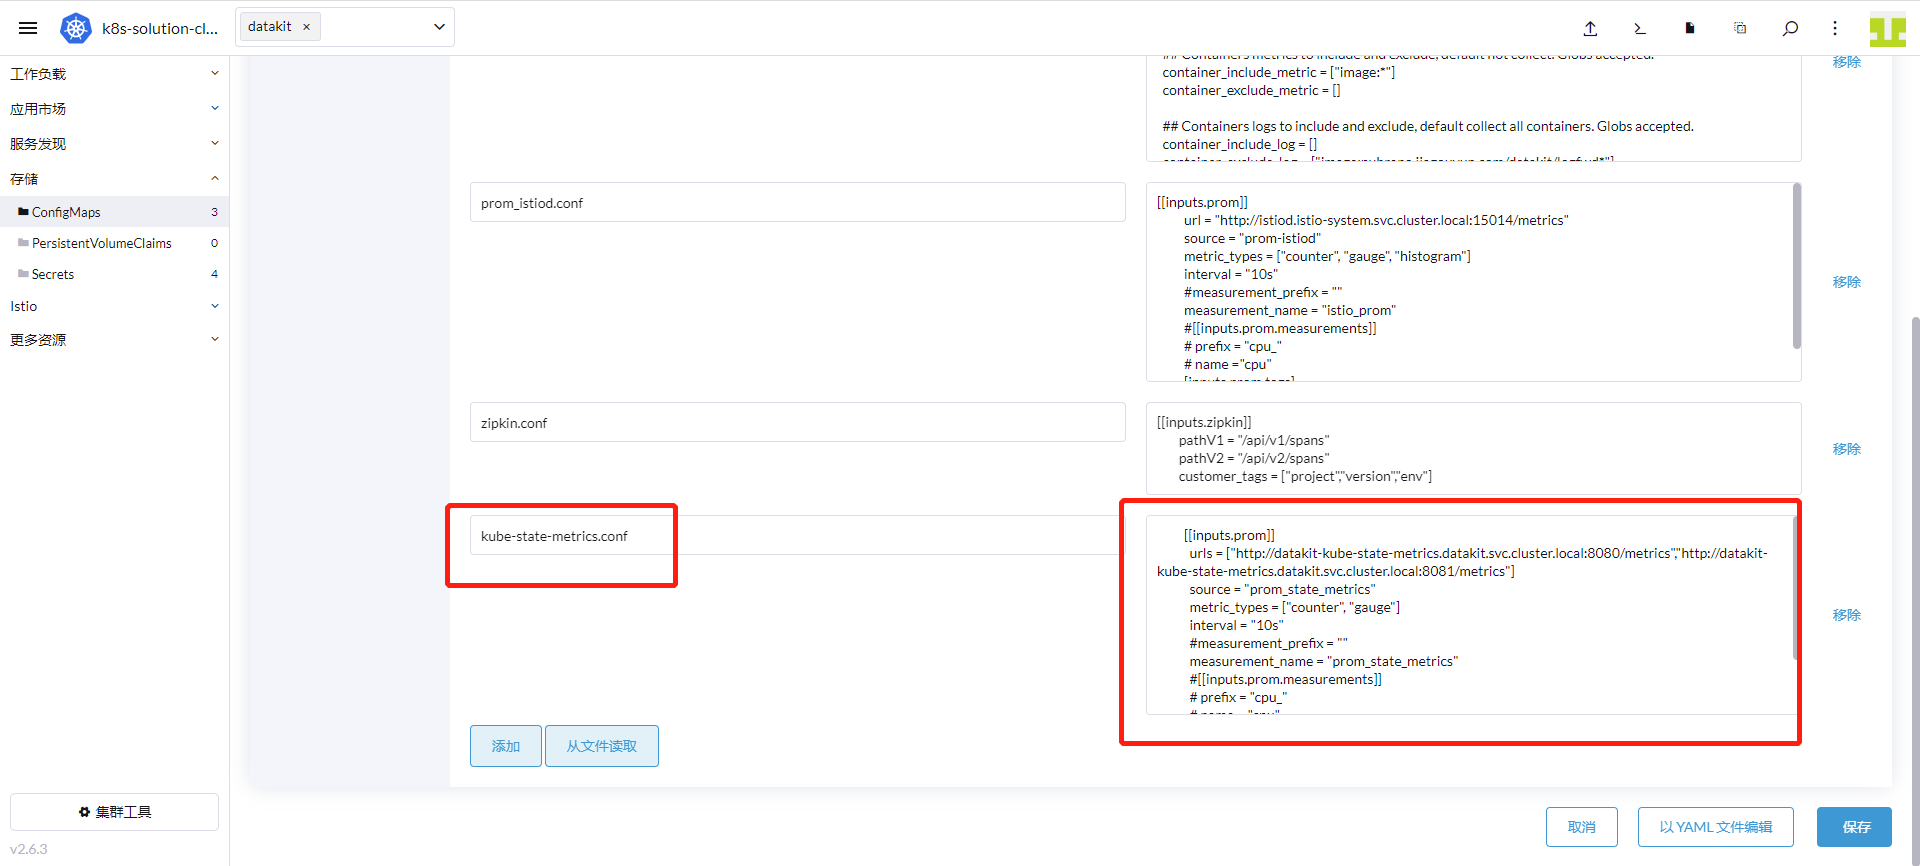
Click Add, enter kube-state-metrics.conf as the key, and the following content as the value. Click Save.
          [[inputs.prom]]
            urls = ["http://datakit-kube-state-metrics.datakit.svc.cluster.local:8080/metrics","http://datakit-kube-state-metrics.datakit.svc.cluster.local:8081/metrics"]
            source = "prom_state_metrics"
            metric_types = ["counter", "gauge"]
            interval = "60s"
            tags_ignore = ["access_mode","branch","claim_namespace","cluster_ip","condition","configmap","container","container_id","container_runtime_version","created_by_kind","created_by_name","effect","endpoint","external_name","goversion","host_network","image","image_id","image_spec","ingress","ingressclass","internal_ip","job_name","kernel_version","key","kubelet_version","kubeproxy_version","lease","mutatingwebhookconfiguration","name","networkpolicy","node","node_name","os_image","owner_is_controller","owner_kind","owner_name","path","persistentvolume","persistentvolumeclaim","pod_cidr","pod_ip","poddisruptionbudget","port_name","port_number","port_protocol","priority_class","reason","resource","result","revision","role","secret","service","service_name","service_port","shard_ordinal","status","storageclass","system_uuid","type","uid","unit","version","volume","volumename"]
            metric_name_filter = ["kube_pod_status_phase","kube_pod_container_status_restarts_total","kube_daemonset_status_desired_number_scheduled","kube_daemonset_status_number_ready","kube_deployment_spec_replicas","kube_deployment_status_replicas_available","kube_deployment_status_replicas_unavailable","kube_replicaset_status_ready_replicas","kube_replicaset_spec_replicas","kube_pod_container_status_running","kube_pod_container_status_waiting","kube_pod_container_status_terminated","kube_pod_container_status_ready"]
            #measurement_prefix = ""
            measurement_name = "prom_state_metrics"
            #[[inputs.prom.measurements]]
            # prefix = "cpu_"
            # name = "cpu"
            [inputs.prom.tags]
            namespace = "$NAMESPACE"
            pod_name = "$PODNAME"
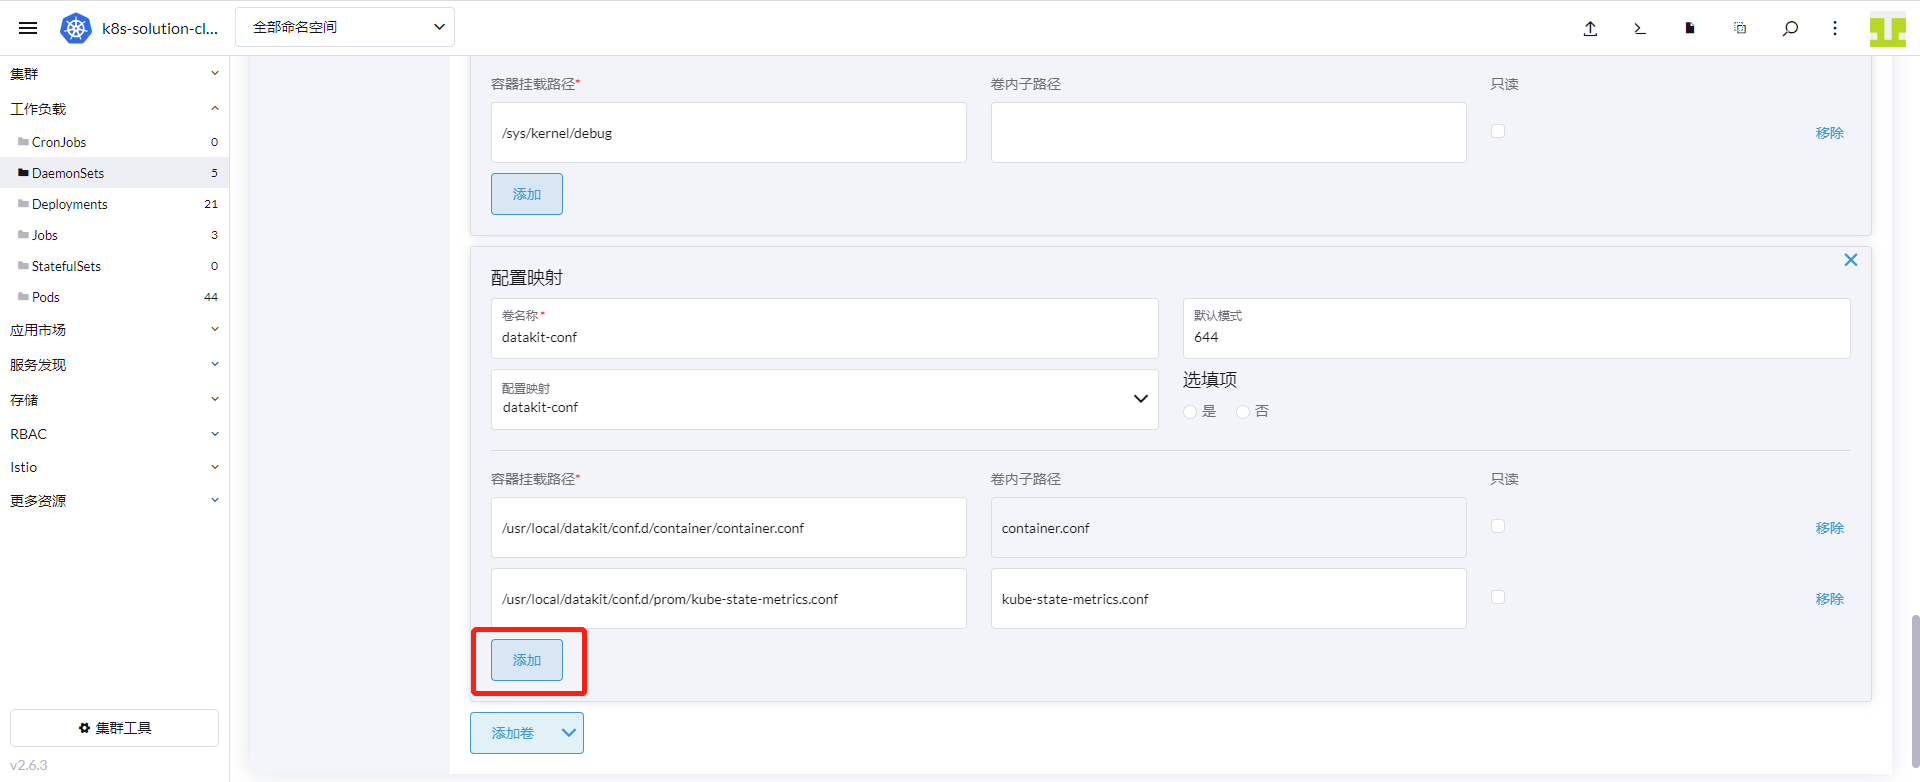
Go to Cluster → Workloads → DaemonSets, click the action menu on the right of the datakit row, and select Edit Config.
Click Storage, find the ConfigMap volume named datakit-conf, click Add, enter /usr/local/datakit/conf.d/prom/kube-state-metrics.conf as the mount path, kube-state-metrics.conf as the sub-path within the volume, and click Save.
- Kubernetes Overview with Kube State Metrics Dashboard
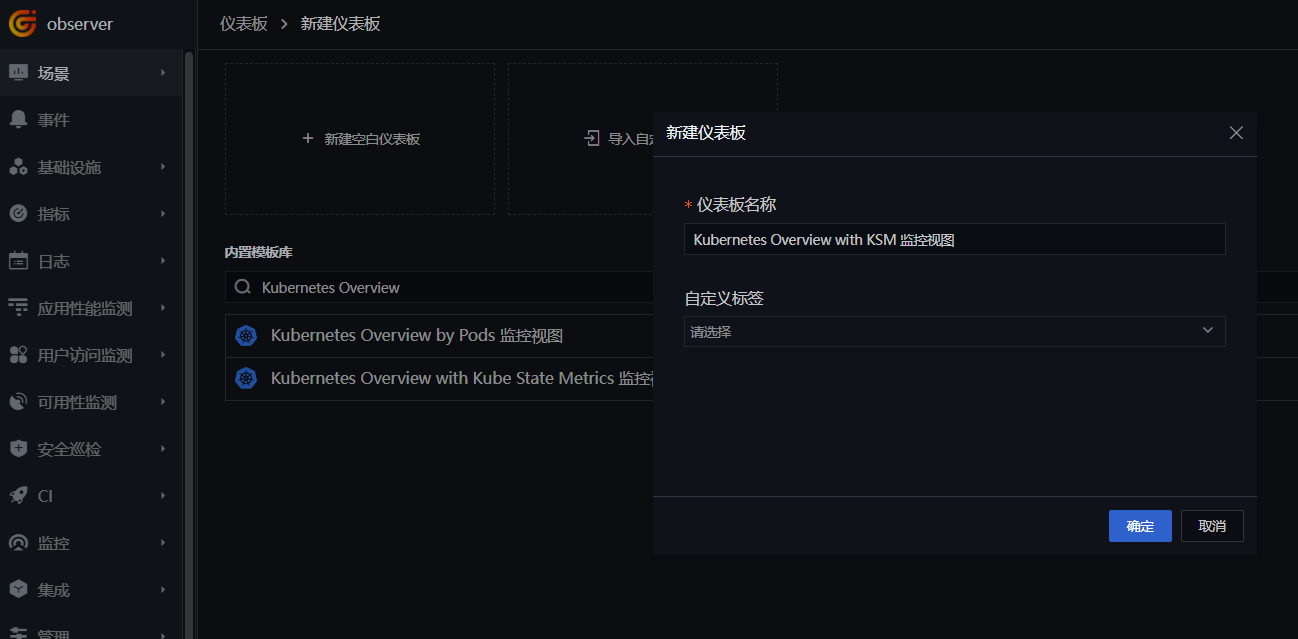
Log in to Guance, go to the Scenarios module, click Create Dashboard, enter kubernetes Overview, select Kubernetes Overview with Kube State Metrics Dashboard, and click OK.
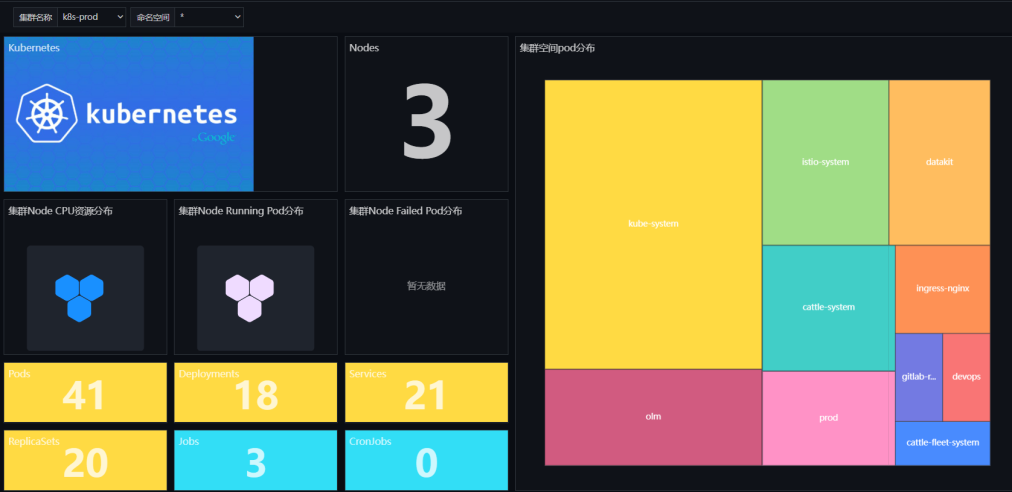
Click the newly created Kubernetes Overview with KSM Dashboard to view cluster information.
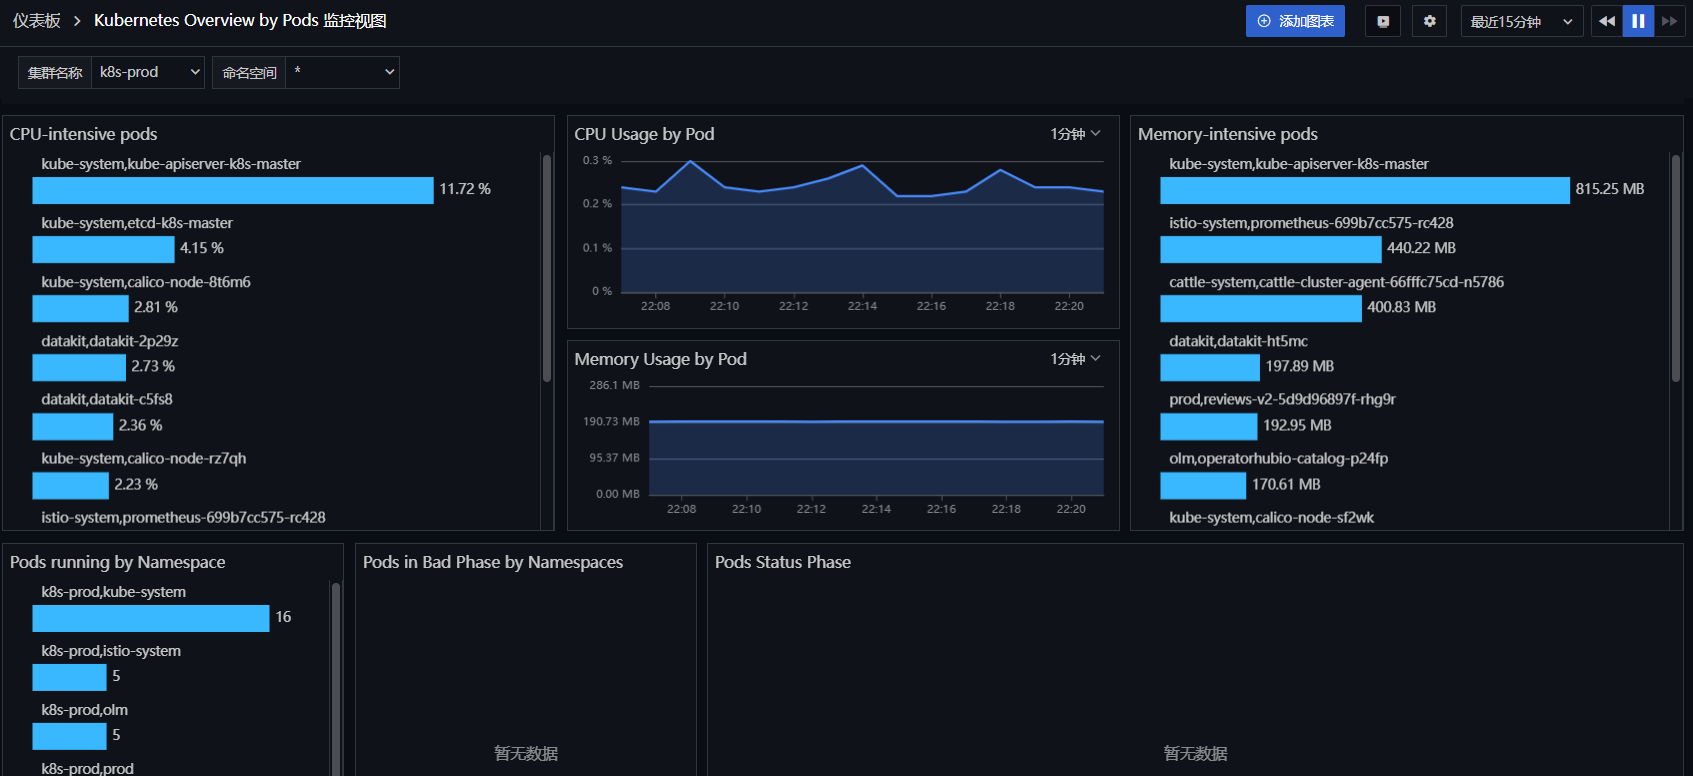
2.5 Kubernetes Overview by Pods Dashboard
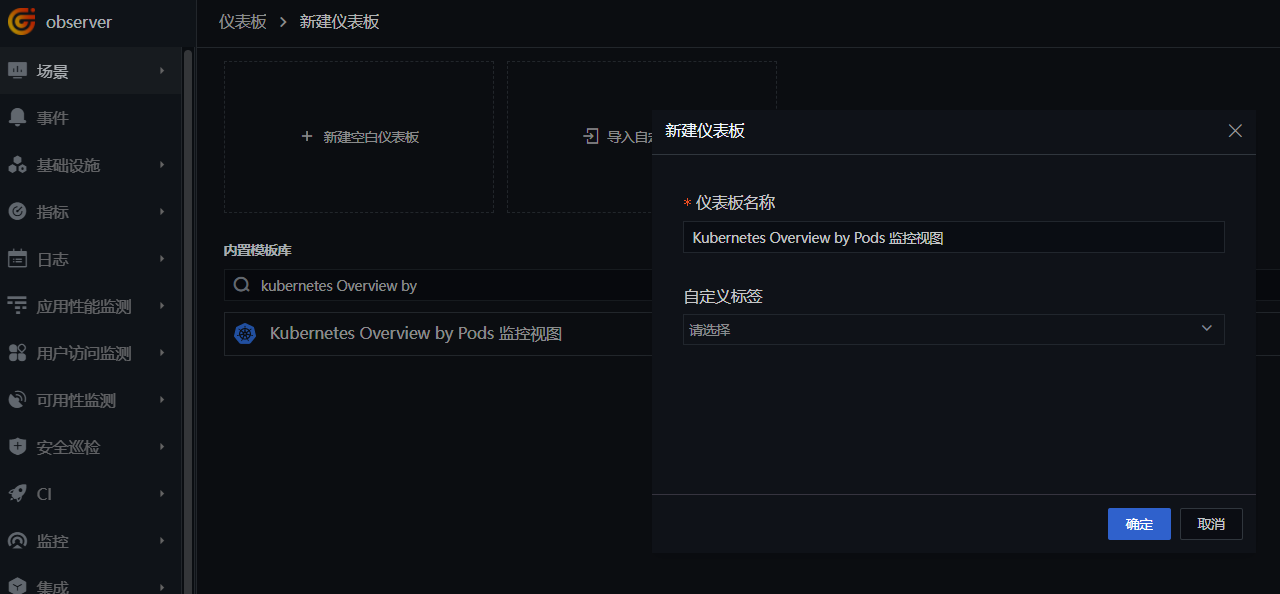
Log in to Guance, go to the Scenarios module, click Create Dashboard, enter kubernetes Overview by, select Kubernetes Overview by Pods Dashboard, and click OK.
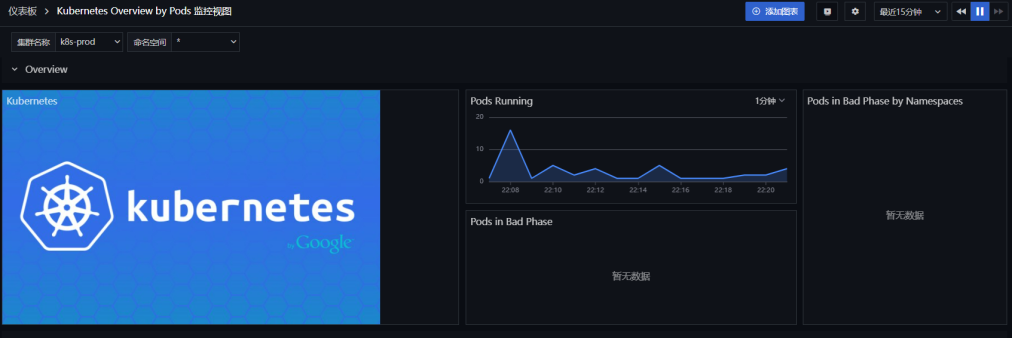
Click the newly created Kubernetes Overview by Pods Dashboard to view cluster information.
2.6 Kubernetes Services Dashboard
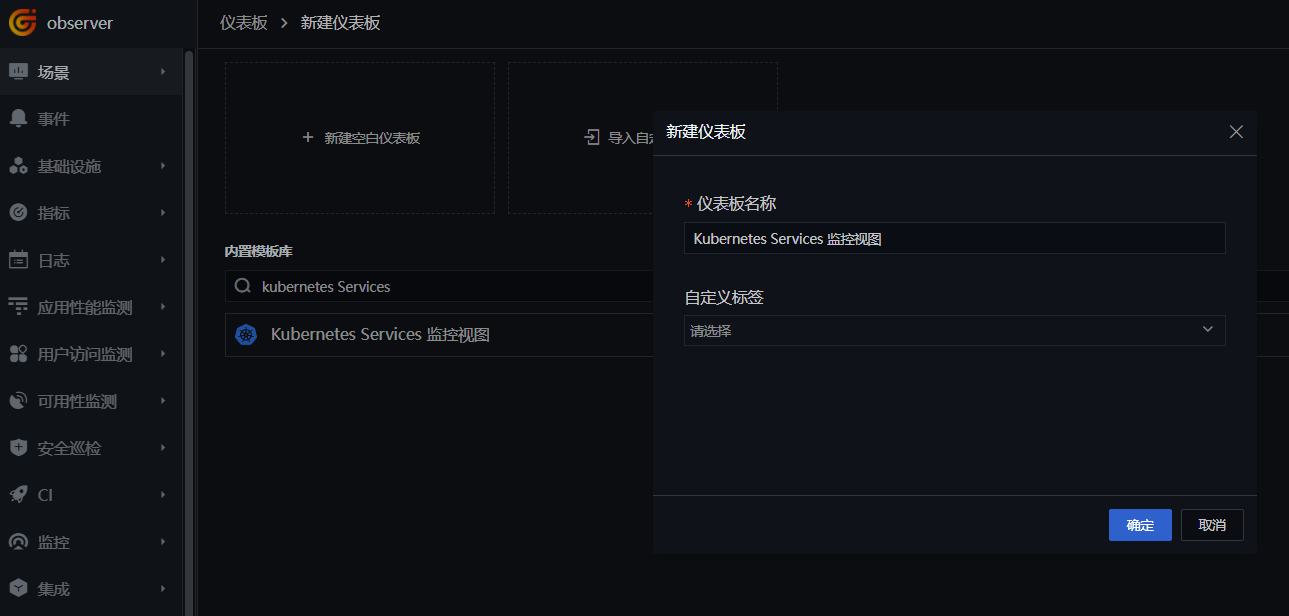
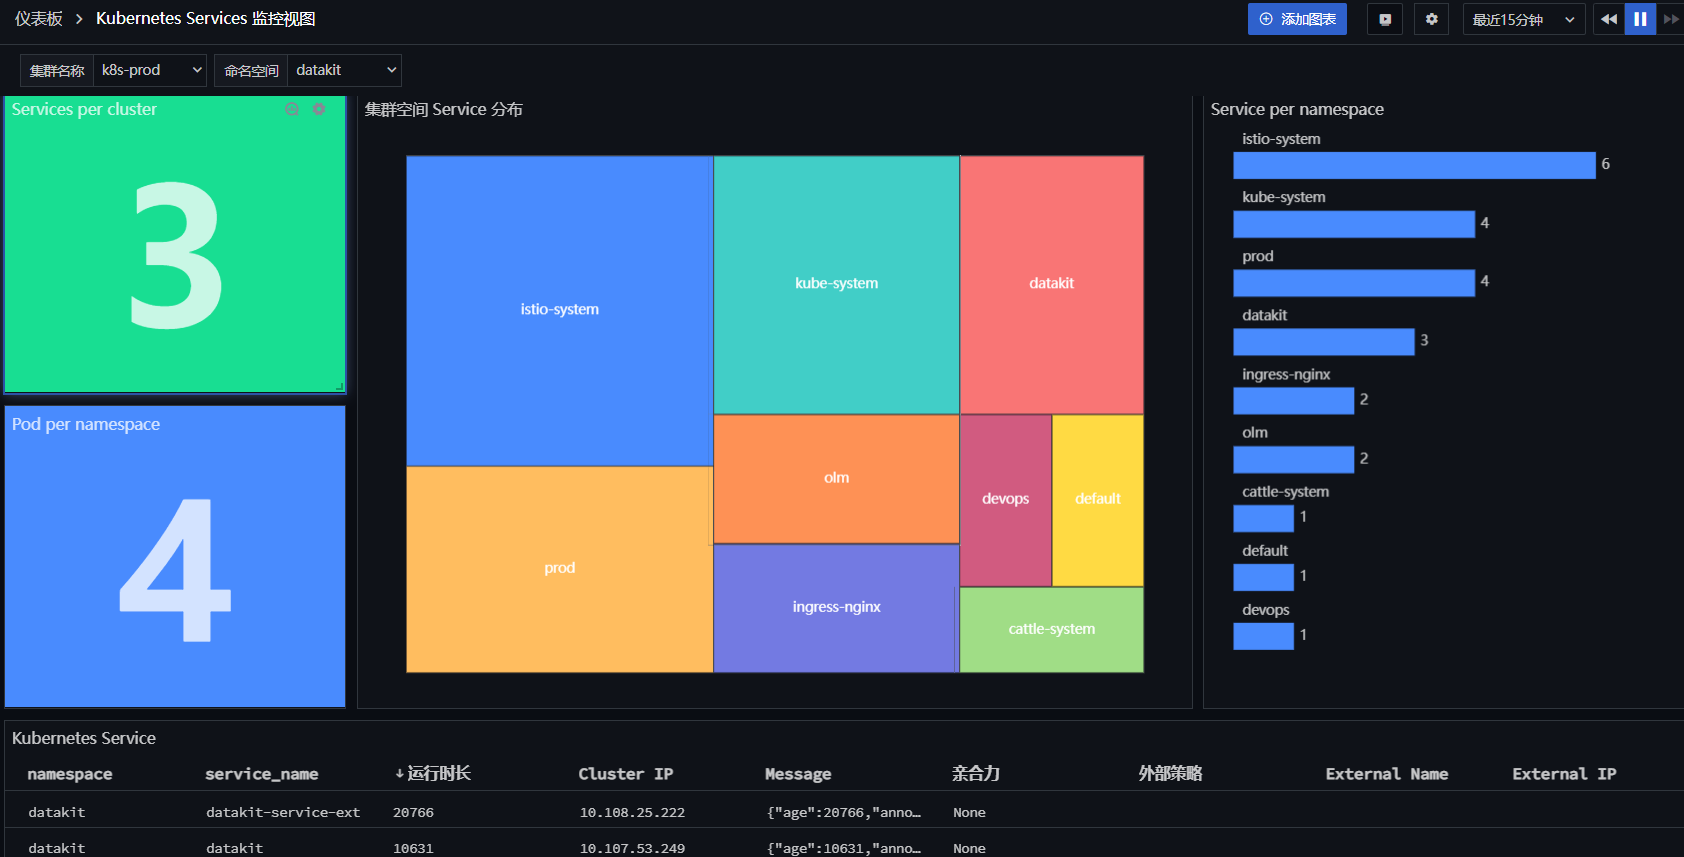
Log in to Guance, go to the Scenarios module, click Create Dashboard, enter kubernetes Services, select Kubernetes Services Dashboard, and click OK.
Click the newly created Kubernetes Services Dashboard to view cluster information.
Step 3: Deploy Istio and Applications
3.1 Deploy Istio
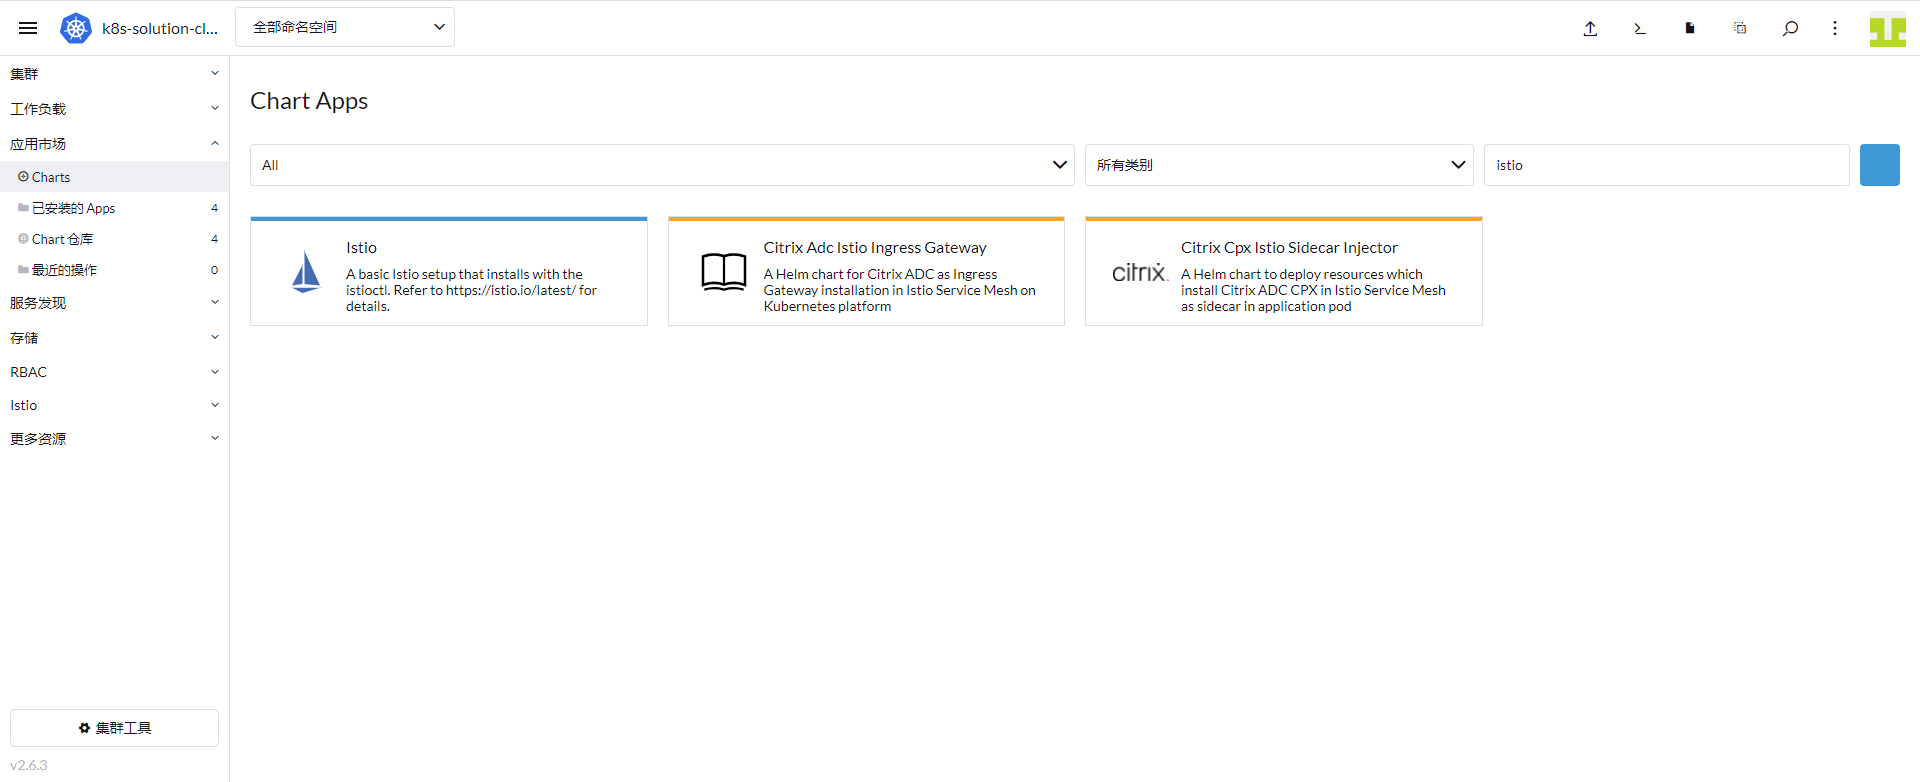
Log in to Rancher → App Marketplace → Charts, select Istio, and install it.
3.2 Enable Sidecar Injection
Create a namespace named prod and enable automatic sidecar injection for Pods created in this namespace so that all inbound and outbound traffic to the Pods is handled by the sidecar.
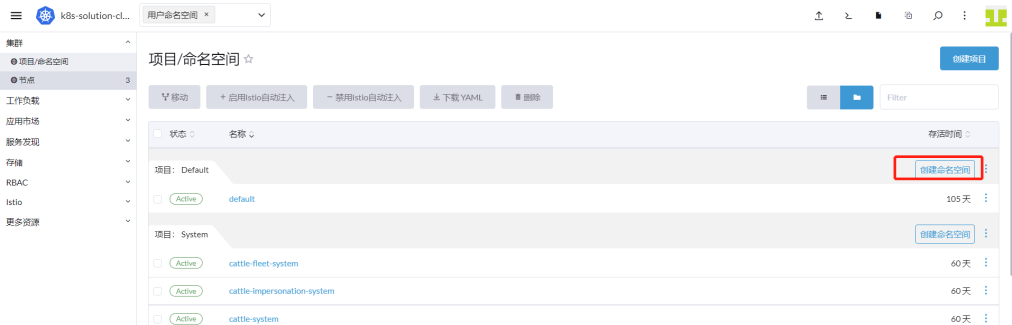
Log in to Rancher → Cluster → Projects/Namespaces, and click Create Namespace.
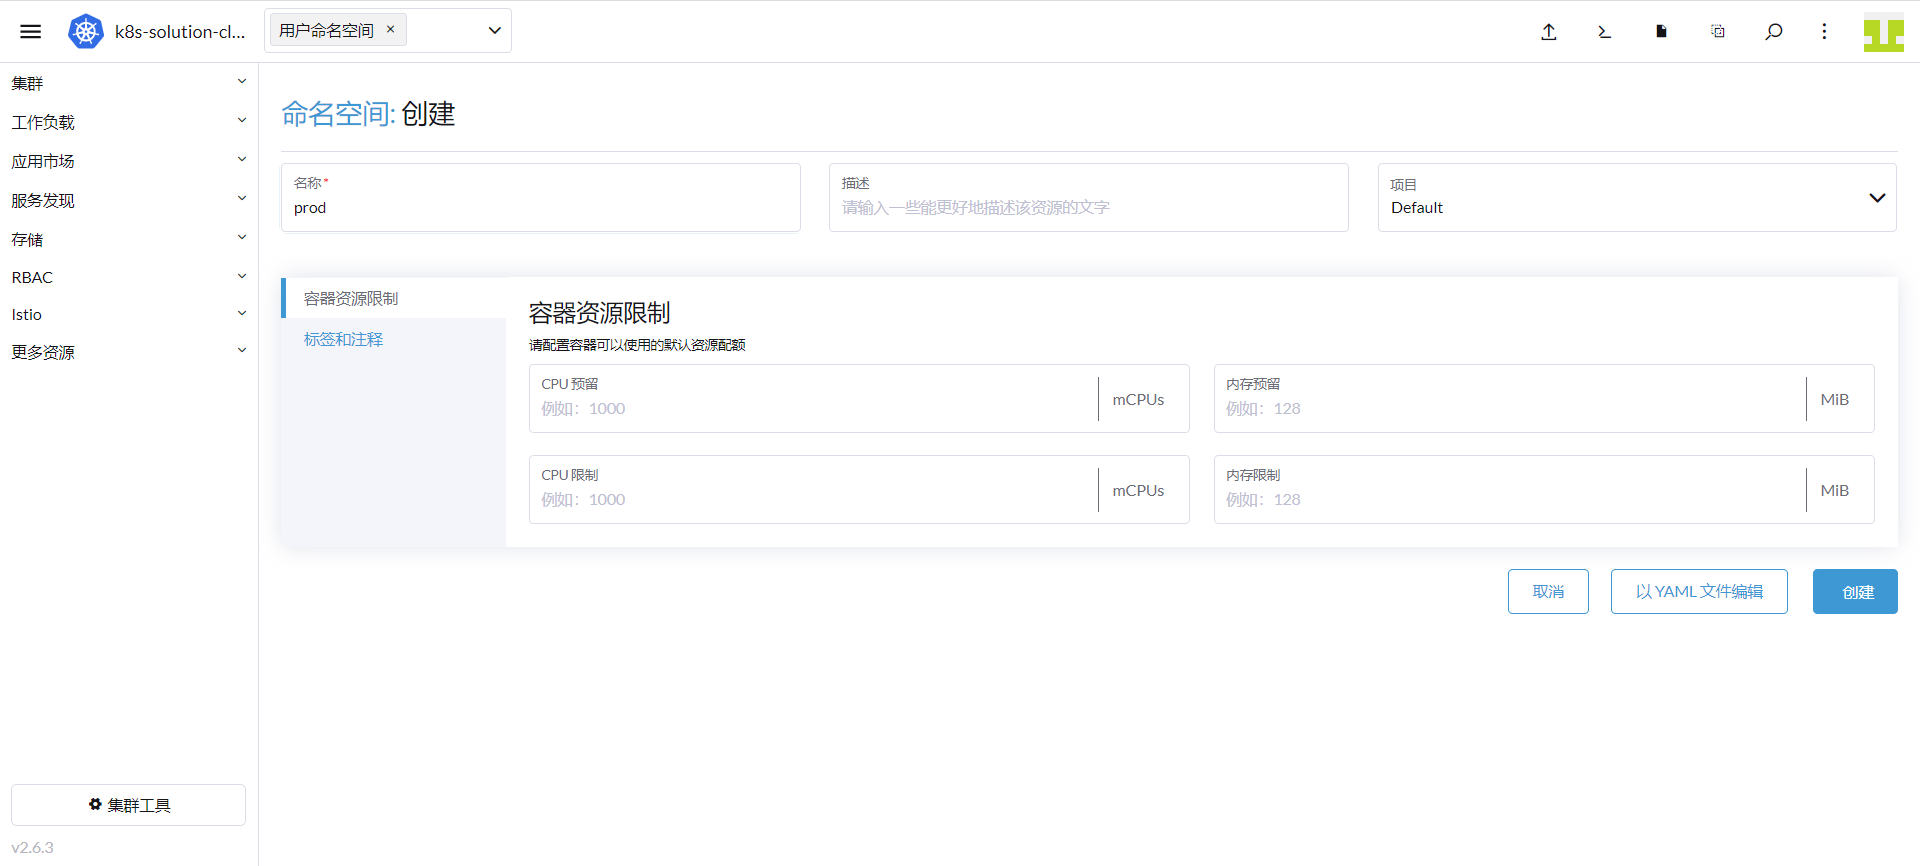
Enter prod as the name and click Create.
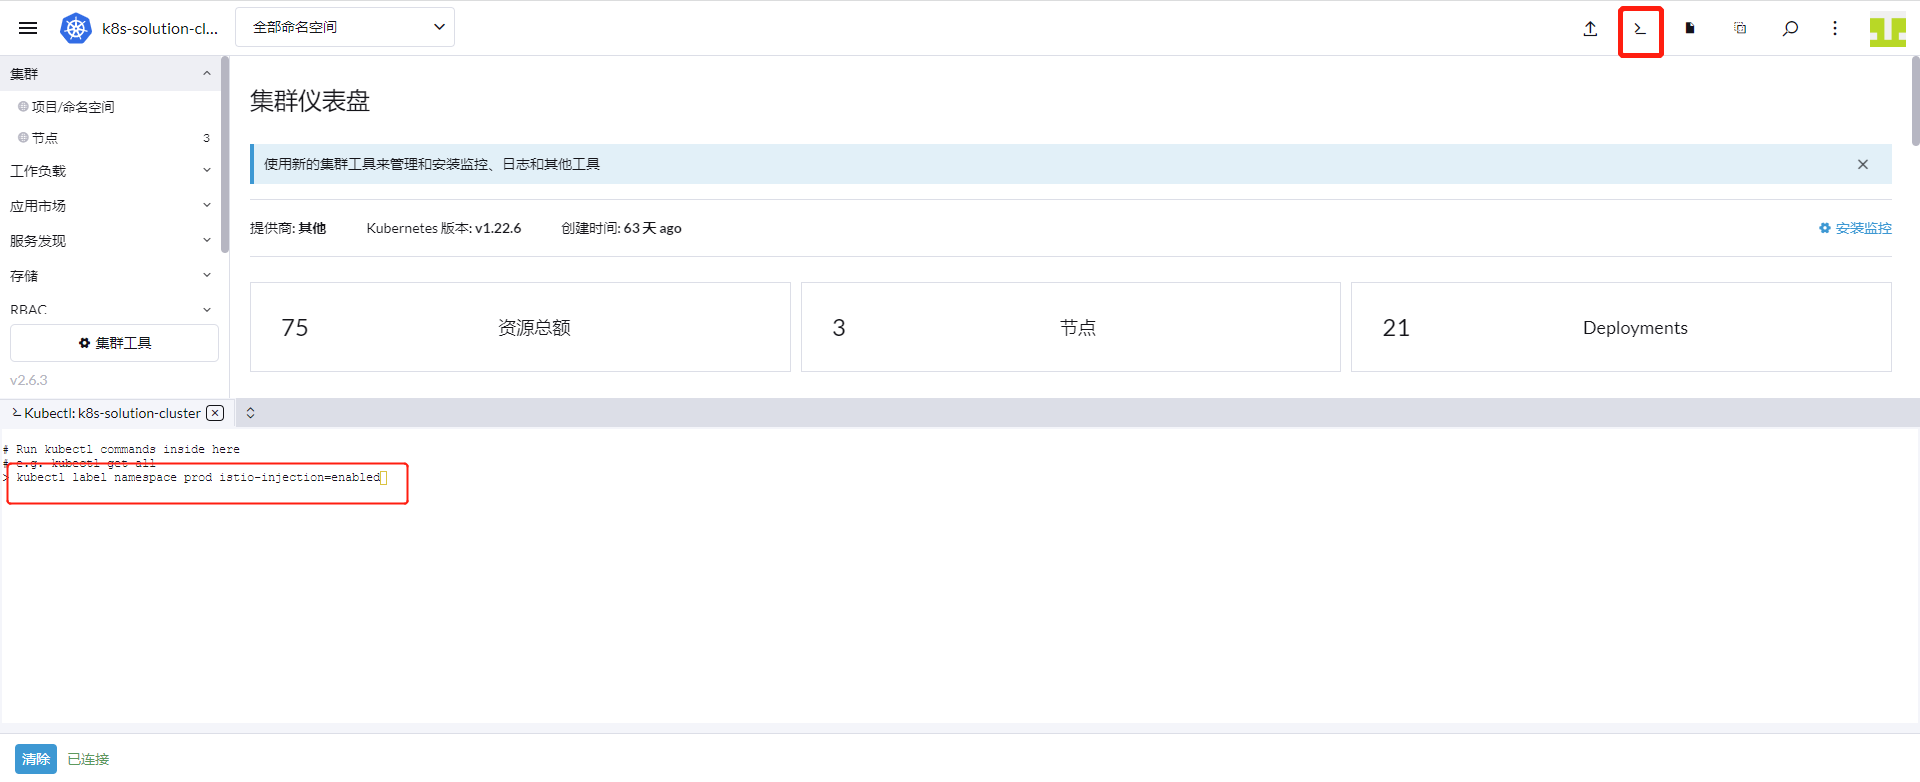
Click the Command Line icon at the top of the Rancher UI, enter kubectl label namespace prod istio-injection=enabled, and press Enter.
3.3 Enable the Istiod Collector
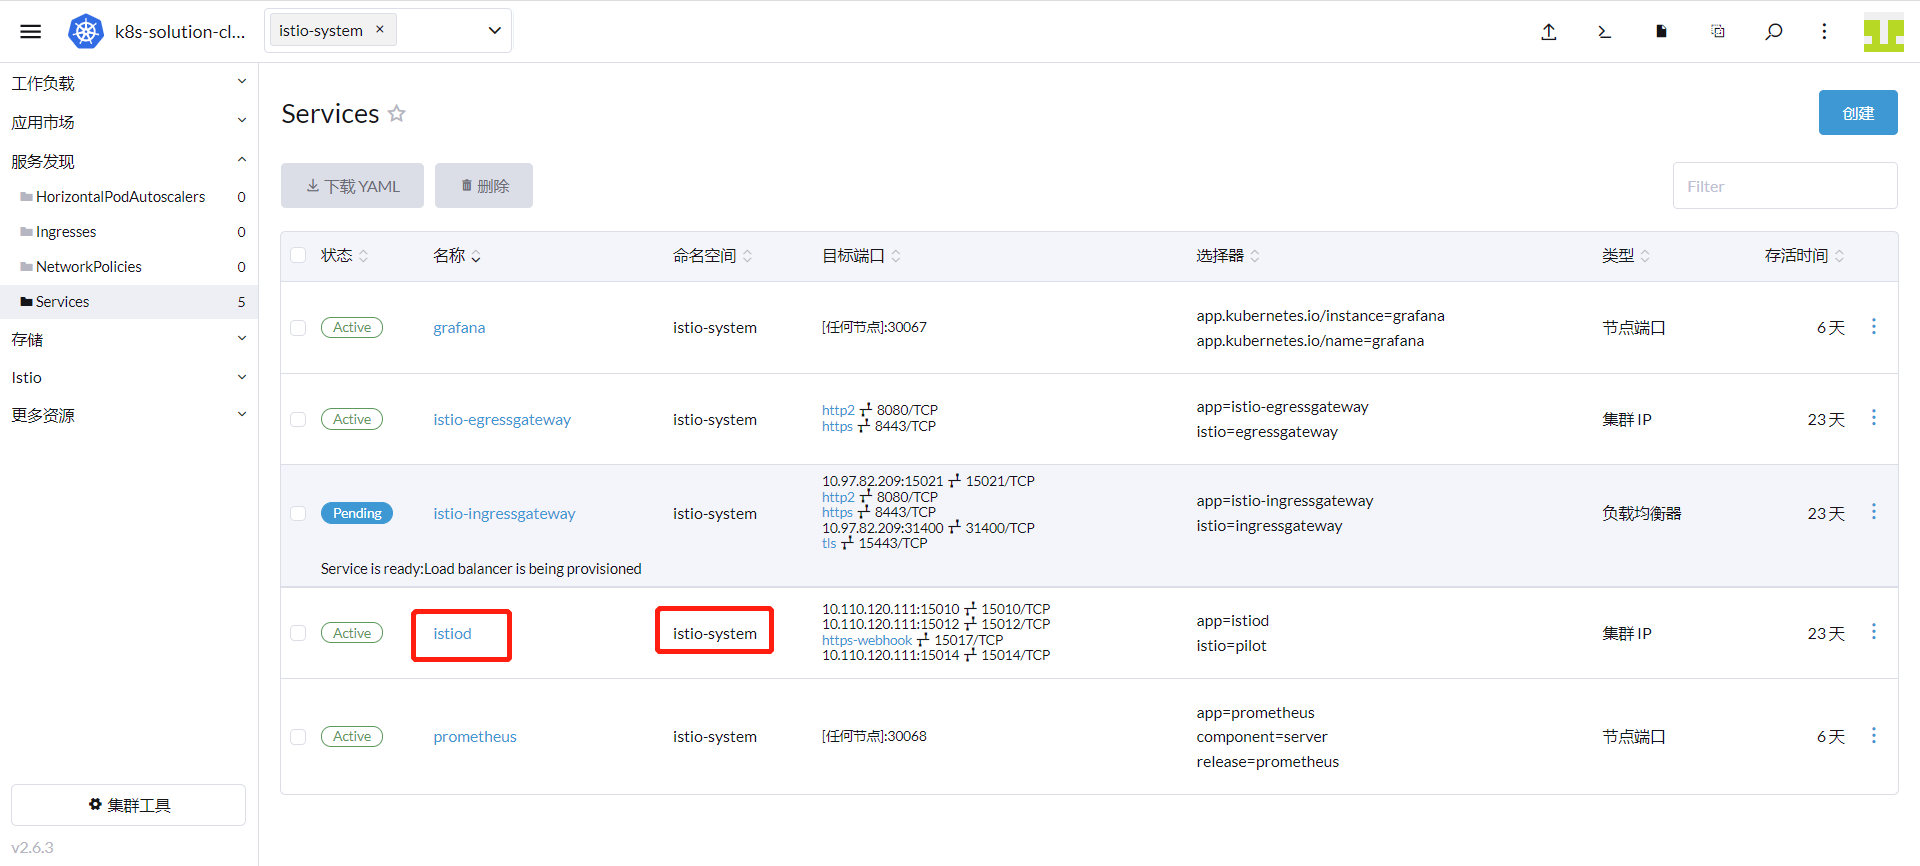
Log in to Rancher → Cluster → Service Discovery → Services, and find the service named istiod in the istio-system namespace.
Log in to Rancher → Cluster → Storage → ConfigMaps, find datakit-conf, and click Edit Config.
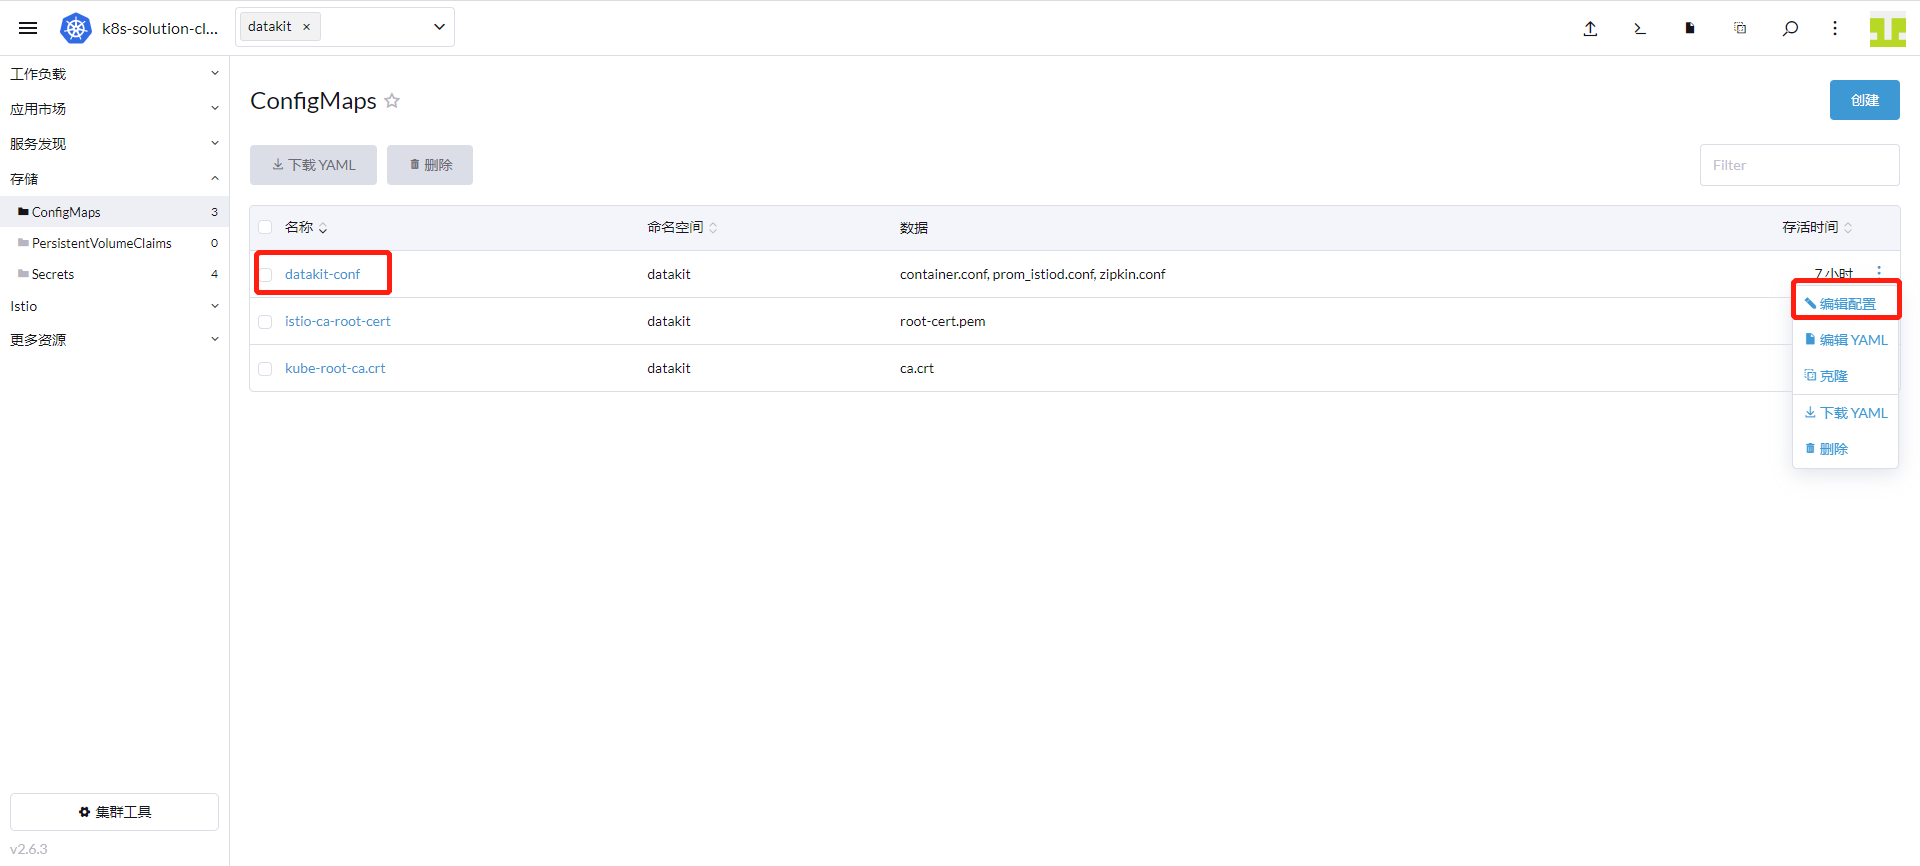
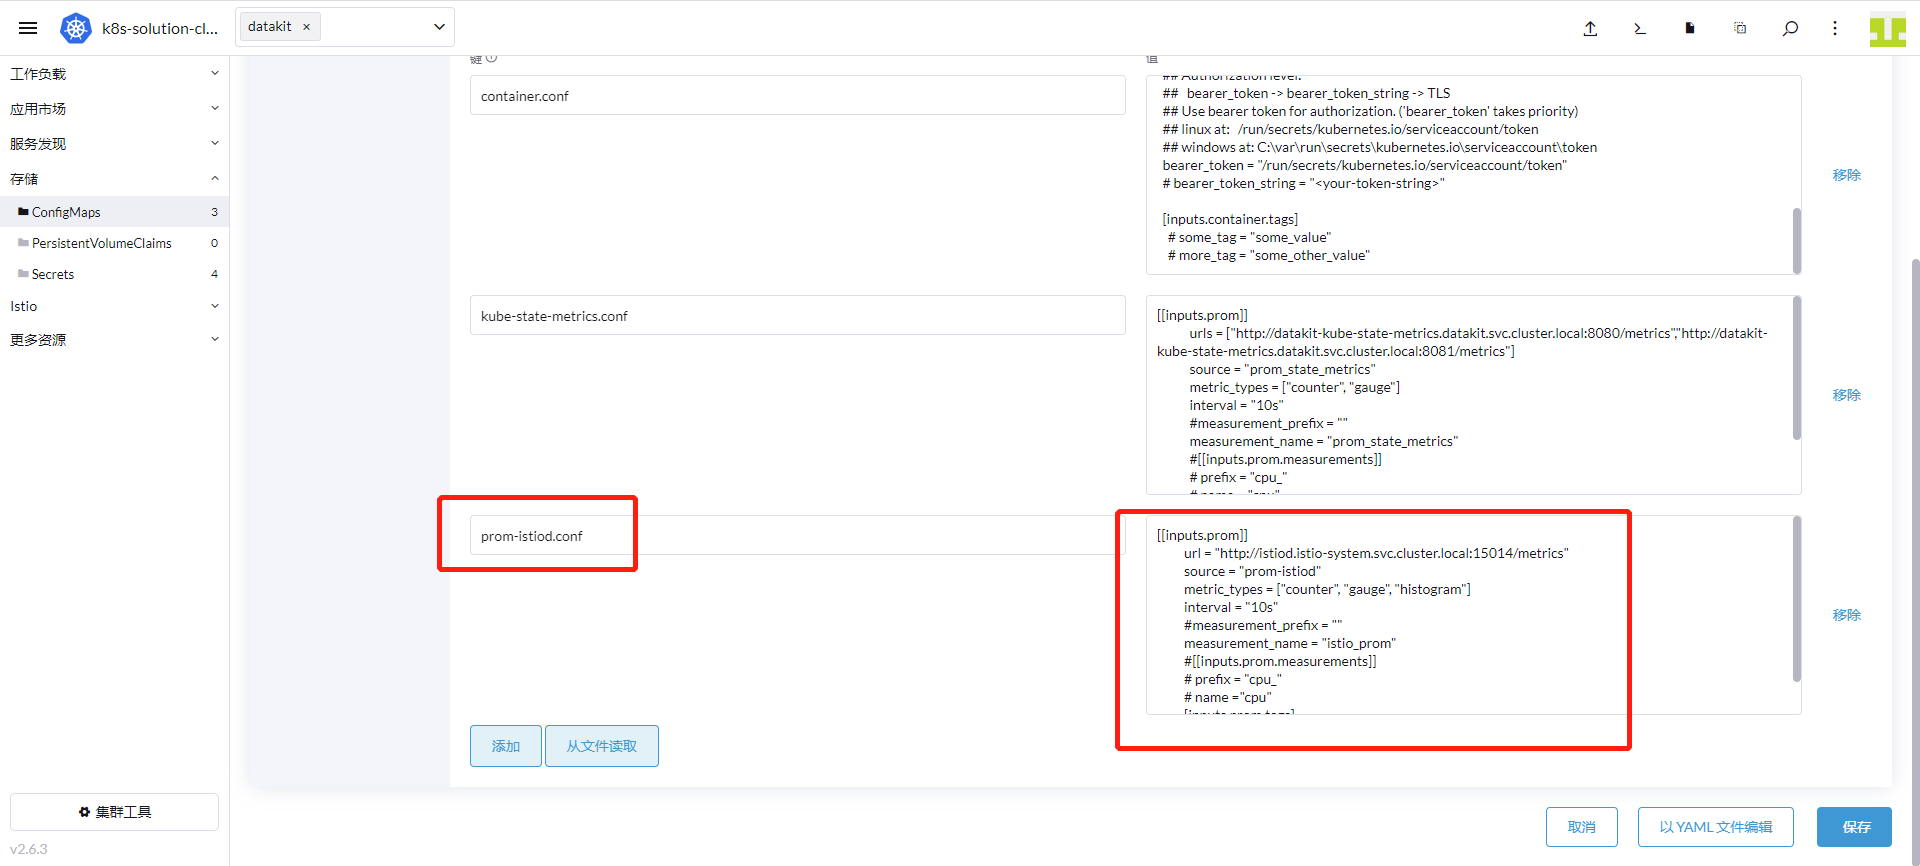
Click Add, enter prom-istiod.conf as the key, and the following content as the value. Click Save.
        [[inputs.prom]]
          url = "http://istiod.istio-system.svc.cluster.local:15014/metrics"
          source = "prom-istiod"
          metric_types = ["counter", "gauge"]
          interval = "60s"
          tags_ignore = ["cache","cluster_type","component","destination_app","destination_canonical_revision","destination_canonical_service","destination_cluster","destination_principal","group","grpc_code","grpc_method","grpc_service","grpc_type","reason","request_protocol","request_type","resource","responce_code_class","response_flags","source_app","source_canonical_revision","source_canonical-service","source_cluster","source_principal","source_version","wasm_filter"]
          #measurement_prefix = ""
          metric_name_filter = ["istio_requests_total","pilot_k8s_cfg_events","istio_build","process_virtual_memory_bytes","process_resident_memory_bytes","process_cpu_seconds_total","envoy_cluster_assignment_stale","go_goroutines","pilot_xds_pushes","pilot_proxy_convergence_time_bucket","citadel_server_root_cert_expiry_timestamp","pilot_conflict_inbound_listener","pilot_conflict_outbound_listener_http_over_current_tcp","pilot_conflict_outbound_listener_tcp_over_current_tcp","pilot_conflict_outbound_listener_tcp_over_current_http","pilot_virt_services","galley_validation_failed","pilot_services","envoy_cluster_upstream_cx_total","envoy_cluster_upstream_cx_connect_fail","envoy_cluster_upstream_cx_active","envoy_cluster_upstream_cx_rx_bytes_total","envoy_cluster_upstream_cx_tx_bytes_total","istio_request_duration_milliseconds_bucket","istio_request_duration_seconds_bucket","istio_request_bytes_bucket","istio_response_bytes_bucket"]
          measurement_name = "istio_prom"
          #[[inputs.prom.measurements]]
          # prefix = "cpu_"
          # name ="cpu"
          [inputs.prom.tags]
            app_id="istiod"
Go to Cluster → Workloads → DaemonSets, click the action menu on the right of the datakit row, and select Edit Config.
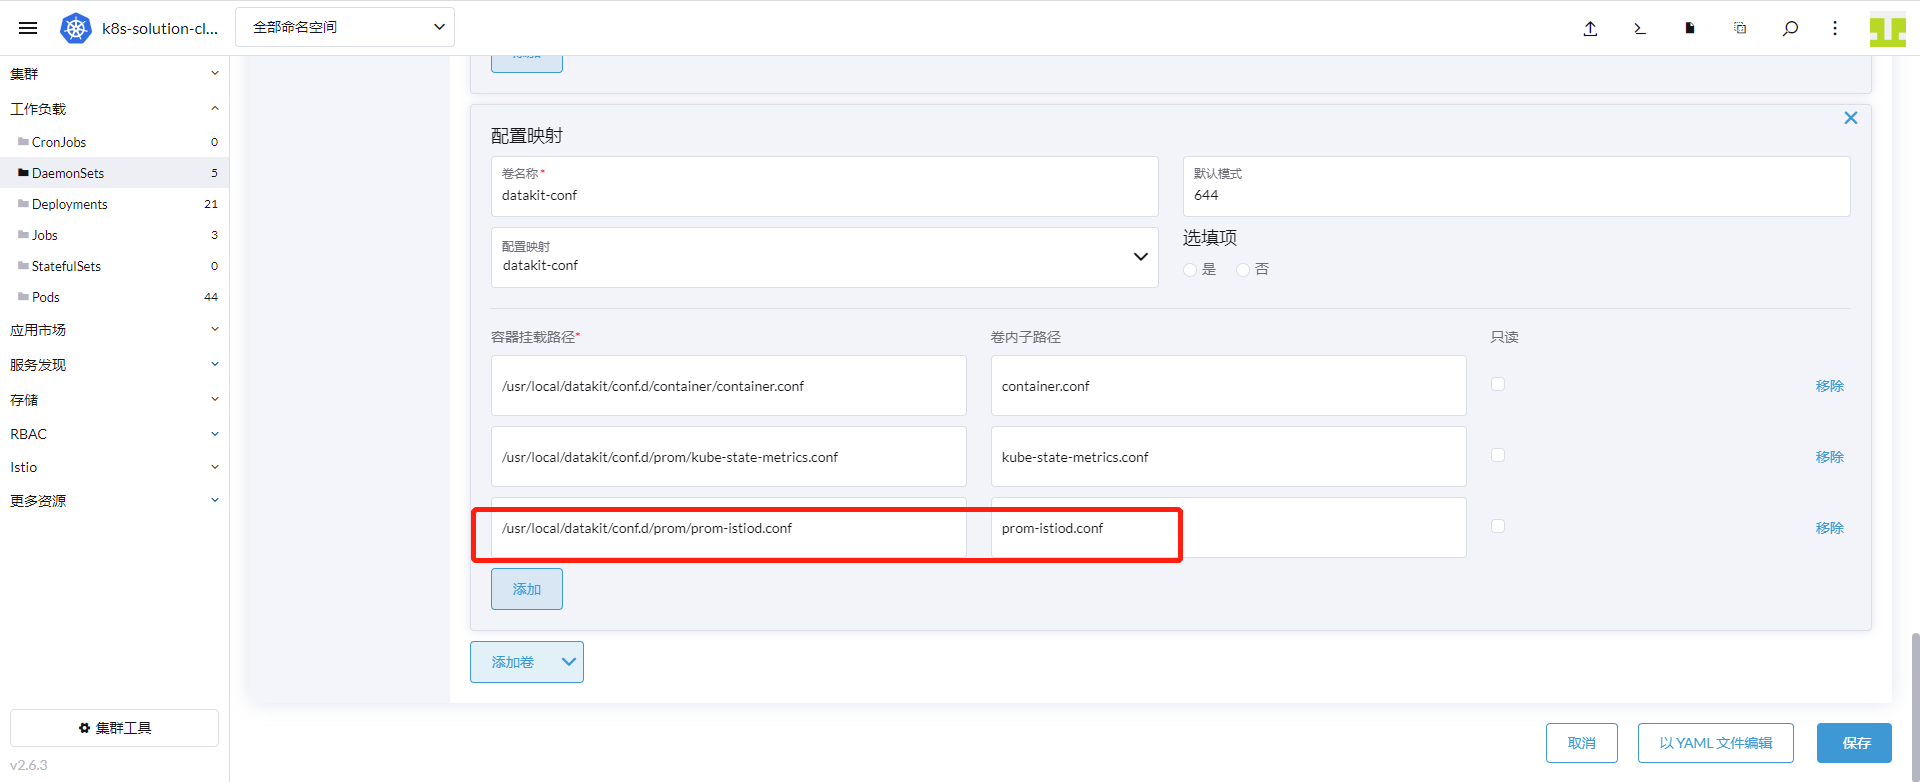
Click Storage, find the ConfigMap volume named datakit-conf, and click Add. Enter the following and click Save:
- Mount path:
/usr/local/datakit/conf.d/prom/prom-istiod.conf - Sub-path within the volume:
prom-istiod.conf
3.4 Enable the Ingressgateway and Egressgateway Collectors
To collect metrics from ingressgateway and egressgateway, use a Service to access port 15020. Therefore, create Services for ingressgateway and egressgateway.
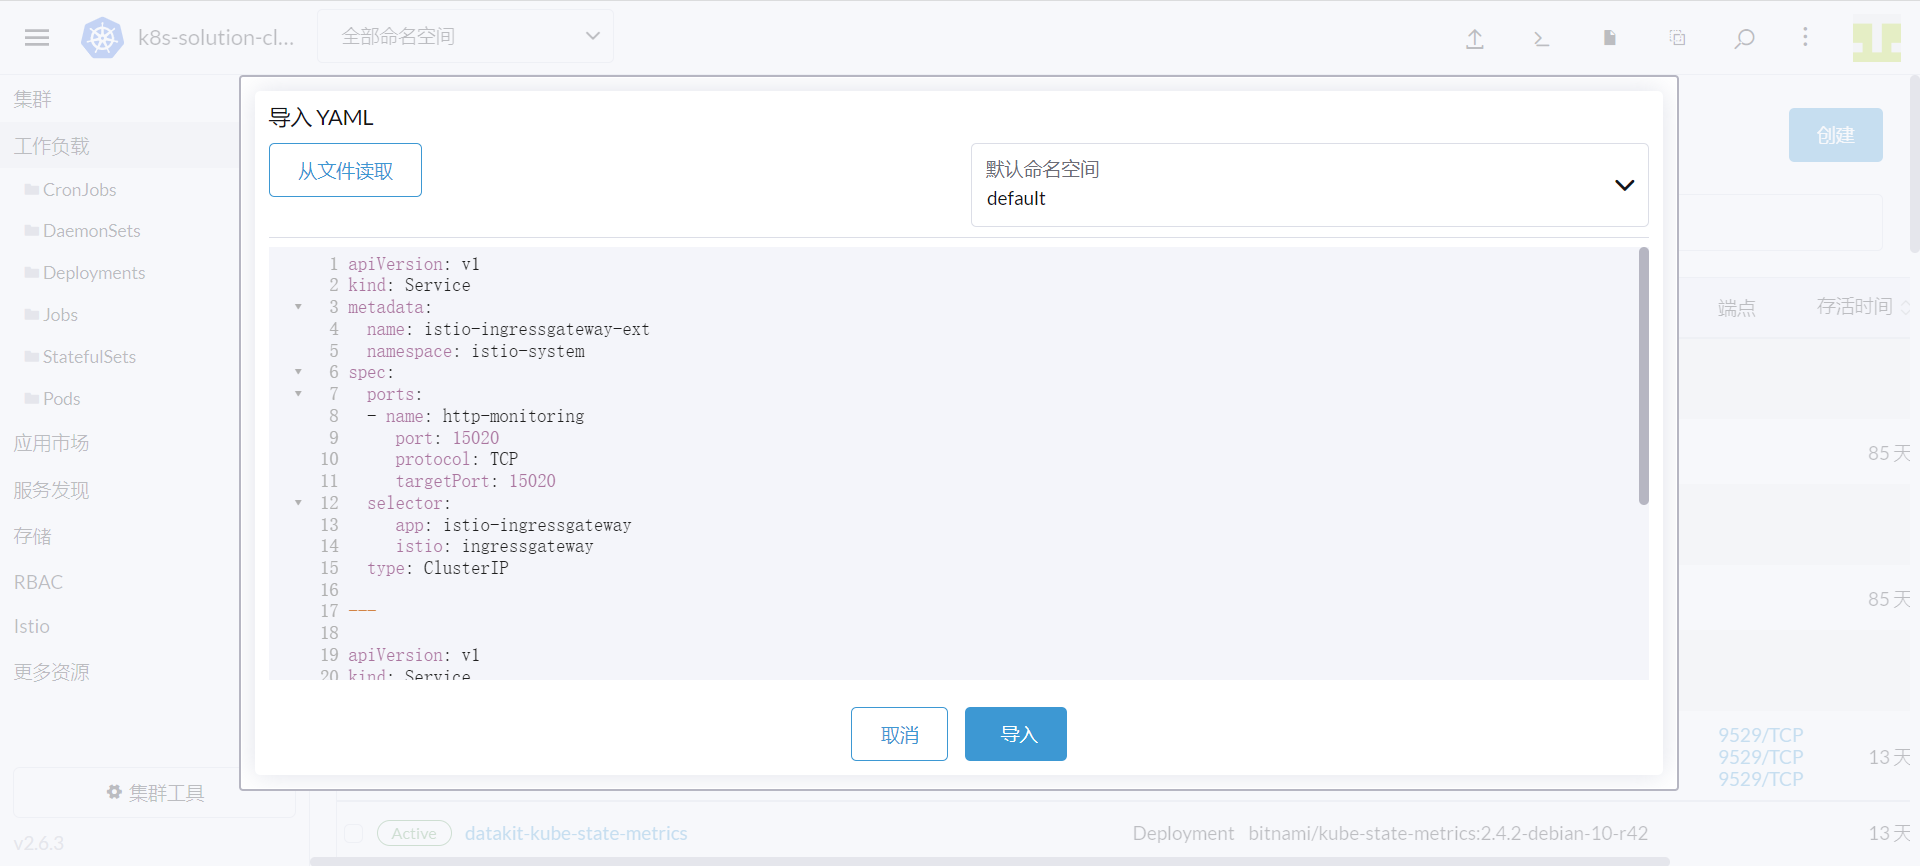
Log in to Rancher → Cluster, click the Import YAML icon at the top, enter the following content, and click Import to create the Services.
apiVersion: v1
kind: Service
metadata:
  name: istio-ingressgateway-ext
  namespace: istio-system
spec:
  ports:
    - name: http-monitoring
      port: 15020
      protocol: TCP
      targetPort: 15020
  selector:
    app: istio-ingressgateway
    istio: ingressgateway
  type: ClusterIP

---
apiVersion: v1
kind: Service
metadata:
  name: istio-egressgateway-ext
  namespace: istio-system
spec:
  ports:
    - name: http-monitoring
      port: 15020
      protocol: TCP
      targetPort: 15020
  selector:
    app: istio-egressgateway
    istio: egressgateway
  type: ClusterIP
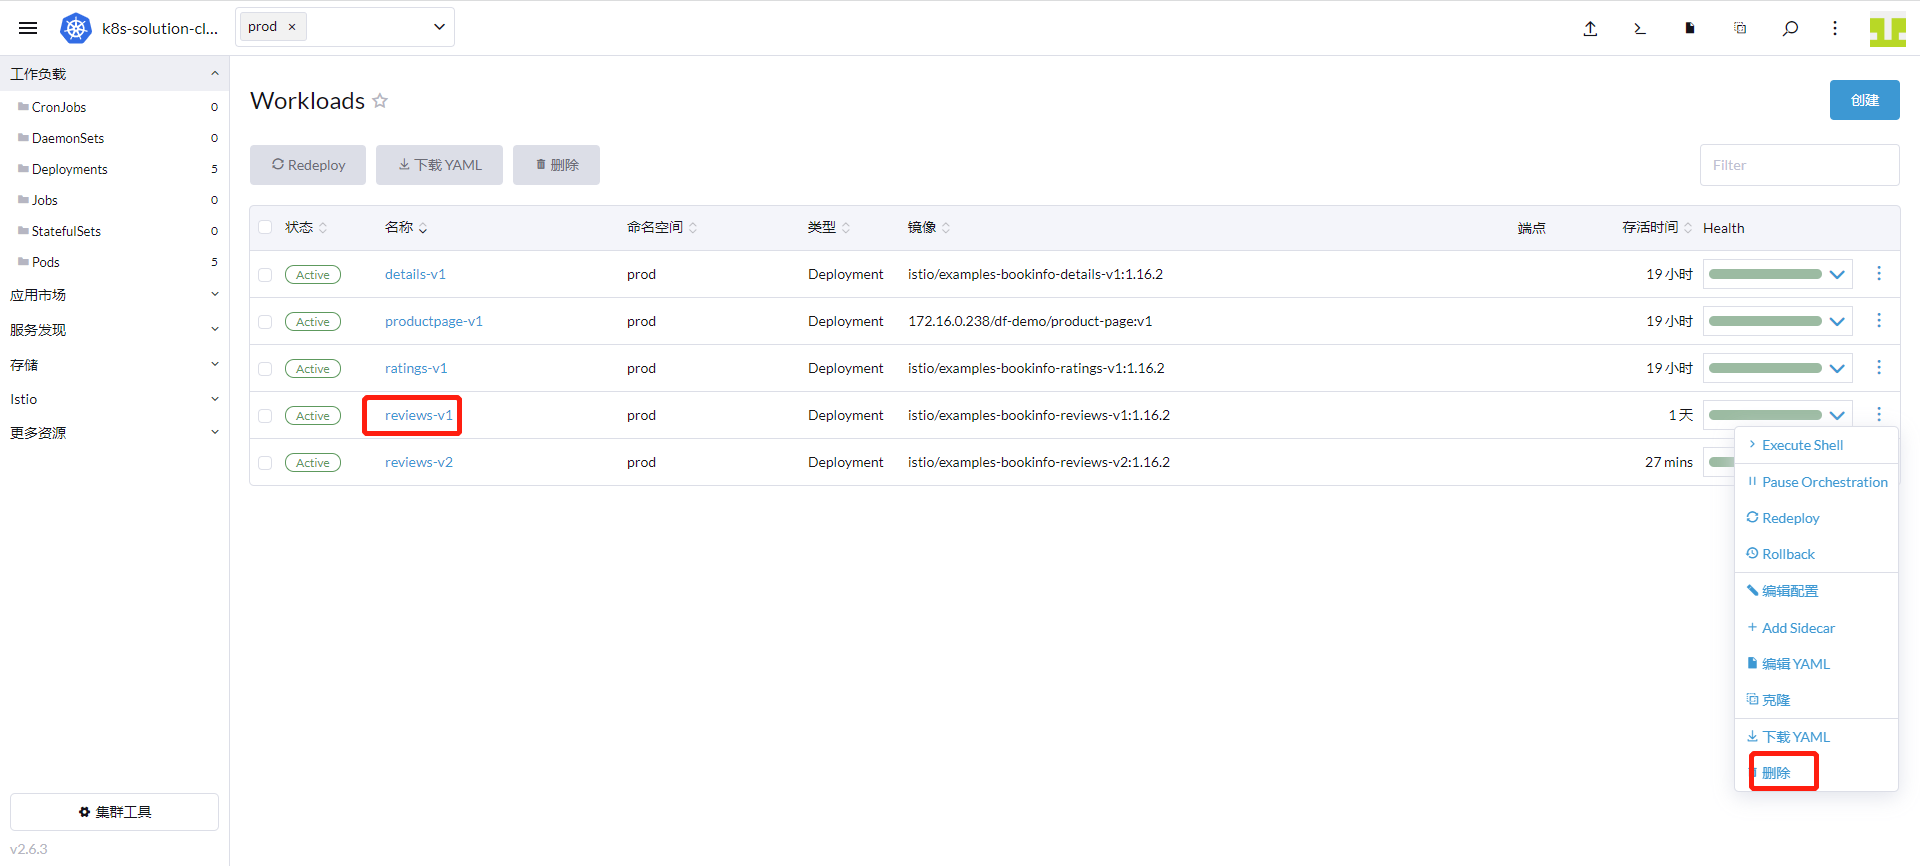
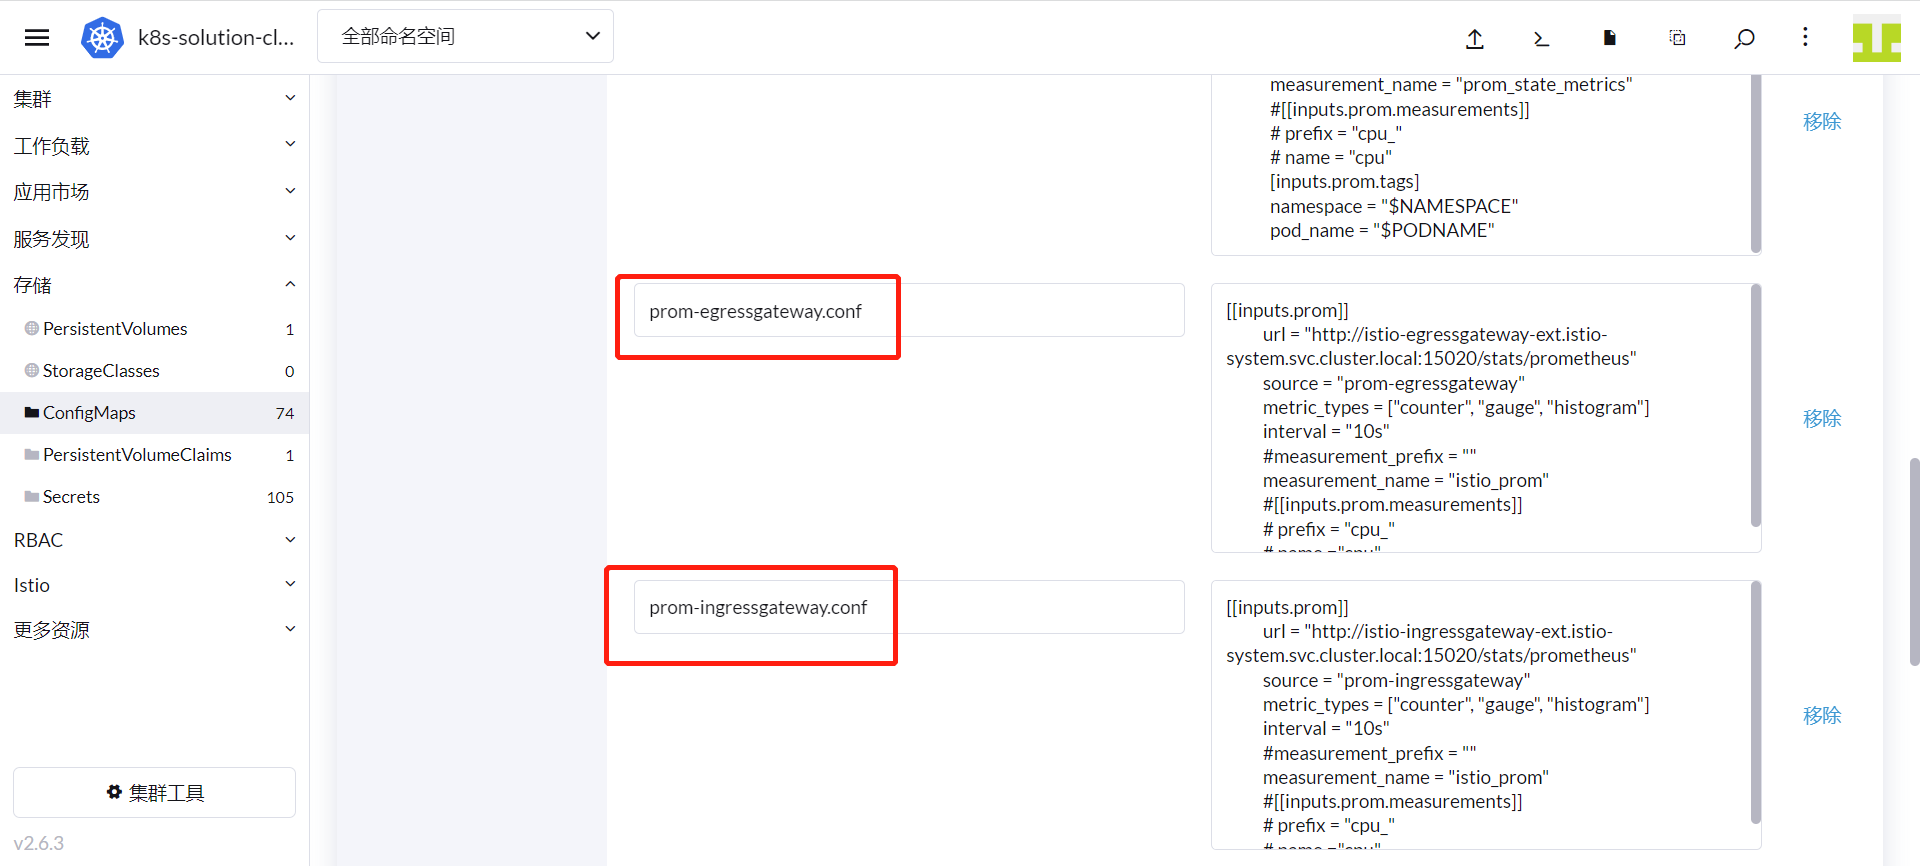
Log in to Rancher → Cluster → Storage → ConfigMaps, find datakit-conf, and click Edit Config.
Click Add, enter prom-ingressgateway.conf and prom-egressgateway.conf as the keys, and refer to the following content for the values. Click Save.
#### ingressgateway
prom-ingressgateway.conf: |-
  [[inputs.prom]]
    url = "http://istio-ingressgateway-ext.istio-system.svc.cluster.local:15020/stats/prometheus"
    source = "prom-ingressgateway"
    metric_types = ["counter", "gauge"]
    interval = "60s"
    tags_ignore = ["cache","cluster_type","component","destination_app","destination_canonical_revision","destination_canonical_service","destination_cluster","destination_principal","group","grpc_code","grpc_method","grpc_service","grpc_type","reason","request_protocol","request_type","resource","responce_code_class","response_flags","source_app","source_canonical_revision","source_canonical-service","source_cluster","source_principal","source_version","wasm_filter"]
    metric_name_filter = ["istio_requests_total","pilot_k8s_cfg_events","istio_build","process_virtual_memory_bytes","process_resident_memory_bytes","process_cpu_seconds_total","envoy_cluster_assignment_stale","go_goroutines","pilot_xds_pushes","pilot_proxy_convergence_time_bucket","citadel_server_root_cert_expiry_timestamp","pilot_conflict_inbound_listener","pilot_conflict_outbound_listener_http_over_current_tcp","pilot_conflict_outbound_listener_tcp_over_current_tcp","pilot_conflict_outbound_listener_tcp_over_current_http","pilot_virt_services","galley_validation_failed","pilot_services","envoy_cluster_upstream_cx_total","envoy_cluster_upstream_cx_connect_fail","envoy_cluster_upstream_cx_active","envoy_cluster_upstream_cx_rx_bytes_total","envoy_cluster_upstream_cx_tx_bytes_total","istio_request_duration_milliseconds_bucket","istio_request_duration_seconds_bucket","istio_request_bytes_bucket","istio_response_bytes_bucket"]
    #measurement_prefix = ""
    measurement_name = "istio_prom"
    #[[inputs.prom.measurements]]
    # prefix = "cpu_"
    # name ="cpu"
#### egressgateway
prom-egressgateway.conf: |-
  [[inputs.prom]]
    url = "http://istio-egressgateway-ext.istio-system.svc.cluster.local:15020/stats/prometheus"
    source = "prom-egressgateway"
    metric_types = ["counter", "gauge"]
    interval = "60s"
    tags_ignore = ["cache","cluster_type","component","destination_app","destination_canonical_revision","destination_canonical_service","destination_cluster","destination_principal","group","grpc_code","grpc_method","grpc_service","grpc_type","reason","request_protocol","request_type","resource","responce_code_class","response_flags","source_app","source_canonical_revision","source_canonical-service","source_cluster","source_principal","source_version","wasm_filter"]
    metric_name_filter = ["istio_requests_total","pilot_k8s_cfg_events","istio_build","process_virtual_memory_bytes","process_resident_memory_bytes","process_cpu_seconds_total","envoy_cluster_assignment_stale","go_goroutines","pilot_xds_pushes","pilot_proxy_convergence_time_bucket","citadel_server_root_cert_expiry_timestamp","pilot_conflict_inbound_listener","pilot_conflict_outbound_listener_http_over_current_tcp","pilot_conflict_outbound_listener_tcp_over_current_tcp","pilot_conflict_outbound_listener_tcp_over_current_http","pilot_virt_services","galley_validation_failed","pilot_services","envoy_cluster_upstream_cx_total","envoy_cluster_upstream_cx_connect_fail","envoy_cluster_upstream_cx_active","envoy_cluster_upstream_cx_rx_bytes_total","envoy_cluster_upstream_cx_tx_bytes_total","istio_request_duration_milliseconds_bucket","istio_request_duration_seconds_bucket","istio_request_bytes_bucket","istio_response_bytes_bucket"]
    #measurement_prefix = ""
    measurement_name = "istio_prom"
    #[[inputs.prom.measurements]]
    # prefix = "cpu_"
    # name ="cpu"
Go to Cluster → Workloads → DaemonSets, click the action menu on the right of the datakit row, and select Edit Config.
Click Storage, find the ConfigMap volume named datakit-conf, and add two entries:
- First Add: Mount path
/usr/local/datakit/conf.d/prom/prom-ingressgateway.conf, sub-pathprom-ingressgateway.conf. Click Save. - Second Add: Mount path
/usr/local/datakit/conf.d/prom/prom-egressgateway.conf, sub-pathprom-egressgateway.conf. Click Save.

3.5 Enable the Zipkin Collector
Log in to Rancher → Cluster → Storage → ConfigMaps, find datakit-conf, and click Edit Config.
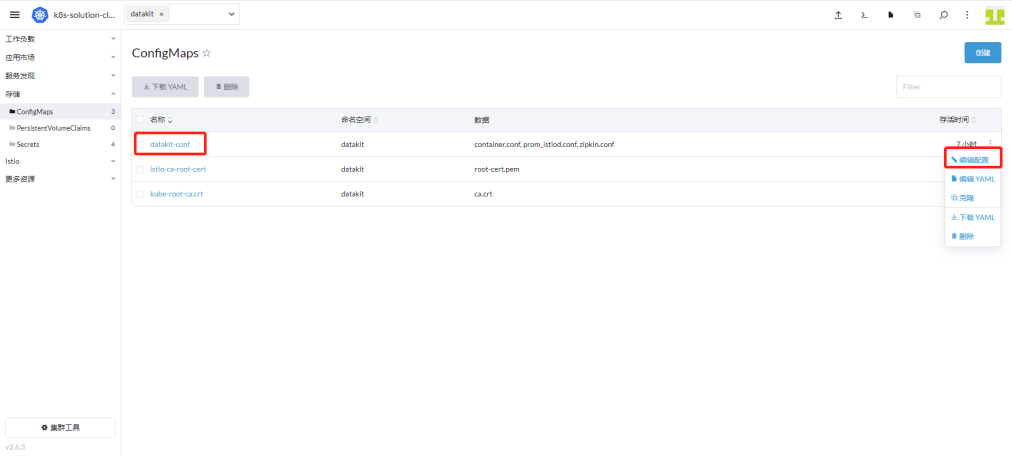
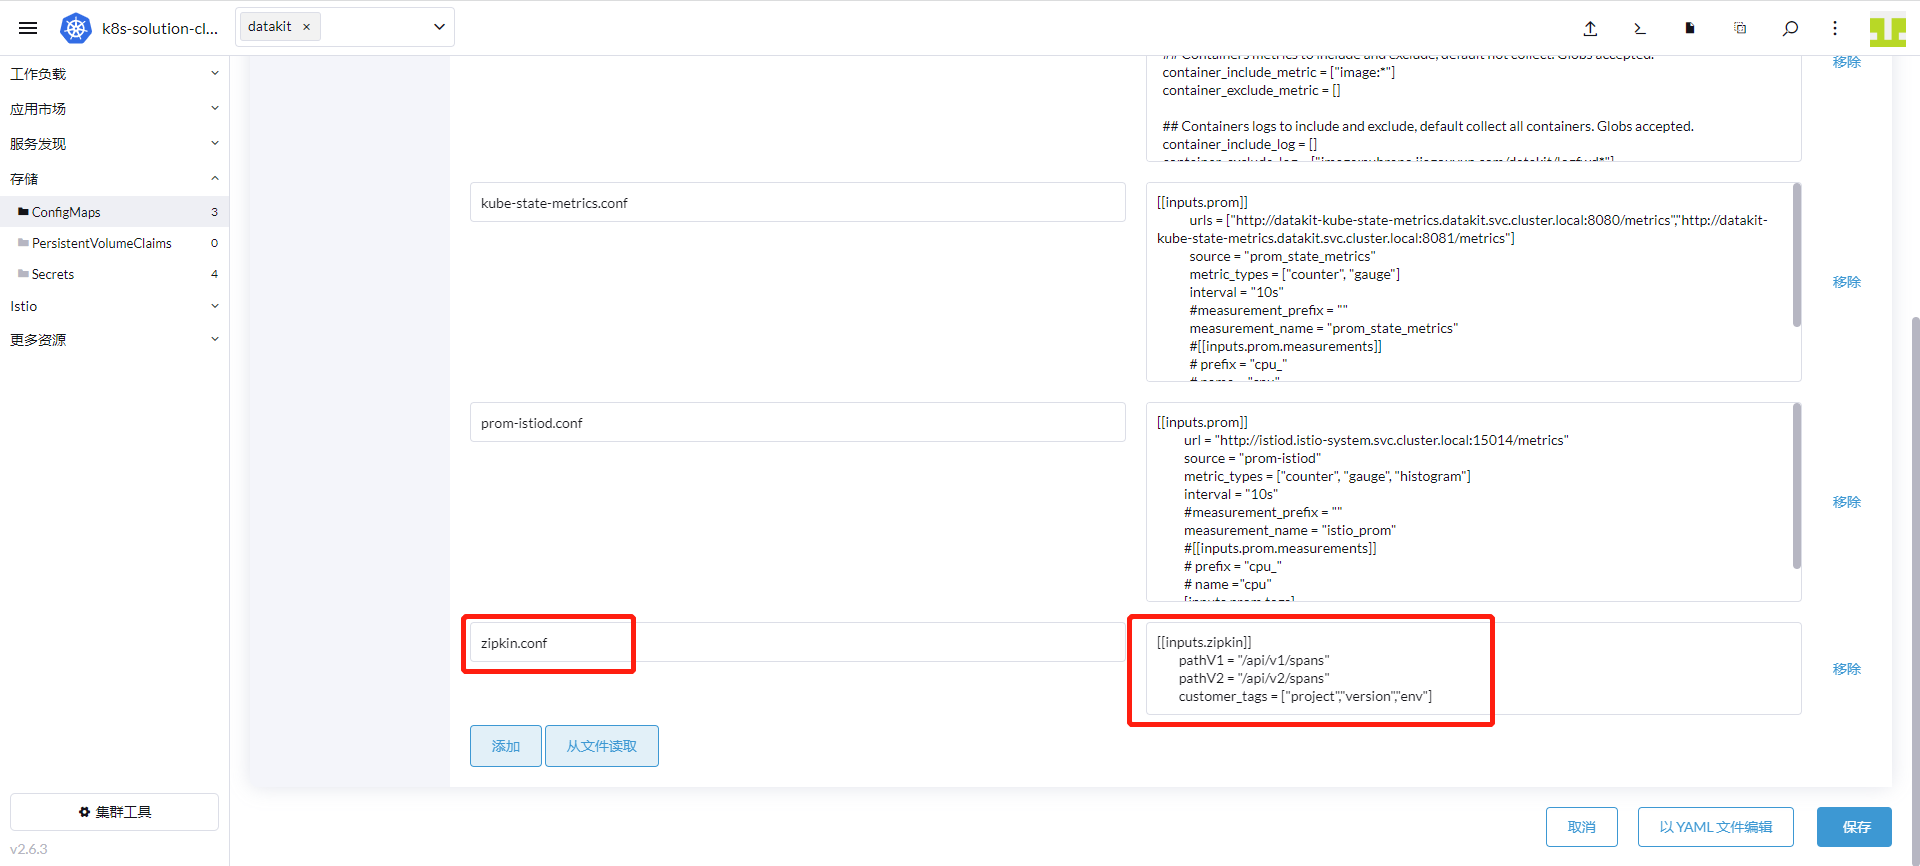
Click Add, enter zipkin.conf as the key, and the following content as the value. Click Save.
      [[inputs.zipkin]]
        pathV1 = "/api/v1/spans"
        pathV2 = "/api/v2/spans"
        customer_tags = ["project","version","env"]
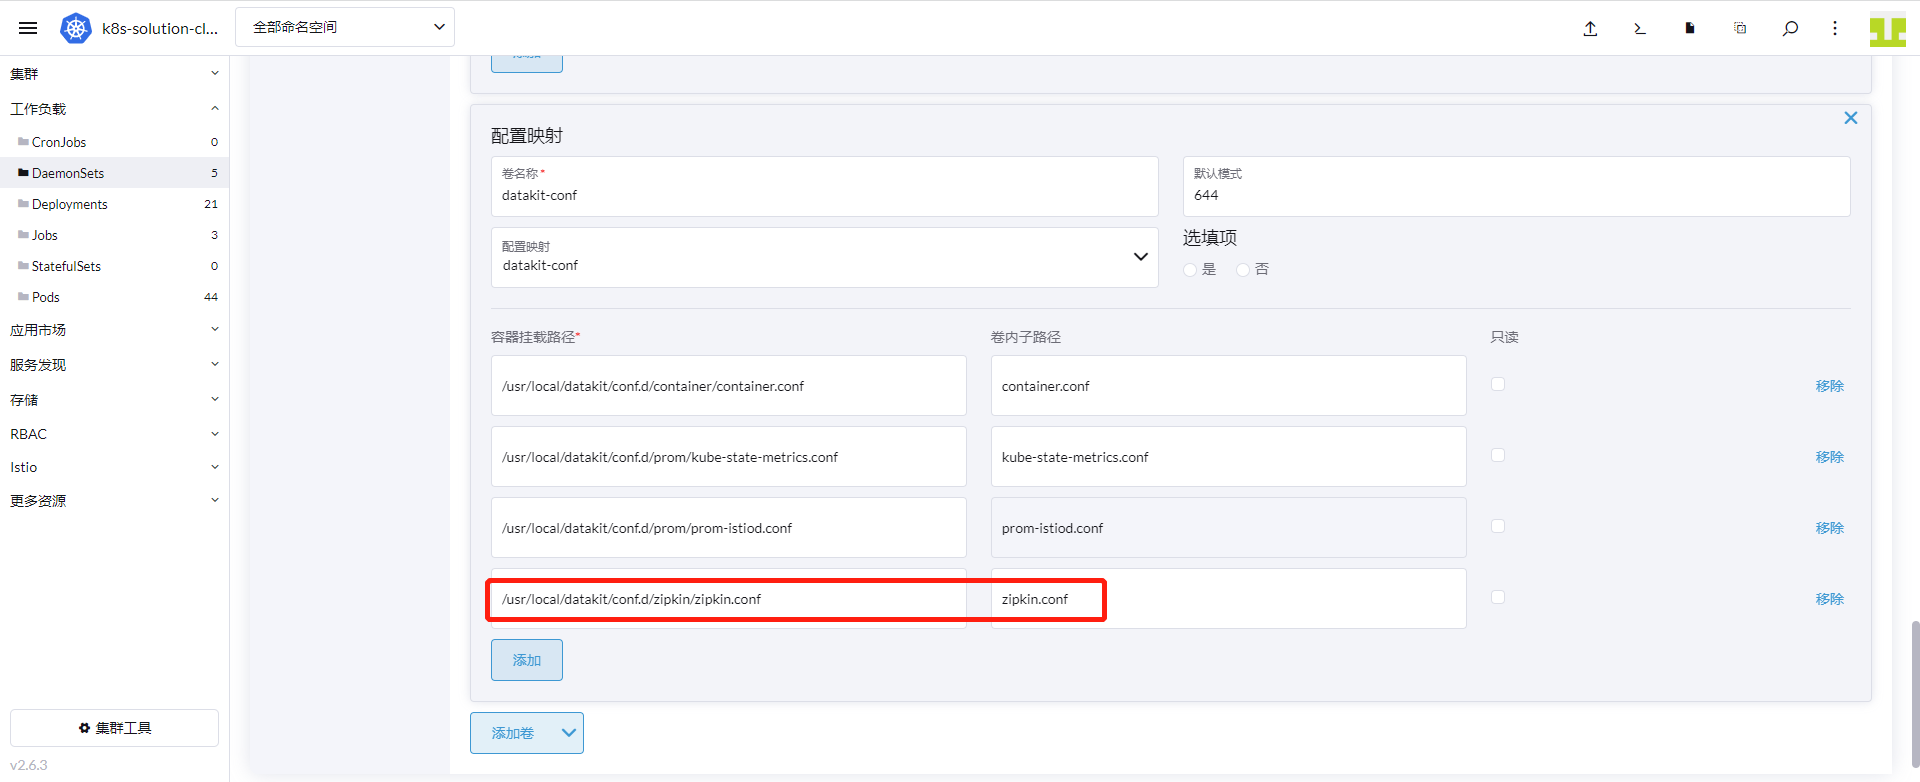
Go to Cluster → Workloads → DaemonSets, click the action menu on the right of the datakit row, and select Edit Config. Click Storage, find the ConfigMap volume named datakit-conf, click Add, enter the following, and click Save:
- Mount path:
/usr/local/datakit/conf.d/zipkin/zipkin.conf - Sub-path:
zipkin.conf
3.6 Map the DataKit Service
After deploying DataKit as a DaemonSet in the Kubernetes cluster, if an existing application previously pushed trace data to the zipkin service in the istio-system namespace on port 9411 (i.e., the address zipkin.istio-system.svc.cluster.local:9411), you need to use the Kubernetes ExternalName service type.
First, define a ClusterIP service that maps port 9529 to port 9411. Then, use an ExternalName service to map the ClusterIP service to a DNS name. Through these two steps, the application can communicate with DataKit.
- Define the ClusterIP Service
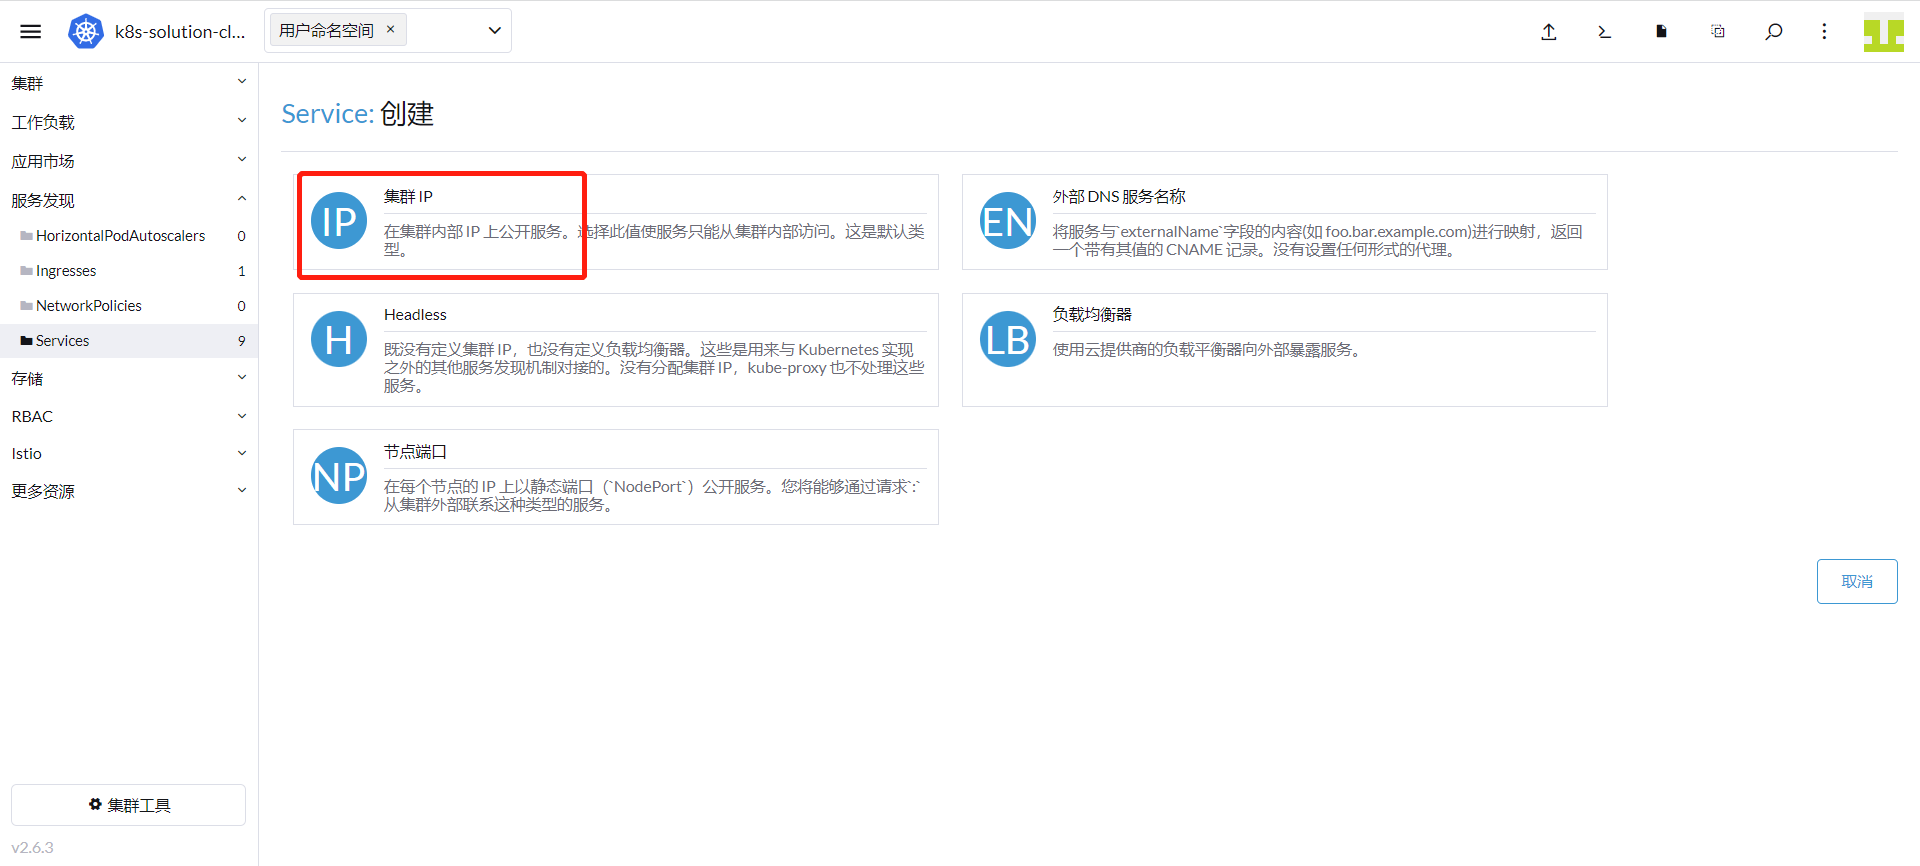
Log in to Rancher → Cluster → Service Discovery → Services, click Create → select Cluster IP.
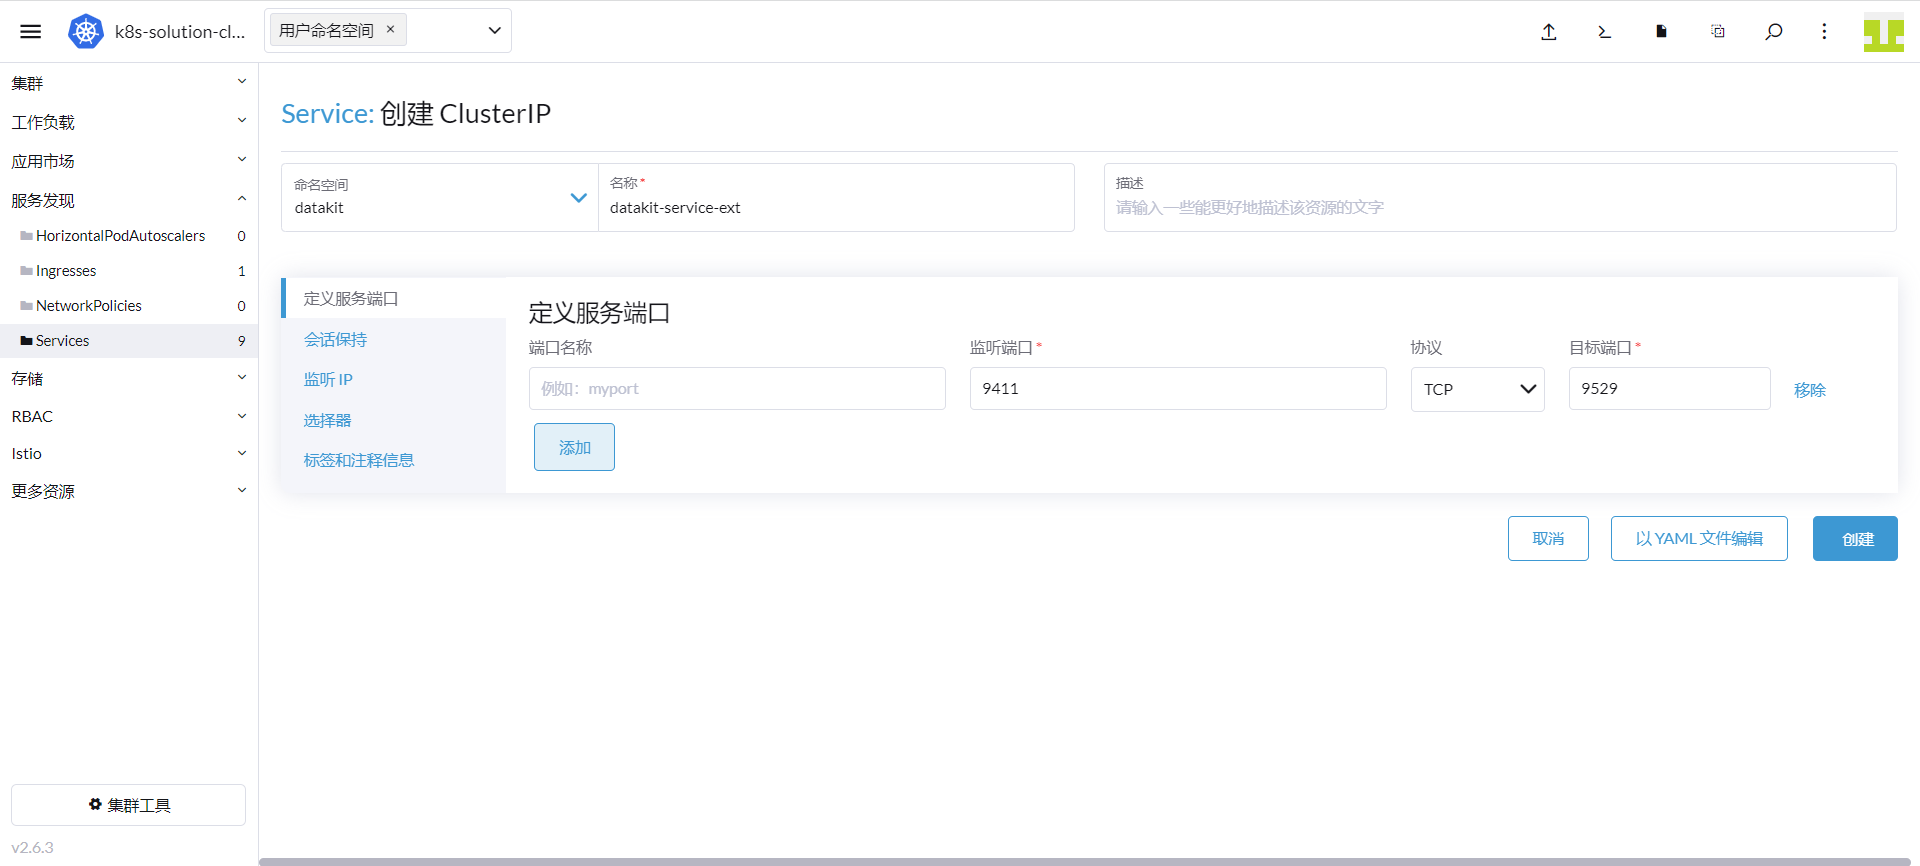
Enter datakit as the namespace, datakit-service-ext as the name, 9411 as the listening port, and 9529 as the target port.
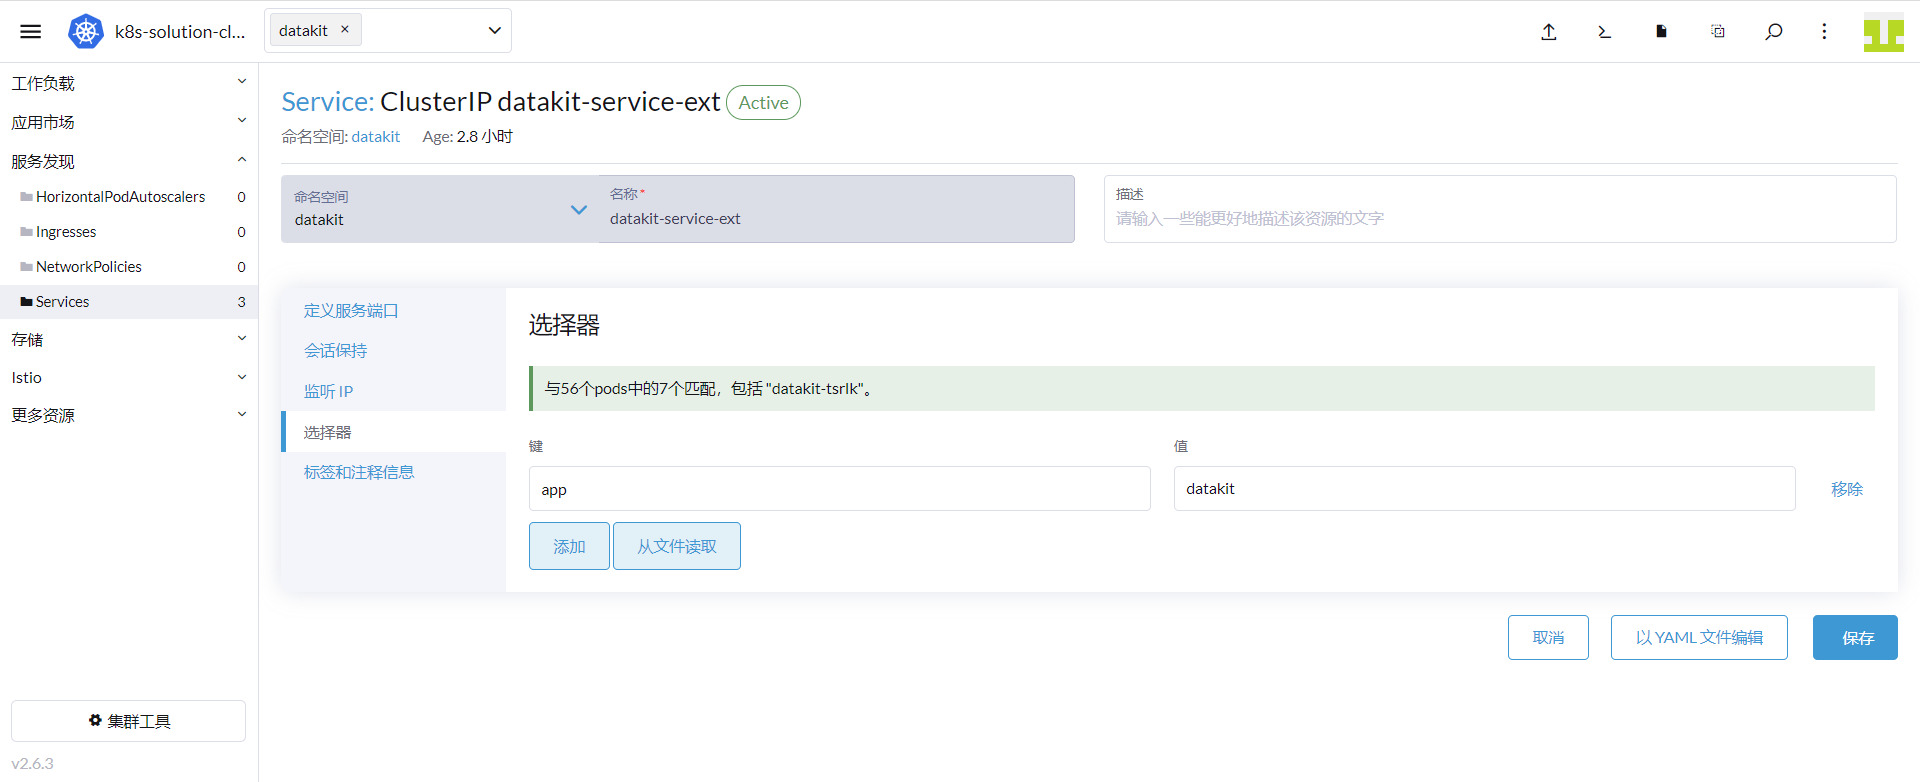
Click Selector, enter app as the key, datakit as the value, and click Save.
- Define the ExternalName Service
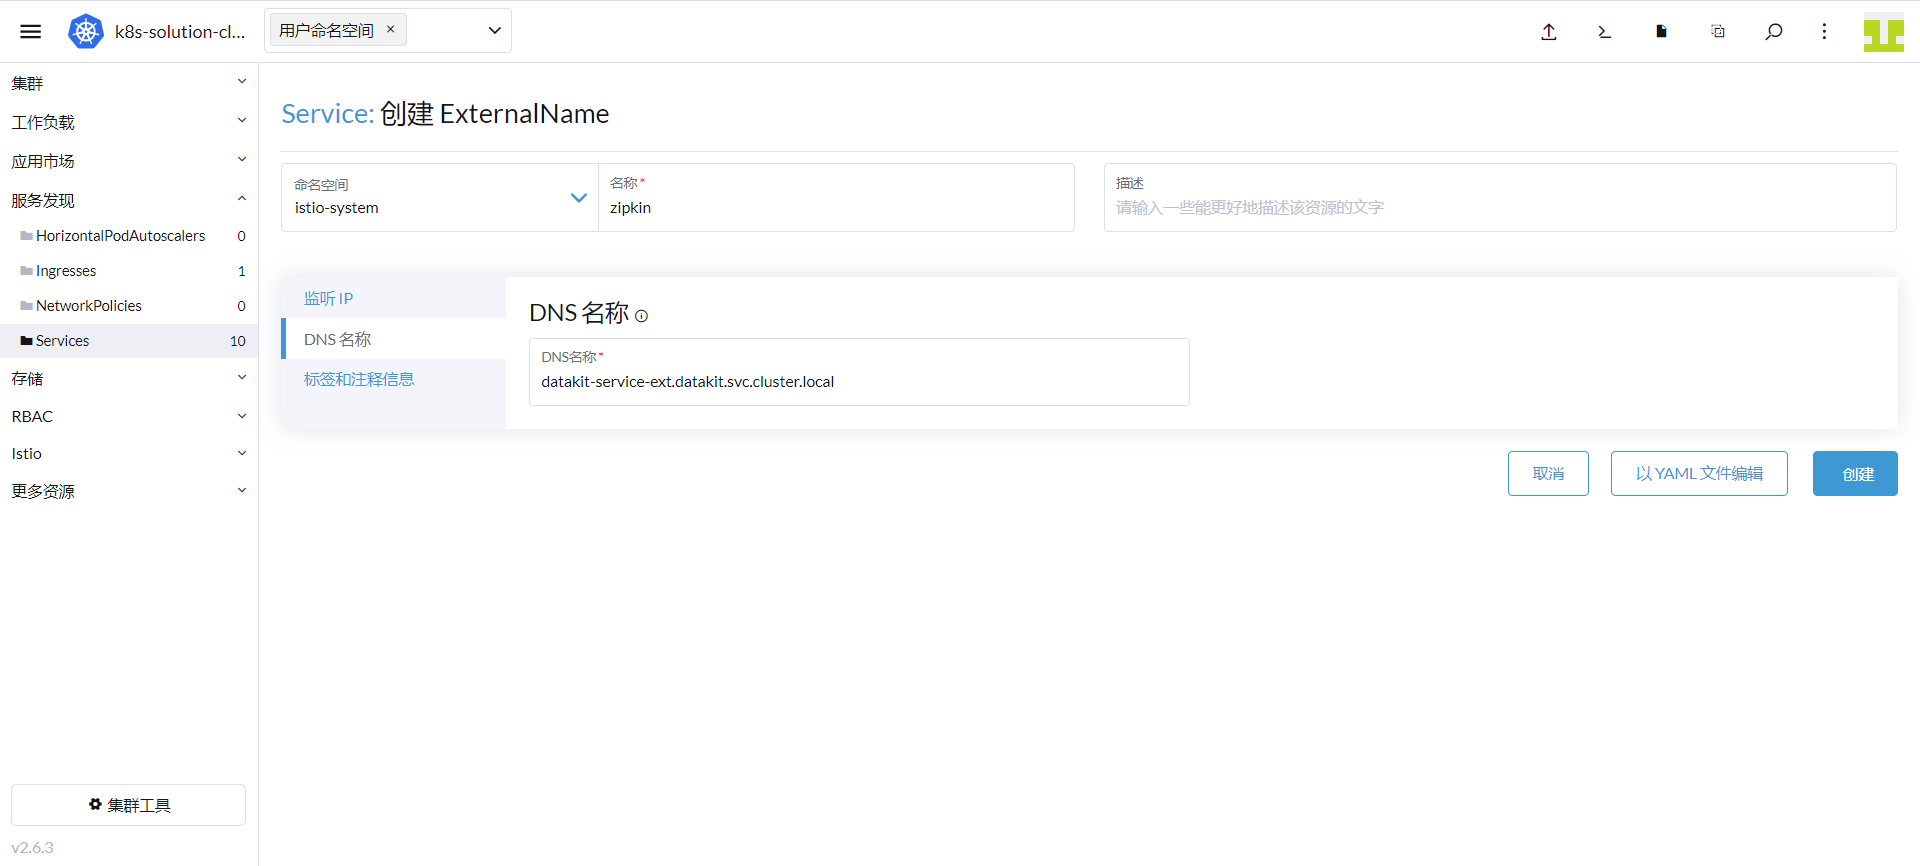
Go to Cluster → Service Discovery → Services, click Create → select External DNS Service Name.
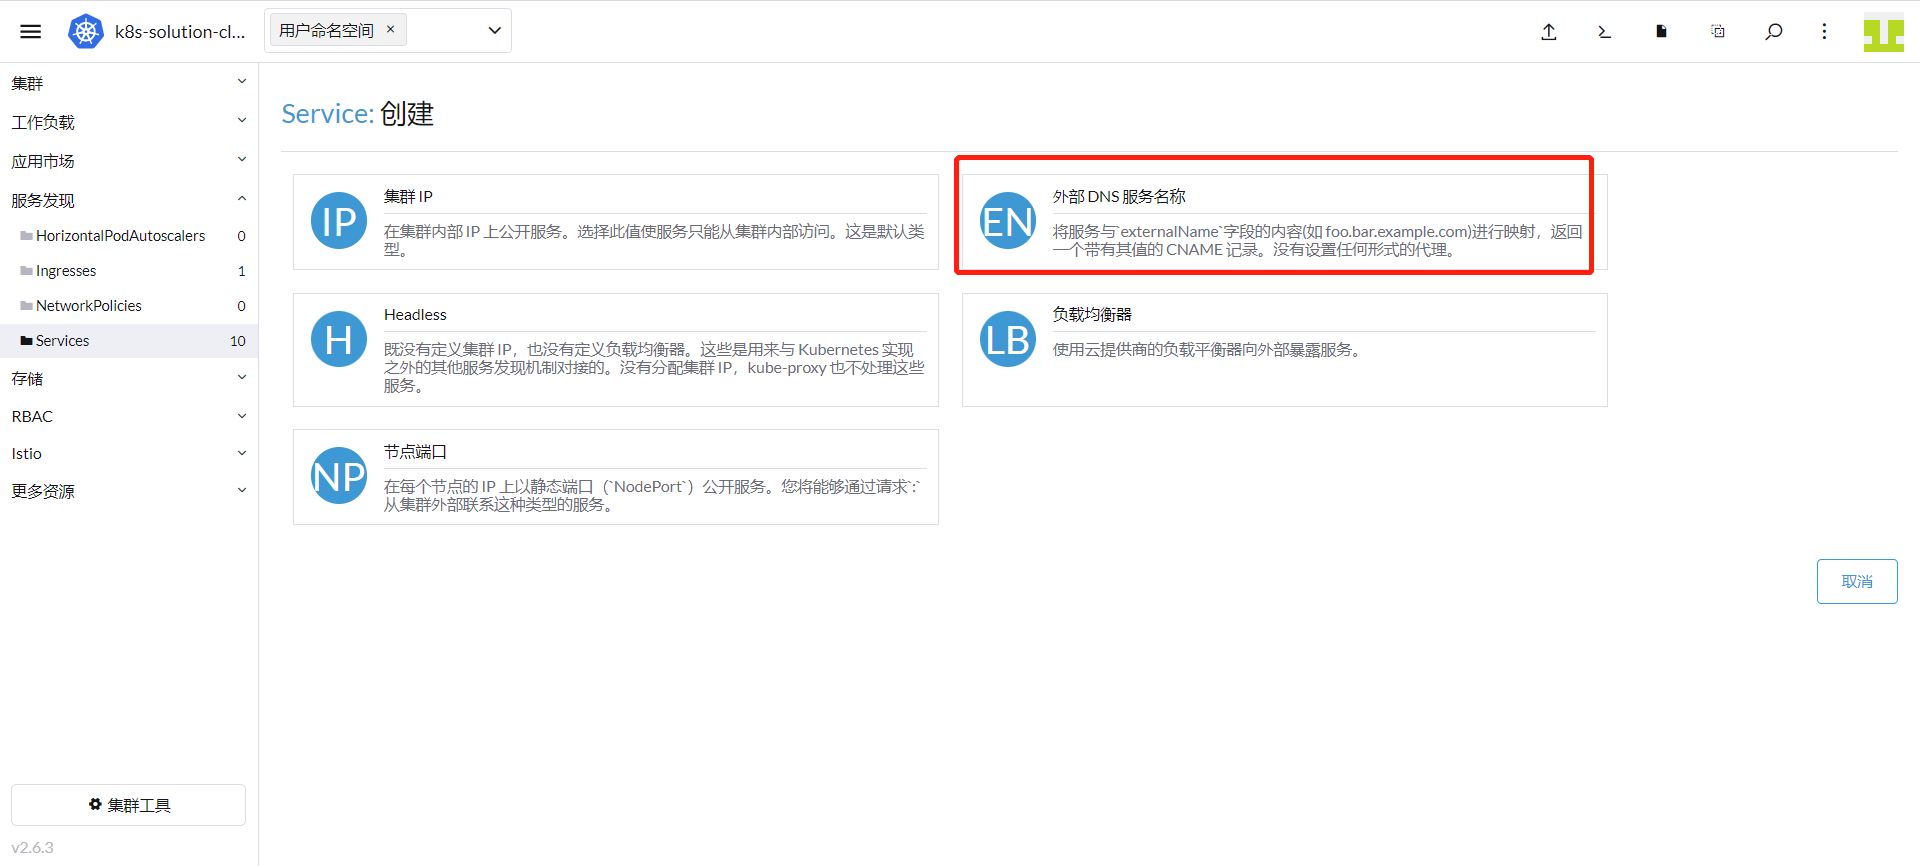
Enter istio-system as the namespace, zipkin as the name, datakit-service-ext.datakit.svc.cluster.local as the DNS name, and click Create.
3.7 Create a Gateway Resource
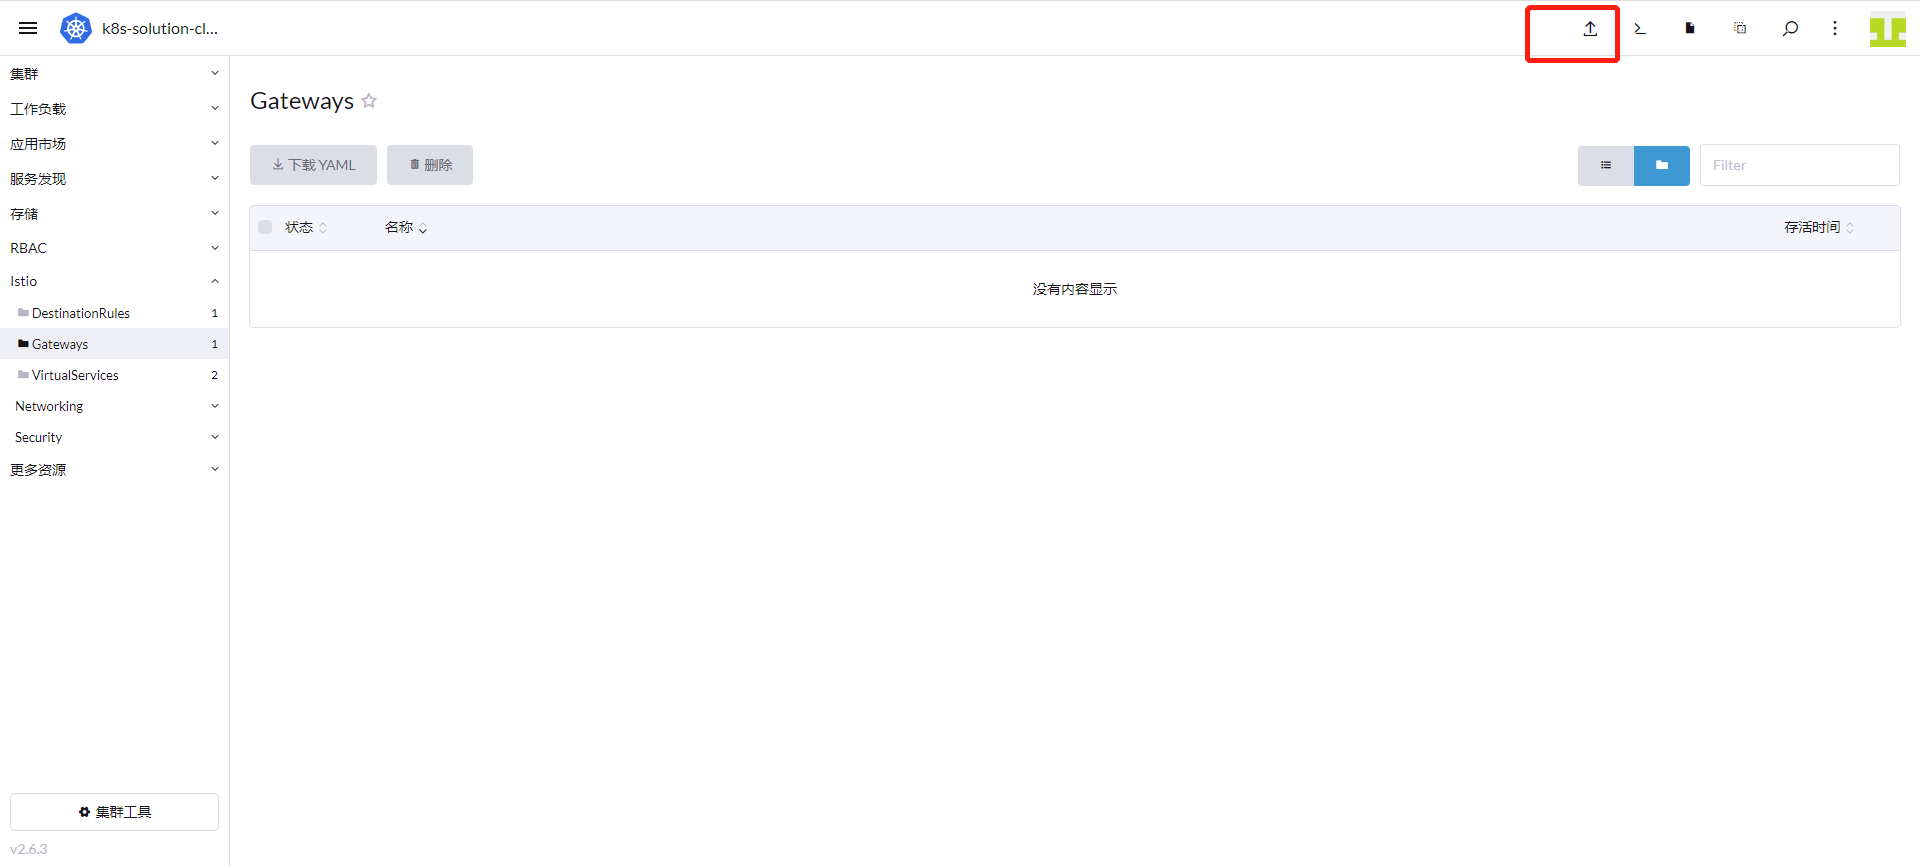
Log in to Rancher → Cluster → Istio → Gateways, click the Import YAML icon at the top.
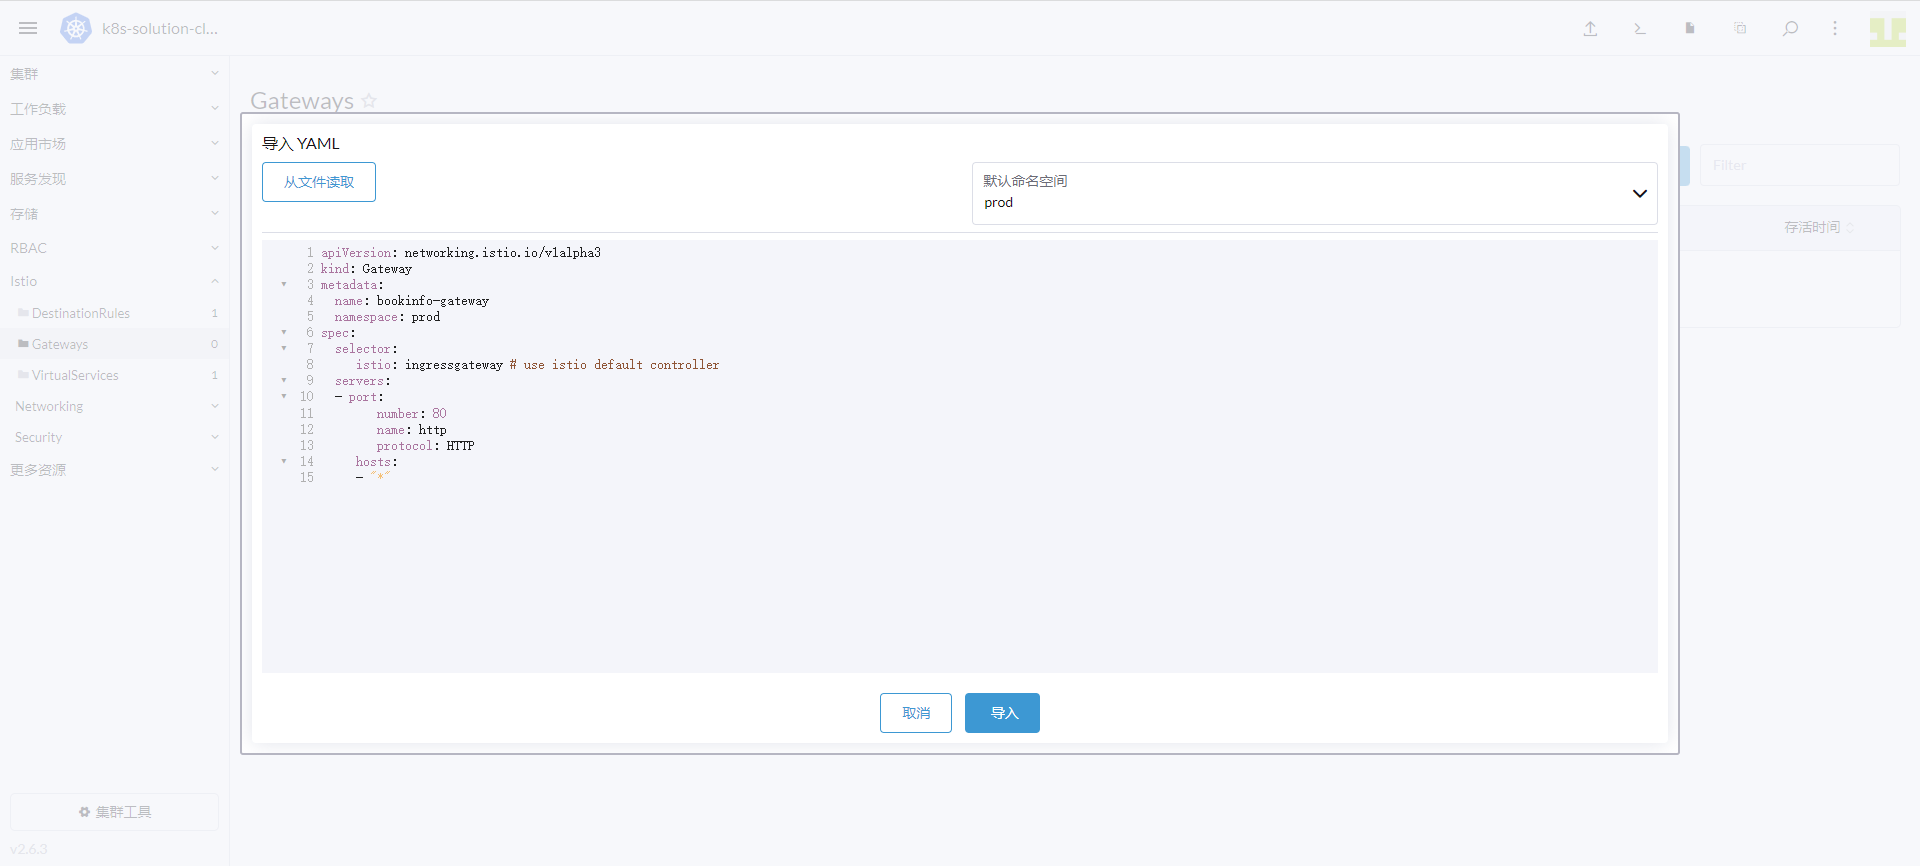
Enter prod as the namespace, enter the following content, and click Import.
apiVersion: networking.istio.io/v1alpha3
kind: Gateway
metadata:
  name: bookinfo-gateway
  namespace: prod
spec:
  selector:
    istio: ingressgateway # use istio default controller
  servers:
    - port:
        number: 80
        name: http
        protocol: HTTP
      hosts:
        - "*"
3.8 Create a Virtual Service
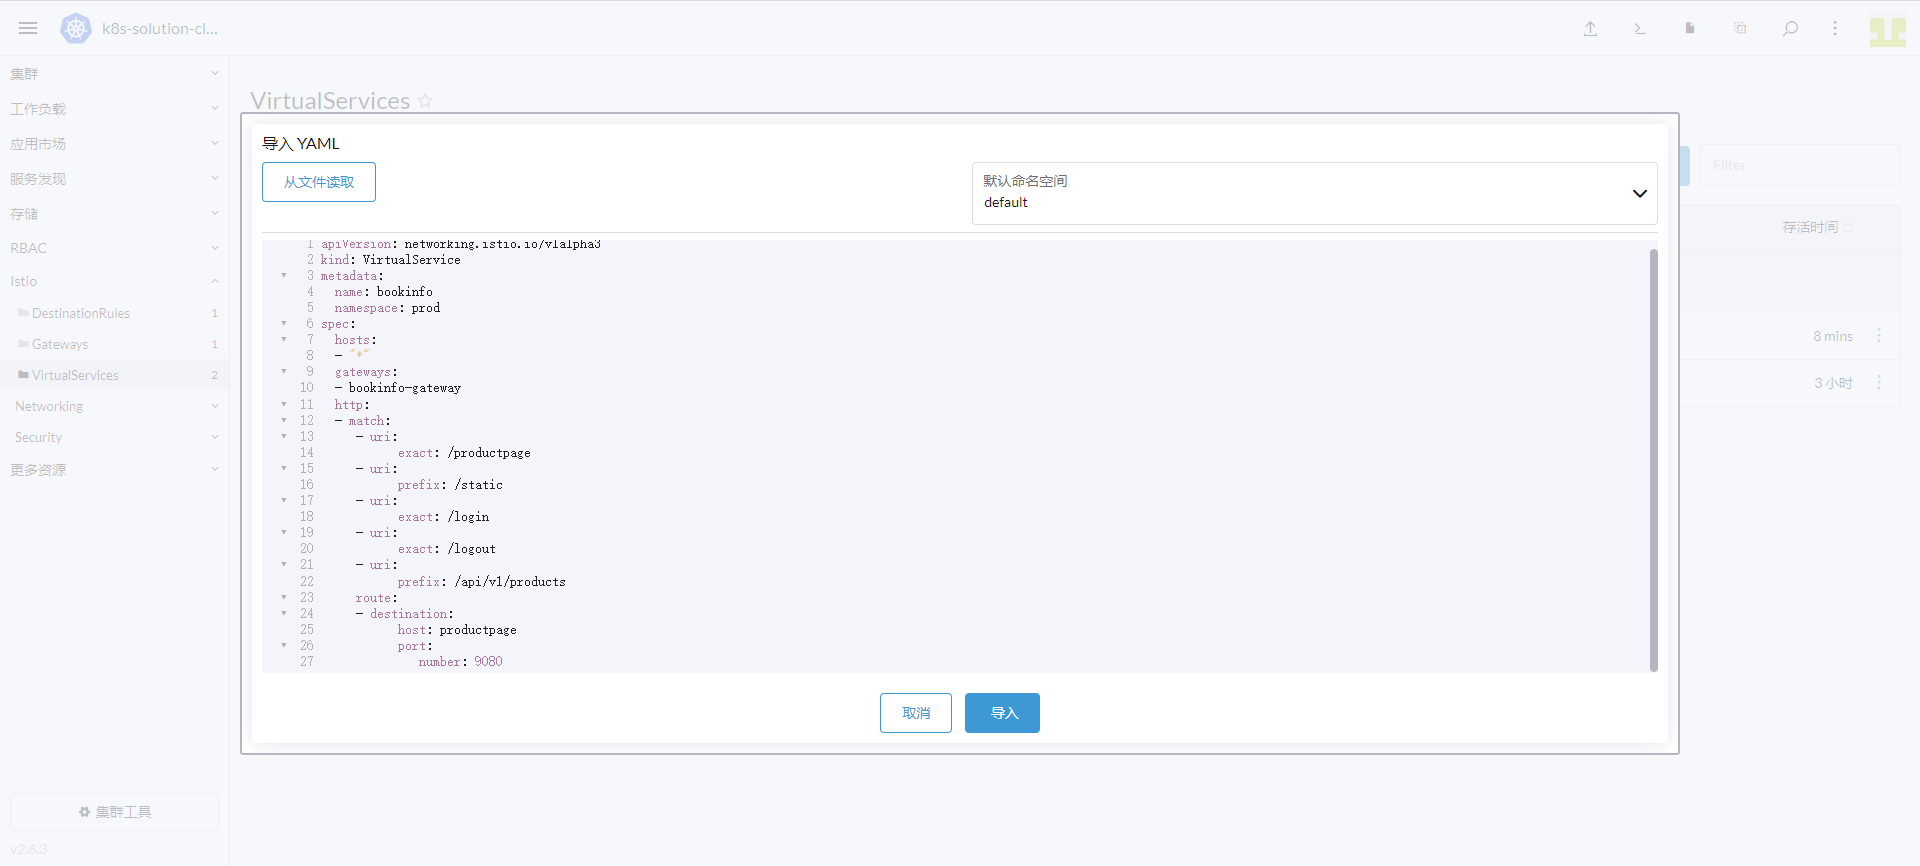
Log in to Rancher → Cluster → Istio → VirtualServices, click the Import YAML icon at the top.
Enter prod as the namespace, enter the following content, and click Import.
apiVersion: networking.istio.io/v1alpha3
kind: VirtualService
metadata:
  name: bookinfo
  namespace: prod
spec:
  hosts:
    - "*"
  gateways:
    - bookinfo-gateway
  http:
    - match:
        - uri:
            exact: /productpage
        - uri:
            prefix: /static
        - uri:
            exact: /login
        - uri:
            exact: /logout
        - uri:
            prefix: /api/v1/products
      route:
        - destination:
            host: productpage
            port:
              number: 9080
3.9 Create productpage, details, and ratings
Here we use Pod annotations to collect metrics from the Pods. The annotations are as follows:
annotations:
  datakit/prom.instances: |
    [[inputs.prom]]
      url = "http://$IP:15020/stats/prometheus"
      source = "bookinfo-istio-product"
      metric_types = ["counter", "gauge"]
      interval = "60s"
      tags_ignore = ["cache","cluster_type","component","destination_app","destination_canonical_revision","destination_canonical_service","destination_cluster","destination_principal","group","grpc_code","grpc_method","grpc_service","grpc_type","reason","request_protocol","request_type","resource","responce_code_class","response_flags","source_app","source_canonical_revision","source_canonical-service","source_cluster","source_principal","source_version","wasm_filter"]
      metric_name_filter = ["istio_requests_total","pilot_k8s_cfg_events","istio_build","process_virtual_memory_bytes","process_resident_memory_bytes","process_cpu_seconds_total","envoy_cluster_assignment_stale","go_goroutines","pilot_xds_pushes","pilot_proxy_convergence_time_bucket","citadel_server_root_cert_expiry_timestamp","pilot_conflict_inbound_listener","pilot_conflict_outbound_listener_http_over_current_tcp","pilot_conflict_outbound_listener_tcp_over_current_tcp","pilot_conflict_outbound_listener_tcp_over_current_http","pilot_virt_services","galley_validation_failed","pilot_services","envoy_cluster_upstream_cx_total","envoy_cluster_upstream_cx_connect_fail","envoy_cluster_upstream_cx_active","envoy_cluster_upstream_cx_rx_bytes_total","envoy_cluster_upstream_cx_tx_bytes_total","istio_request_duration_milliseconds_bucket","istio_request_duration_seconds_bucket","istio_request_bytes_bucket","istio_response_bytes_bucket"]
      #measurement_prefix = ""
      measurement_name = "istio_prom"
      #[[inputs.prom.measurements]]
      # prefix = "cpu_"
      # name = "cpu"
      [inputs.prom.tags]
      namespace = "$NAMESPACE"
  proxy.istio.io/config: |
    tracing:
      zipkin:
        address: zipkin.istio-system:9411
      custom_tags:
        project:
          literal:
            value: "productpage"
        version:
          literal:
            value: "v1"
        env:
          literal:
            value: "test"
Parameter description
url: Exporter addresssource: Collector namemetric_types: Metric type filtermeasurement_name: Measurement name after collectioninterval: Metric collection frequency, in seconds (s)$IP: Wildcard for the Pod's internal IP$NAMESPACE: Namespace of the Podtags_ignore: Tags to ignore.
Below are the complete deployment files for productpage, details, and ratings.
Complete Deployment Files
##################################################################################################
# Details service
##################################################################################################
apiVersion: v1
kind: Service
metadata:
  name: details
  namespace: prod
  labels:
    app: details
    service: details
spec:
  ports:
  - port: 9080
    name: http
  selector:
    app: details
---
apiVersion: v1
kind: ServiceAccount
metadata:
  name: bookinfo-details
  namespace: prod
  labels:
    account: details
---
apiVersion: apps/v1
kind: Deployment
metadata:
  name: details-v1
  namespace: prod
  labels:
    app: details
    version: v1
spec:
  replicas: 1
  selector:
    matchLabels:
      app: details
      version: v1
  template:
    metadata:
      labels:
        app: details
        version: v1
      annotations:
        datakit/prom.instances: |
          [[inputs.prom]]
            url = "http://$IP:15020/stats/prometheus"
            source = "bookinfo-istio-details"
            metric_types = ["counter", "gauge"]
            interval = "60s"
      tags_ignore = ["cache","cluster_type","component","destination_app","destination_canonical_revision","destination_canonical_service","destination_cluster","destination_principal","group","grpc_code","grpc_method","grpc_service","grpc_type","reason","request_protocol","request_type","resource","responce_code_class","response_flags","source_app","source_canonical_revision","source_canonical-service","source_cluster","source_principal","source_version","wasm_filter"]
            metric_name_filter = ["istio_requests_total","pilot_k8s_cfg_events","istio_build","process_virtual_memory_bytes","process_resident_memory_bytes","process_cpu_seconds_total","envoy_cluster_assignment_stale","go_goroutines","pilot_xds_pushes","pilot_proxy_convergence_time_bucket","citadel_server_root_cert_expiry_timestamp","pilot_conflict_inbound_listener","pilot_conflict_outbound_listener_http_over_current_tcp","pilot_conflict_outbound_listener_tcp_over_current_tcp","pilot_conflict_outbound_listener_tcp_over_current_http","pilot_virt_services","galley_validation_failed","pilot_services","envoy_cluster_upstream_cx_total","envoy_cluster_upstream_cx_connect_fail","envoy_cluster_upstream_cx_active","envoy_cluster_upstream_cx_rx_bytes_total","envoy_cluster_upstream_cx_tx_bytes_total","istio_request_duration_milliseconds_bucket","istio_request_duration_seconds_bucket","istio_request_bytes_bucket","istio_response_bytes_bucket"]
            #measurement_prefix = ""
            measurement_name = "istio_prom"
            #[[inputs.prom.measurements]]
            # prefix = "cpu_"
            # name = "cpu"
            [inputs.prom.tags]
            namespace = "$NAMESPACE"
        proxy.istio.io/config: |
          tracing:
            zipkin:
              address: zipkin.istio-system:9411
            custom_tags:
              project:
                literal:
                  value: "details"
              version:
                literal:
                  value: "v1"
              env:
                literal:
                  value: "test"
    spec:
      serviceAccountName: bookinfo-details
      containers:
      - name: details
        image: docker.io/istio/examples-bookinfo-details-v1:1.16.2
        imagePullPolicy: IfNotPresent
        ports:
        - containerPort: 9080
        securityContext:
          runAsUser: 1000
---
##################################################################################################
# Ratings service
##################################################################################################
apiVersion: v1
kind: Service
metadata:
  name: ratings
  namespace: prod
  labels:
    app: ratings
    service: ratings
spec:
  ports:
  - port: 9080
    name: http
  selector:
    app: ratings
---
apiVersion: v1
kind: ServiceAccount
metadata:
  name: bookinfo-ratings
  namespace: prod
  labels:
    account: ratings
---
apiVersion: apps/v1
kind: Deployment
metadata:
  name: ratings-v1
  namespace: prod
  labels:
    app: ratings
    version: v1
spec:
  replicas: 1
  selector:
    matchLabels:
      app: ratings
      version: v1
  template:
    metadata:
      labels:
        app: ratings
        version: v1
      annotations:
        datakit/prom.instances: |
          [[inputs.prom]]
            url = "http://$IP:15020/stats/prometheus"
            source = "bookinfo-istio-ratings"
            metric_types = ["counter", "gauge"]
            interval = "60s"
      tags_ignore = ["cache","cluster_type","component","destination_app","destination_canonical_revision","destination_canonical_service","destination_cluster","destination_principal","group","grpc_code","grpc_method","grpc_service","grpc_type","reason","request_protocol","request_type","resource","responce_code_class","response_flags","source_app","source_canonical_revision","source_canonical-service","source_cluster","source_principal","source_version","wasm_filter"]
            metric_name_filter = ["istio_requests_total","pilot_k8s_cfg_events","istio_build","process_virtual_memory_bytes","process_resident_memory_bytes","process_cpu_seconds_total","envoy_cluster_assignment_stale","go_goroutines","pilot_xds_pushes","pilot_proxy_convergence_time_bucket","citadel_server_root_cert_expiry_timestamp","pilot_conflict_inbound_listener","pilot_conflict_outbound_listener_http_over_current_tcp","pilot_conflict_outbound_listener_tcp_over_current_tcp","pilot_conflict_outbound_listener_tcp_over_current_http","pilot_virt_services","galley_validation_failed","pilot_services","envoy_cluster_upstream_cx_total","envoy_cluster_upstream_cx_connect_fail","envoy_cluster_upstream_cx_active","envoy_cluster_upstream_cx_rx_bytes_total","envoy_cluster_upstream_cx_tx_bytes_total","istio_request_duration_milliseconds_bucket","istio_request_duration_seconds_bucket","istio_request_bytes_bucket","istio_response_bytes_bucket"]
            #measurement_prefix = ""
            measurement_name = "istio_prom"
            #[[inputs.prom.measurements]]
            # prefix = "cpu_"
            # name = "cpu"
            [inputs.prom.tags]
            namespace = "$NAMESPACE"
        proxy.istio.io/config: |
          tracing:
            zipkin:
              address: zipkin.istio-system:9411
            custom_tags:
              project:
                literal:
                  value: "ratings"
              version:
                literal:
                  value: "v1"
              env:
                literal:
                  value: "test"
    spec:
      serviceAccountName: bookinfo-ratings
      containers:
      - name: ratings
        image: docker.io/istio/examples-bookinfo-ratings-v1:1.16.2
        imagePullPolicy: IfNotPresent
        ports:
        - containerPort: 9080
        securityContext:
          runAsUser: 1000
---
##################################################################################################
# Productpage services
##################################################################################################
apiVersion: v1
kind: Service
metadata:
  name: productpage
  namespace: prod
  labels:
    app: productpage
    service: productpage
spec:
  ports:
  - port: 9080
    name: http
  selector:
    app: productpage
---
apiVersion: v1
kind: ServiceAccount
metadata:
  name: bookinfo-productpage
  namespace: prod
  labels:
    account: productpage
---
apiVersion: apps/v1
kind: Deployment
metadata:
  name: productpage-v1
  namespace: prod
  labels:
    app: productpage
    version: v1
spec:
  replicas: 1
  selector:
    matchLabels:
      app: productpage
      version: v1
  template:
    metadata:
      labels:
        app: productpage
        version: v1
      annotations:
        datakit/prom.instances: |
          [[inputs.prom]]
            url = "http://$IP:15020/stats/prometheus"
            source = "bookinfo-istio-product"
            metric_types = ["counter", "gauge"]
            interval = "60s"
      tags_ignore = ["cache","cluster_type","component","destination_app","destination_canonical_revision","destination_canonical_service","destination_cluster","destination_principal","group","grpc_code","grpc_method","grpc_service","grpc_type","reason","request_protocol","request_type","resource","responce_code_class","response_flags","source_app","source_canonical_revision","source_canonical-service","source_cluster","source_principal","source_version","wasm_filter"]
            metric_name_filter = ["istio_requests_total","pilot_k8s_cfg_events","istio_build","process_virtual_memory_bytes","process_resident_memory_bytes","process_cpu_seconds_total","envoy_cluster_assignment_stale","go_goroutines","pilot_xds_pushes","pilot_proxy_convergence_time_bucket","citadel_server_root_cert_expiry_timestamp","pilot_conflict_inbound_listener","pilot_conflict_outbound_listener_http_over_current_tcp","pilot_conflict_outbound_listener_tcp_over_current_tcp","pilot_conflict_outbound_listener_tcp_over_current_http","pilot_virt_services","galley_validation_failed","pilot_services","envoy_cluster_upstream_cx_total","envoy_cluster_upstream_cx_connect_fail","envoy_cluster_upstream_cx_active","envoy_cluster_upstream_cx_rx_bytes_total","envoy_cluster_upstream_cx_tx_bytes_total","istio_request_duration_milliseconds_bucket","istio_request_duration_seconds_bucket","istio_request_bytes_bucket","istio_response_bytes_bucket"]
            #measurement_prefix = ""
            measurement_name = "istio_prom"
            #[[inputs.prom.measurements]]
            # prefix = "cpu_"
            # name = "cpu"
            [inputs.prom.tags]
            namespace = "$NAMESPACE"
        proxy.istio.io/config: |
          tracing:
            zipkin:
              address: zipkin.istio-system:9411
            custom_tags:
              project:
                literal:
                  value: "productpage"
              version:
                literal:
                  value: "v1"
              env:
                literal:
                  value: "test"
    spec:
      serviceAccountName: bookinfo-productpage
      containers:
      - name: productpage
        image: docker.io/istio/examples-bookinfo-productpage-v1:1.16.2
        imagePullPolicy: IfNotPresent
        ports:
        - containerPort: 9080
        volumeMounts:
        - name: tmp
          mountPath: /tmp
        securityContext:
          runAsUser: 1000
      volumes:
      - name: tmp
        emptyDir: {}
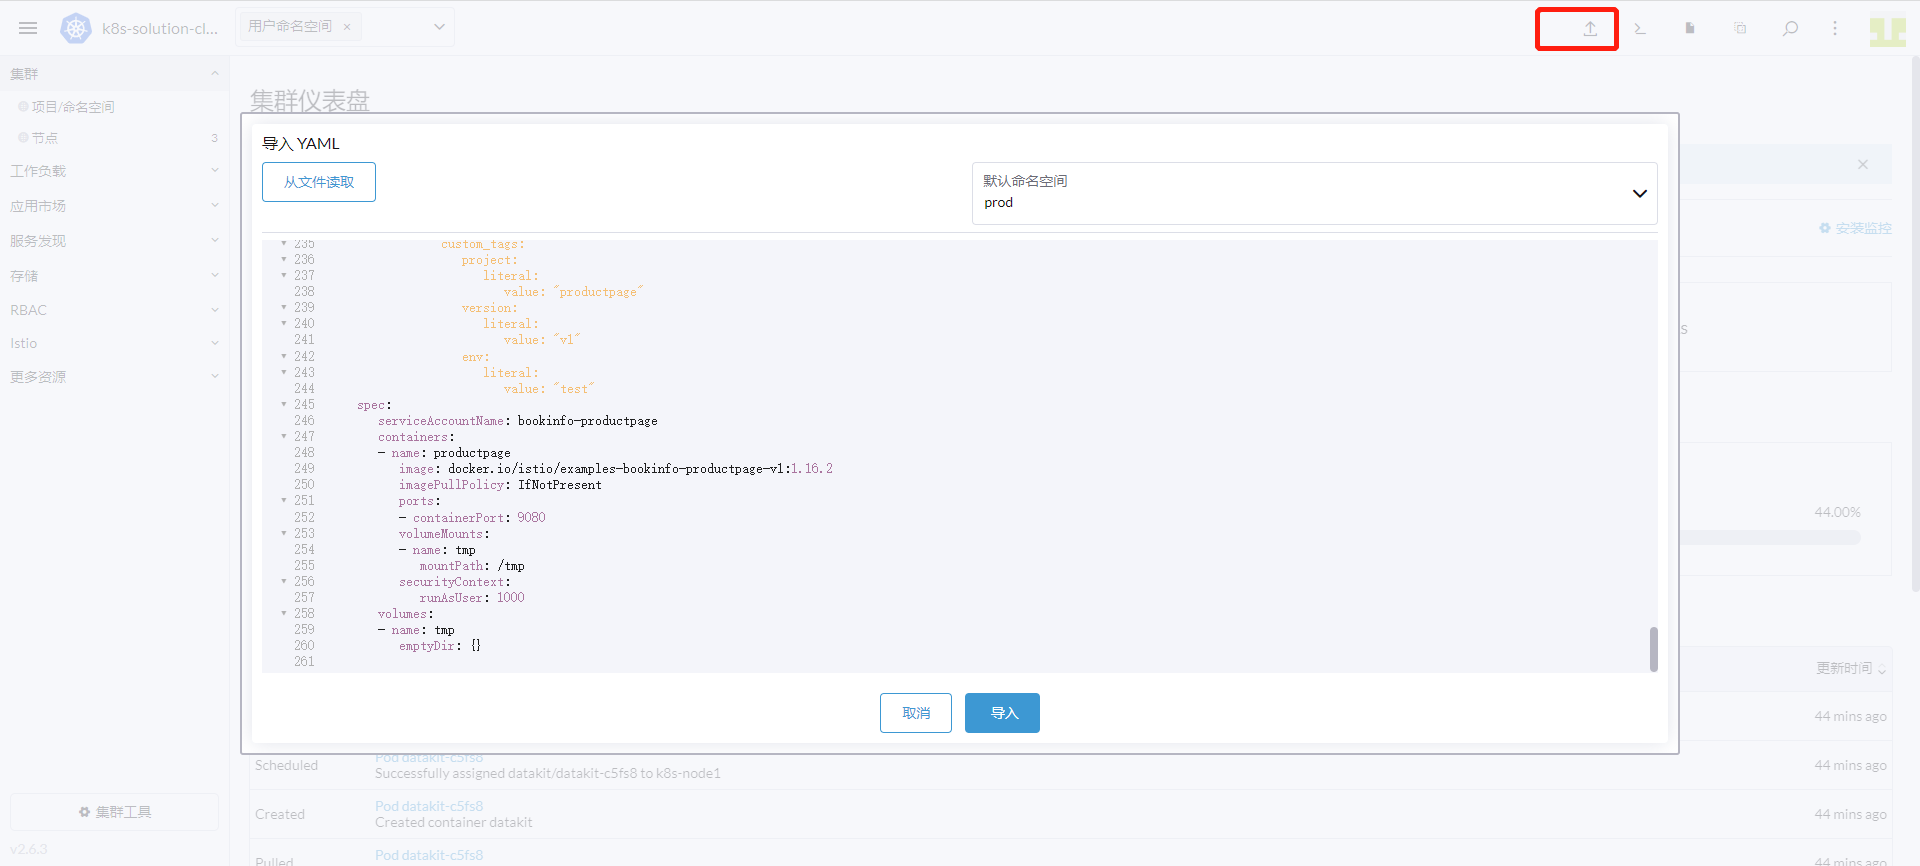
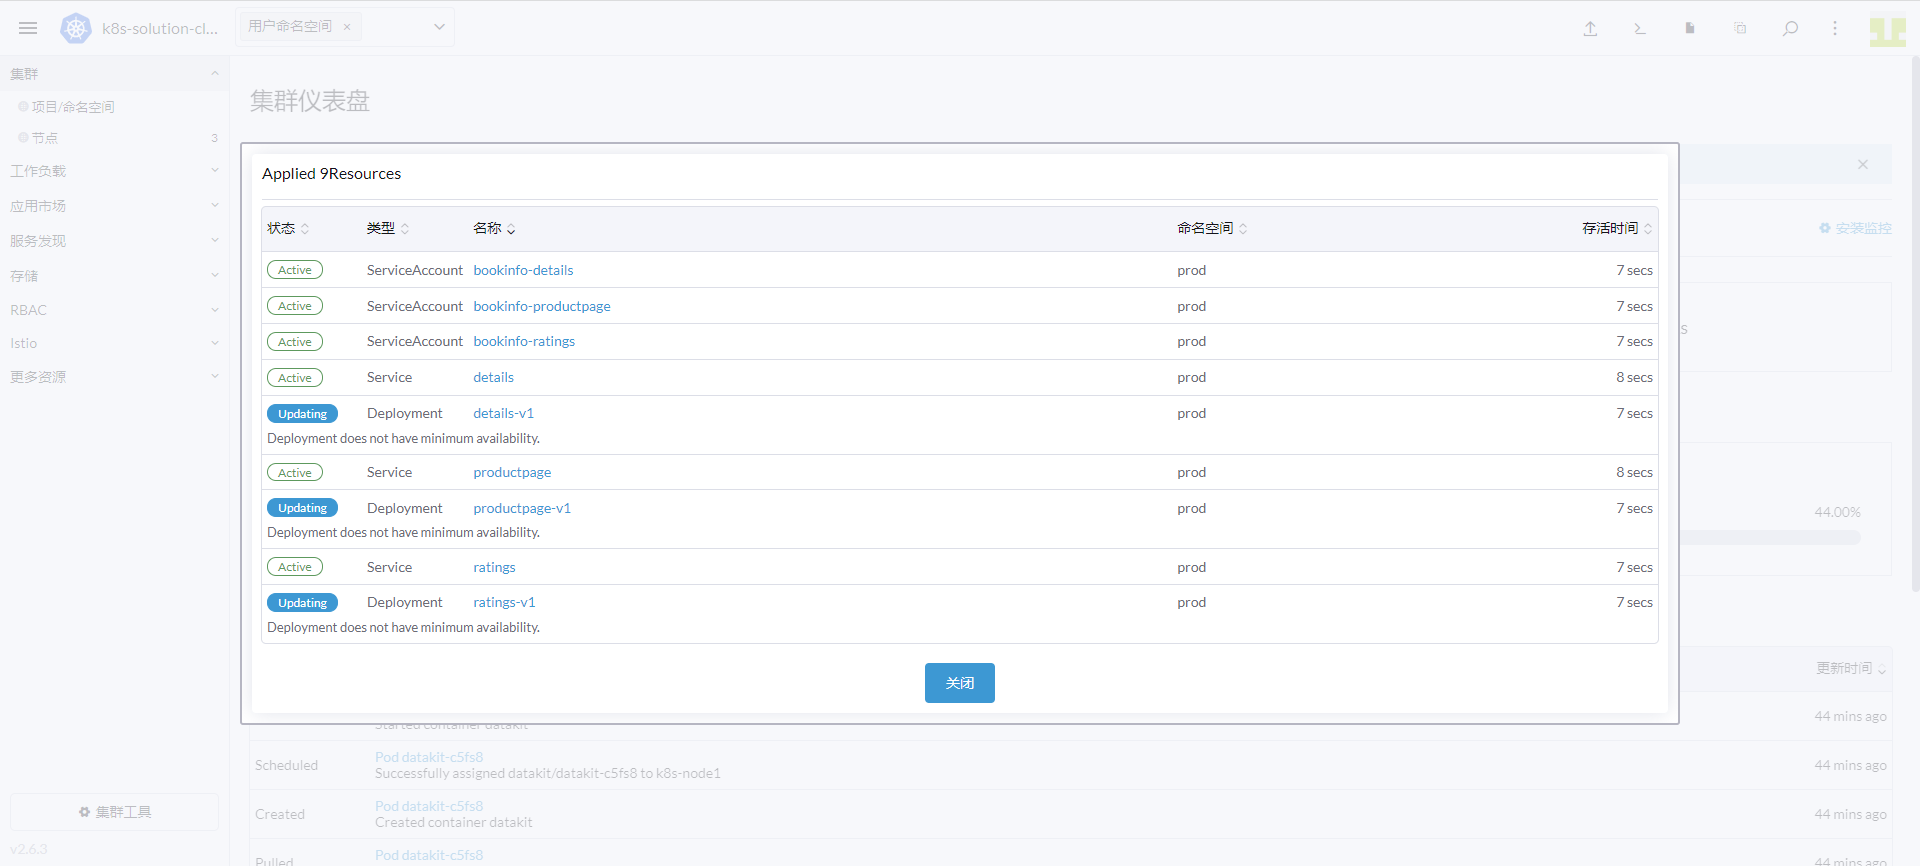
Click the Import YAML icon at the top. Enter prod as the namespace, enter the above content, and click Import.
3.10 Deploy the Reviews Pipeline
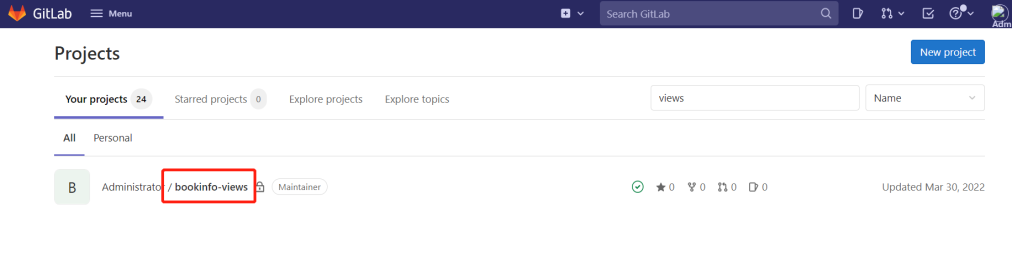
Log in to Gitlab and create a project called bookinfo-views.
Refer to the Gitlab integration documentation to connect Gitlab and DataKit. Here we only configure Gitlab CI.
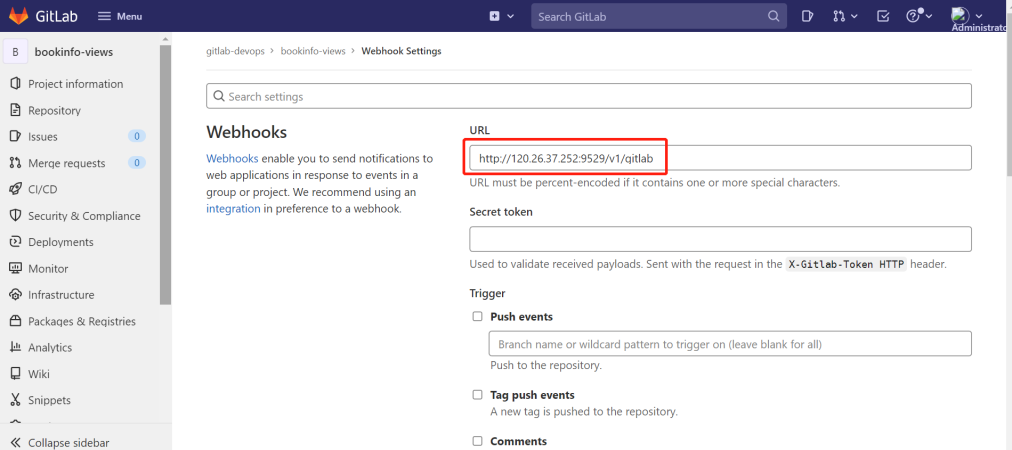
Log in to Gitlab, go to bookinfo-views → Settings → Webhooks. Enter the IP address of the host where DataKit is located and the DataKit port 9529, followed by /v1/gitlab, as shown in the following image.
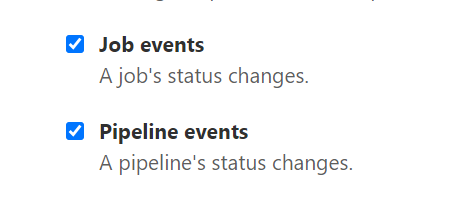
Select Job events and Pipeline events, then click Add webhook.
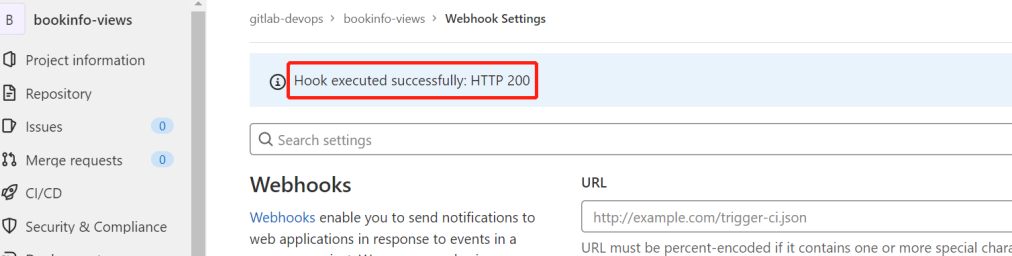
Click Test on the right of the newly created Webhook, select Pipeline events. A response of HTTP 200 indicates the configuration is successful.
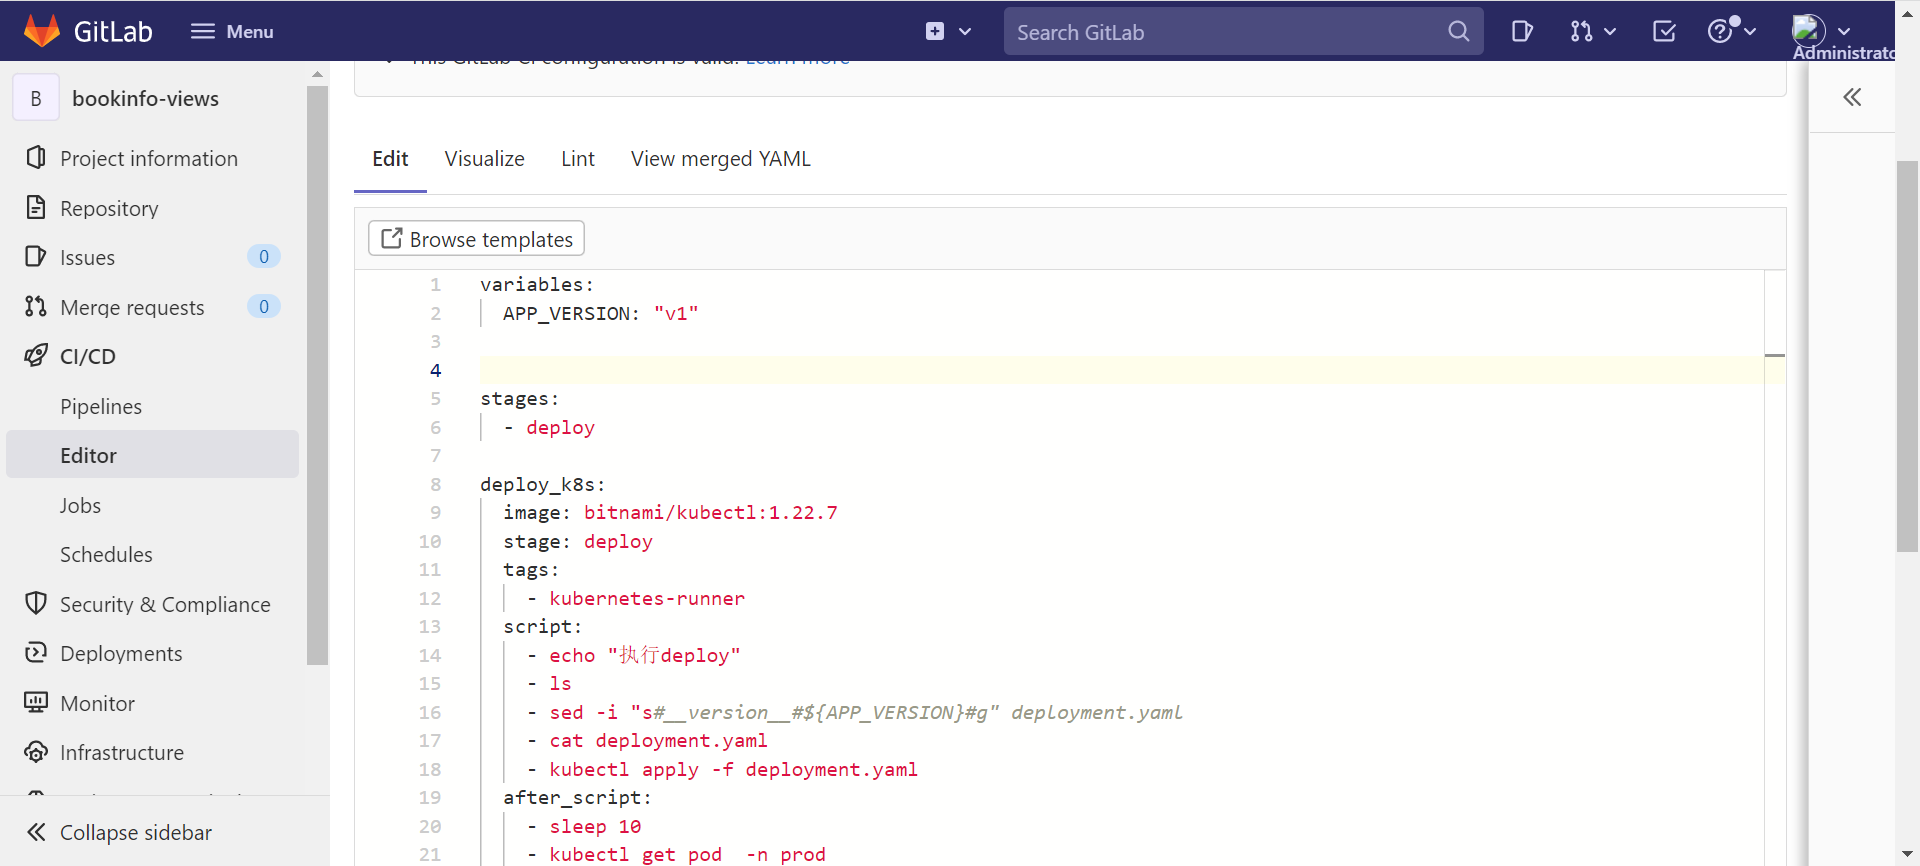
Go to the bookinfo-views project, create deployment.yaml and .gitlab-ci.yml files in the root directory. In the annotations, define the project, env, and version tags to distinguish between different projects and versions.
Configuration Files
apiVersion: v1
kind: Service
metadata:
  name: reviews
  namespace: prod
  labels:
    app: reviews
    service: reviews
spec:
  ports:
    - port: 9080
      name: http
  selector:
    app: reviews
---
apiVersion: v1
kind: ServiceAccount
metadata:
  name: bookinfo-reviews
  namespace: prod
  labels:
    account: reviews
---
apiVersion: apps/v1
kind: Deployment
metadata:
  name: reviews-__version__
  namespace: prod
  labels:
    app: reviews
    version: __version__
spec:
  replicas: 1
  selector:
    matchLabels:
      app: reviews
      version: __version__
  template:
    metadata:
      labels:
        app: reviews
        version: __version__
      annotations:
        datakit/prom.instances: |
          [[inputs.prom]]
            url = "http://$IP:15020/stats/prometheus"
            source = "bookinfo-istio-review"
            metric_types = ["counter", "gauge"]
            interval = "60s"
            tags_ignore = ["cache","cluster_type","component","destination_app","destination_canonical_revision","destination_canonical_service","destination_cluster","destination_principal","group","grpc_code","grpc_method","grpc_service","grpc_type","reason","request_protocol","request_type","resource","responce_code_class","response_flags","source_app","source_canonical_revision","source_canonical-service","source_cluster","source_principal","source_version","wasm_filter"]
            metric_name_filter = ["istio_requests_total","pilot_k8s_cfg_events","istio_build","process_virtual_memory_bytes","process_resident_memory_bytes","process_cpu_seconds_total","envoy_cluster_assignment_stale","go_goroutines","pilot_xds_pushes","pilot_proxy_convergence_time_bucket","citadel_server_root_cert_expiry_timestamp","pilot_conflict_inbound_listener","pilot_conflict_outbound_listener_http_over_current_tcp","pilot_conflict_outbound_listener_tcp_over_current_tcp","pilot_conflict_outbound_listener_tcp_over_current_http","pilot_virt_services","galley_validation_failed","pilot_services","envoy_cluster_upstream_cx_total","envoy_cluster_upstream_cx_connect_fail","envoy_cluster_upstream_cx_active","envoy_cluster_upstream_cx_rx_bytes_total","envoy_cluster_upstream_cx_tx_bytes_total","istio_request_duration_milliseconds_bucket","istio_request_duration_seconds_bucket","istio_request_bytes_bucket","istio_response_bytes_bucket"]
            #measurement_prefix = ""
            measurement_name = "istio_prom"
            #[[inputs.prom.measurements]]
            # prefix = "cpu_"
            # name = "cpu"
            [inputs.prom.tags]
            namespace = "$NAMESPACE"
        proxy.istio.io/config: |
          tracing:
            zipkin:
              address: zipkin.istio-system:9411
            custom_tags:
              project:
                literal:
                  value: "reviews"
              version:
                literal:
                  value: __version__
              env:
                literal:
                  value: "test"
    spec:
      serviceAccountName: bookinfo-reviews
      containers:
        - name: reviews
          image: docker.io/istio/examples-bookinfo-reviews-__version__:1.16.2
          imagePullPolicy: IfNotPresent
          env:
            - name: LOG_DIR
              value: "/tmp/logs"
          ports:
            - containerPort: 9080
          volumeMounts:
            - name: tmp
              mountPath: /tmp
            - name: wlp-output
              mountPath: /opt/ibm/wlp/output
          securityContext:
            runAsUser: 1000
      volumes:
        - name: wlp-output
          emptyDir: {}
        - name: tmp
          emptyDir: {}
variables:
  APP_VERSION: "v1"

stages:
  - deploy

deploy_k8s:
  image: bitnami/kubectl:1.22.7
  stage: deploy
  tags:
    - kubernetes-runner
  script:
    - echo "Executing deploy"
    - ls
    - sed -i "s#__version__#${APP_VERSION}#g" deployment.yaml
    - cat deployment.yaml
    - kubectl apply -f deployment.yaml
  after_script:
    - sleep 10
    - kubectl get pod  -n prod
Modify the APP_VERSION value in .gitlab-ci.yml to "v1", commit the code, then change it to "v2" and commit again.

3.11 Access productpage
Click the Command Line icon at the top of the Rancher UI, enter kubectl get svc -n istio-system, and press Enter.
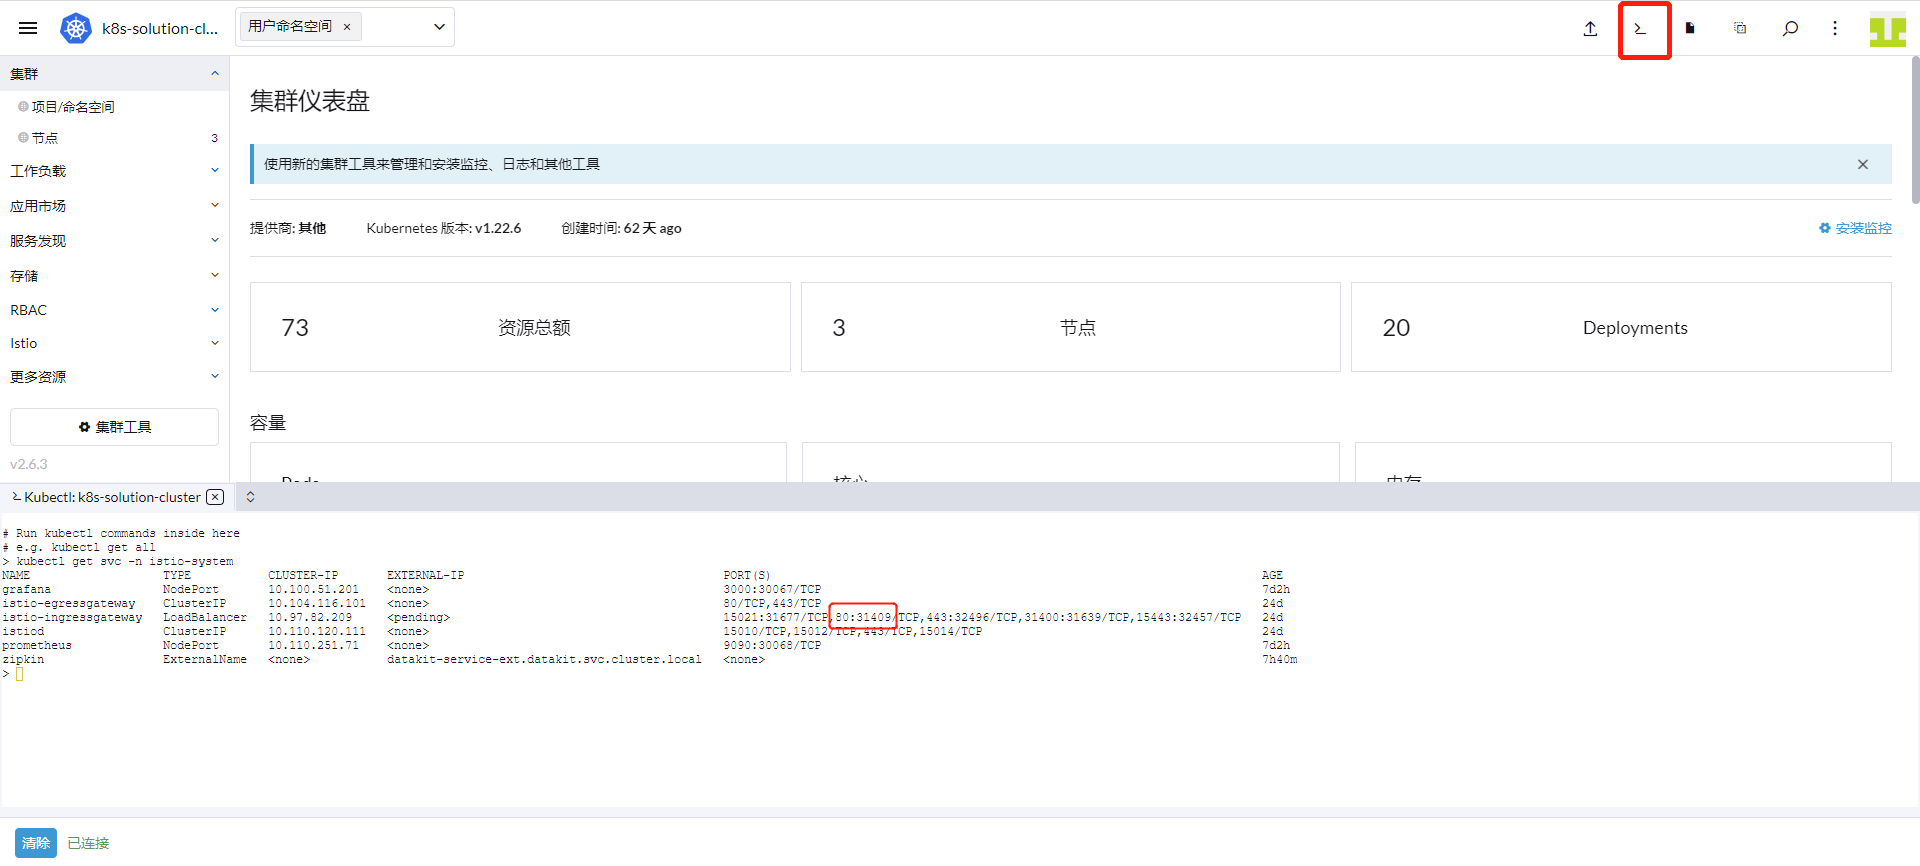
The image above shows port 31409. Based on the server IP, the access path for productpage is http://8.136.193.105:31409/productpage.

Step 4: Istio Observability
In the steps above, we have already collected metrics from Istiod and the Bookinfo application. Guance provides four default dashboards to observe Istio.
4.1 Istio Workload Dashboard
Log in to Guance, go to the Scenarios module, click Create Dashboard, enter Istio, select Istio Workload Dashboard, and click OK. Then click the newly created Istio Workload Dashboard to observe.
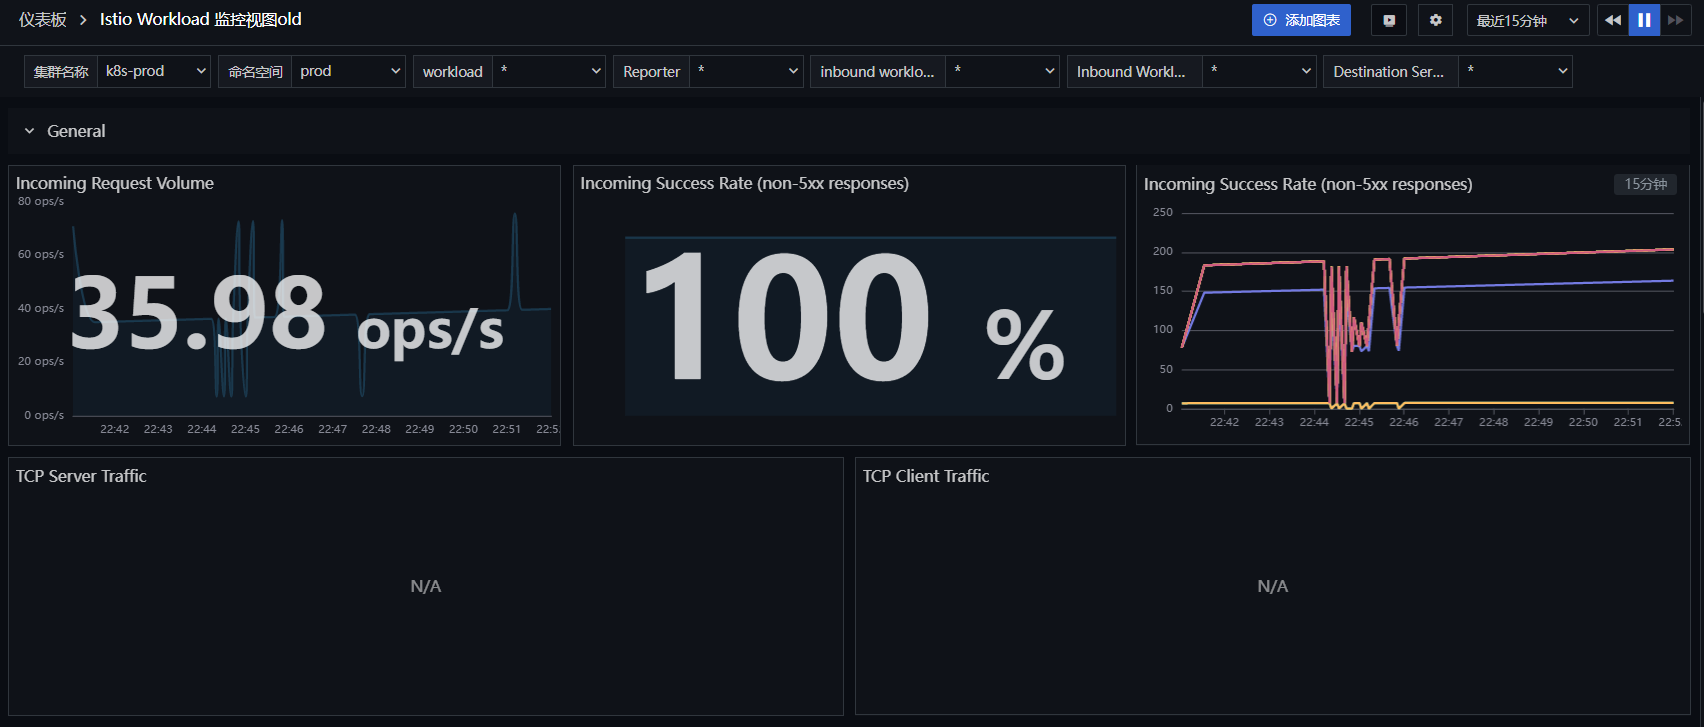
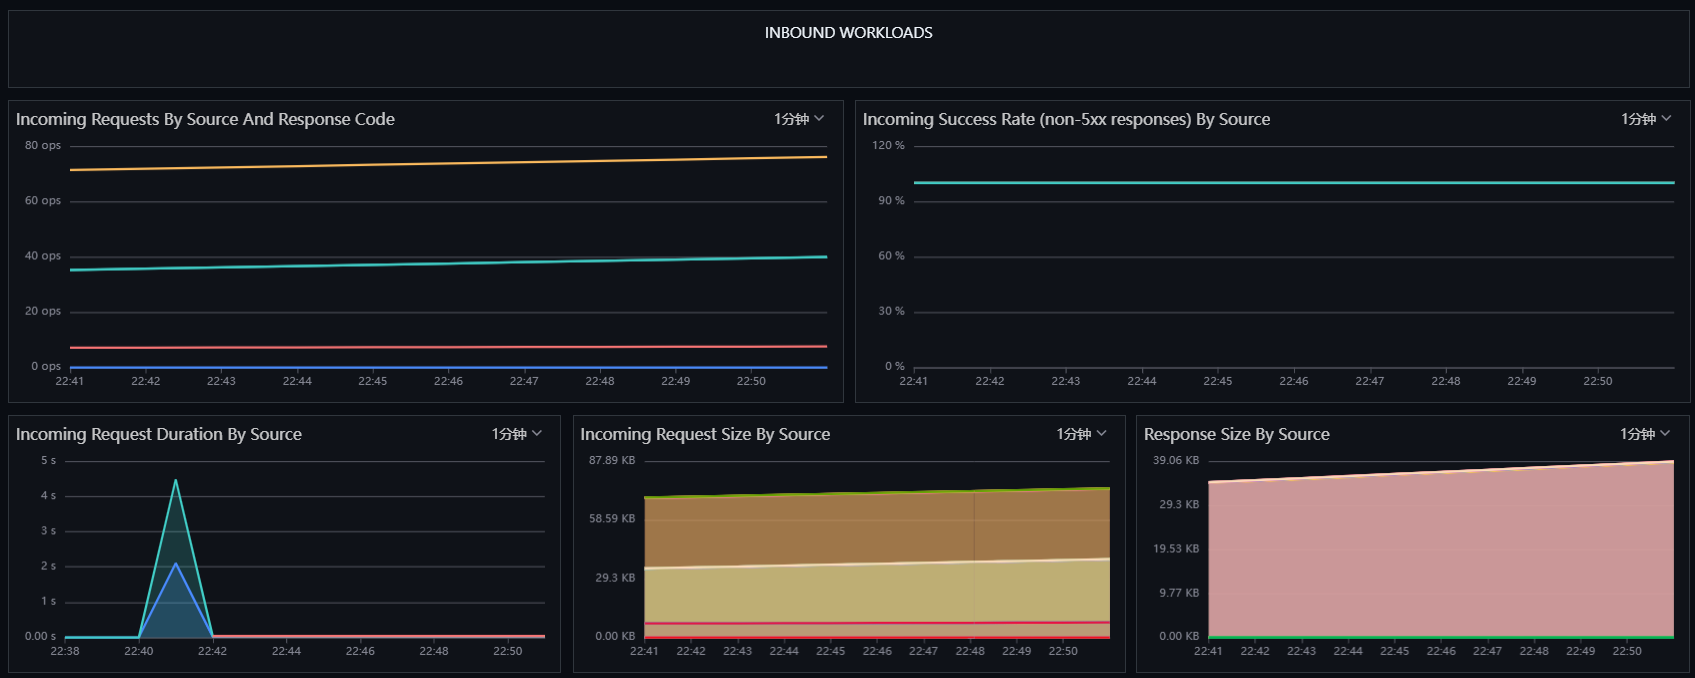
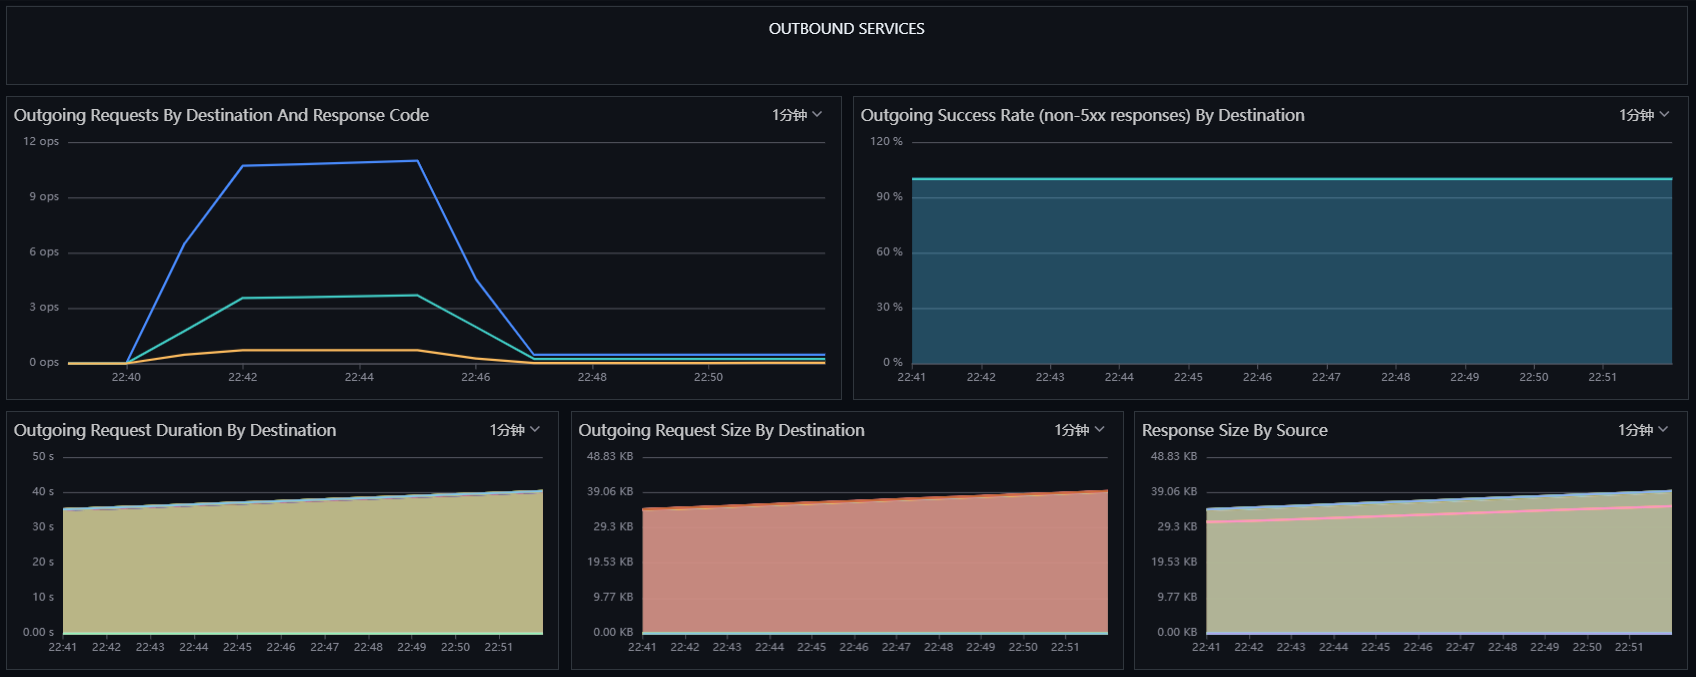
4.2 Istio Control Plane Dashboard
Log in to Guance, go to the Scenarios module, click Create Dashboard, enter Istio, select Istio Control Plane Dashboard, and click OK. Then click the newly created Istio Control Plane Dashboard to observe.

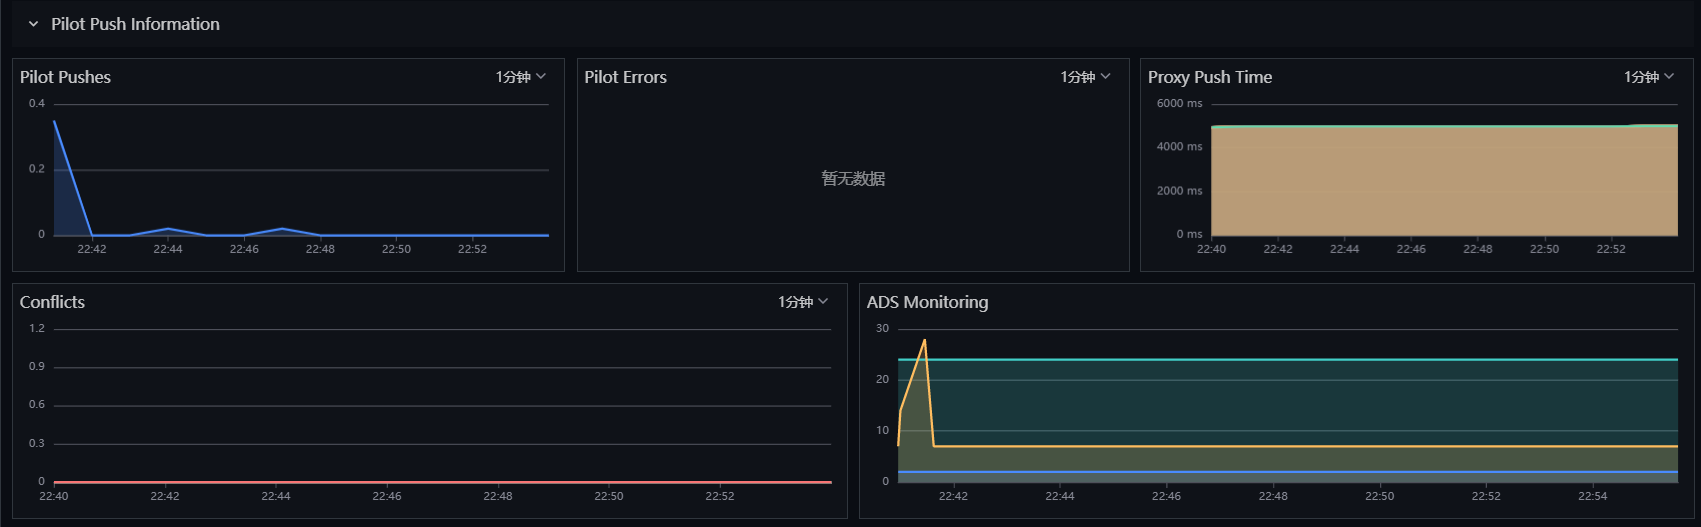

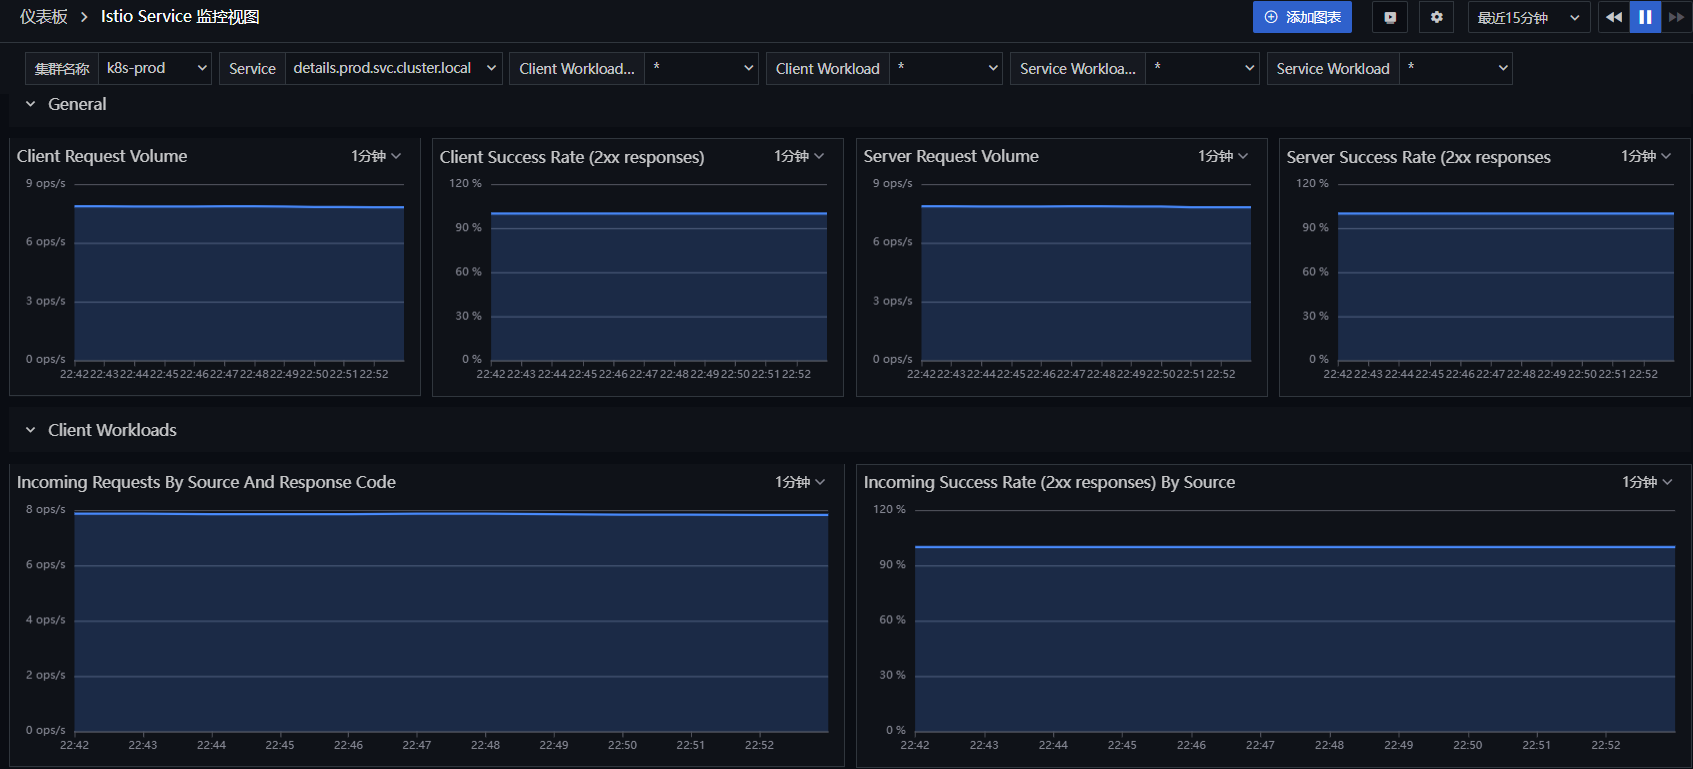
4.3 Istio Service Dashboard
Log in to Guance, go to the Scenarios module, click Create Dashboard, enter Istio, select Istio Service Dashboard, and click OK. Then click the newly created Istio Service Dashboard to observe.
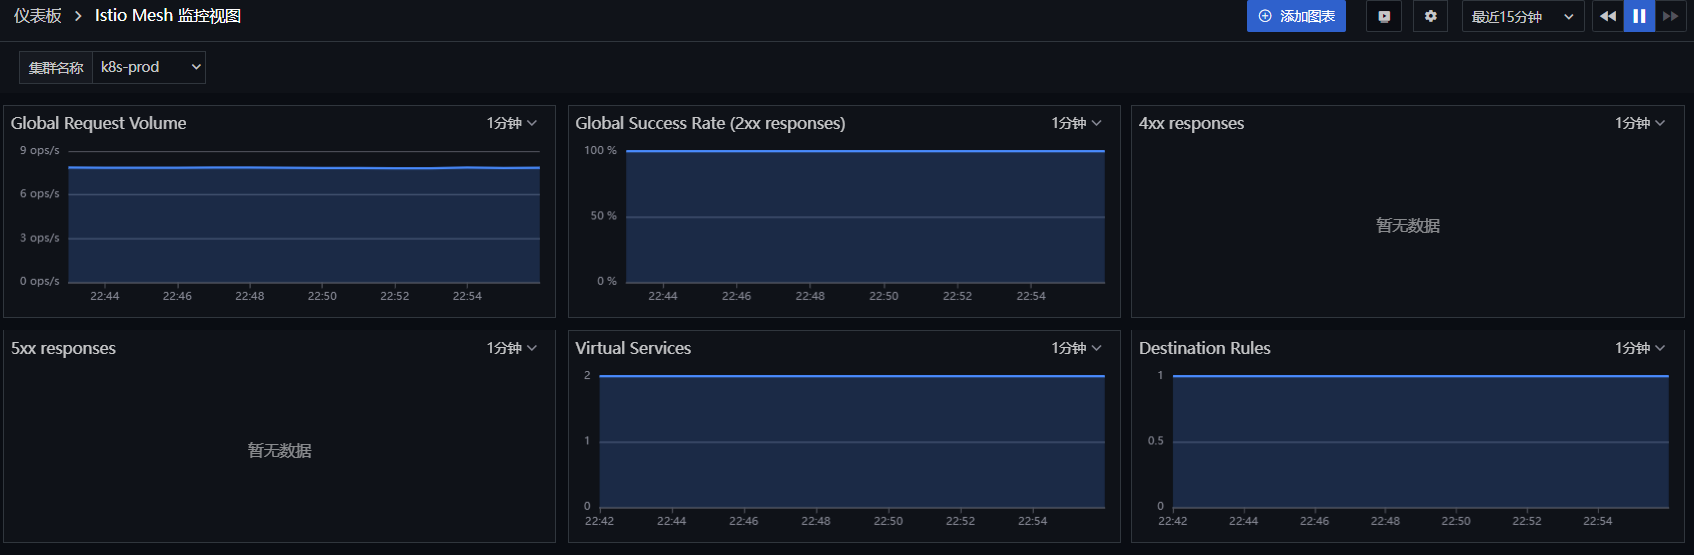
4.4 Istio Mesh Dashboard
Log in to Guance, go to the Scenarios module, click Create Dashboard, enter Istio, select Istio Mesh Dashboard, and click OK. Then click the newly created Istio Mesh Dashboard to observe.
Step 5: RUM Observability
5.1 Create a Real User Monitoring (RUM) Application
Log in to Guance, go to Real User Monitoring (RUM), and create an application named devops-bookinfo. Copy the JS code below.

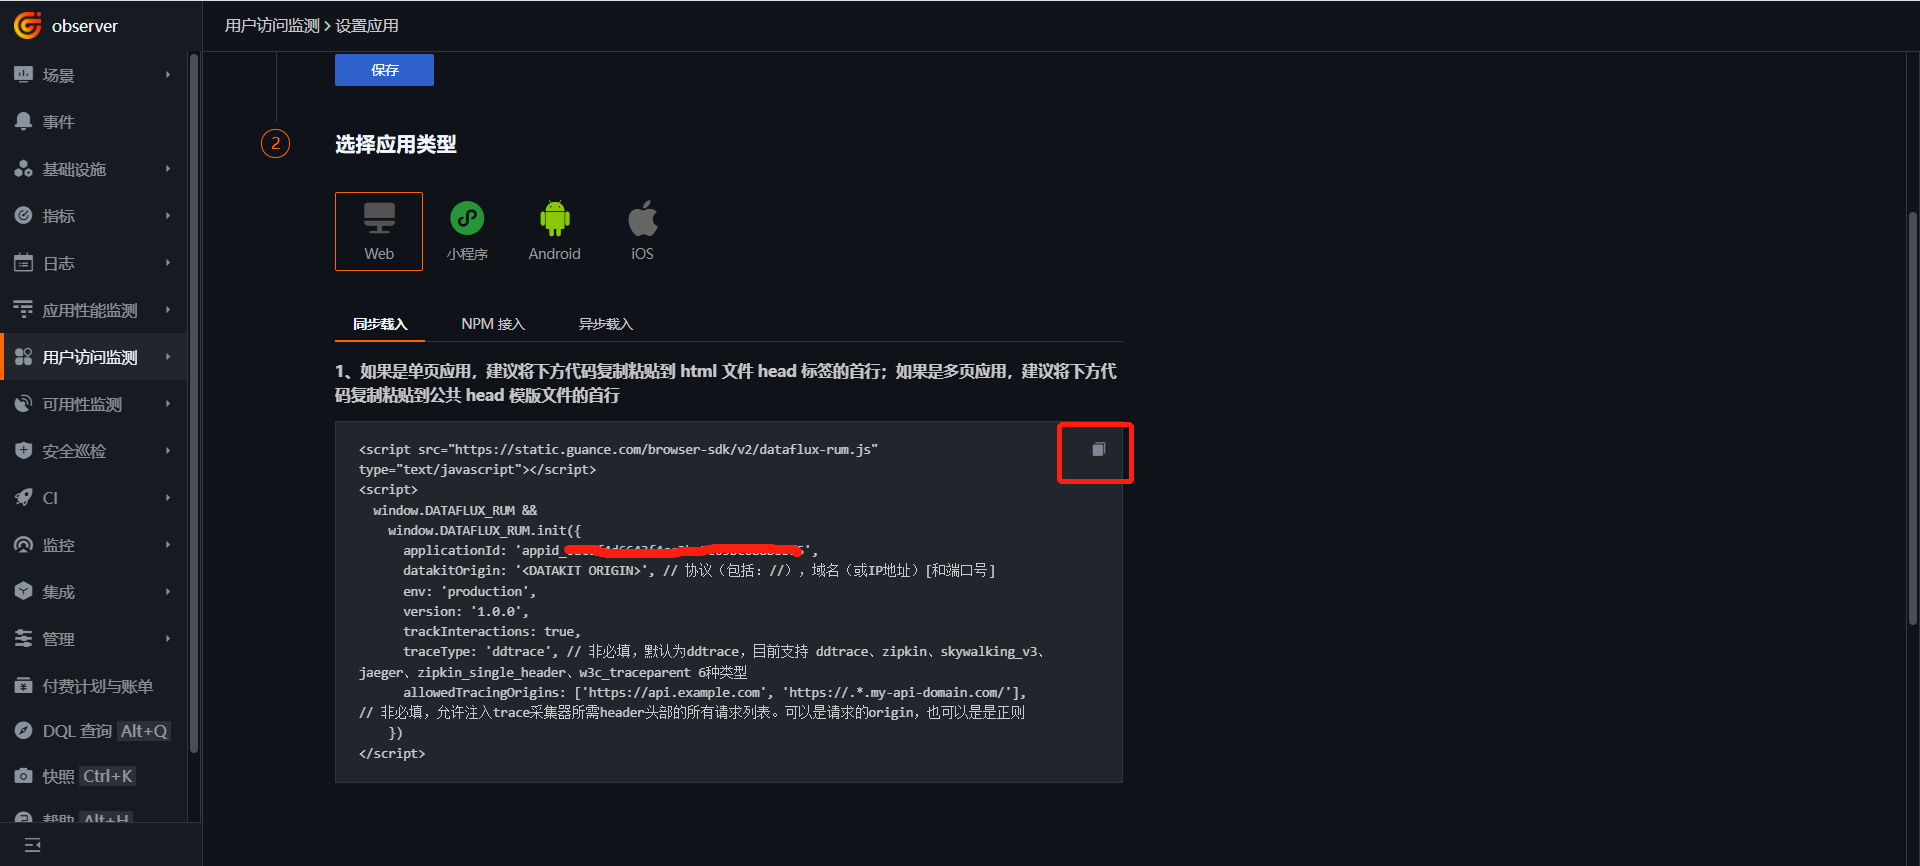
5.2 Build the productpage Image
Download istio-1.13.2-linux-amd64.tar.gz and extract it. The JS code above must be accessible from every page of the productpage project. In this project, copy the JS code into the istio-1.13.2/samples/bookinfo/src/productpage/templates/productpage.html file. The datakitOrigin value is the DataKit address.
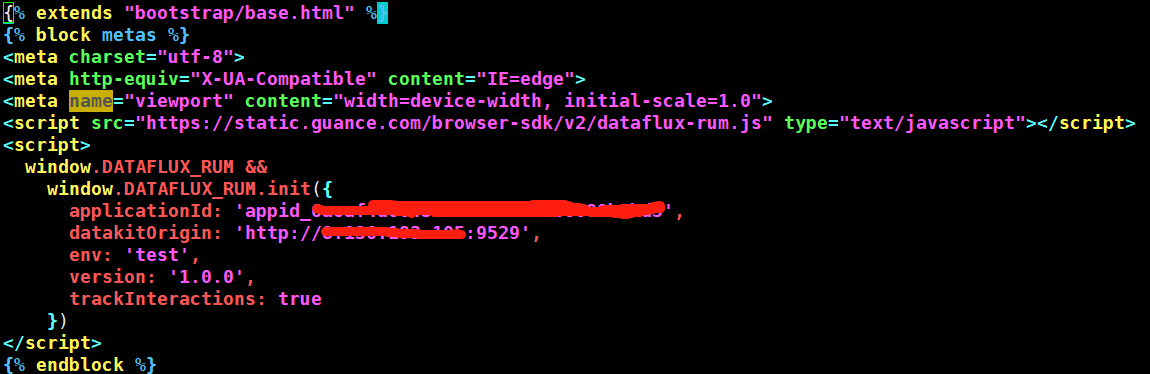
Parameter description
datakitOrigin: Data transfer address, which is the DataKit domain or IP. Required.env: Application environment. Required.version: Application version. Required.trackInteractions: Whether to enable user behavior tracking, such as button clicks, form submissions, etc. Required.traceType: Trace type, defaults toddtrace. Optional.allowedTracingOrigins: Enables linking APM and RUM traces. Fill in the backend service domain or IP. Optional.
Build the image and push it to the image repository.
cd istio-1.13.2/samples/bookinfo/src/productpage
docker build -t 172.16.0.238/df-demo/product-page:v1  .
docker push 172.16.0.238/df-demo/product-page:v1
5.3 Replace the productpage Image
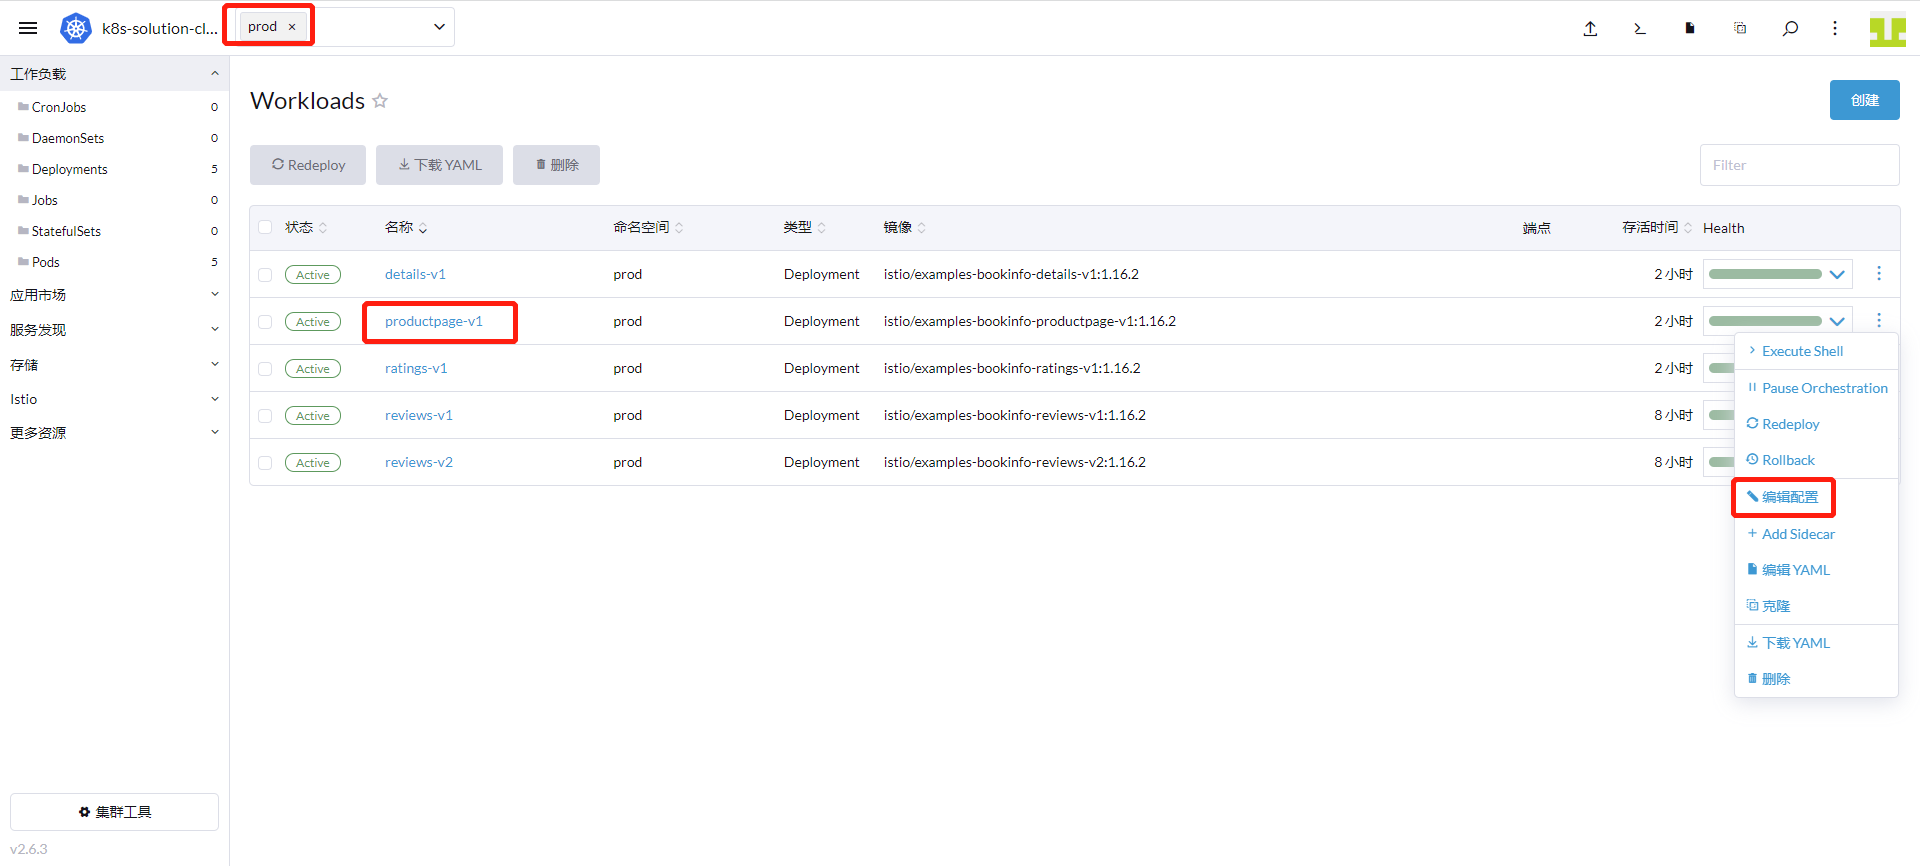
Go to Cluster → Workloads → Deployments, find productpage-v1, and click Edit Config.
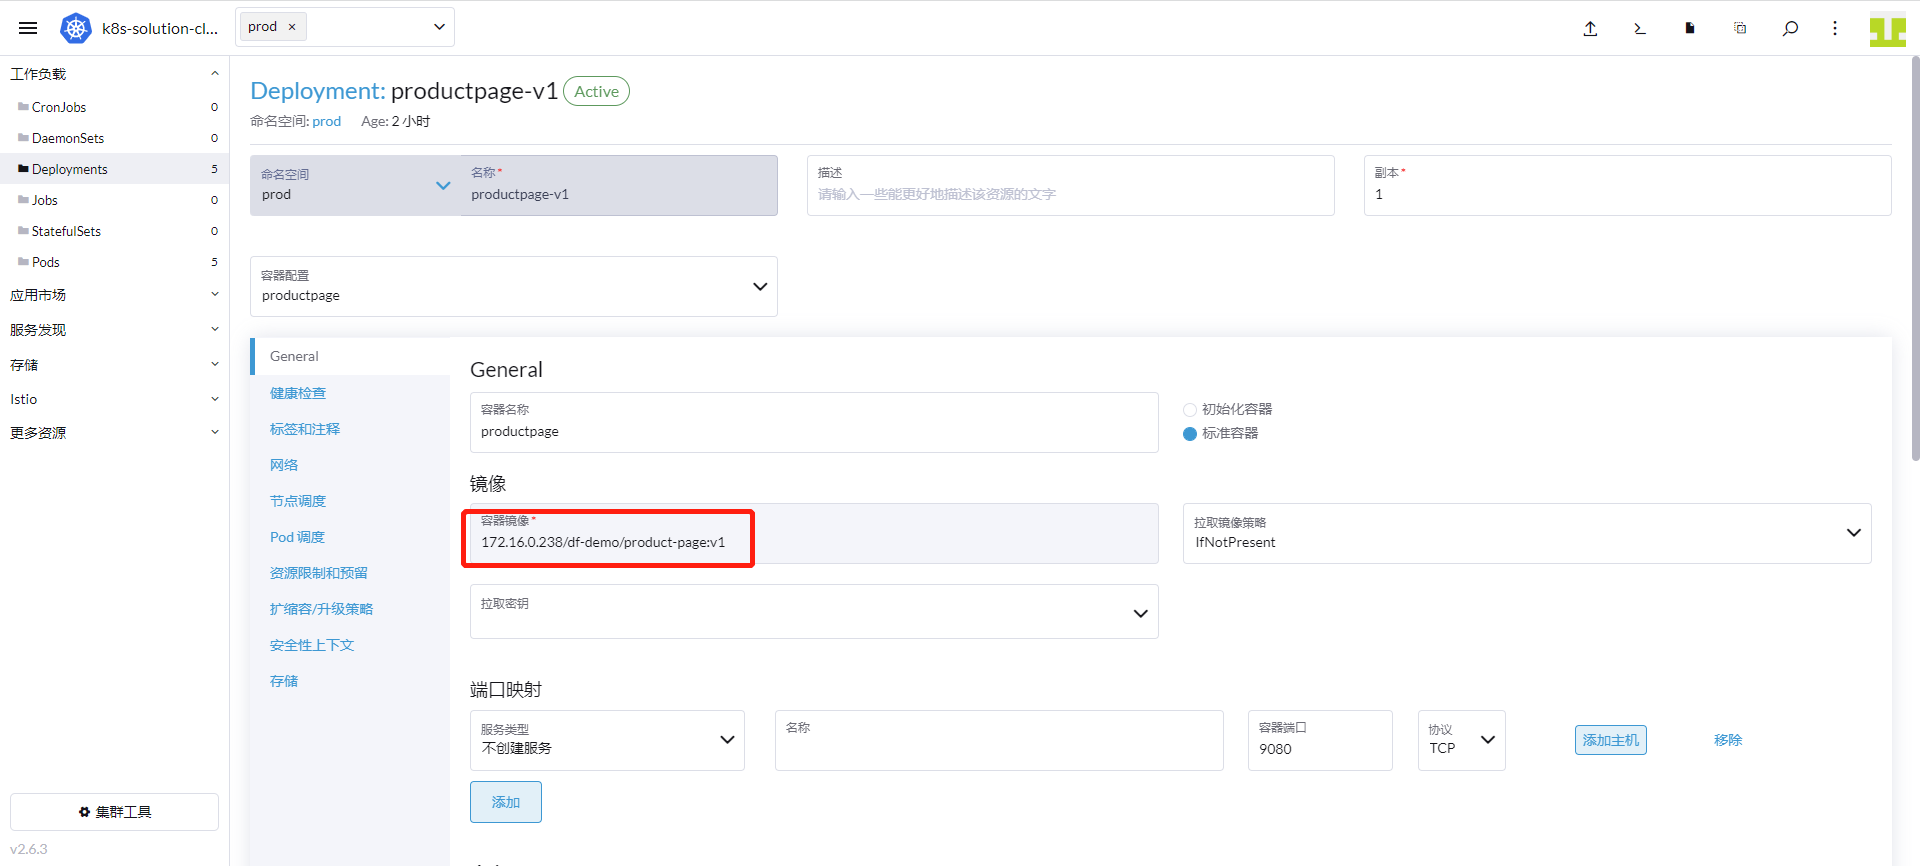
Replace the image image: docker.io/istio/examples-bookinfo-productpage-v1:1.16.2 with image: 172.16.0.238/df-demo/product-page:v1, and click Save.
5.4 Real User Monitoring (RUM)
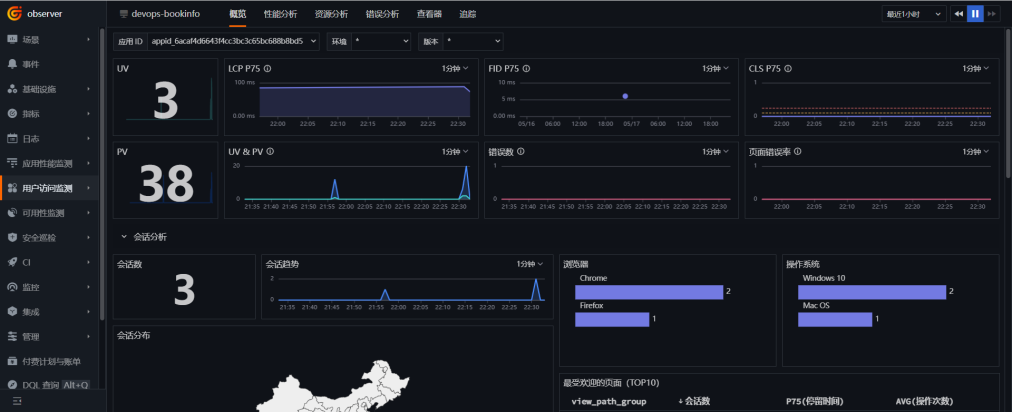
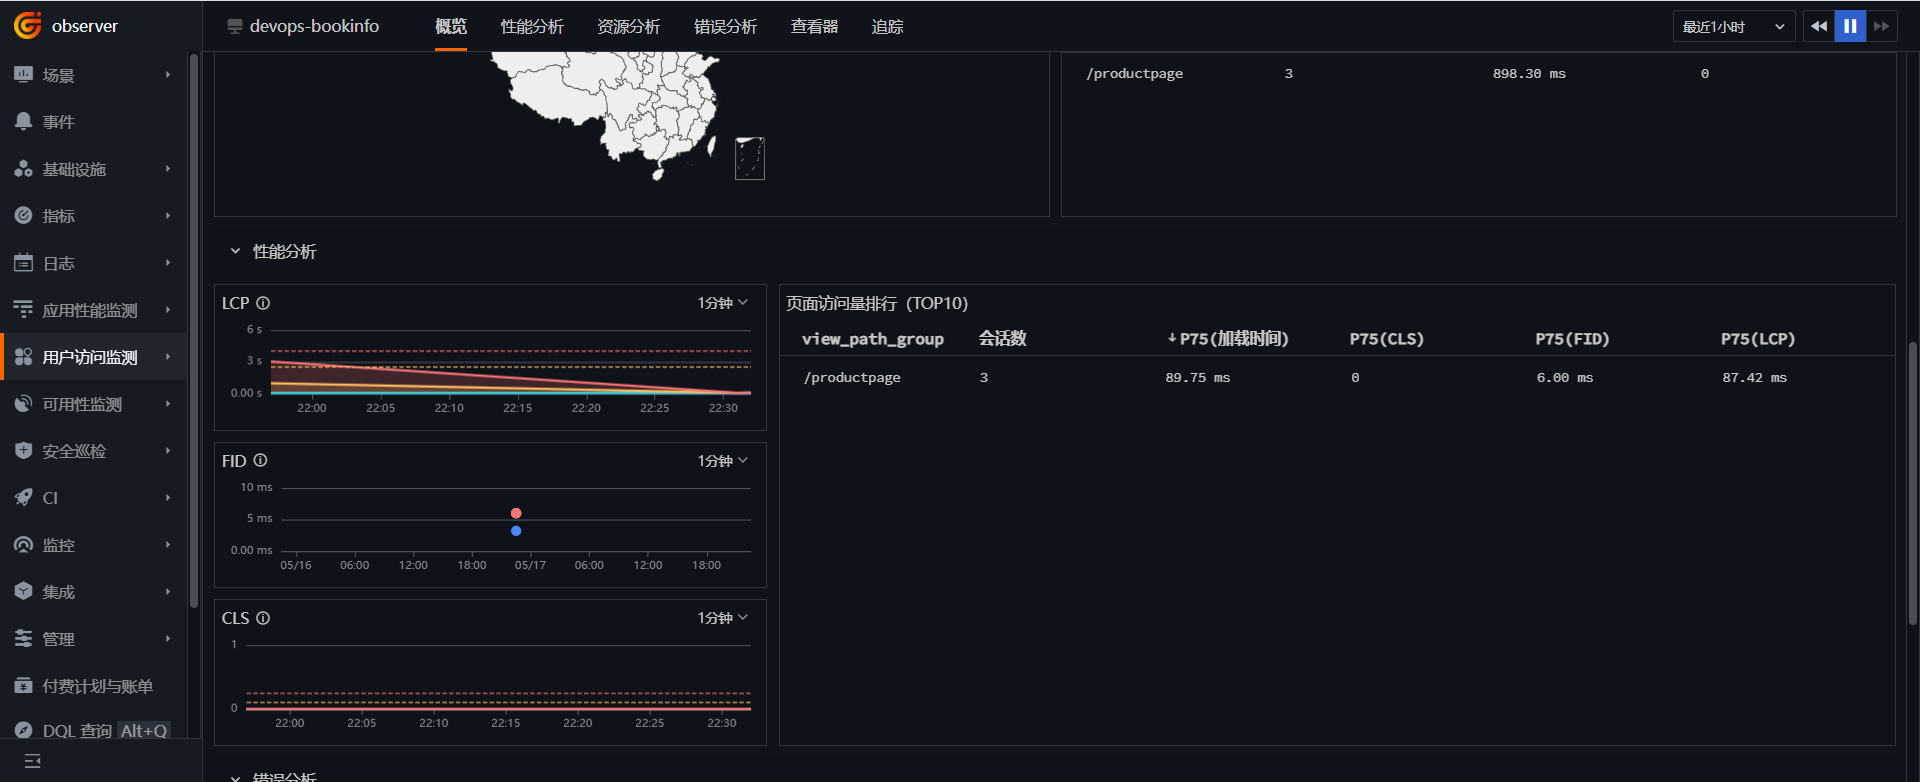
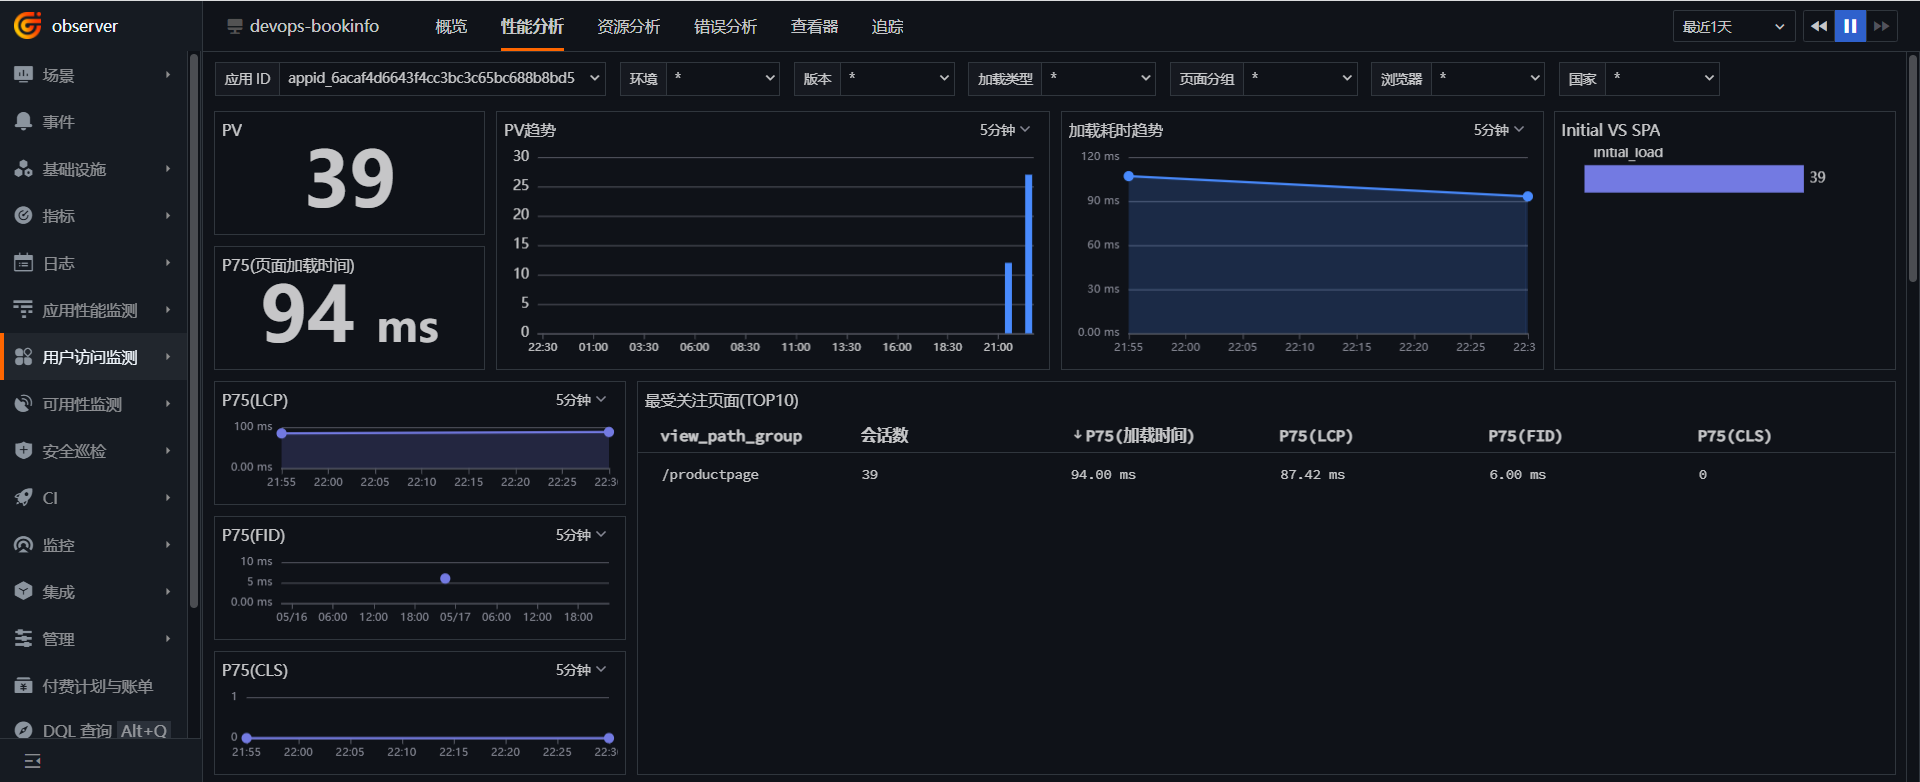
Log in to Guance, go to Real User Monitoring (RUM), find the devops-bookinfo application, and click into it to view UV, PV, session count, visited pages, etc.
Performance Analysis
Resource Analysis

Step 6: Log Observability
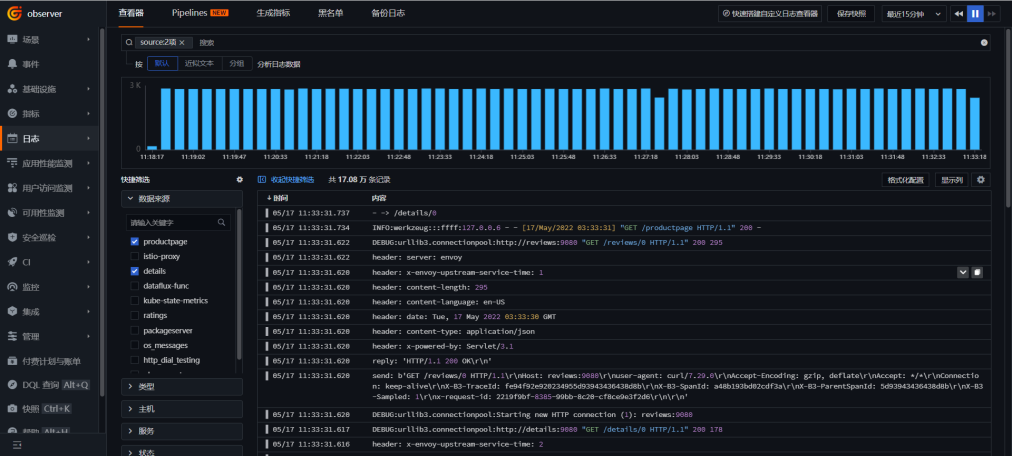
According to the configuration when deploying DataKit, logs output to /dev/stdout are collected by default. Log in to Guance, go to Logs, and view the log information. Additionally, Guance provides linking between RUM, APM, and logs. Please refer to the official documentation for the corresponding configuration.
Step 7: Gitlab CI Observability
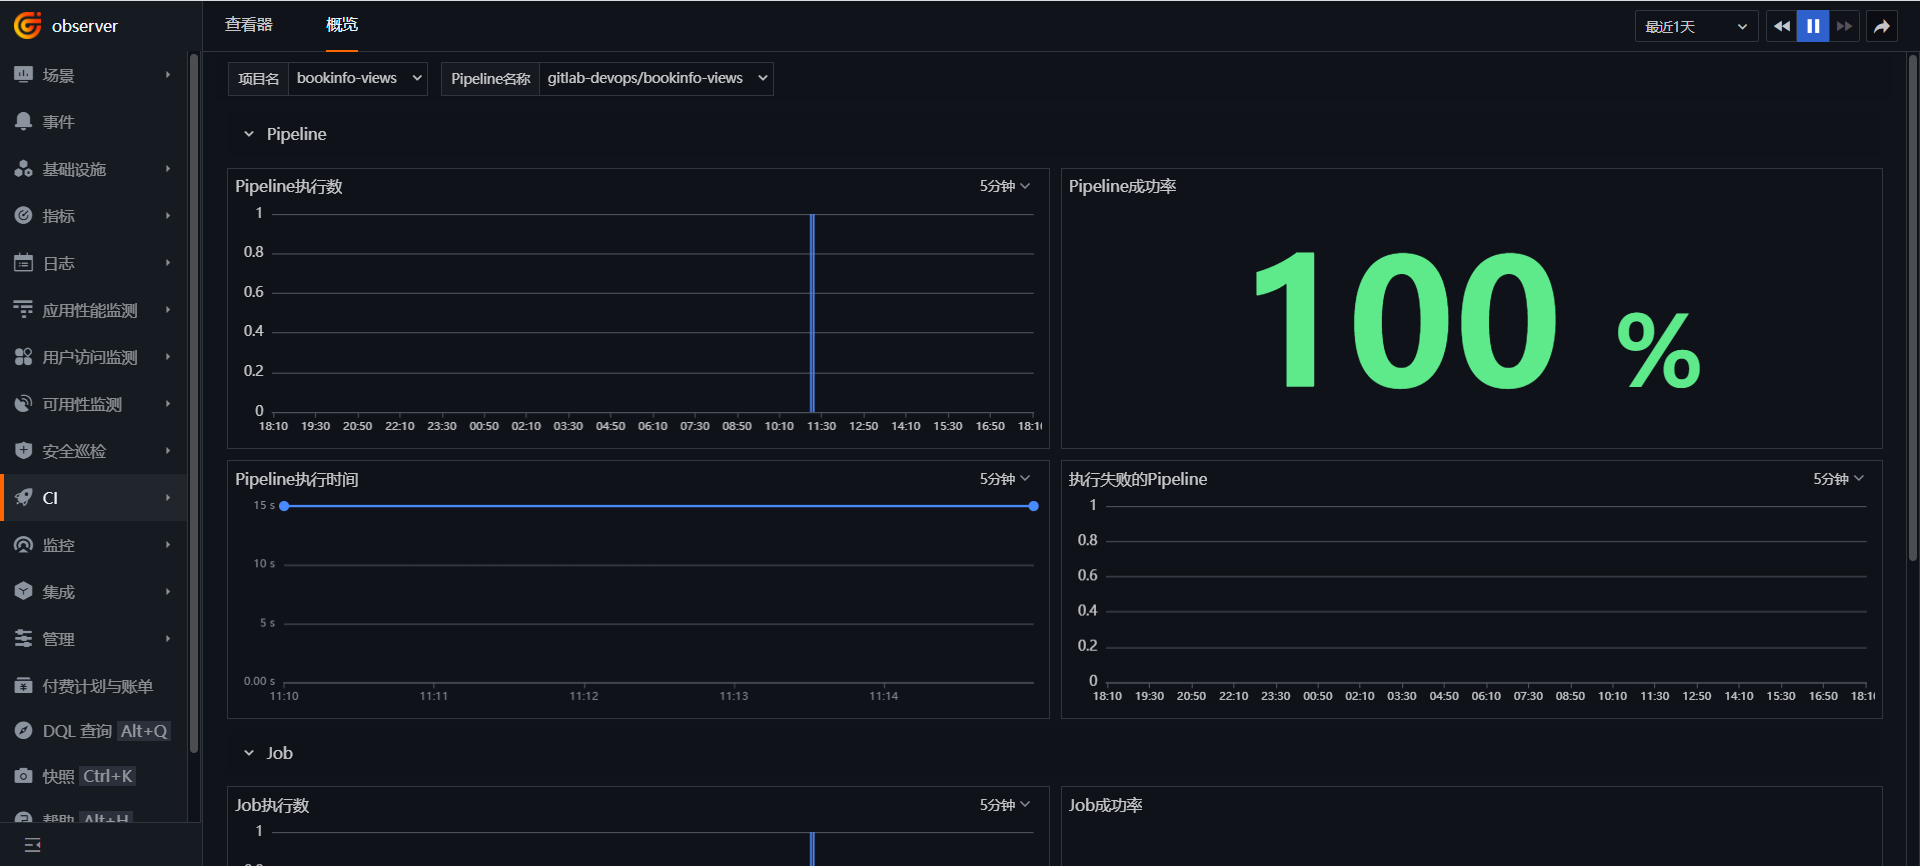
Log in to Guance, go to CI, click Overview, select the bookinfo-views project, and view the execution status of Pipelines and Jobs.
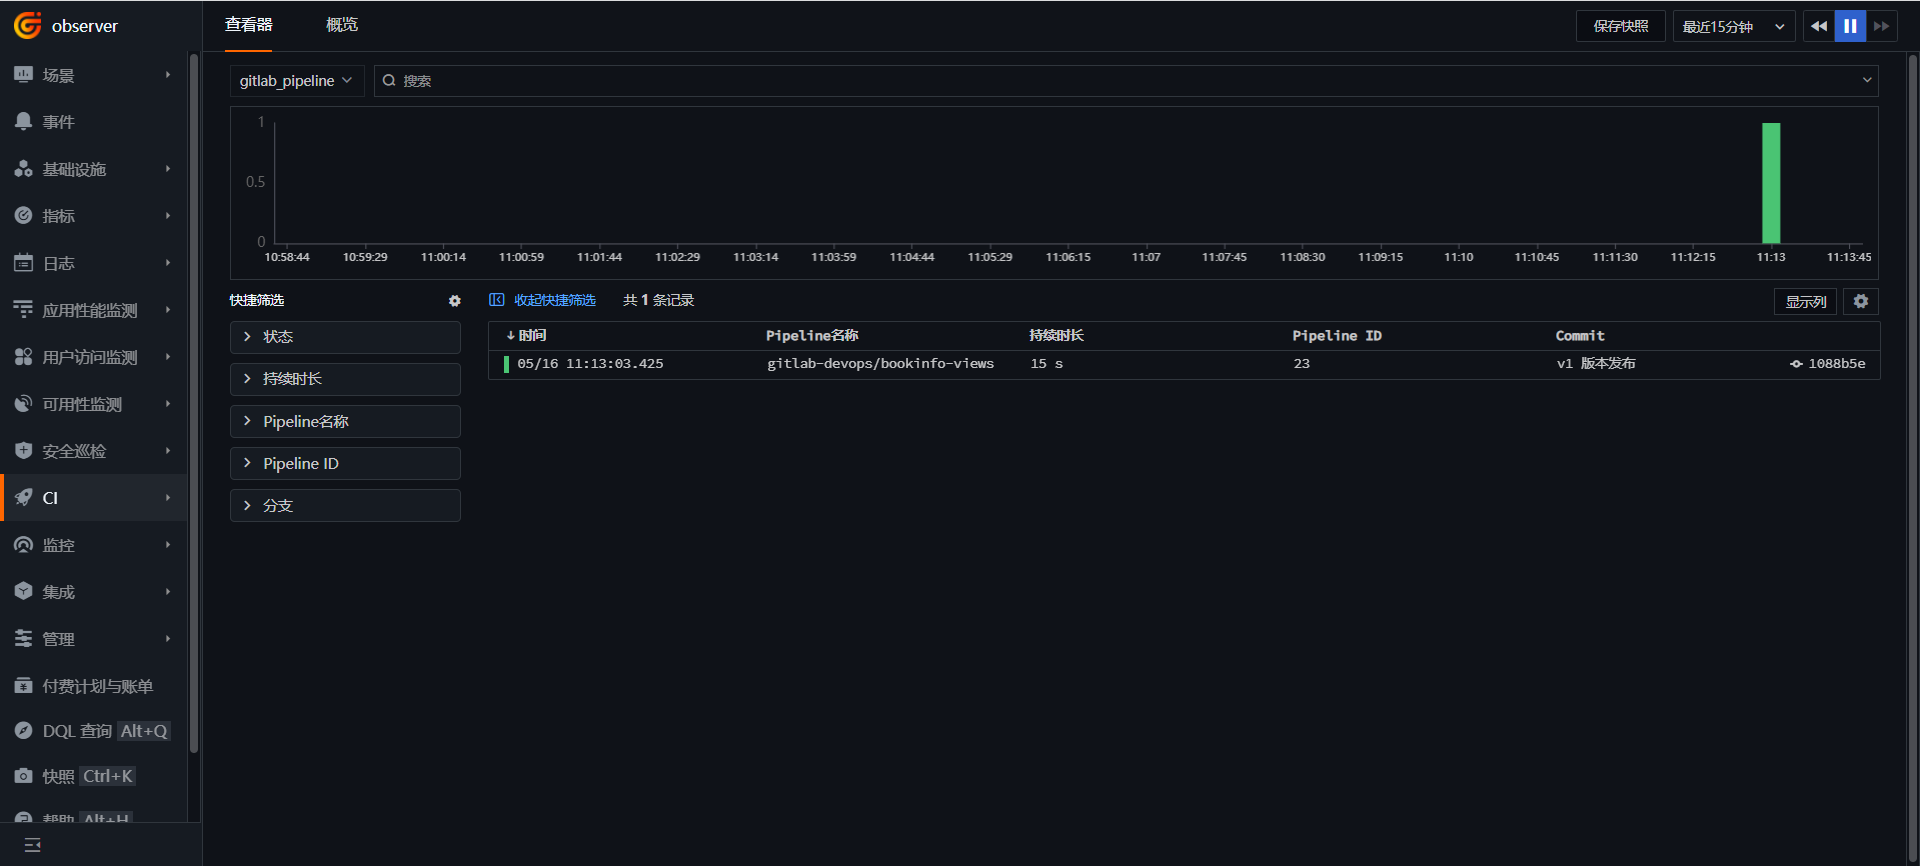
Go to CI, click Explorer, and select gitlab_pipeline.

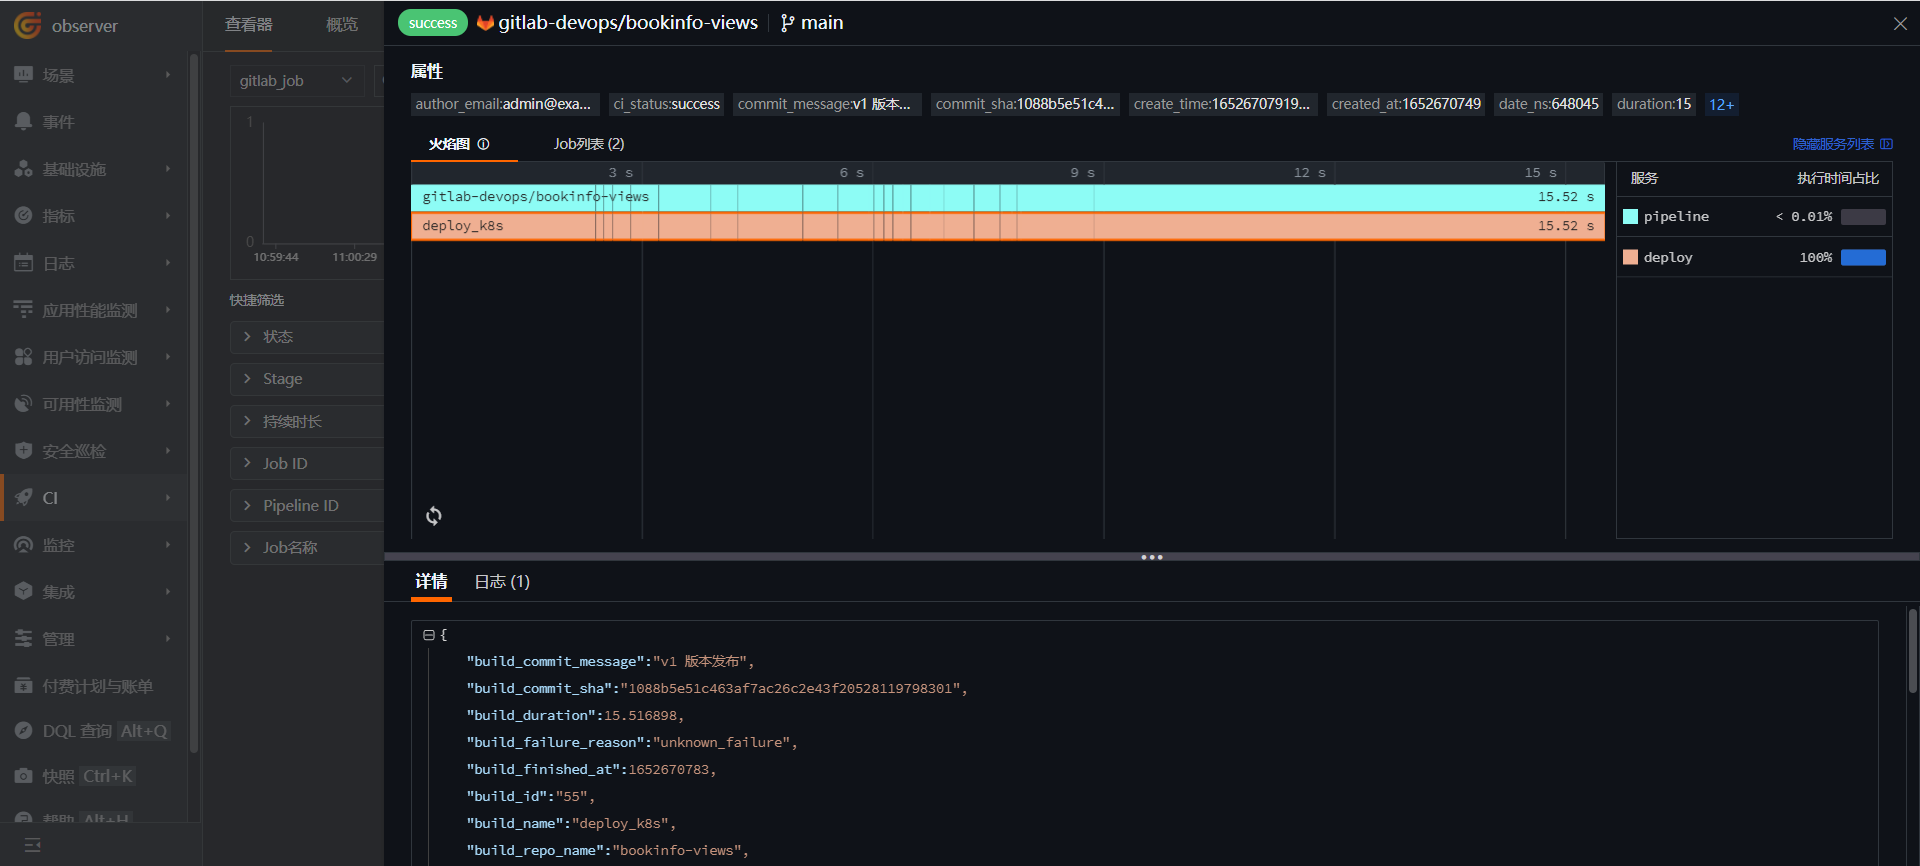
Go to CI, click Explorer, and select gitlab_job.

Step 8: Canary Release Observability
The steps are: first create a DestinationRule and VirtualService to route all traffic only to the reviews-v1 version, then deploy reviews-v2, route 10% of traffic to reviews-v2. After verification passes in Guance, fully switch traffic to reviews-v2 and decommission reviews-v1.
8.1 Create a DestinationRule
Log in to Rancher → Cluster → Istio → DestinationRule, and click Create.
Enter prod as the namespace, reviews as the name, reviews as the host, add Subset v1 and Subset v2. The detailed configuration is shown in the image below. Finally, click Create.

8.2 Create a VirtualService
Log in to Rancher → Cluster → Istio → VirtualServices, click the Import YAML icon at the top, enter the following content, and click Import.
apiVersion: networking.istio.io/v1alpha3
kind: VirtualService
metadata:
  name: reviews
  namespace: prod
spec:
  hosts:
    - reviews
  http:
    - route:
        - destination:
            host: reviews
            subset: v1
8.3 Deploy the reviews-v2 Version
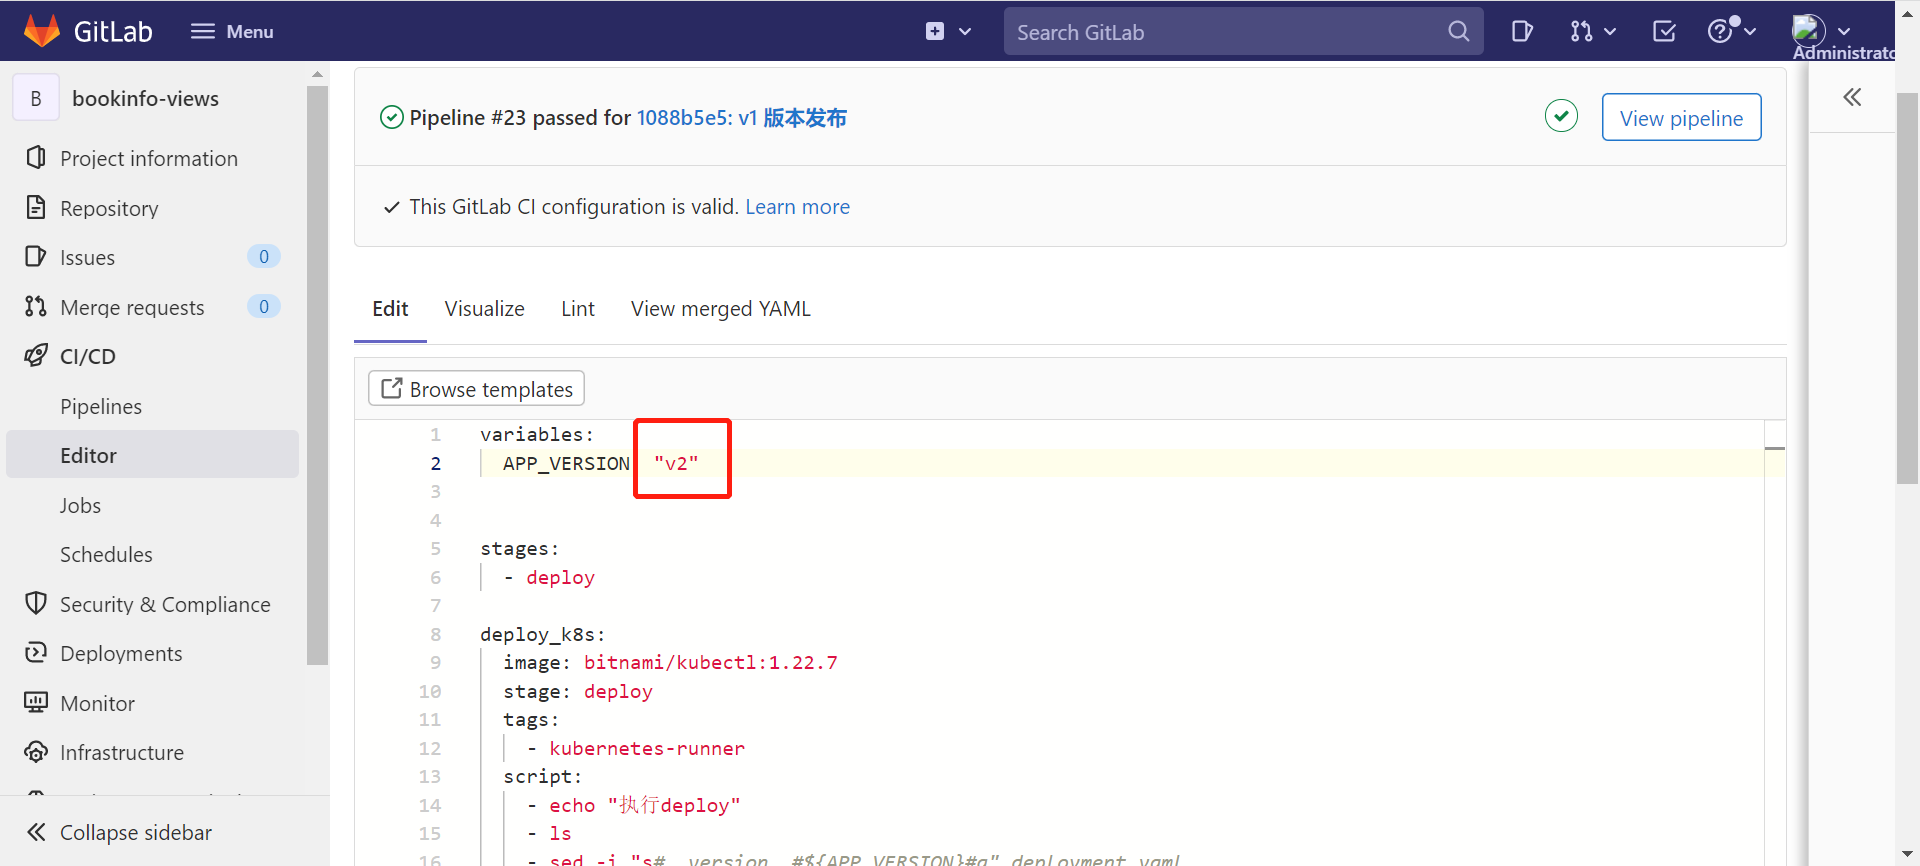
Log in to Gitlab, go to the bookinfo-views project, modify the APP_VERSION value in .gitlab-ci.yml to v2, and commit the code.
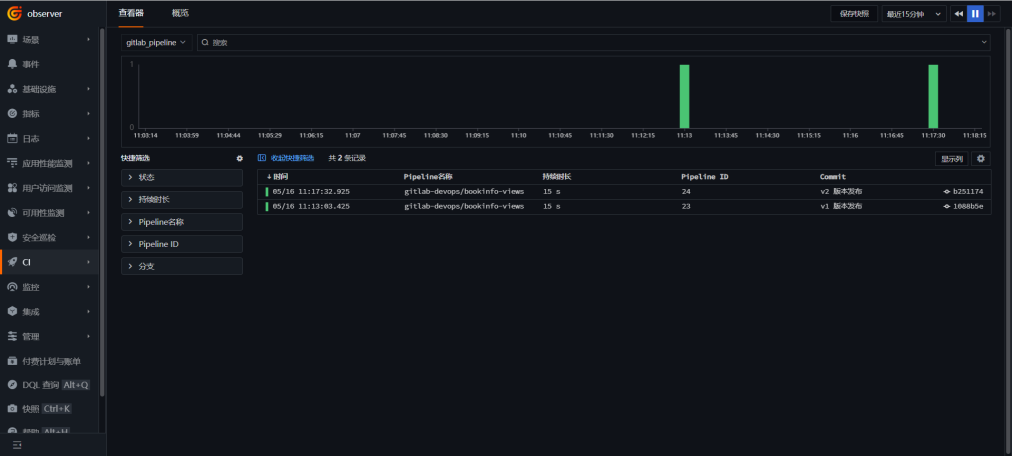
Log in to Guance, go to CI → Explorer, and you can see that the v2 version has been deployed.
8.4 Switch Traffic to the reviews-v2 Version
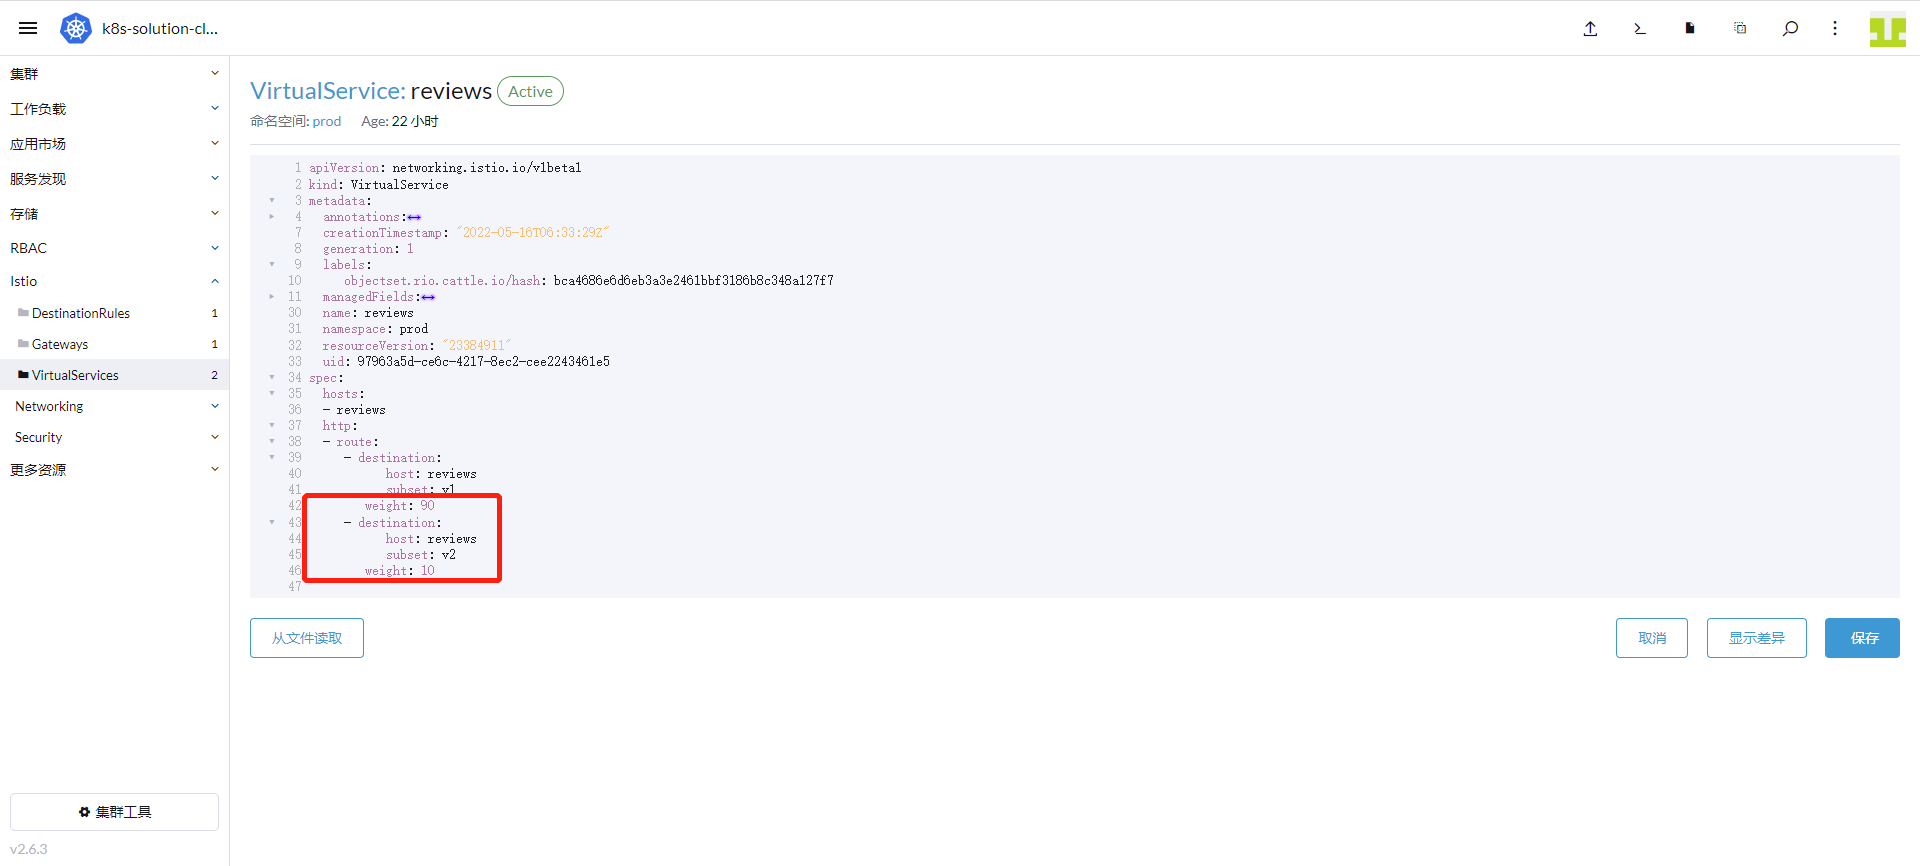
Go to Rancher → Cluster → Istio → VirtualServices, click Edit YAML on the right of reviews.
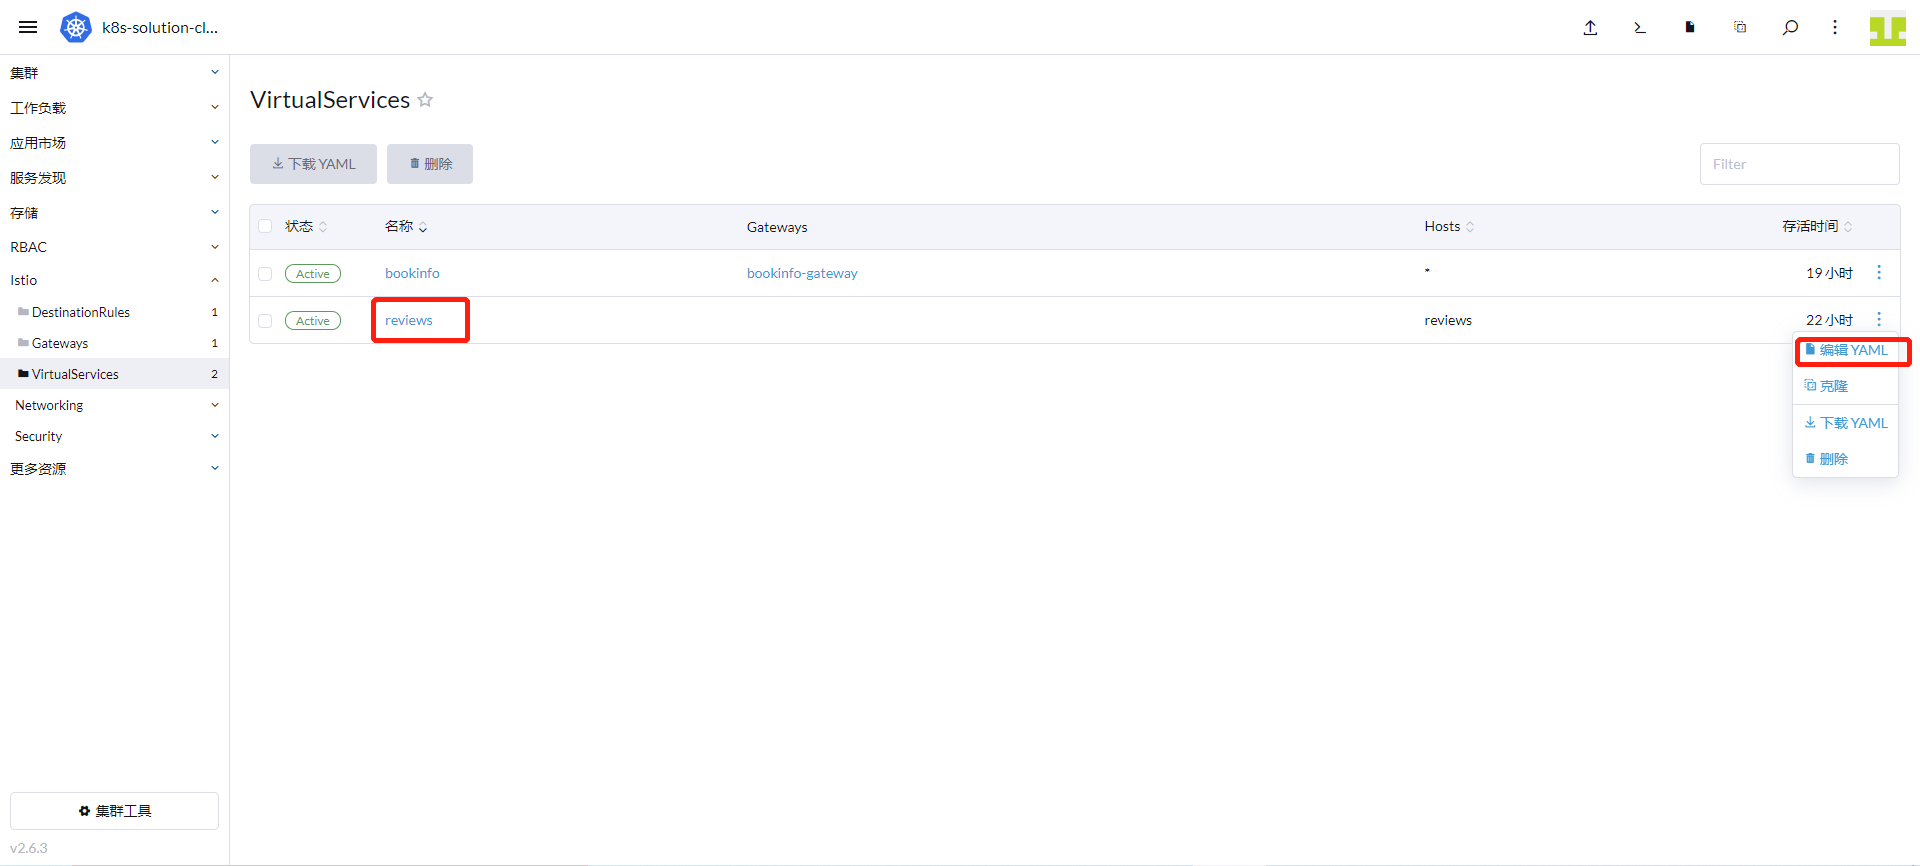
Add weight 90 for v1 and weight 10 for v2, then click Save.
8.5 Observe the reviews-v2 Operation
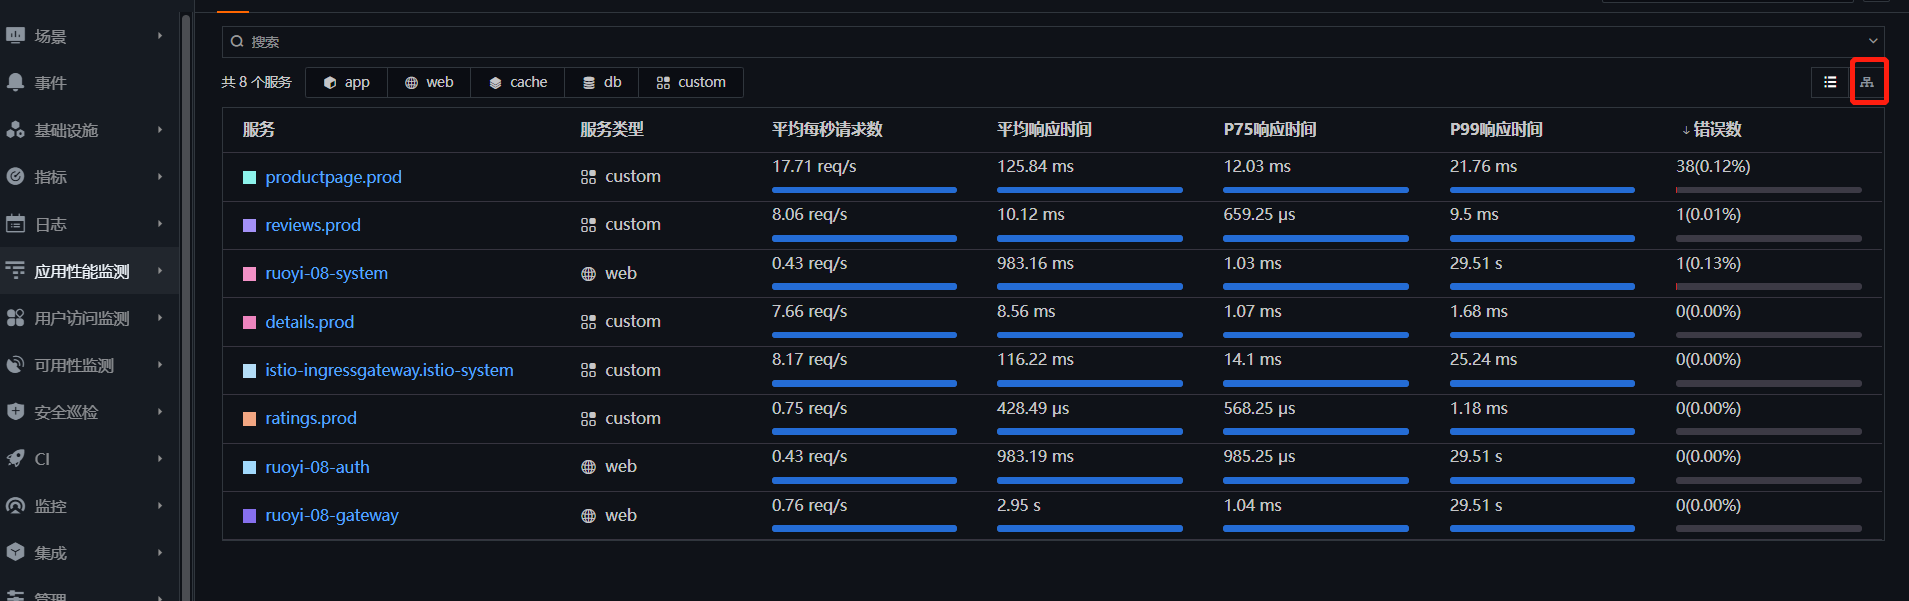
Log in to Guance, go to the Application Performance Monitoring (APM) module, and click the icon in the top-right corner.
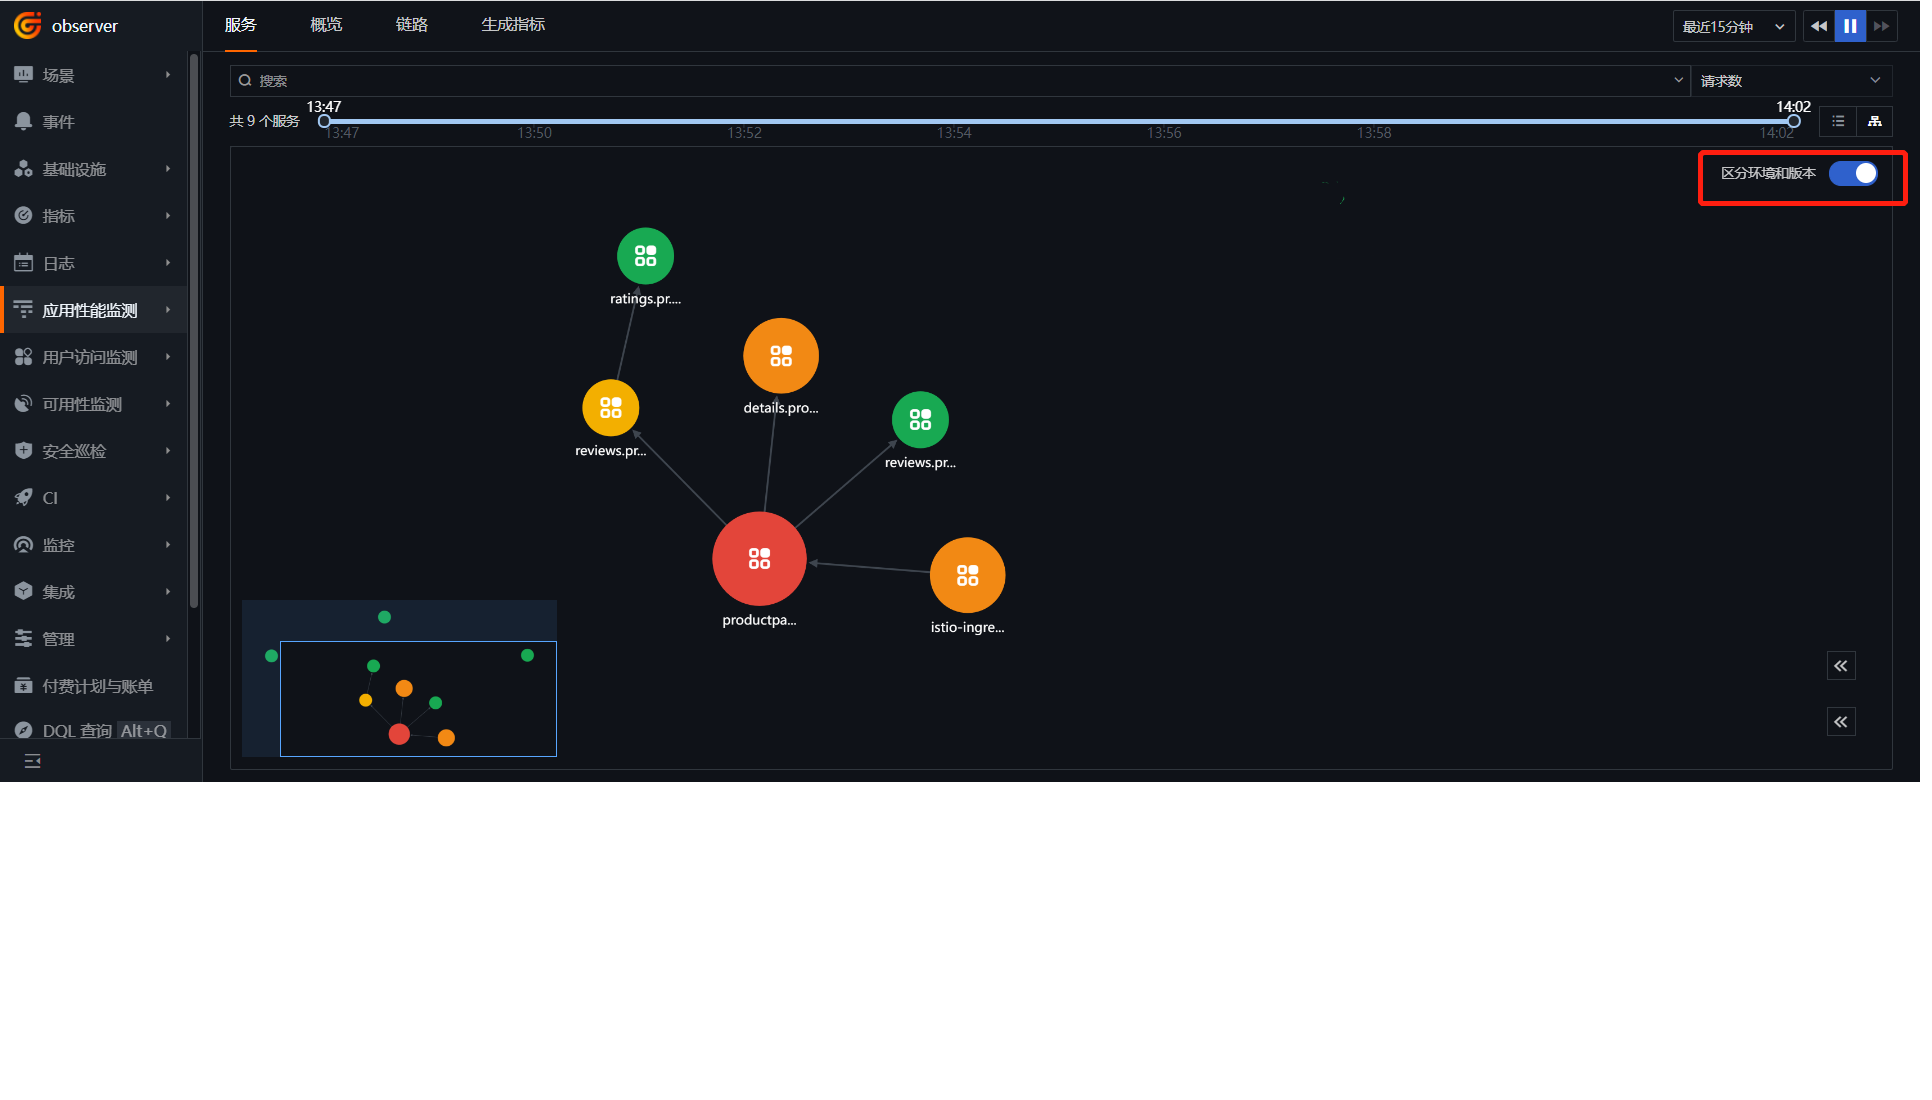
Enable Distinguish Environment and Version, and view the Bookinfo call topology.
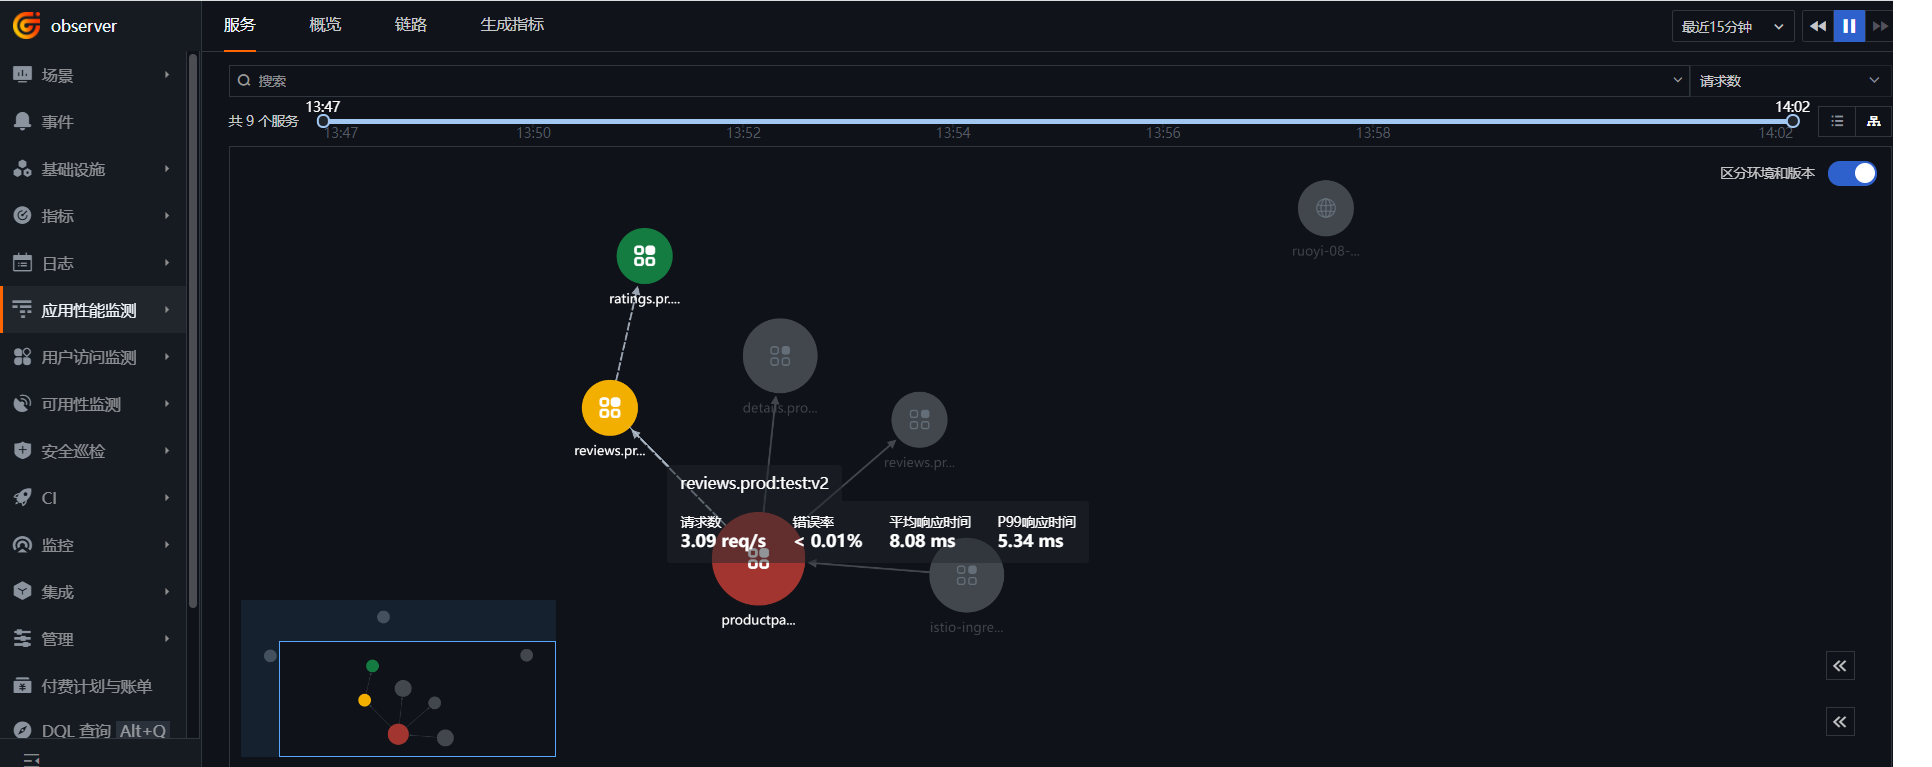
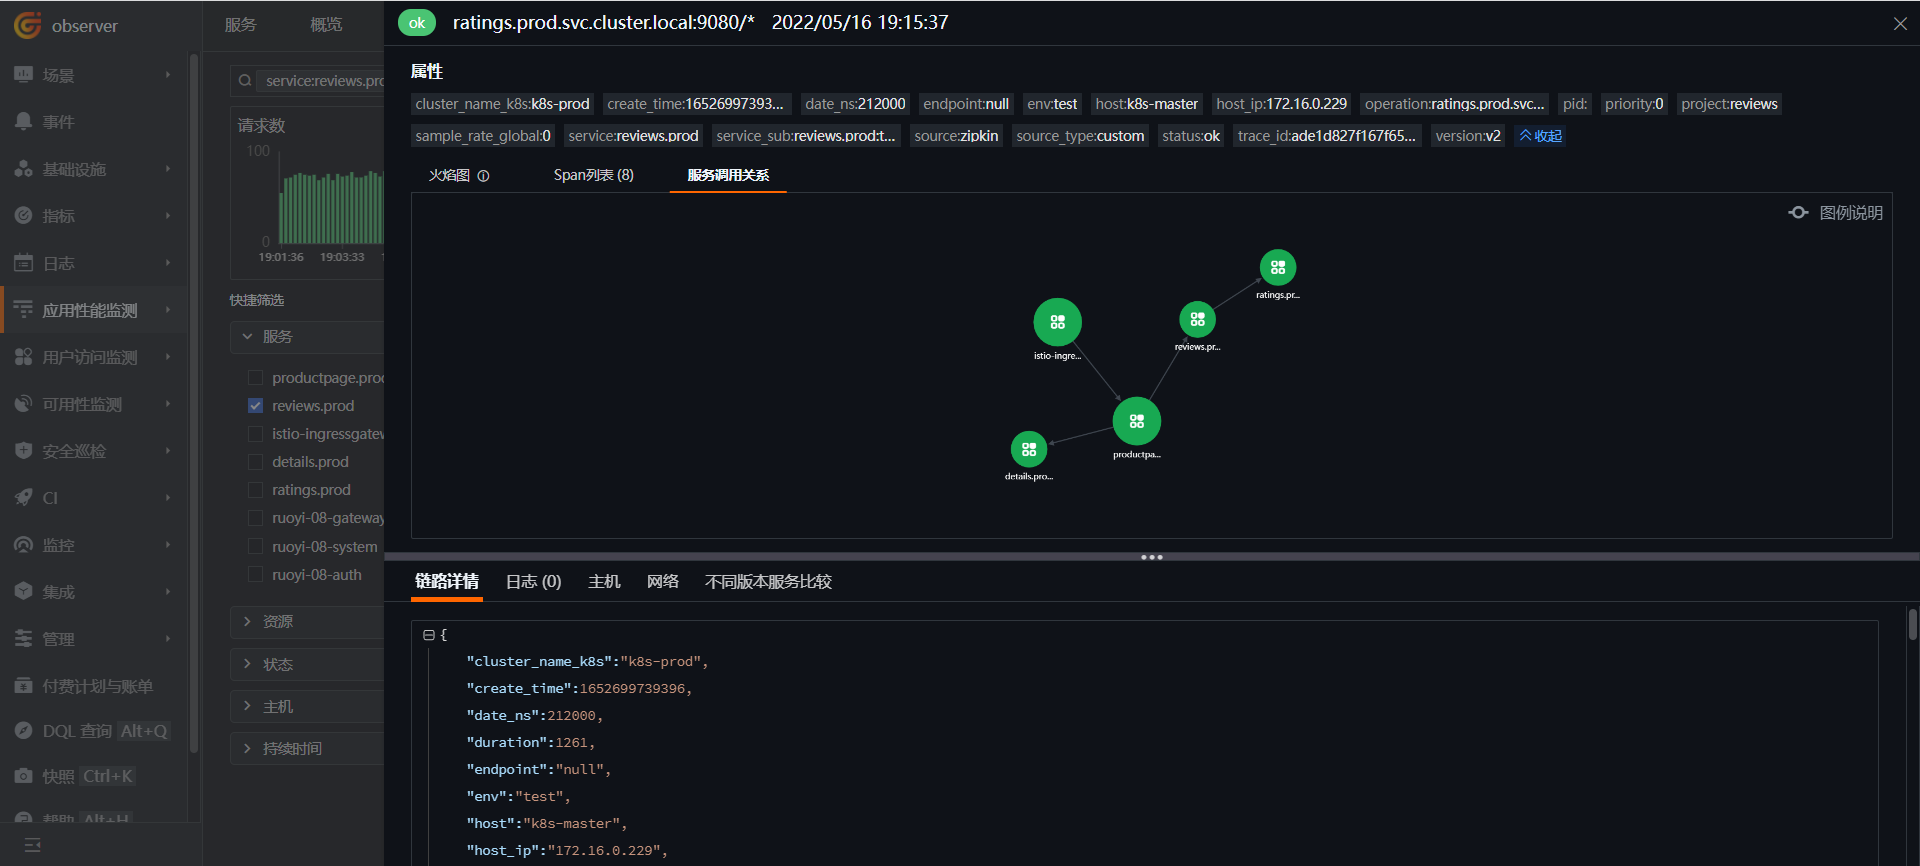
Hover over reviews-v2; you can see that v2 is calling ratings, while reviews-v1 does not call ratings.
Click Traces, select the reviews.prod service, and click into a trace with the v2 version.

View the flame graph.

View the Span list.
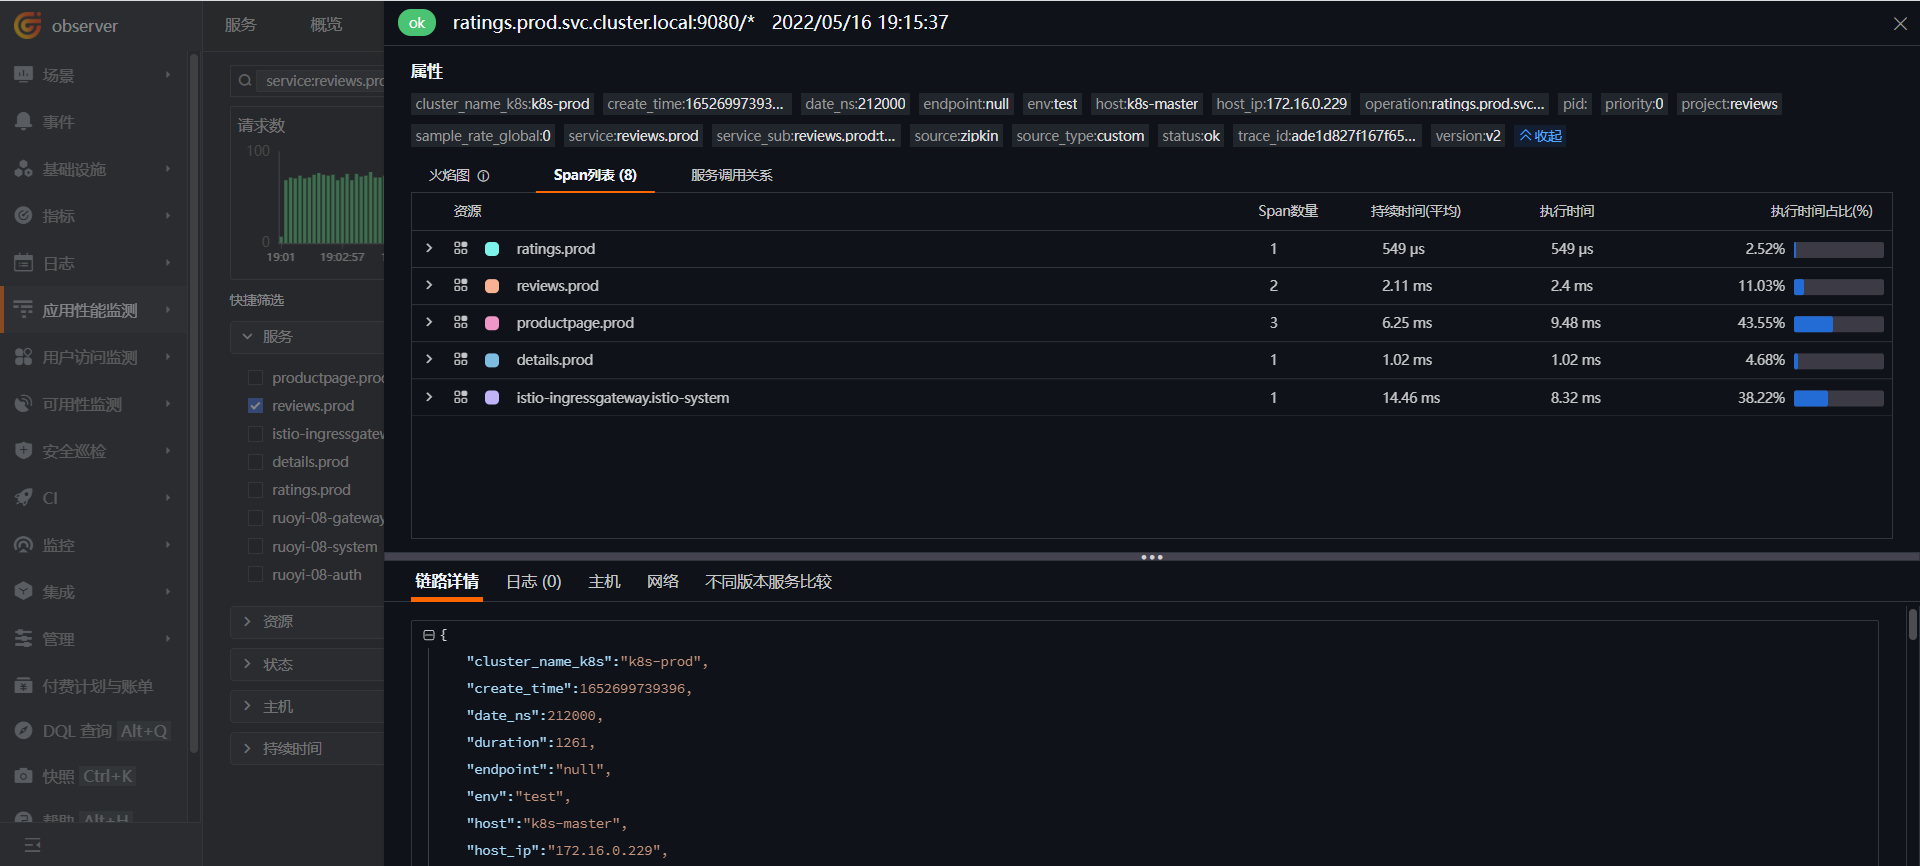
View the service call relationship.
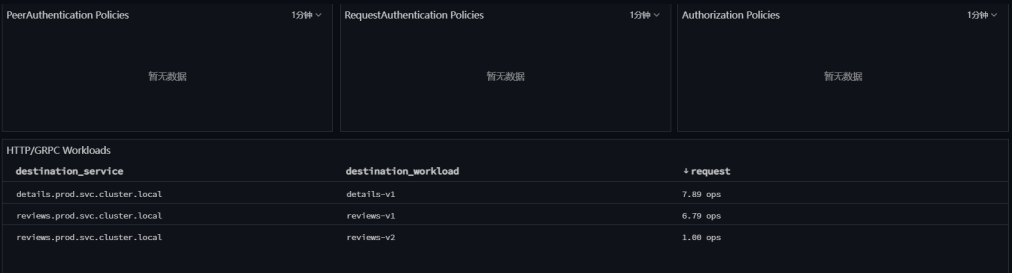
In the Istio Mesh dashboard, you can also see the service call status. The traffic ratio between v1 and v2 is approximately 9:1.
8.6 Complete the Release
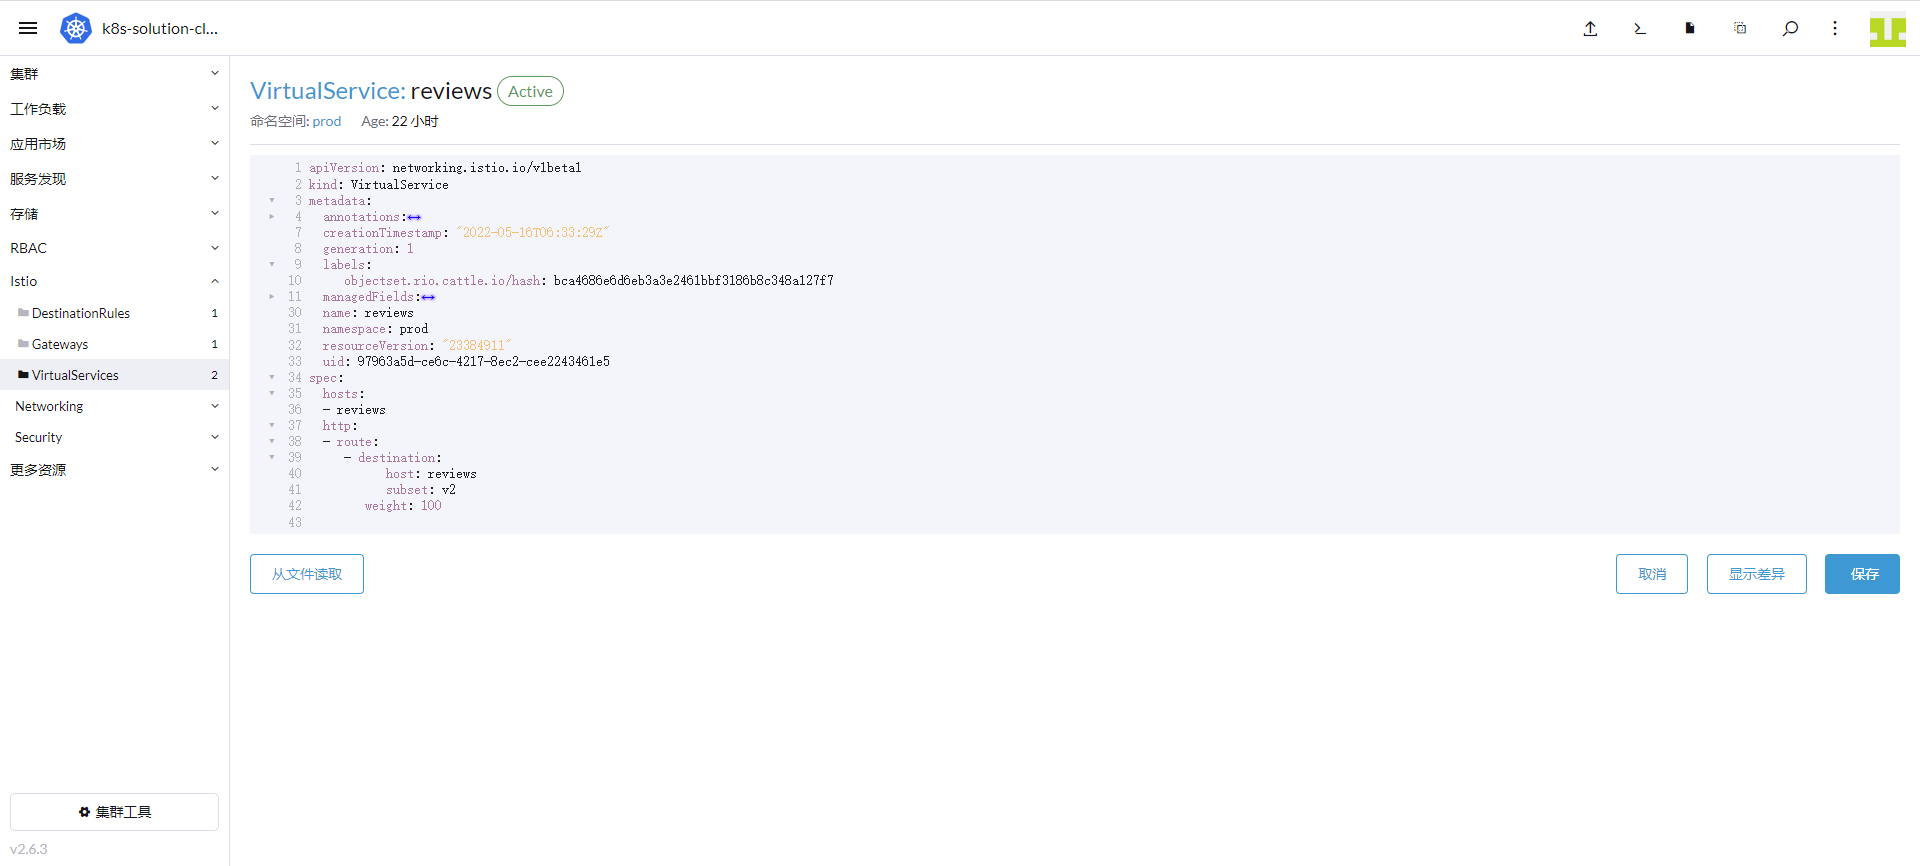
After operations in Guance, the release meets expectations. Go to Rancher → Cluster → Istio → VirtualServices, click Edit YAML on the right of reviews, set the weight of v2 to 100 and remove v1. Click Save.
Go to Cluster → Workloads → Deployments, find reviews-v1, and click Delete.