Rancher を使用した DataKit のデプロイと管理による Kubernetes エコシステムの可観測性の迅速な構築
概要
企業がある程度の規模になると、サーバー、Kubernetes 環境、マイクロサービスアプリケーションが増加します。これらのリソースを効率的に可観測化し、人件費やリソースコストを節約することは、企業が直面する課題です。Rancher アプリケーションストアの DataKit をワンクリックでデプロイすることで、Guance は Rancher が管理する K8s クラスターに対して、数多くのすぐに使える可観測機能を提供します。
このドキュメントでは、よく知られた service mesh マイクロサービスアーキテクチャである Bookinfo の例を用いて、Guance を使用して K8s、Istio、継続的インテグレーション、カナリアリリースなどのマイクロサービスのエンドツーエンドの可観測性をワンクリックで向上させる方法について詳しく説明します。
Guance は、クラウドネイティブ分野における可観測性のリーディングカンパニーです。1 つのプラットフォームを使用し、DataKit Agent をデプロイするだけで、ホスト、アプリケーションのメトリクス、トレース、ログを連携させることができます。ユーザーは Guance にログインするだけで、リアルタイムで K8s ランタイムとマイクロサービスアプリケーションの健全性状態を能動的に観測できます。
ユースケースの想定
ある企業が複数のクラウドサーバー、2 つの Kubernetes クラスター(本番環境とテスト環境)を保有していると想定します。テスト環境には 1 台の Master ノードと 2 台の Node ノードがあります。クラウドサーバー上には Harbor、Gitlab がデプロイされ、Kubernetes テスト環境には Istio プロジェクトの bookinfo がデプロイされています。
ここでは、Guance を使用して、ホスト、Kubernetes クラスター、Gitlab CI、カナリアリリース、RUM、APM、Istio などを可観測化します。
前提条件
- Kubernetes 1.18+ がインストールされていること。
- Rancher がインストールされ、Kubernetes クラスターを操作する権限があること。
- Gitlab がインストールされていること。
- Helm 3.0+ がインストールされていること。
- Harbor リポジトリまたはその他のイメージリポジトリがデプロイされていること。
操作手順
Warning
今回のサンプルで使用するバージョン情報は以下の通りです。DataKit 1.4.0、Kubernetes 1.22.6、Rancher 2.6.3、Gitlab 14.9.4、Istio 1.13.2。バージョンが異なる場合、構成に差異が生じる可能性があります。
手順 1: Rancher を使用した DataKit のインストール
管理を容易にするため、DataKit は datakit 名前空間にインストールします。
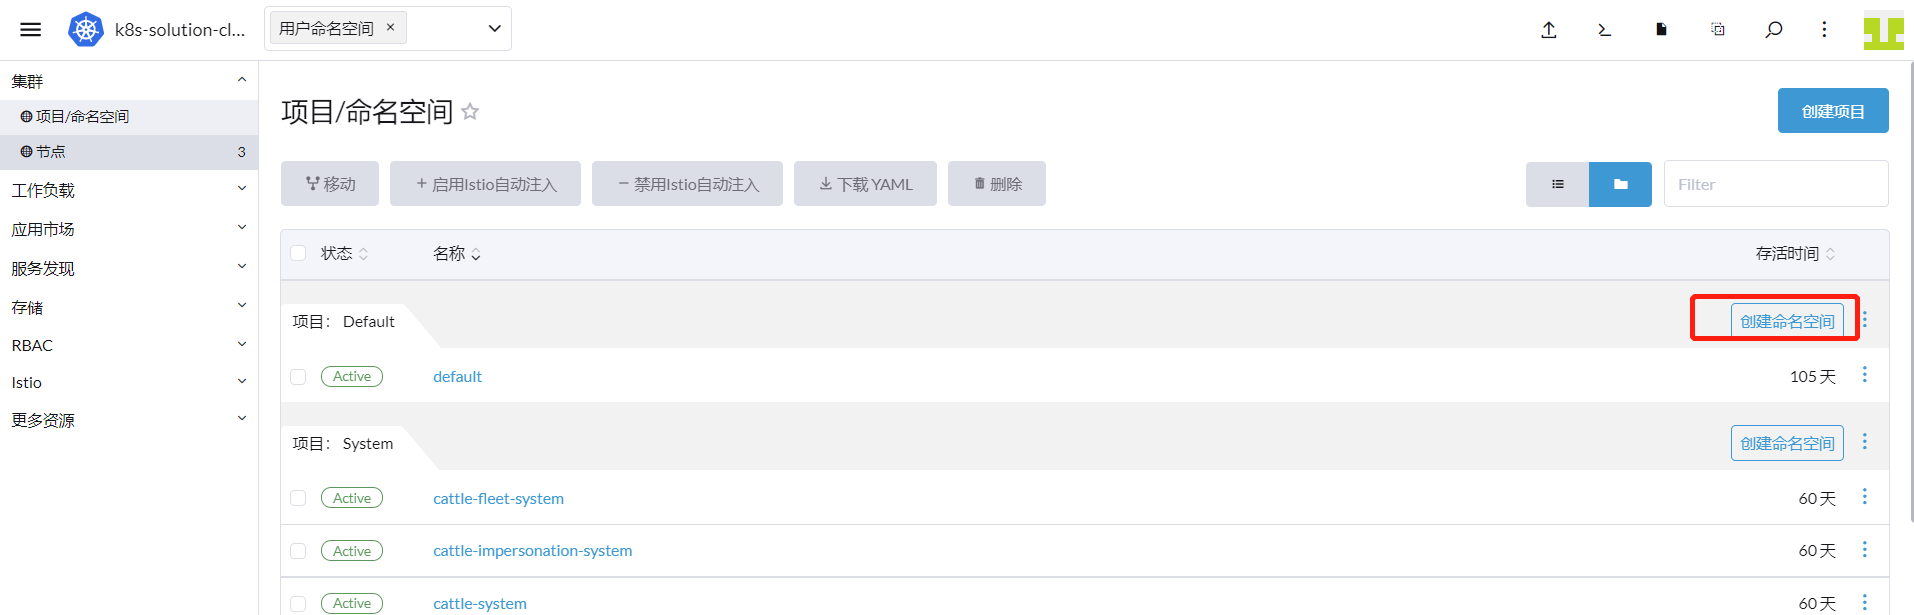
「Rancher」→「クラスター」→「プロジェクト/名前空間」にログインし、「名前空間の作成」をクリックします。
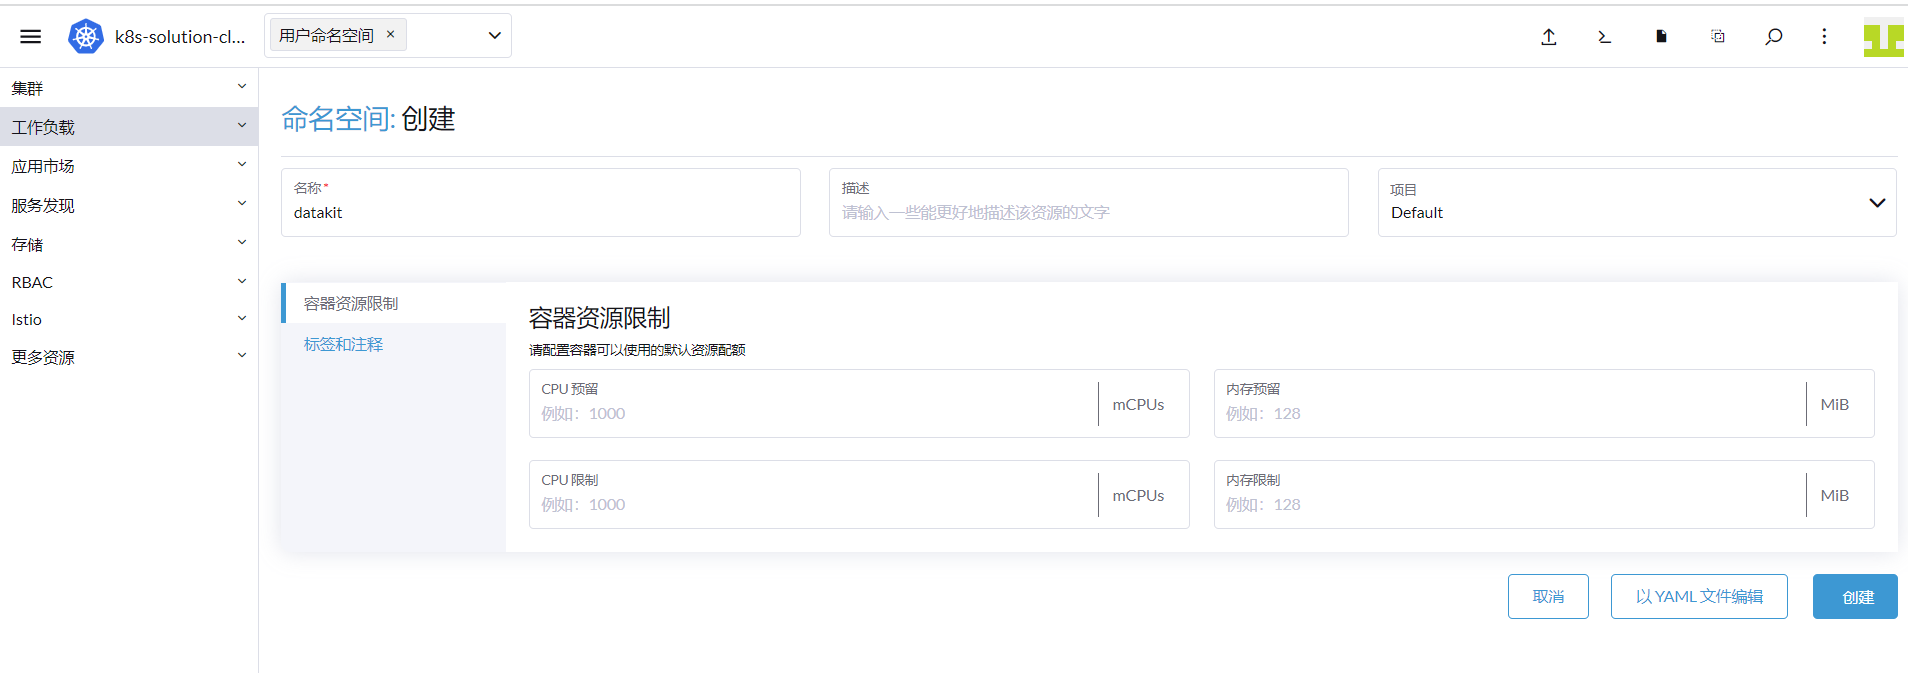
名前に「datakit」と入力し、「作成」をクリックします。
「クラスター」→「アプリケーションマーケット」→「Chart リポジトリ」に進み、「作成」をクリックします。
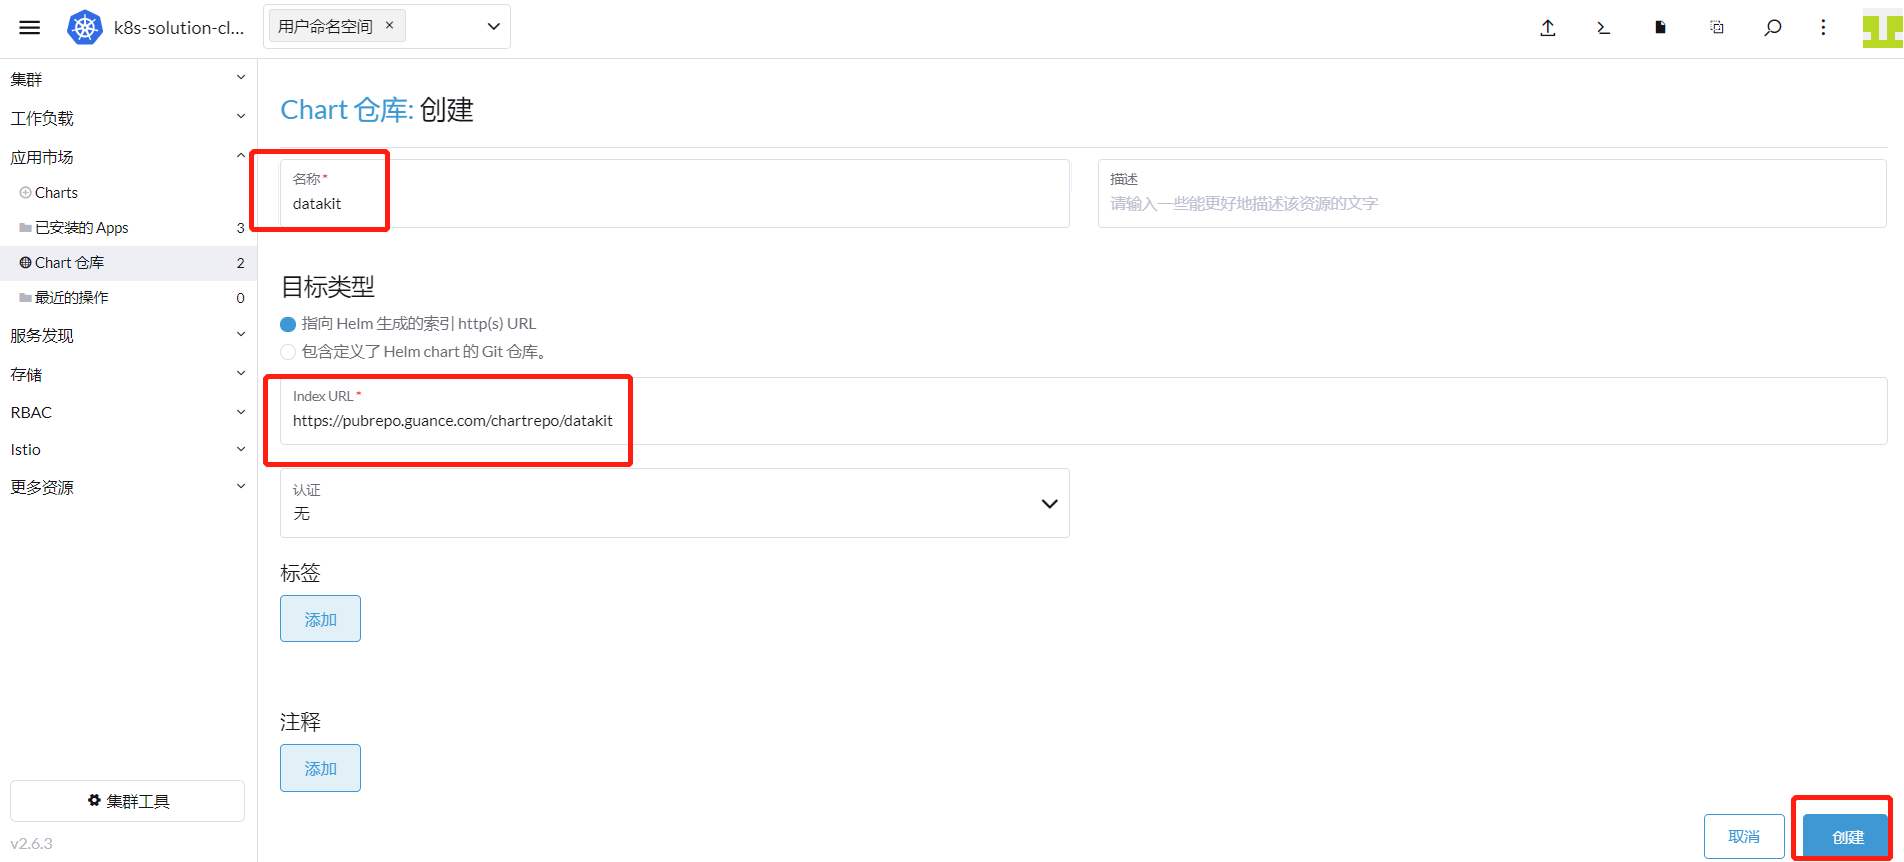
名前に「datakit」、URL に [https://pubrepo.guance.com/chartrepo/datakit](https://pubrepo.guance.com/chartrepo/datakit) を入力し、「作成」をクリックします。
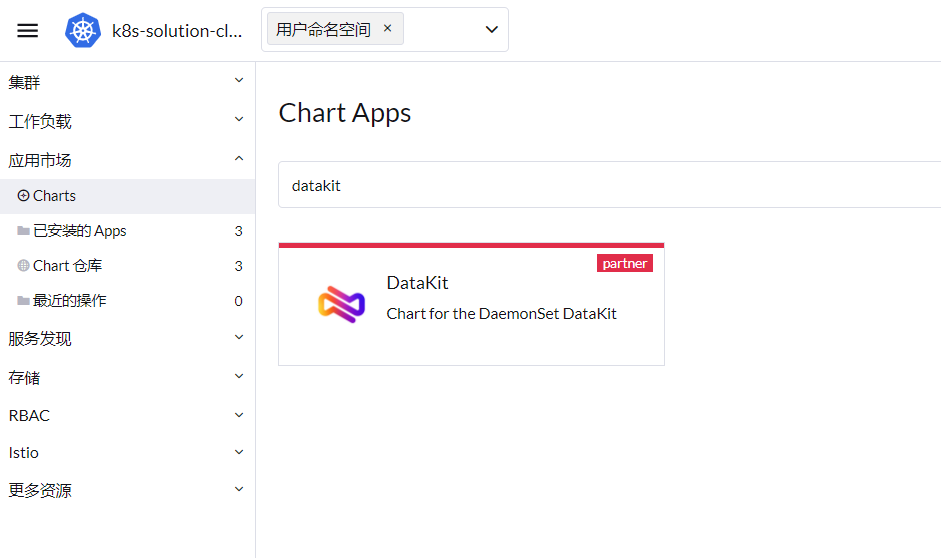
「クラスター」→「アプリケーションマーケット」→「Charts」に進み、「datakit」を選択します。下図のような DataKit が表示されたチャートが現れるので、クリックして進入します。
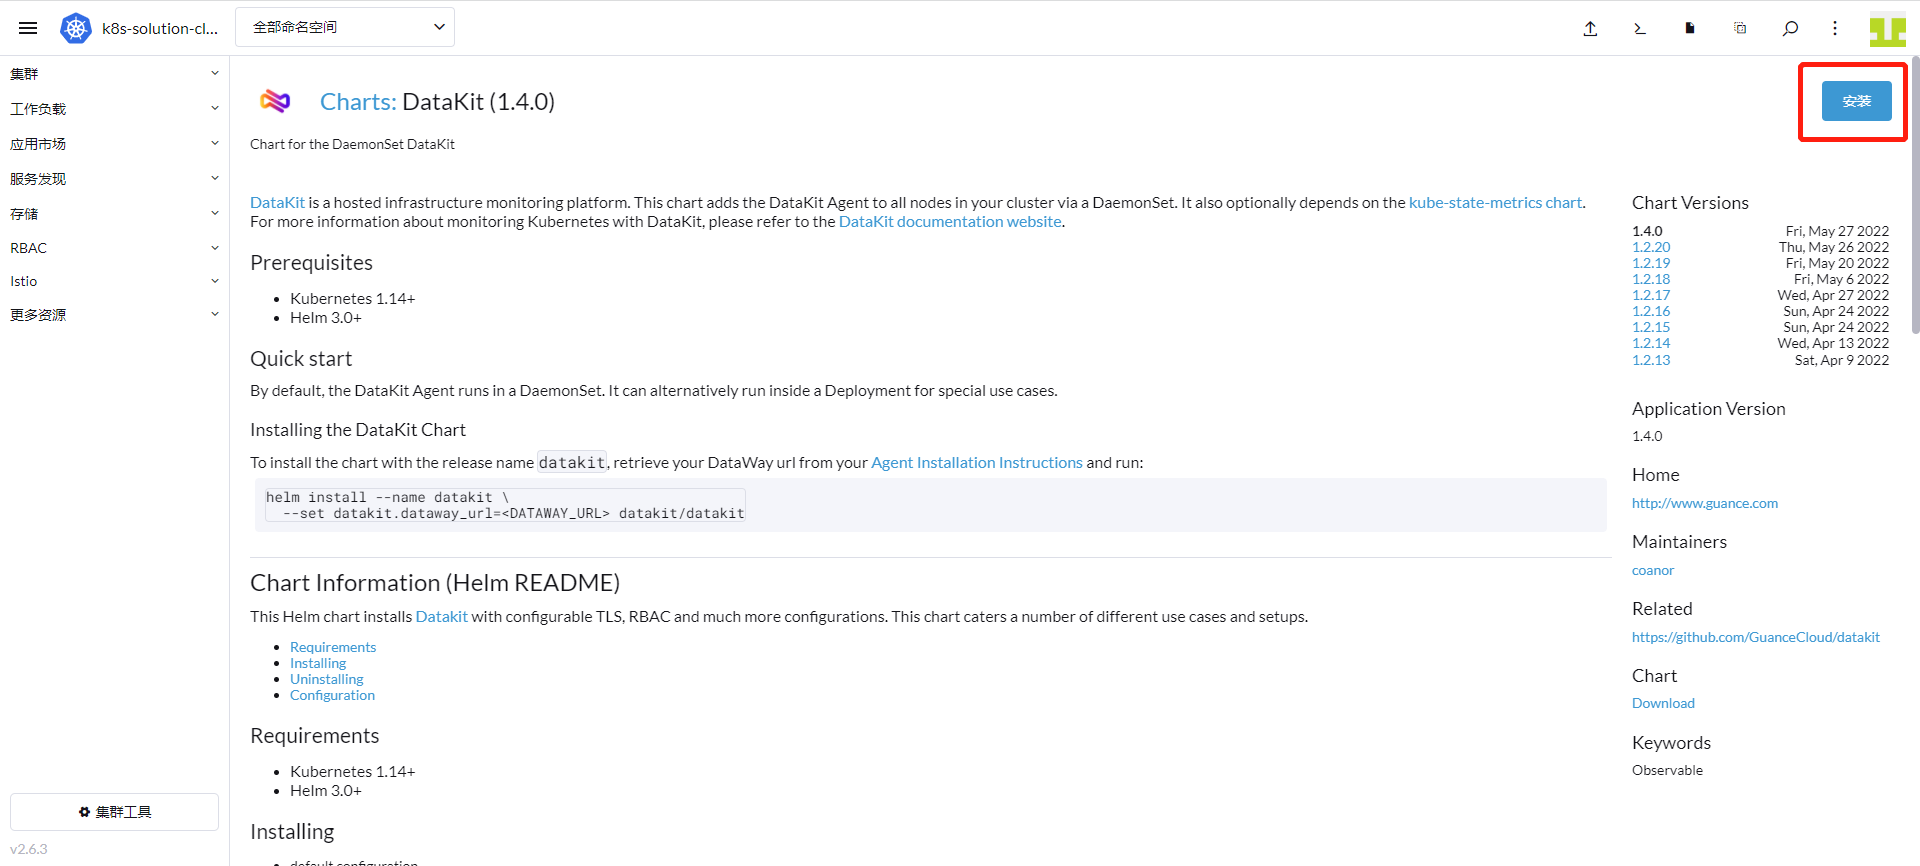
「インストール」をクリックします。
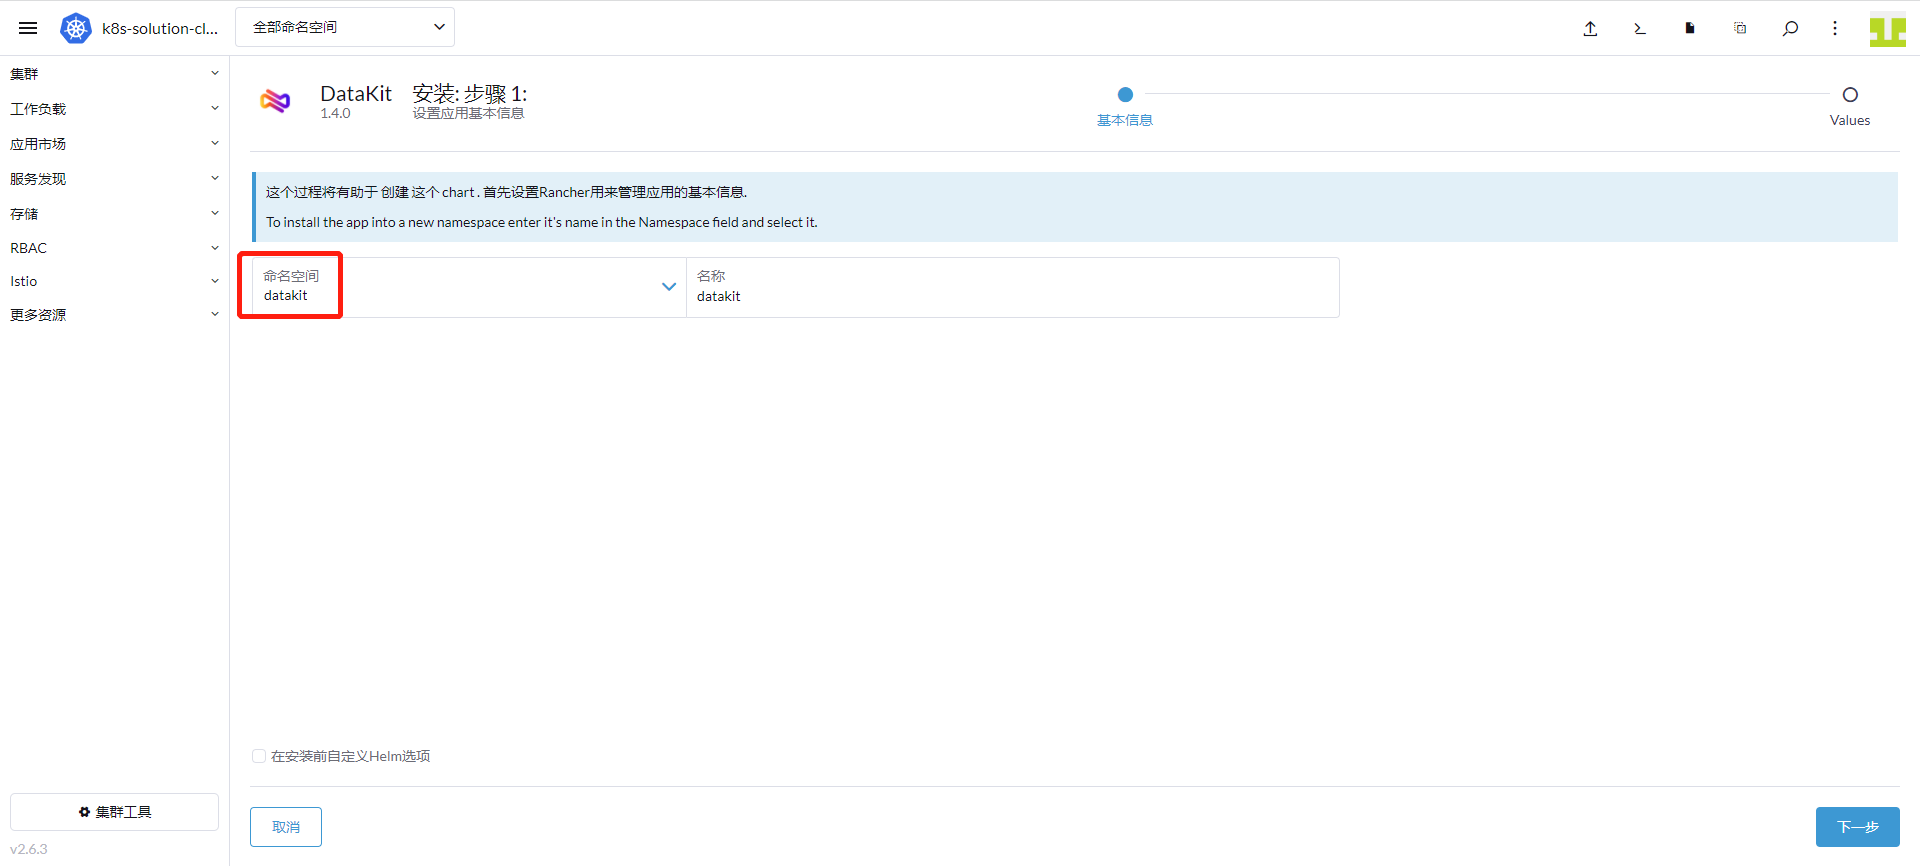
名前空間に「datakit」を選択し、「次へ」をクリックします。
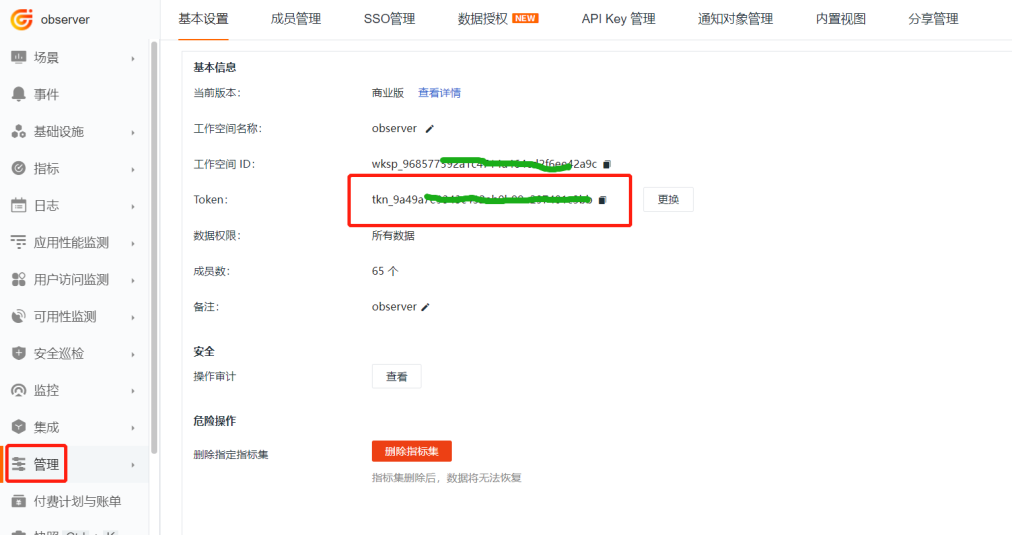
「Guance」にログインし、「管理」モジュールに進入します。下図の token を見つけ、横の「コピーアイコン」をクリックします。
Rancher の画面に切り替えます:
- 下図の token を、先ほどコピーした token に置き換えます。
- 「Enable The Default Inputs」に「ebpf コレクター」を追加します。つまり、最後に「
,ebpf」を追加します(カンマで区切ることに注意)。 - 「DataKit Global Tags」の最後に「
,cluster_name_k8s=k8s-prod」を追加します。(k8s-prod はクラスター名です。任意に定義可能で、クラスターから収集したメトリクスにグローバルタグとして設定されます。)
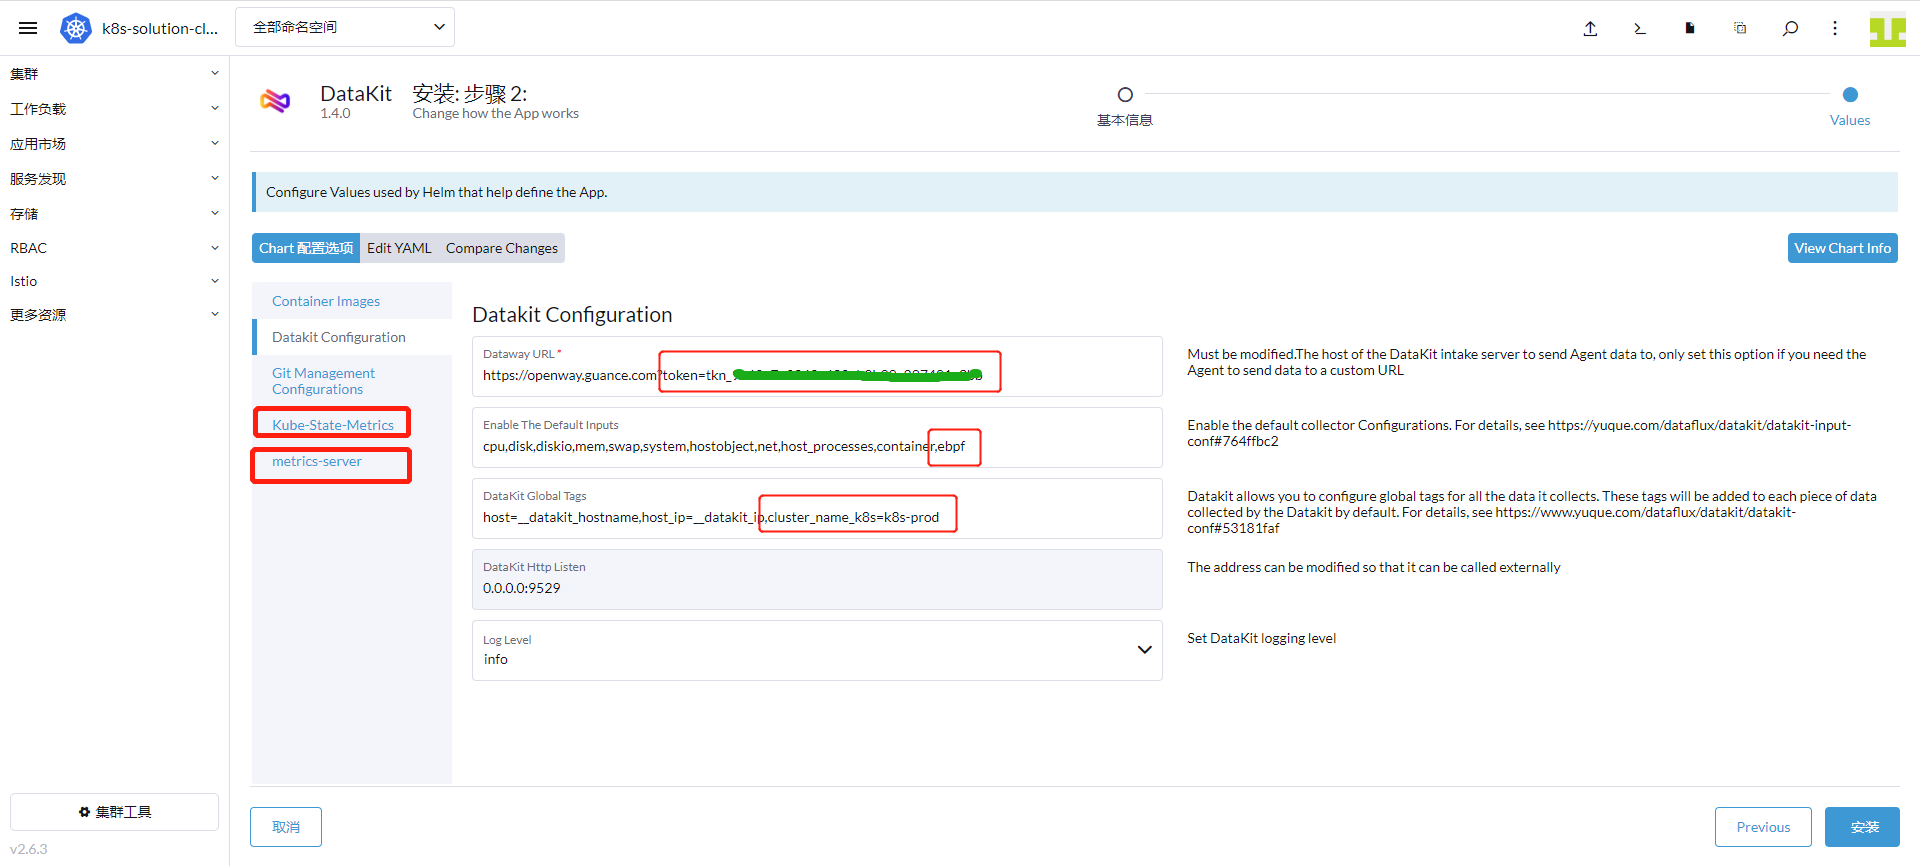
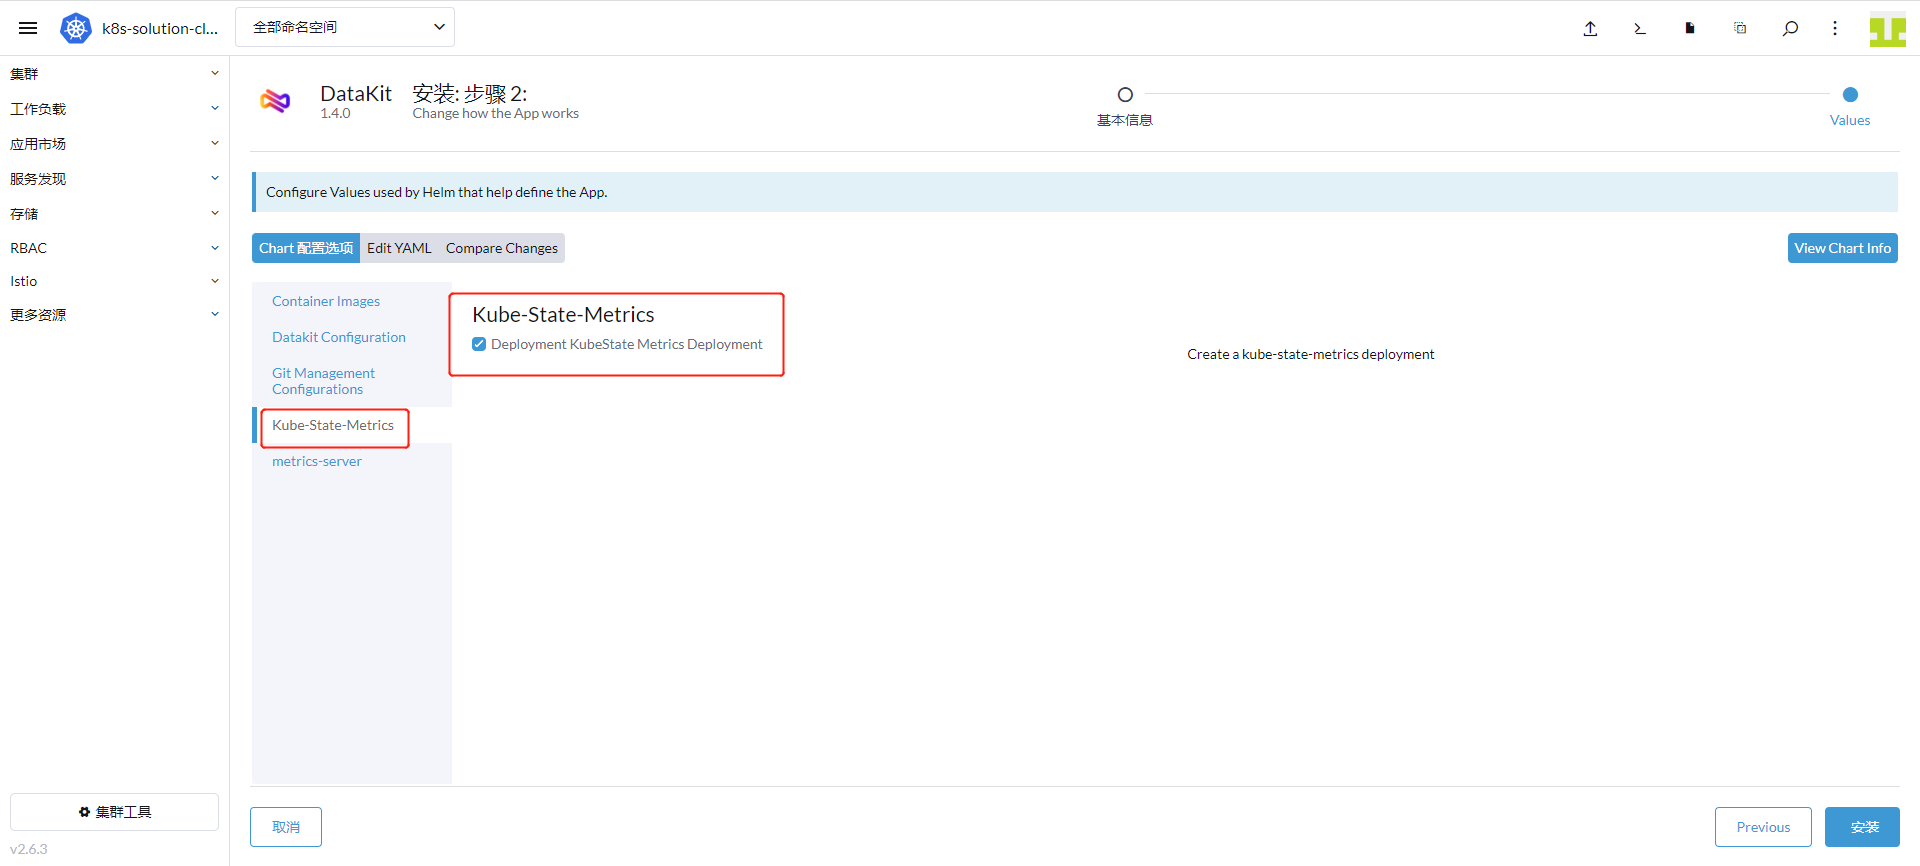
「Kube-State-Metrics」をクリックし、「インストール」を選択します。
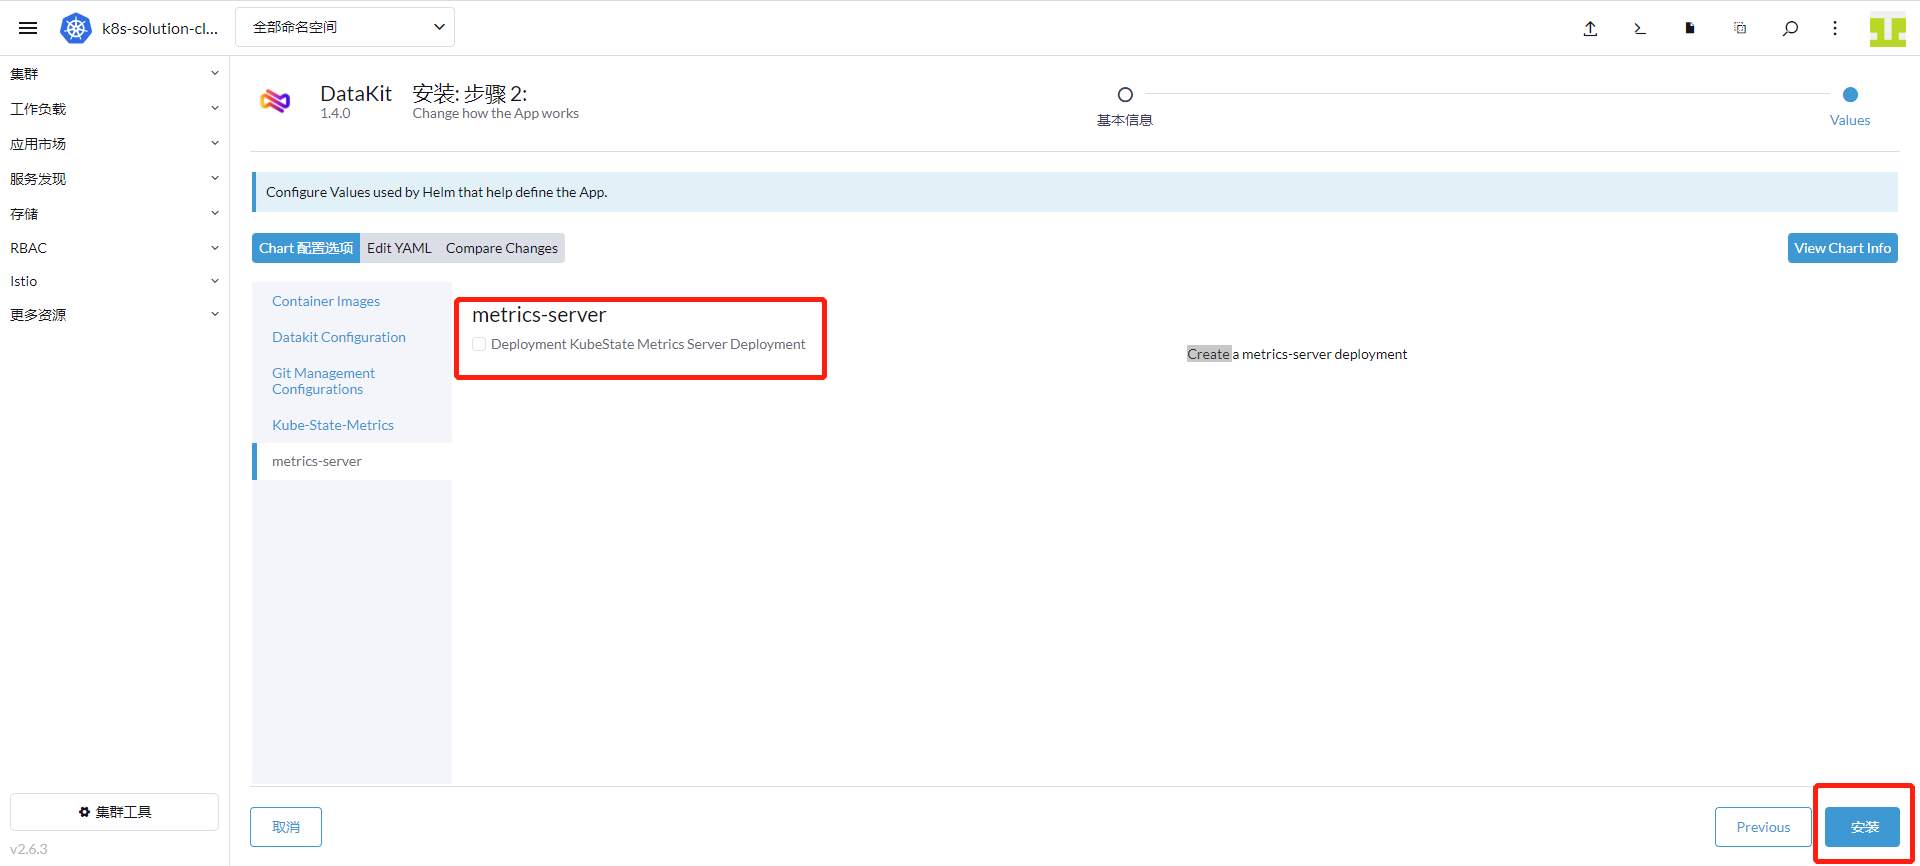
「metrics-server」をクリックし、「インストール」を選択して、下の「インストール」ボタンをクリックします。
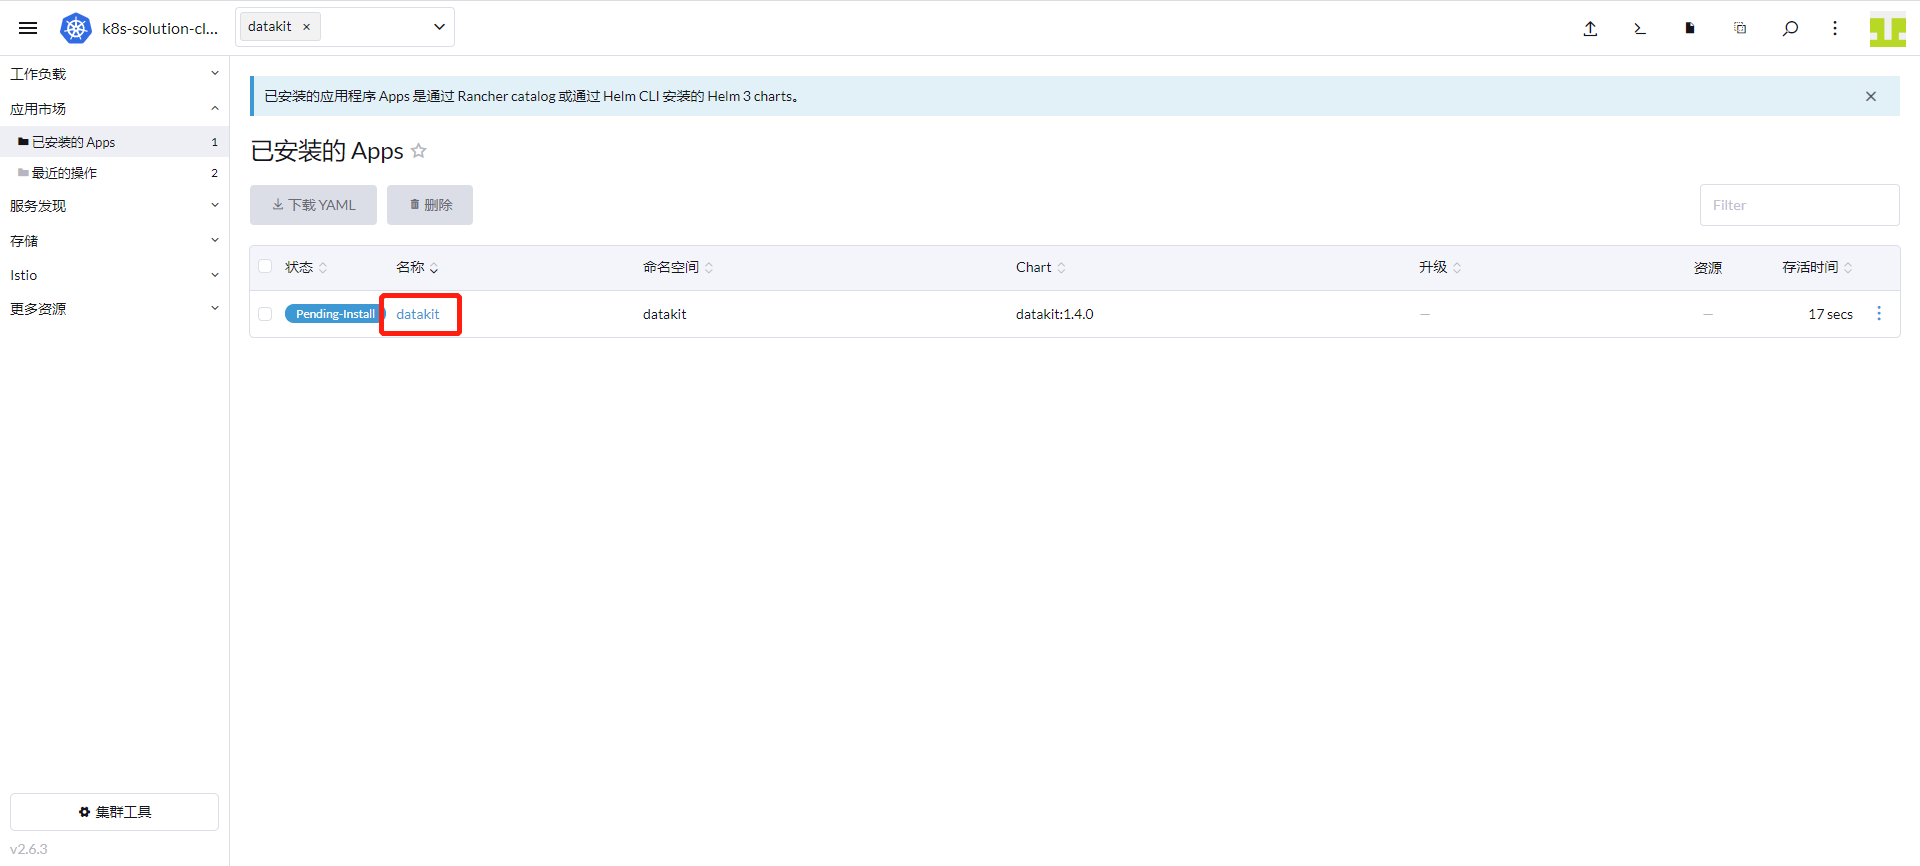
「クラスター」→「アプリケーションマーケット」→「インストール済みアプリ」に進むと、DataKit が正常にインストールされたことを確認できます。
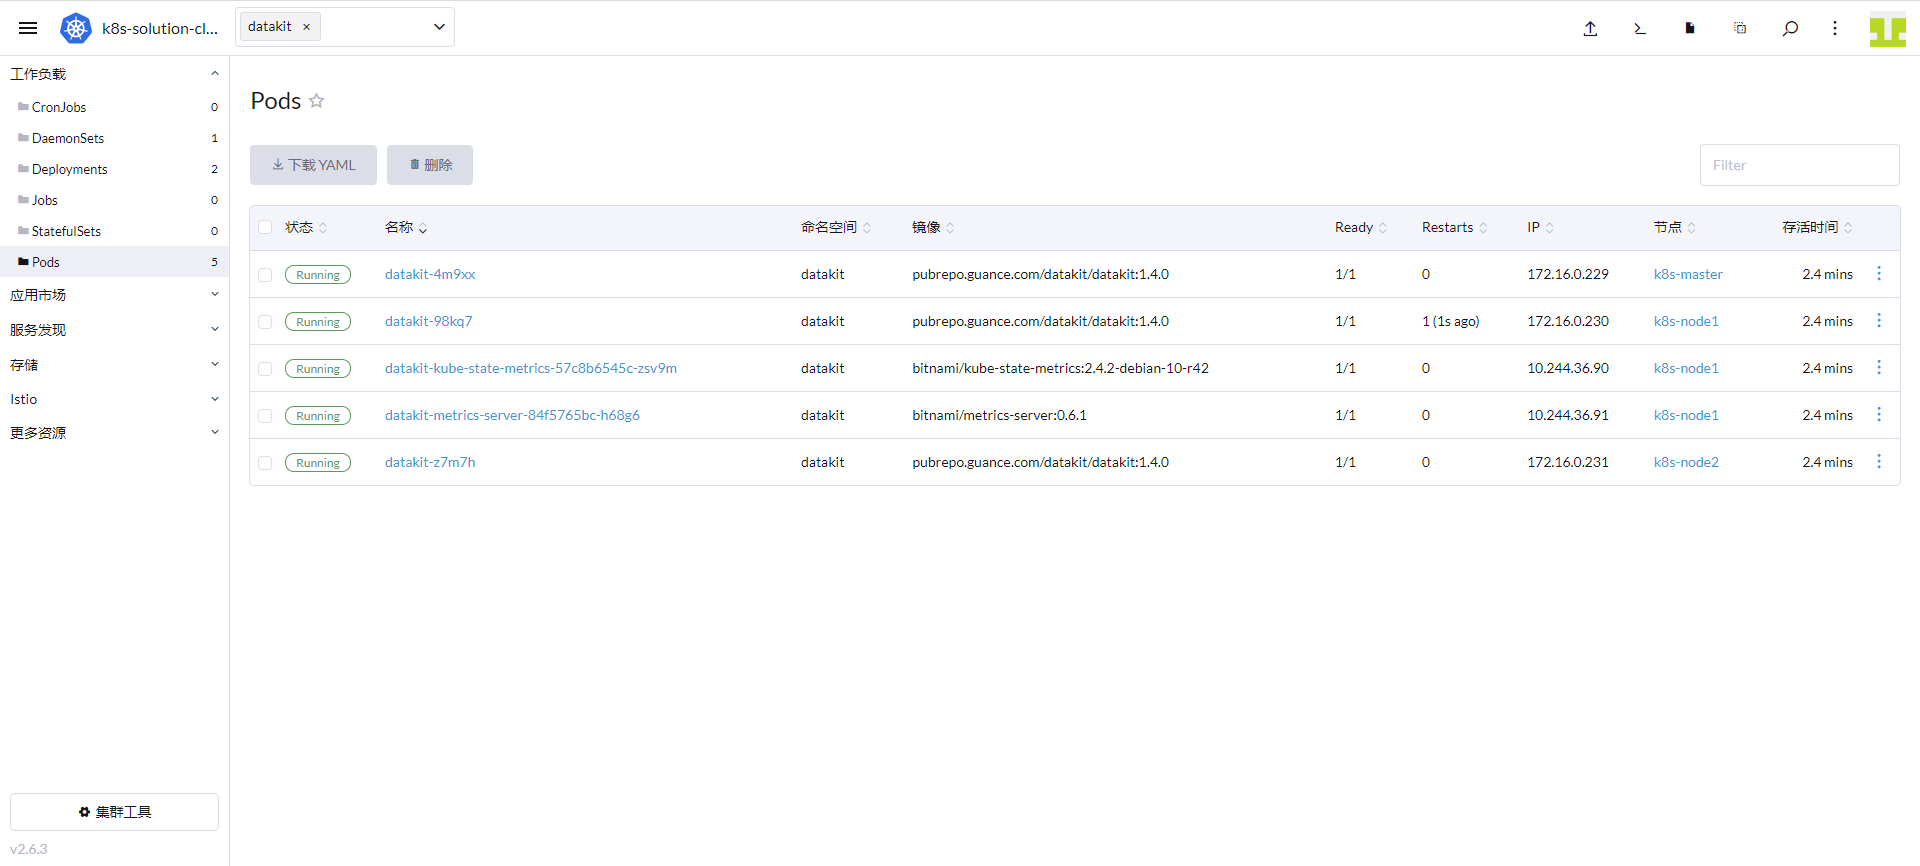
「クラスター」→「ワークロード」→「Pods」に進むと、datakit 名前空間で 3 つの Datakit、1 つの kube-state-metrics、1 つの metrics-server が実行されていることが確認できます。
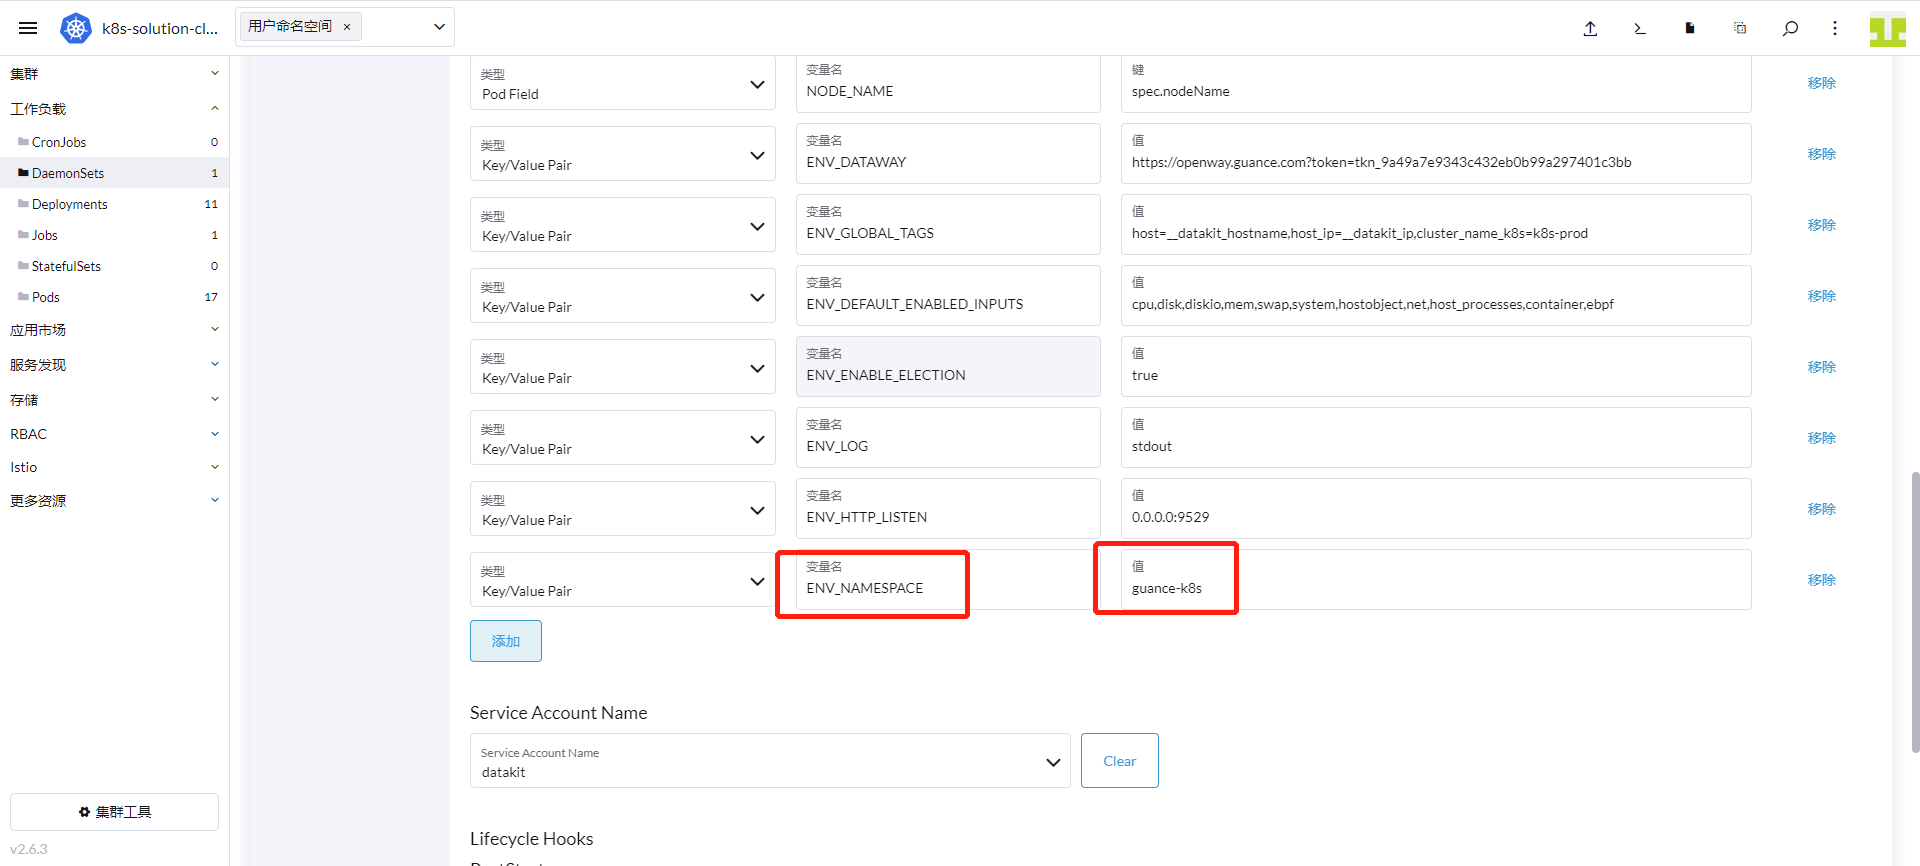
複数のクラスターがあるため、ENV_NAMESPACE 環境変数を追加する必要があります。この環境変数は異なるクラスターの選挙を区別するためのもので、複数のクラスターで値が同じであってはいけません。
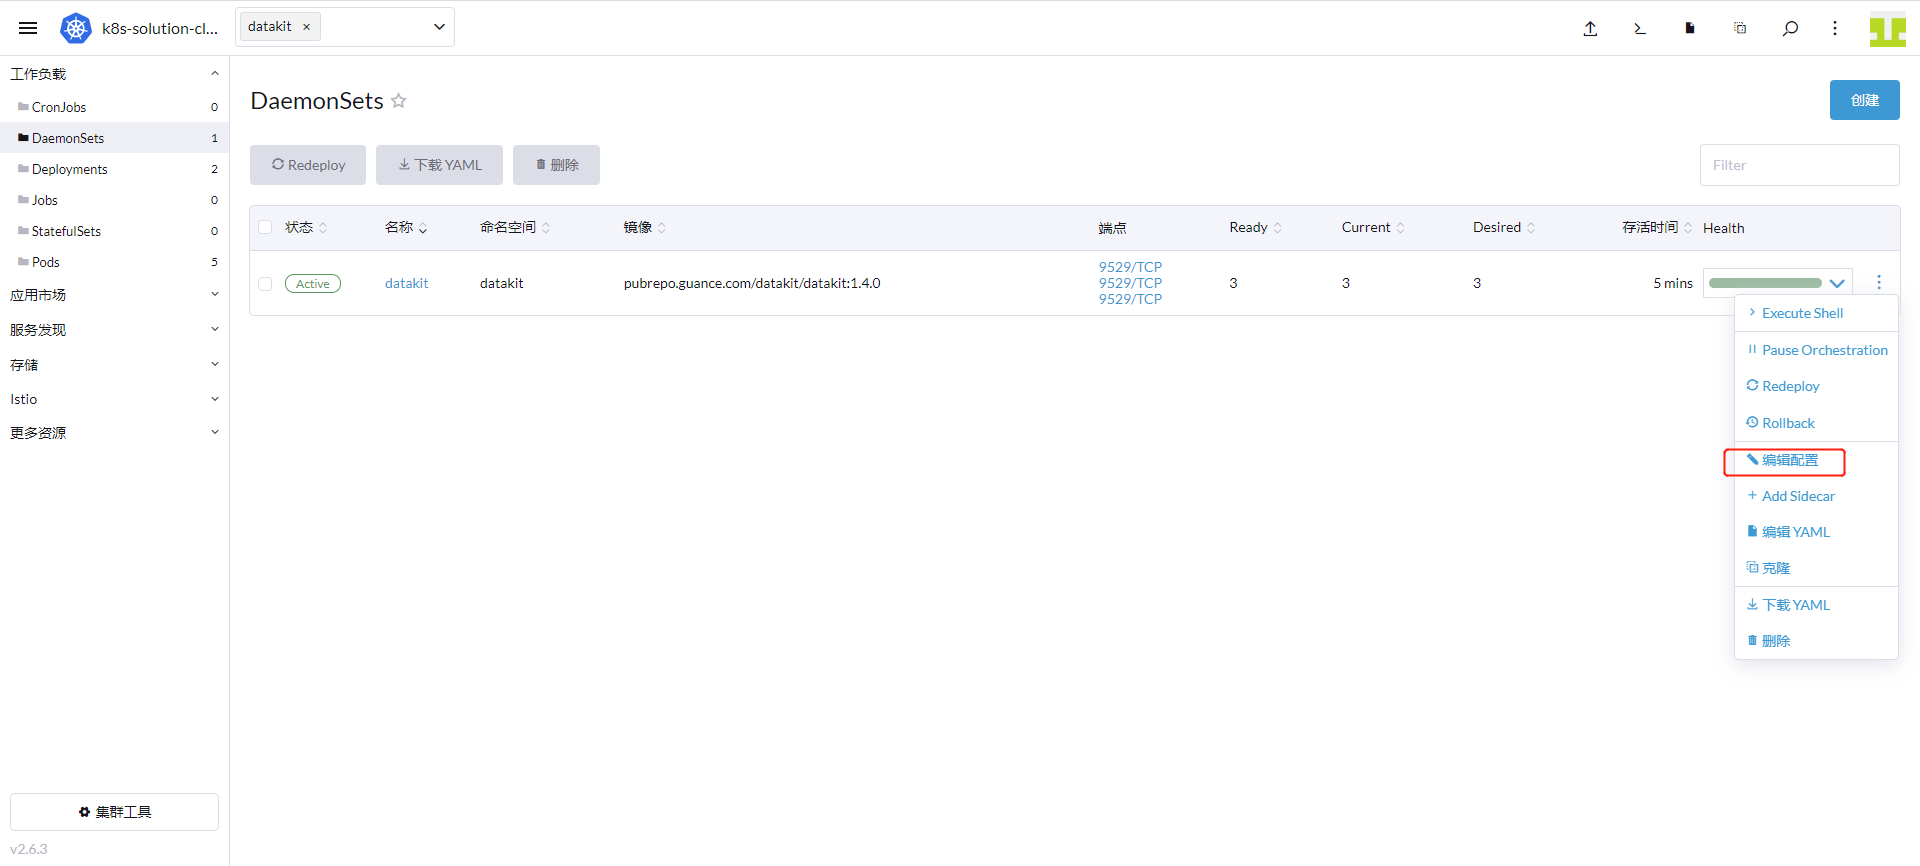
「クラスター」→「ワークロード」→「DaemonSets」に進み、datakit 行の右側にある「設定の編集」を選択します。
ここで変数名に ENV_NAMESPACE、値に guance-k8s を入力し、「保存」をクリックします。
手順 2: Kubernetes の可観測性の有効化
2.1 ebpf の可観測性
- コレクターの有効化
DataKit のデプロイ時に、ebpf コレクターは既に有効化されています。
- ebpf ビュー
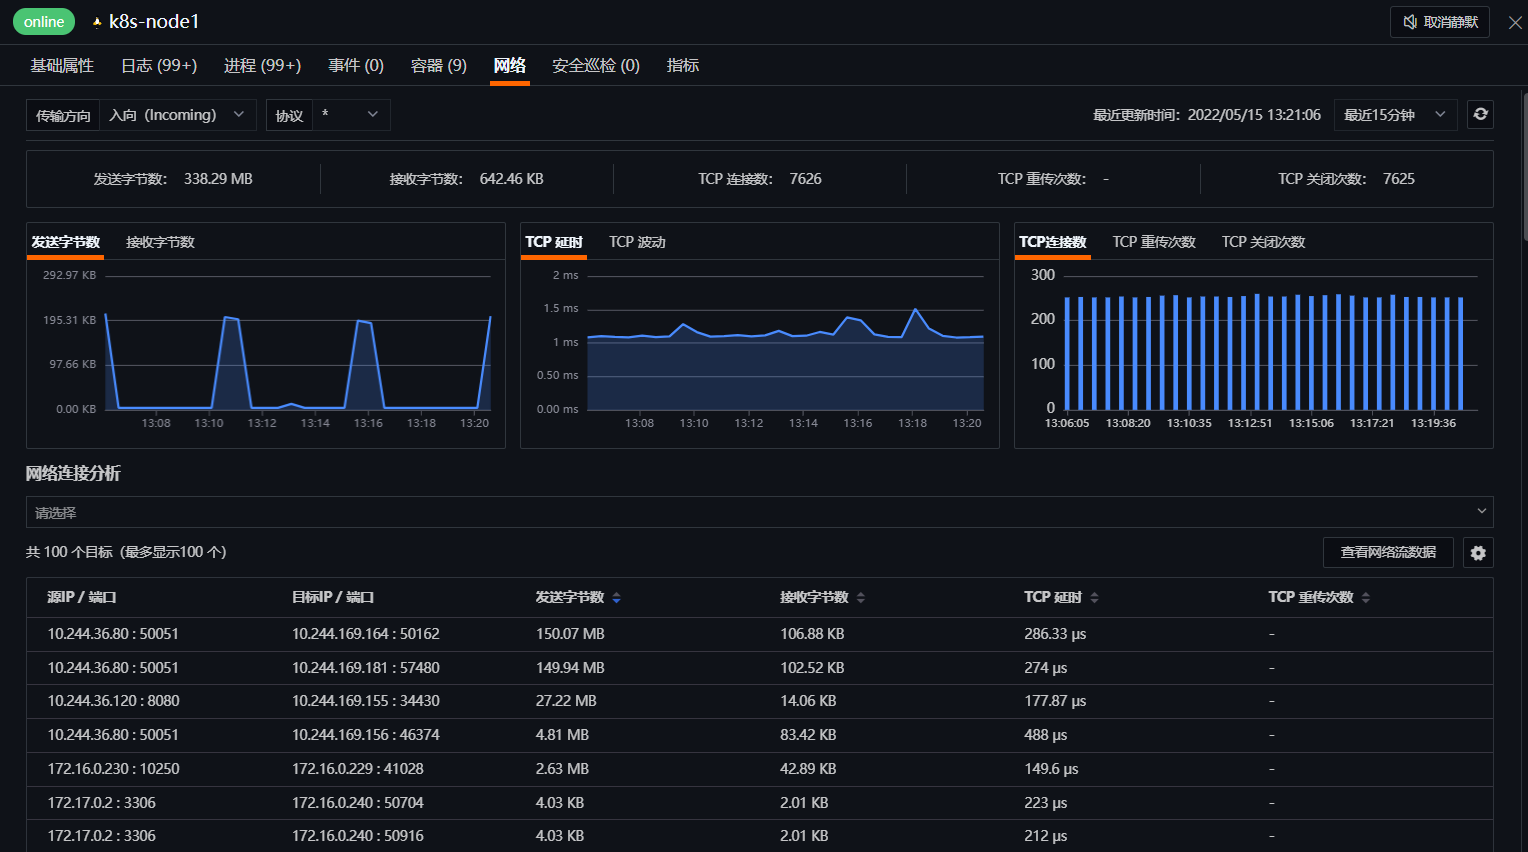
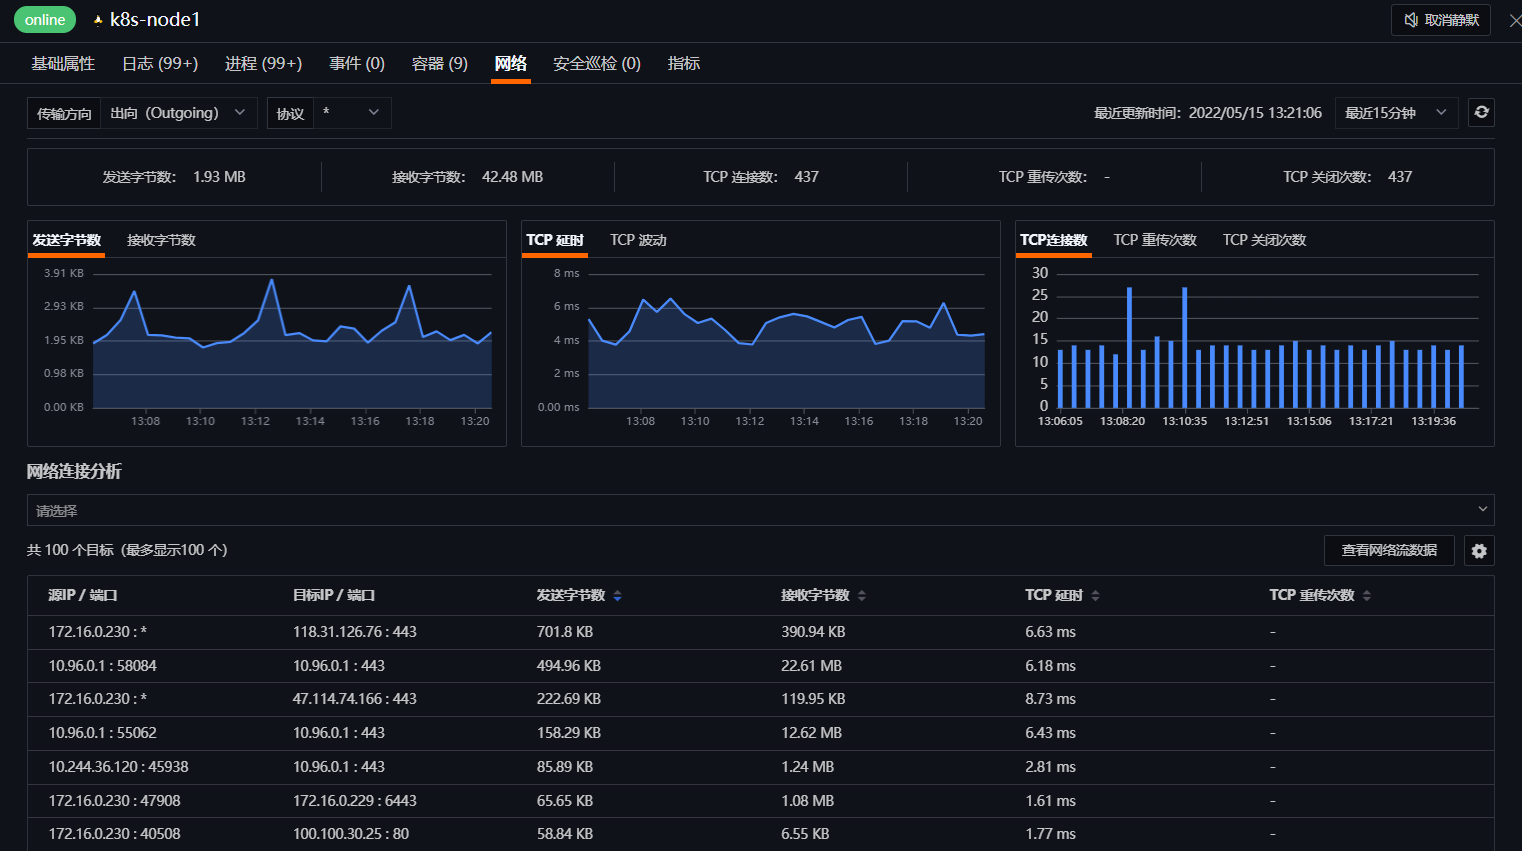
「Guance」にログインし、「インフラストラクチャ」に進み、「k8s-node1」をクリックします。
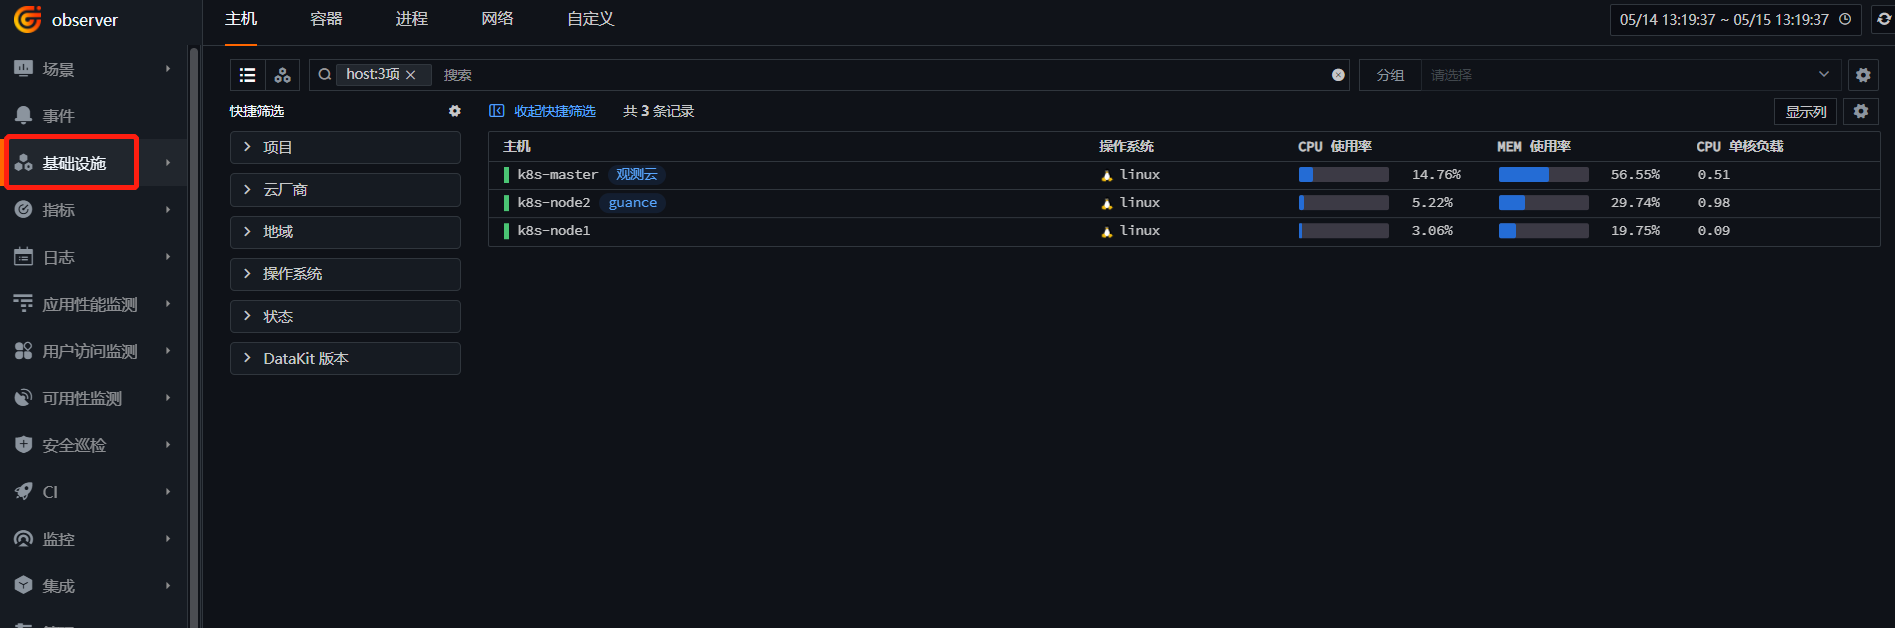
「ネットワーク」をクリックし、ebpf のモニタリングビューを確認します。
2.2 コンテナの可観測性
- コレクターの有効化
DataKit はデフォルトで Container コレクターを有効にしています。ここでは、カスタムコレクターの設定について説明します。
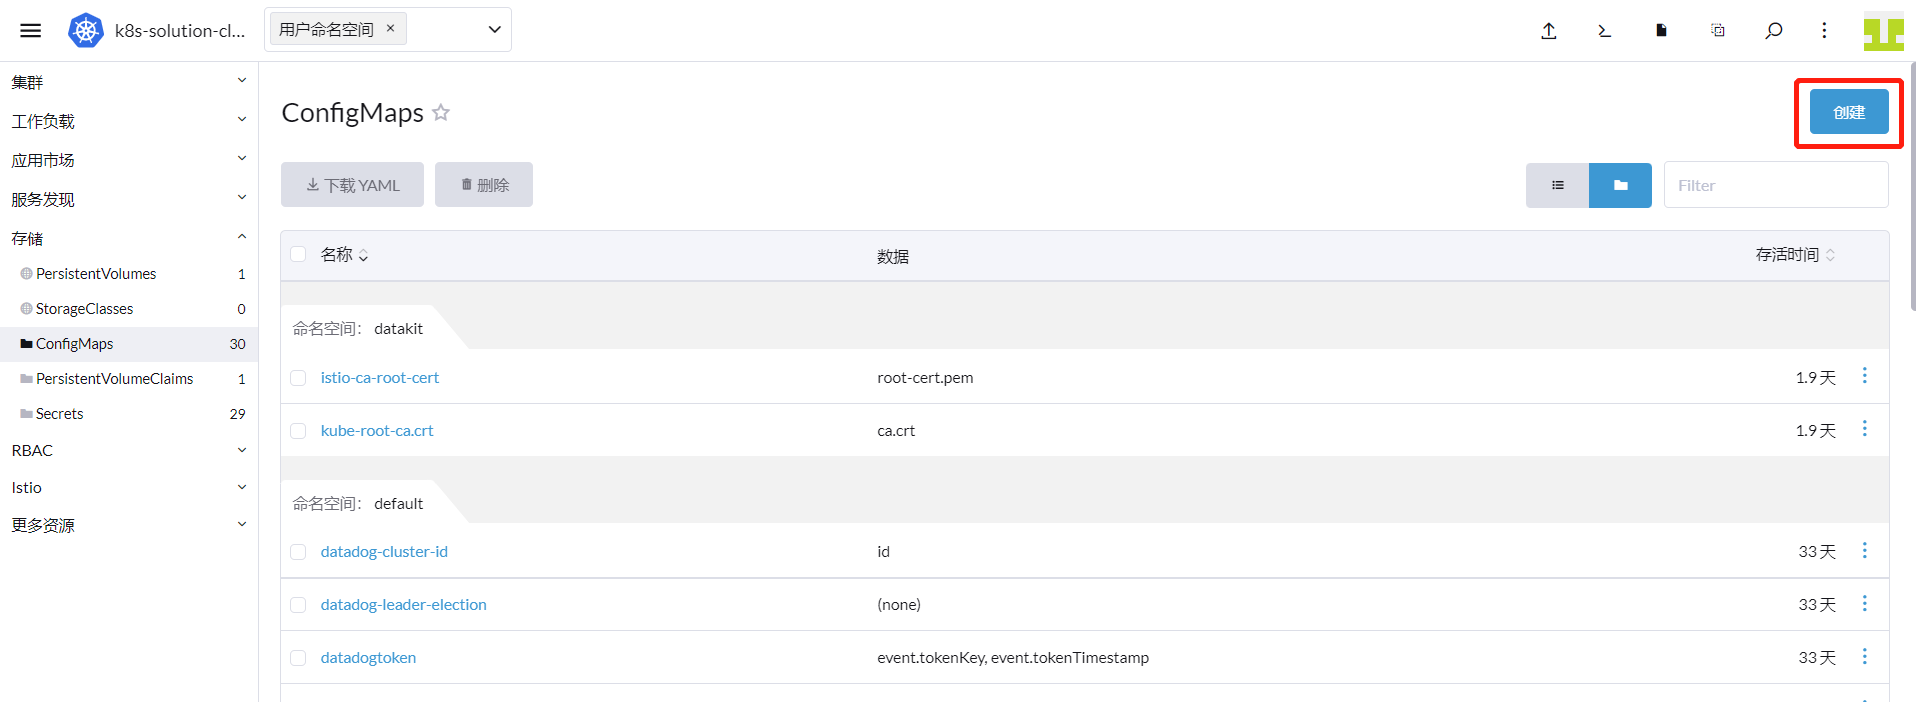
「Rancher」にログインし、「クラスター」→「ストレージ」→「ConfigMaps」に進み、「作成」をクリックします。
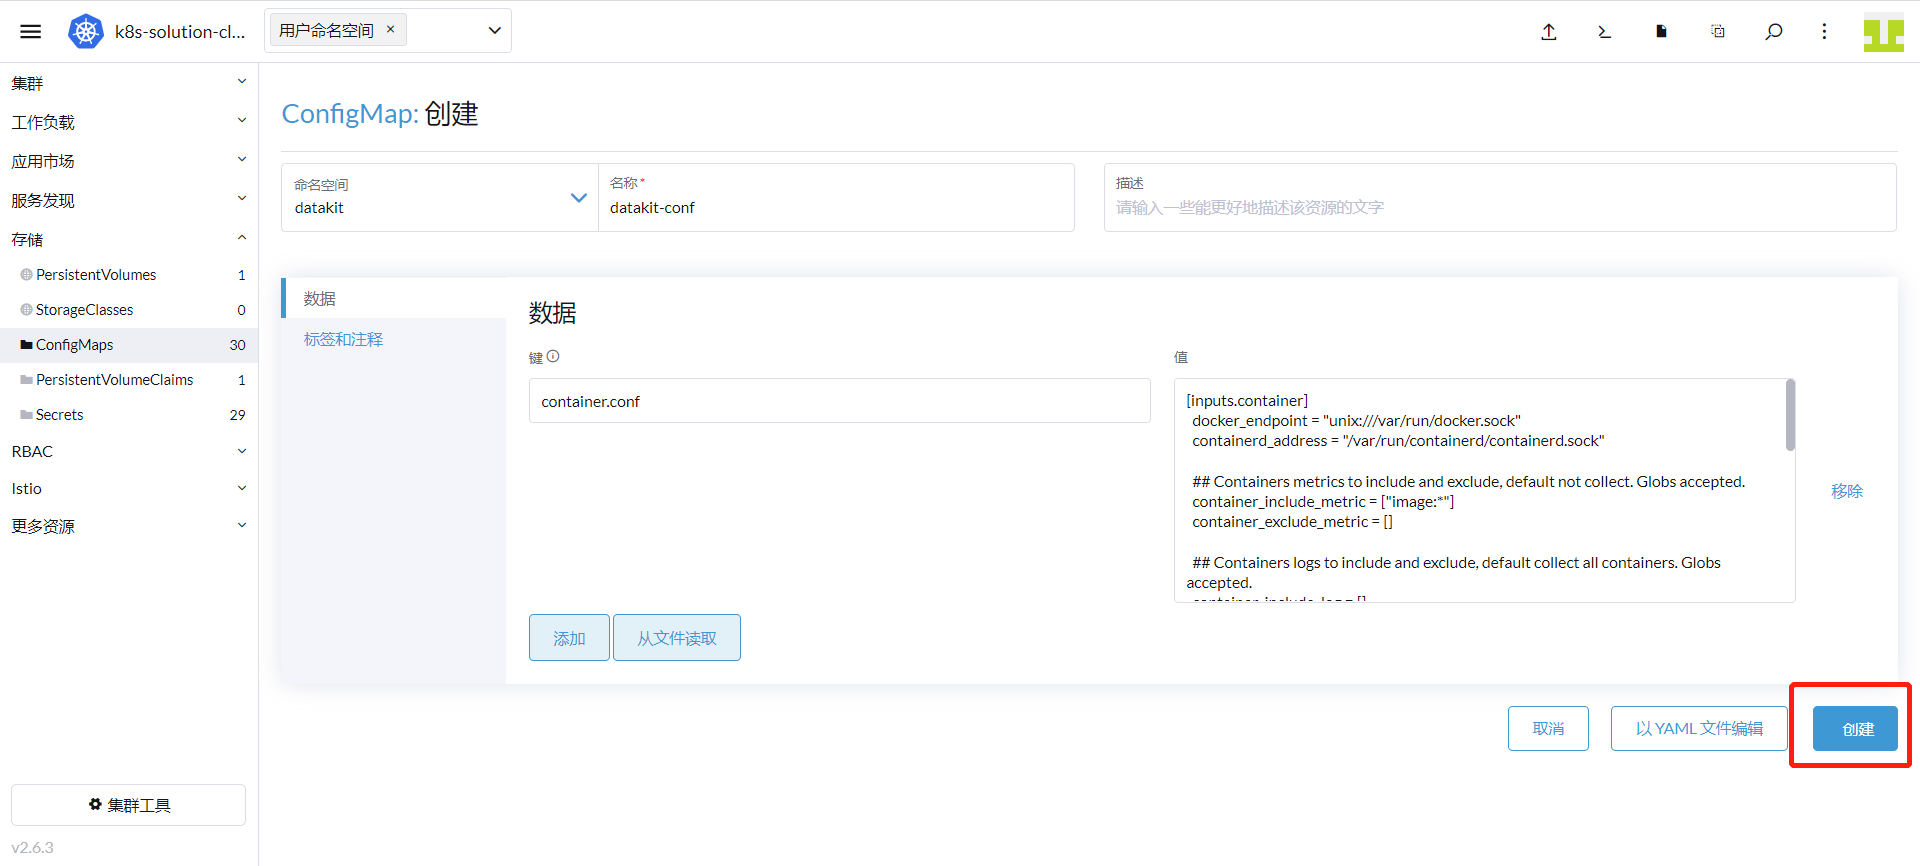
名前空間に「datakit」、名前に「datakit-conf」、キーに「container.conf」、値に以下の内容を入力します。
注意: 本番環境では、
container_include_log = []およびcontainer_exclude_log = ["image:*"]を設定することを推奨します。その後、ログを収集する必要がある Pod に annotations を追加して、指定したコンテナのログを収集します。
      [inputs.container]
        docker_endpoint = "unix:///var/run/docker.sock"
        containerd_address = "/var/run/containerd/containerd.sock"

        enable_container_metric = true
        enable_k8s_metric = true
        enable_pod_metric = true

        ## Containers logs to include and exclude, default collect all containers. Globs accepted.
        container_include_log = []
        container_exclude_log = ["image:pubrepo.guance.com/datakit/logfwd*", "image:pubrepo.guance.com/datakit/datakit*"]

        exclude_pause_container = true

        ## Removes ANSI escape codes from text strings
        logging_remove_ansi_escape_codes = false

        kubernetes_url = "https://kubernetes.default:443"

        ## Authorization level:
        ##   bearer_token  - bearer_token_string  - TLS
        ## Use bearer token for authorization. ('bearer_token' takes priority)
        ## linux at:   /run/secrets/kubernetes.io/serviceaccount/token
        ## windows at: C:\var\run\secrets\kubernetes.io\serviceaccount\token
        bearer_token = "/run/secrets/kubernetes.io/serviceaccount/token"
        # bearer_token_string = "<your-token-string>"

        [inputs.container.tags]
          # some_tag = "some_value"
          # more_tag = "some_other_value"
下図のように入力し、「作成」をクリックします。
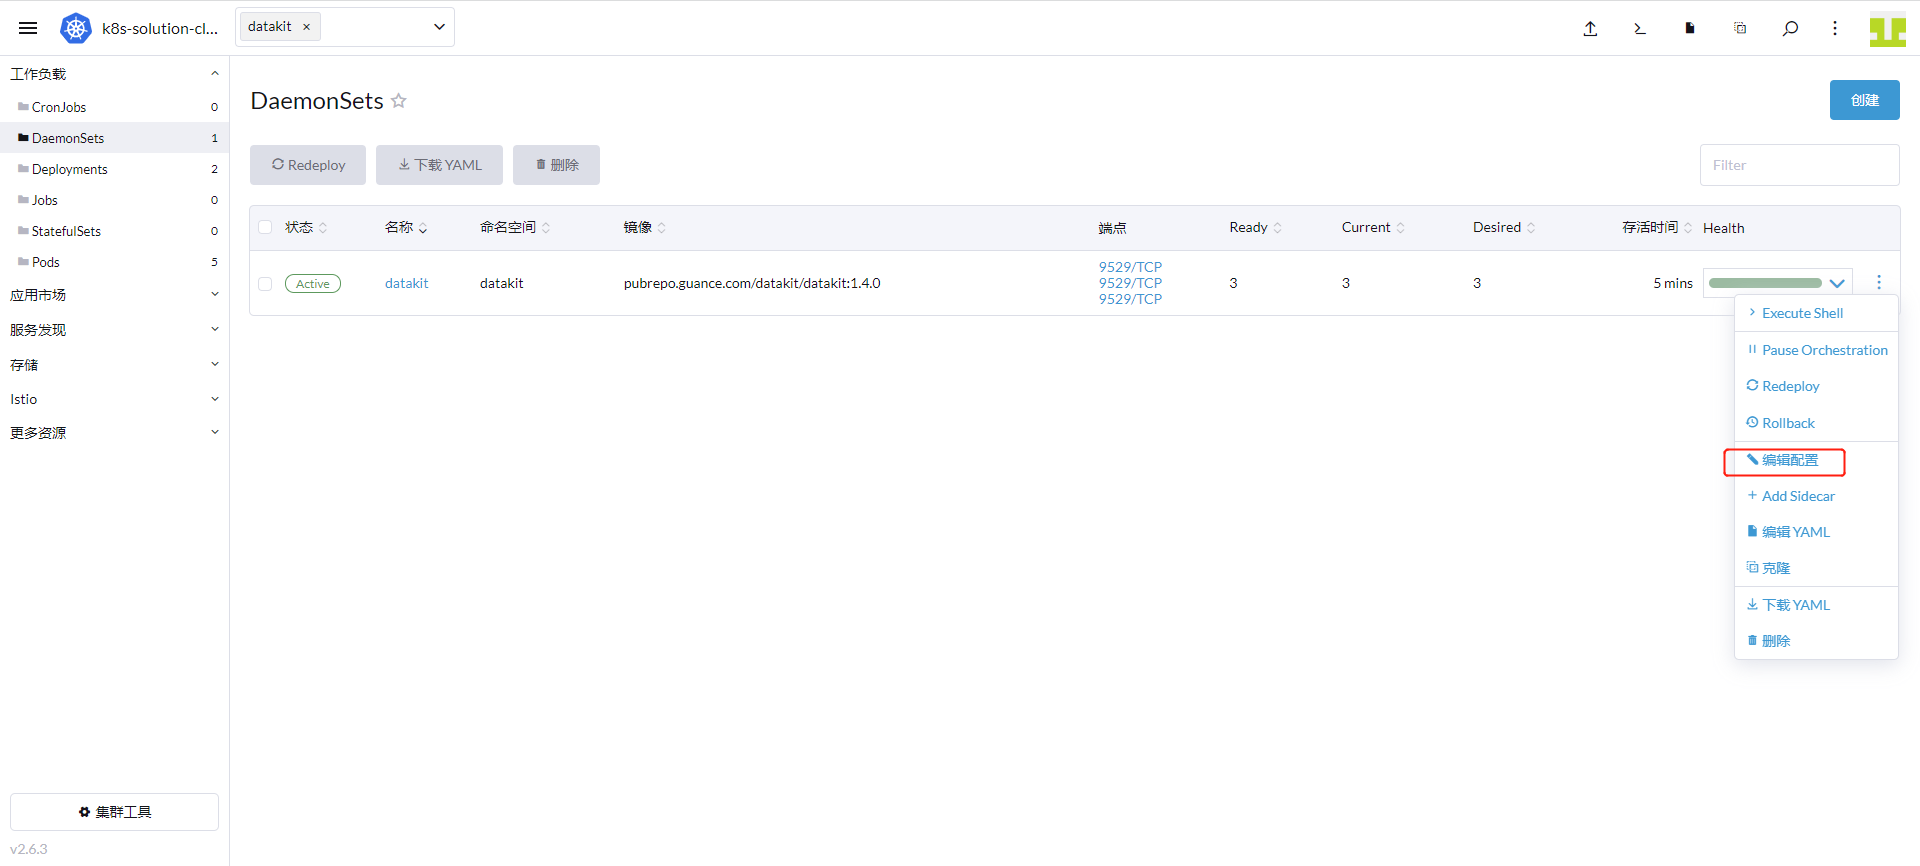
「クラスター」→「ワークロード」→「DaemonSets」に進み、datakit を見つけて「設定の編集」をクリックします。
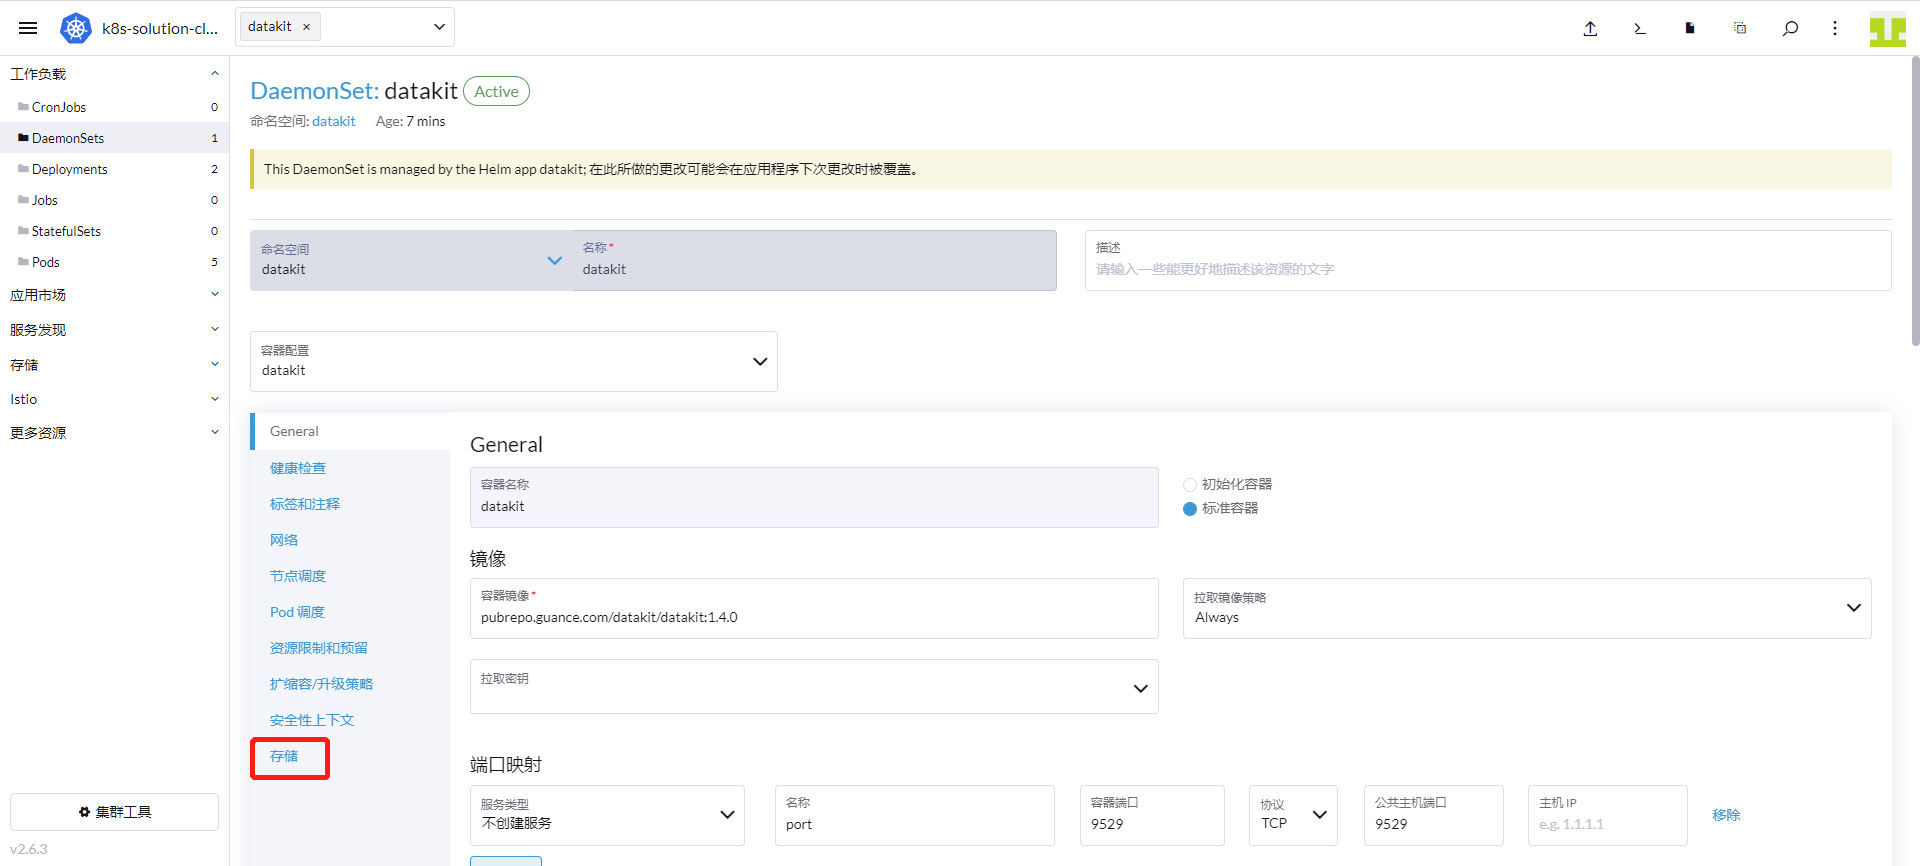
「ストレージ」をクリックします。
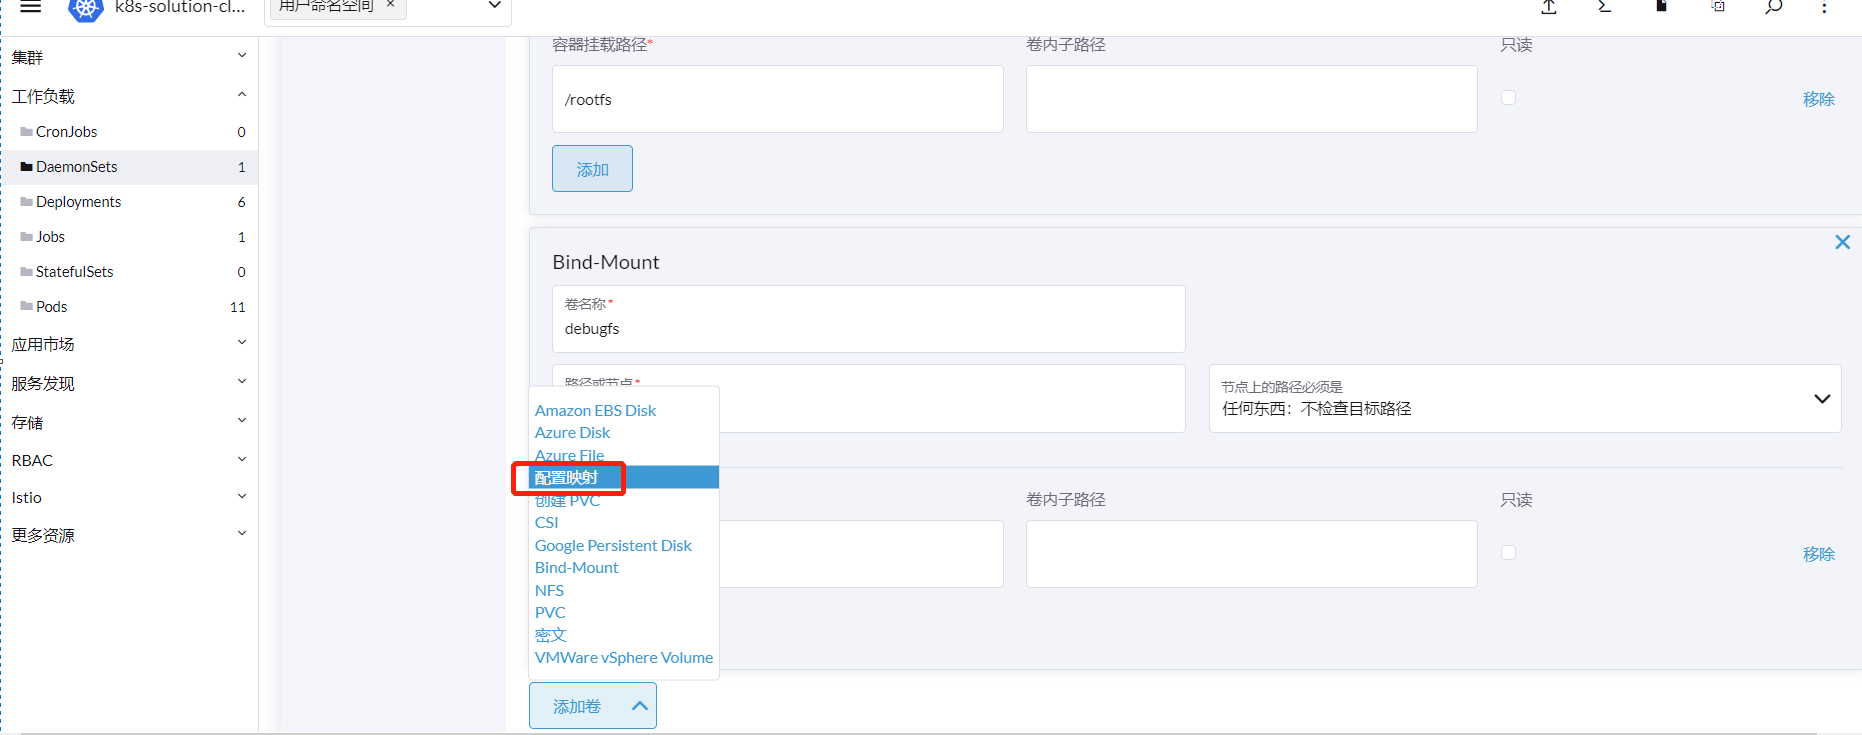
「ボリュームの追加」→「設定マップ」をクリックします。
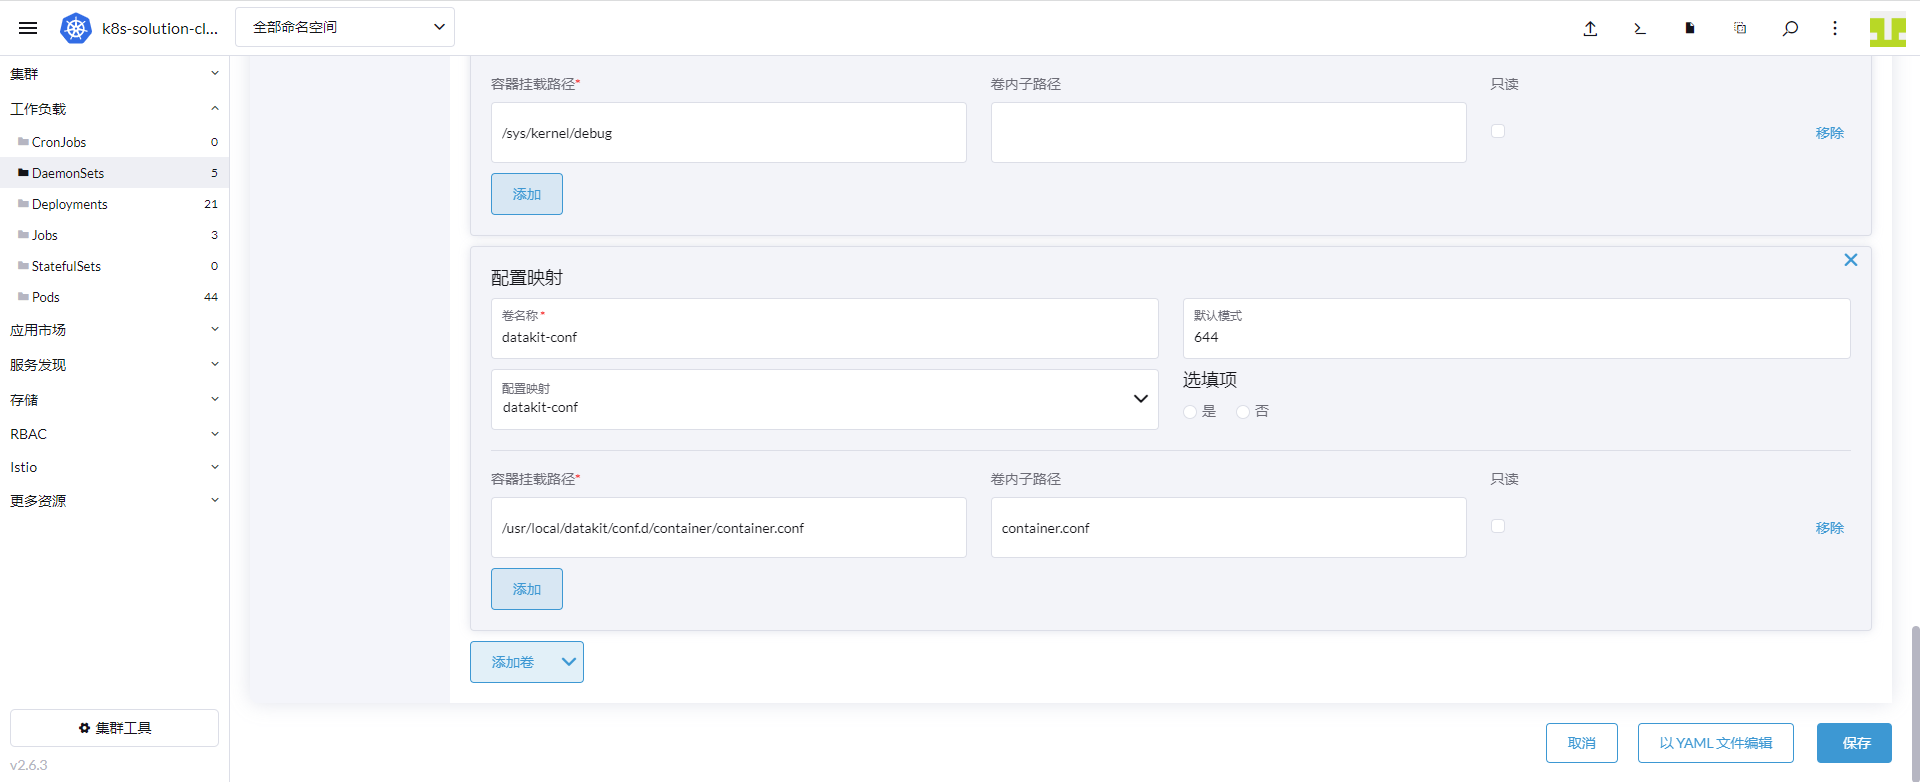
ボリューム名に「datakit-conf」、設定マップに「datakit.conf」、ボリューム内サブパスに「container.conf」、コンテナマウントパスに /usr/local/datakit/conf.d/container/container.conf を入力し、「保存」をクリックします。
- Container のモニタリングビュー
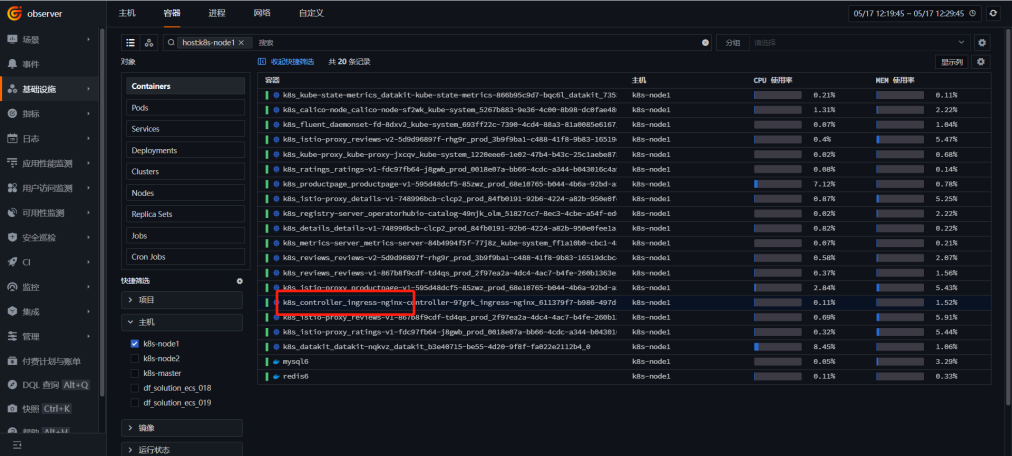
「Guance」にログインし、「インフラストラクチャ」→「コンテナ」に進み、「host:k8s-node1」と入力して k8s-node1 ノードのコンテナを表示し、「ingress」をクリックします。
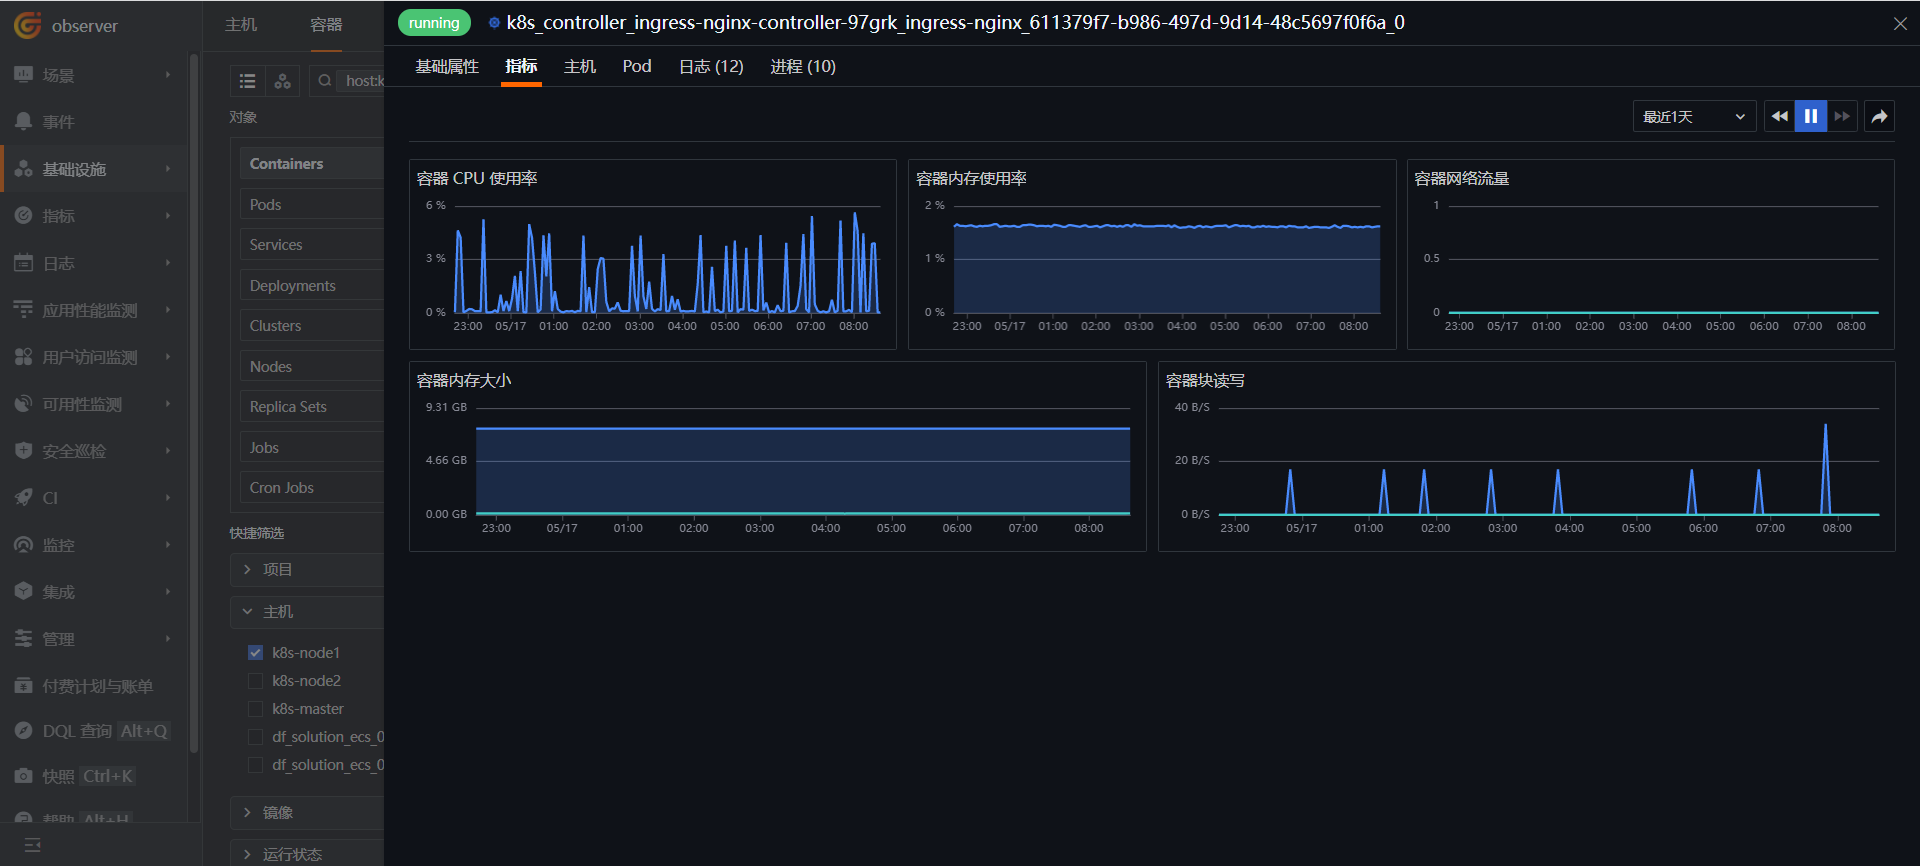
「メトリクス」をクリックし、DataKit Container のモニタリングビューを確認します。
2.3 Kubernetes のモニタリングビュー
- コレクターのデプロイ
DataKit のインストール時に、metrics-server と Kube-State-Metrics が既にインストールされています。
- Kubernetes モニタリングビューのデプロイ
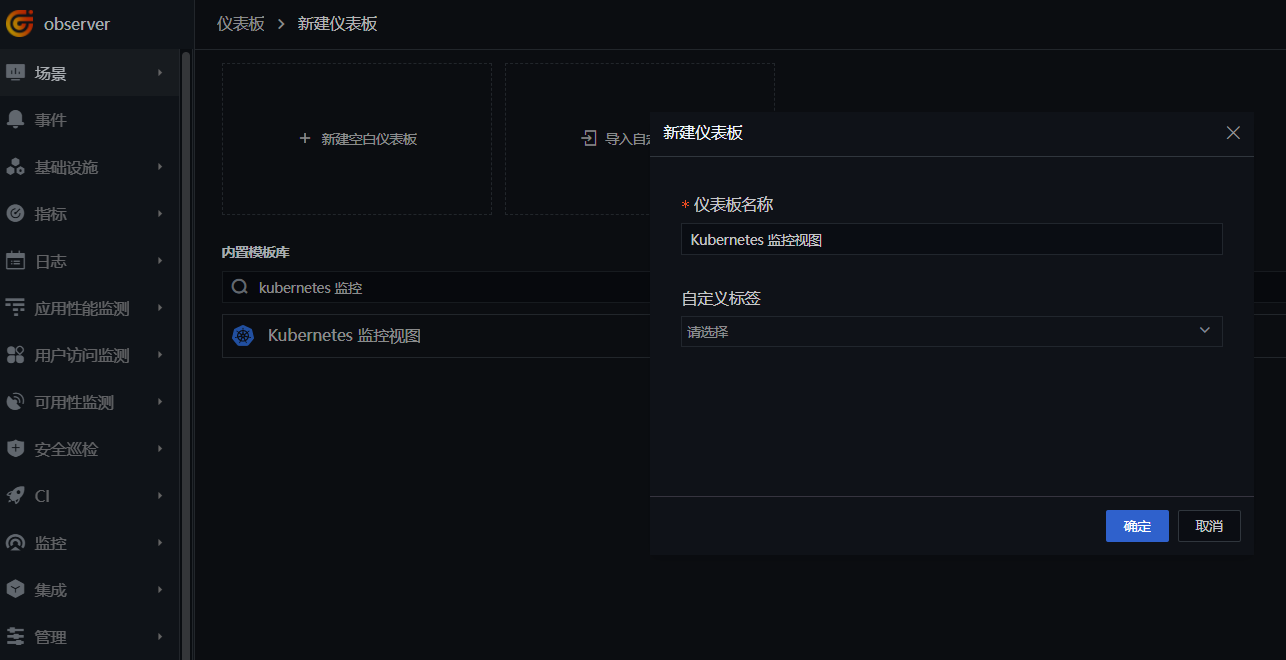
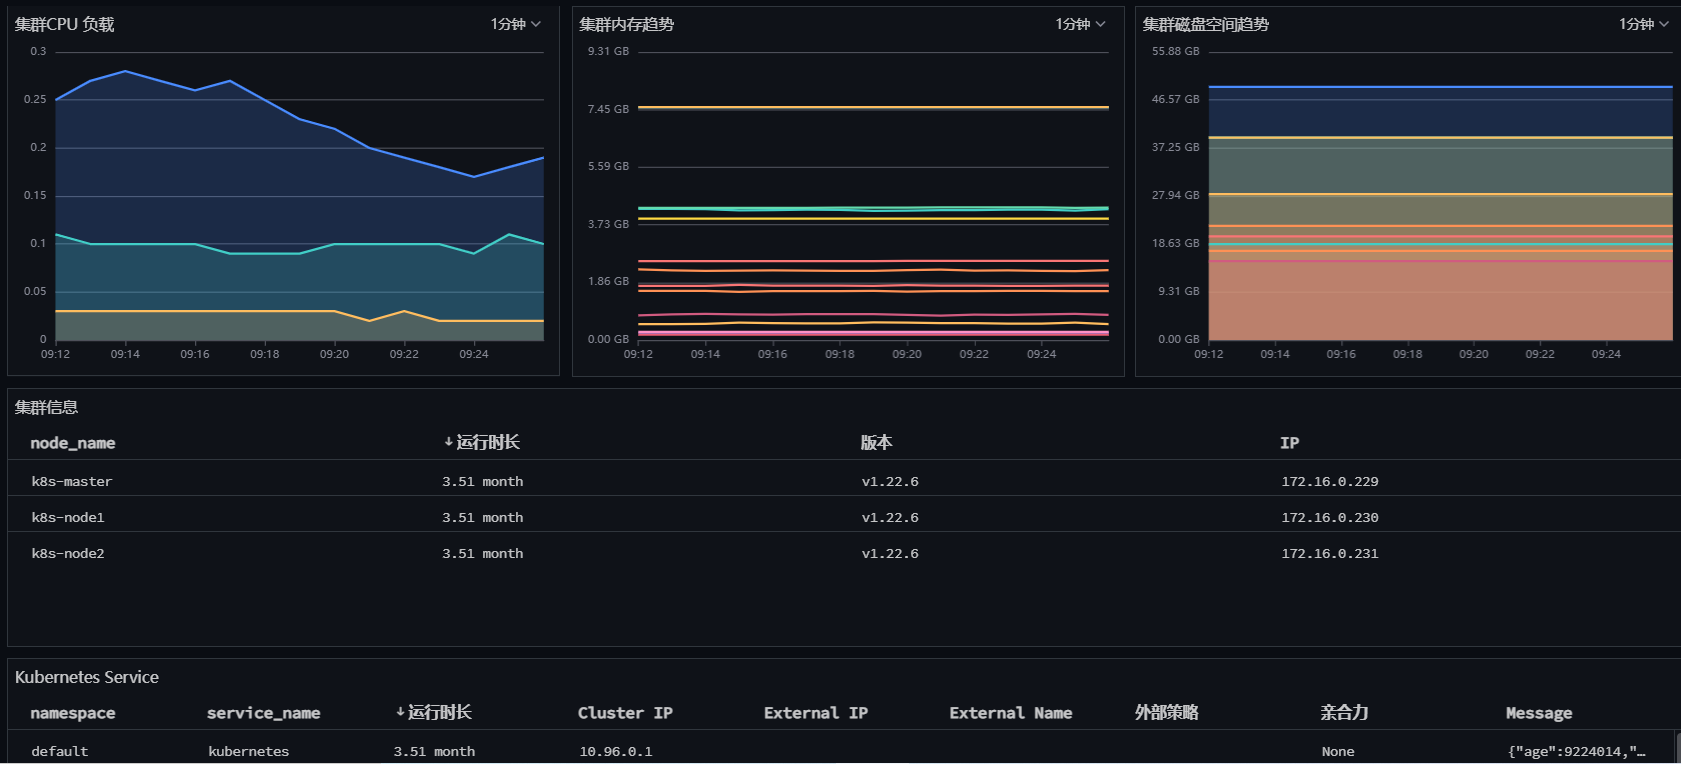
「Guance」にログインし、「シナリオ」モジュールに進入します。「新規ダッシュボード」をクリックし、「kubernetes モニタリング」と入力して「Kubernetes モニタリングビュー」を選択し、「確定」をクリックします。
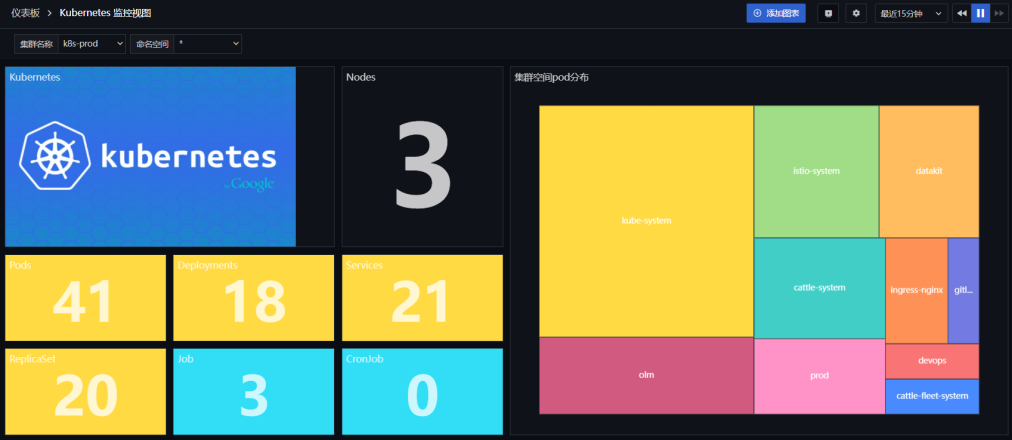
新しく作成された「Kubernetes モニタリングビュー」をクリックし、クラスター情報を確認します。
2.4 Kubernetes Overview with Kube State Metrics のモニタリングビュー
- コレクターの有効化
「Rancher」にログインし、「クラスター」→「ストレージ」→「ConfigMaps」に進み、datakit-conf を見つけて「設定の編集」をクリックします。
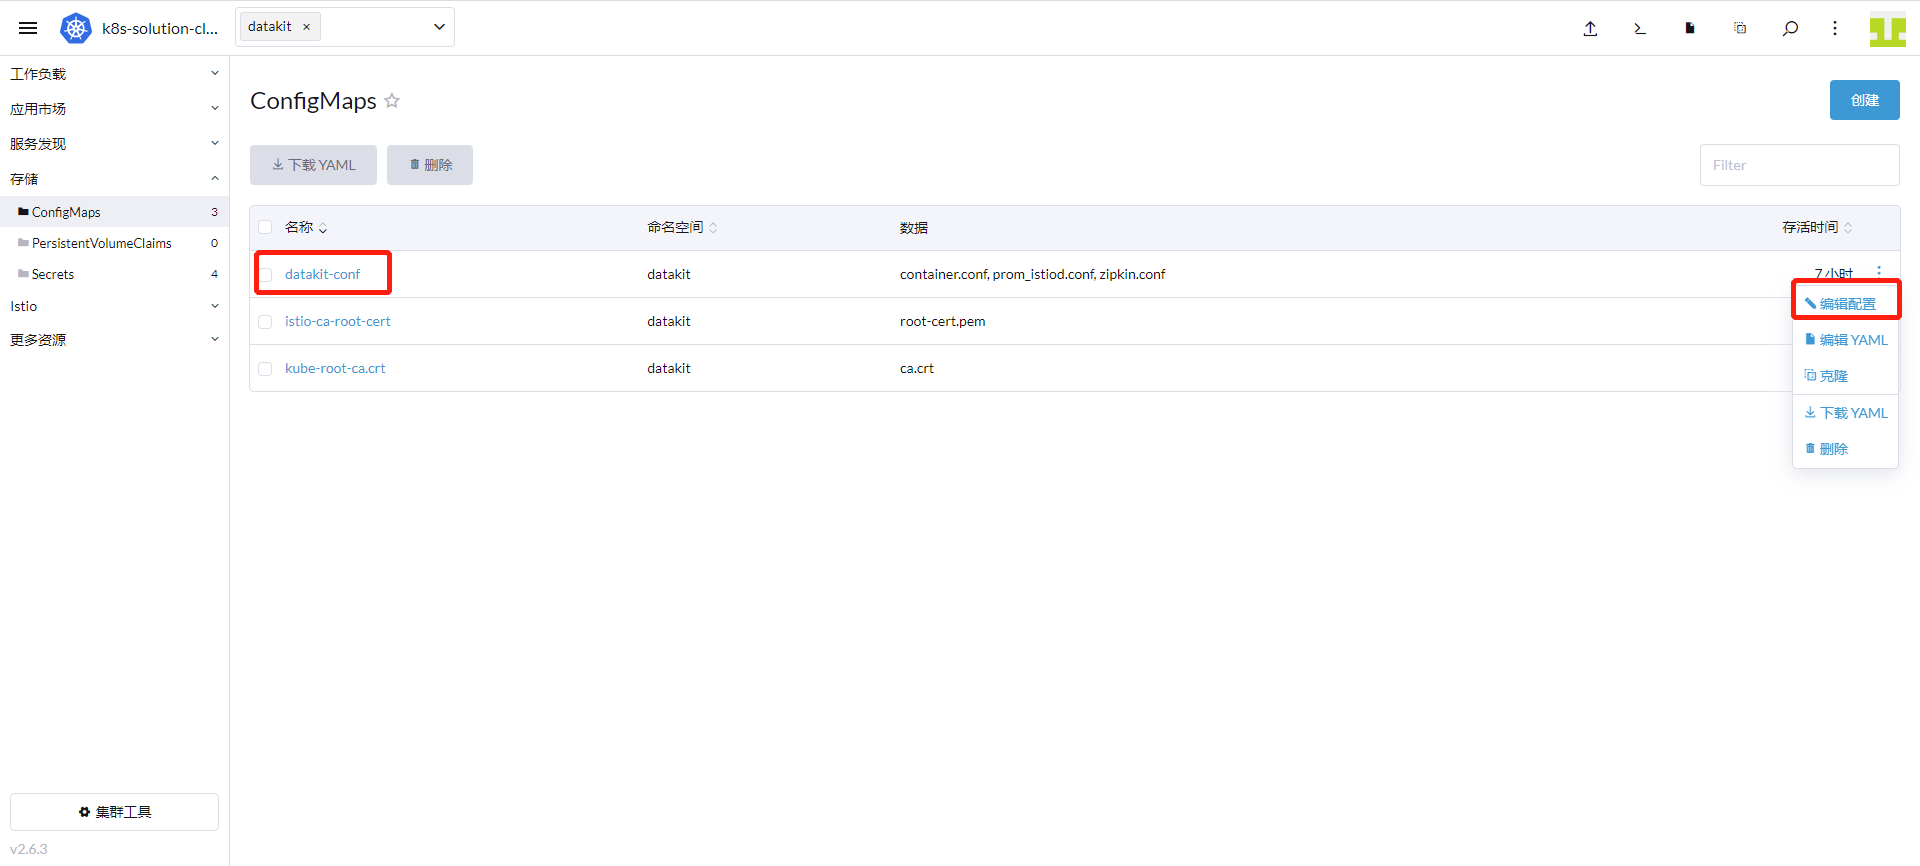
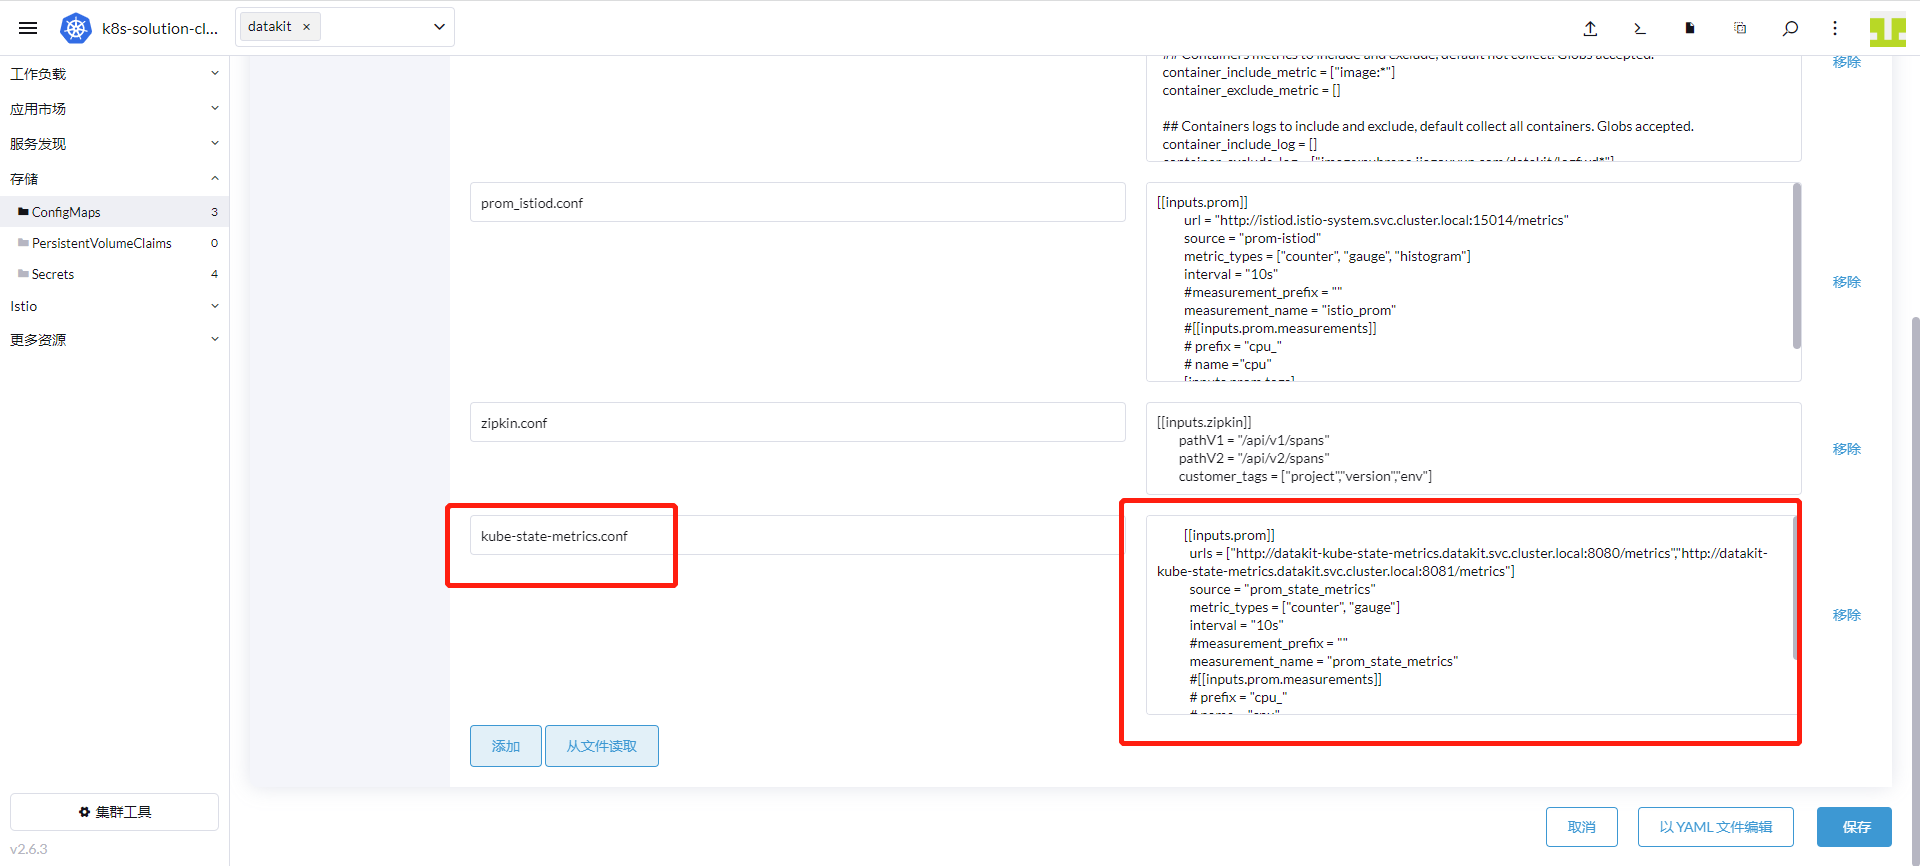
「追加」をクリックし、キーに「kube-state-metrics.conf」、値に以下の内容を入力して「保存」をクリックします。
          [[inputs.prom]]
            urls = ["http://datakit-kube-state-metrics.datakit.svc.cluster.local:8080/metrics","http://datakit-kube-state-metrics.datakit.svc.cluster.local:8081/metrics"]
            source = "prom_state_metrics"
            metric_types = ["counter", "gauge"]
            interval = "60s"
            tags_ignore = ["access_mode","branch","claim_namespace","cluster_ip","condition","configmap","container","container_id","container_runtime_version","created_by_kind","created_by_name","effect","endpoint","external_name","goversion","host_network","image","image_id","image_spec","ingress","ingressclass","internal_ip","job_name","kernel_version","key","kubelet_version","kubeproxy_version","lease","mutatingwebhookconfiguration","name","networkpolicy","node","node_name","os_image","owner_is_controller","owner_kind","owner_name","path","persistentvolume","persistentvolumeclaim","pod_cidr","pod_ip","poddisruptionbudget","port_name","port_number","port_protocol","priority_class","reason","resource","result","revision","role","secret","service","service_name","service_port","shard_ordinal","status","storageclass","system_uuid","type","uid","unit","version","volume","volumename"]
            metric_name_filter = ["kube_pod_status_phase","kube_pod_container_status_restarts_total","kube_daemonset_status_desired_number_scheduled","kube_daemonset_status_number_ready","kube_deployment_spec_replicas","kube_deployment_status_replicas_available","kube_deployment_status_replicas_unavailable","kube_replicaset_status_ready_replicas","kube_replicaset_spec_replicas","kube_pod_container_status_running","kube_pod_container_status_waiting","kube_pod_container_status_terminated","kube_pod_container_status_ready"]
            #measurement_prefix = ""
            measurement_name = "prom_state_metrics"
            #[[inputs.prom.measurements]]
            # prefix = "cpu_"
            # name = "cpu"
            [inputs.prom.tags]
            namespace = "$NAMESPACE"
            pod_name = "$PODNAME"
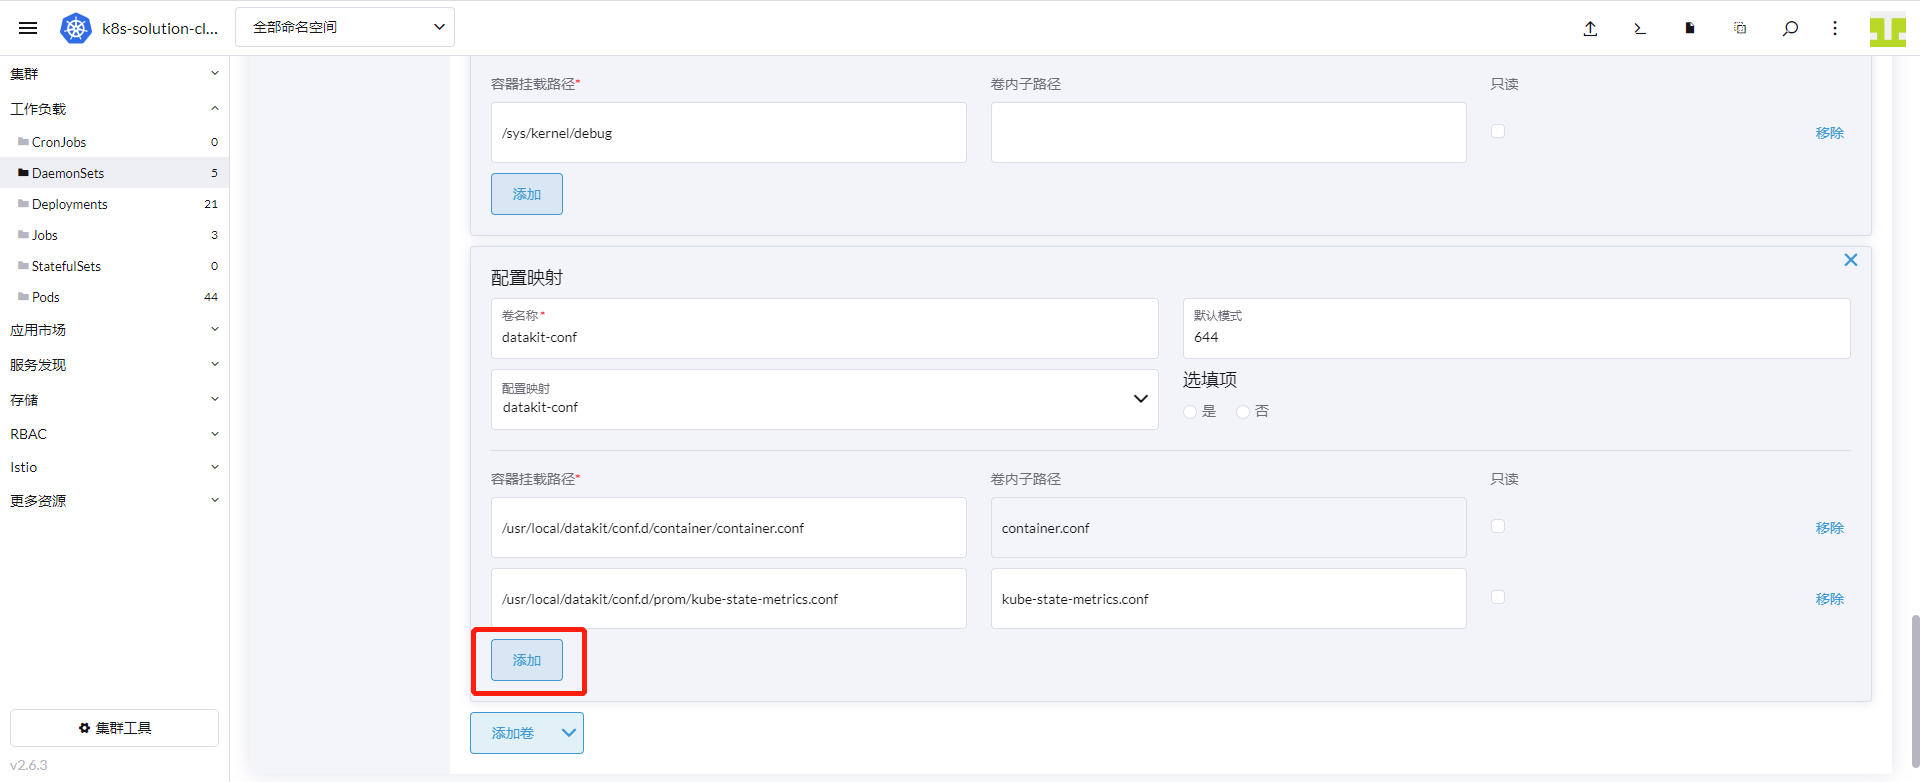
「クラスター」→「ワークロード」→「DaemonSets」に進み、datakit 行の右側にある「設定の編集」を選択します。
「ストレージ」をクリックし、ボリューム名が「datakit-conf」の設定マップを見つけて「追加」をクリックします。コンテナマウントパスに「/usr/local/datakit/conf.d/prom/kube-state-metrics.conf」、ボリューム内サブパスに「kube-state-metrics.conf」を入力し、「保存」をクリックします。
- Kubernetes Overview with Kube State Metrics のモニタリングビュー
「Guance」にログインし、「シナリオ」モジュールに進入します。「新規ダッシュボード」をクリックし、「kubernetes Overview」と入力して「Kubernetes Overview with Kube State Metrics モニタリングビュー」を選択し、「確定」をクリックします。
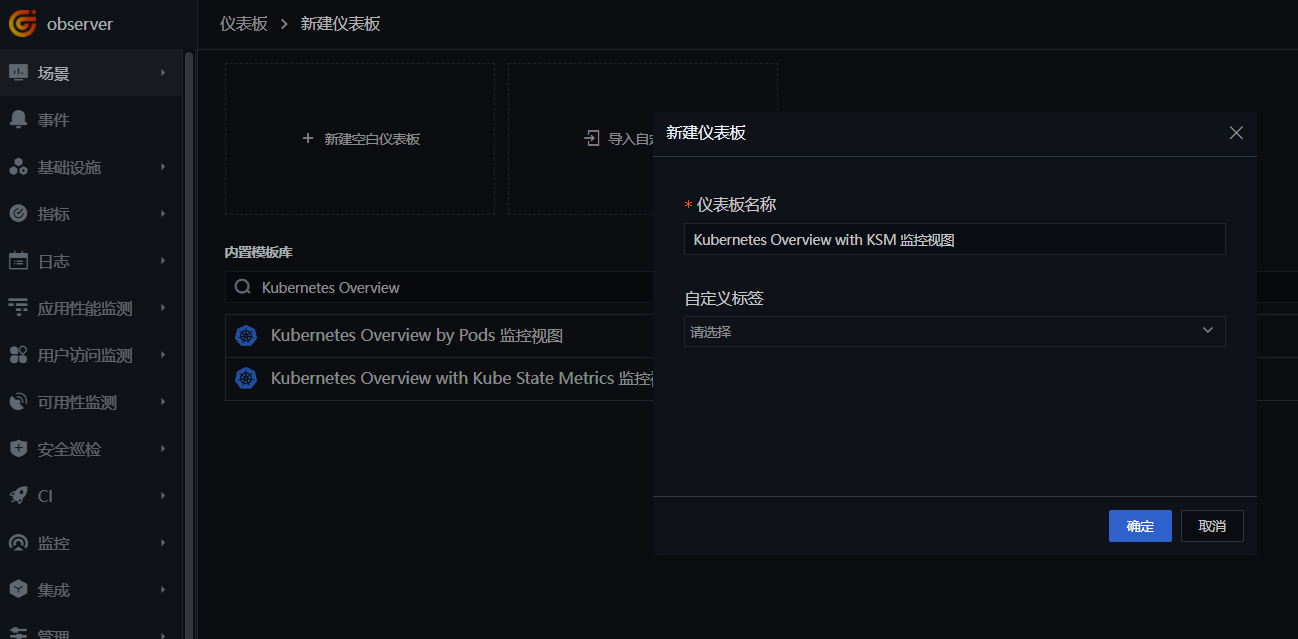
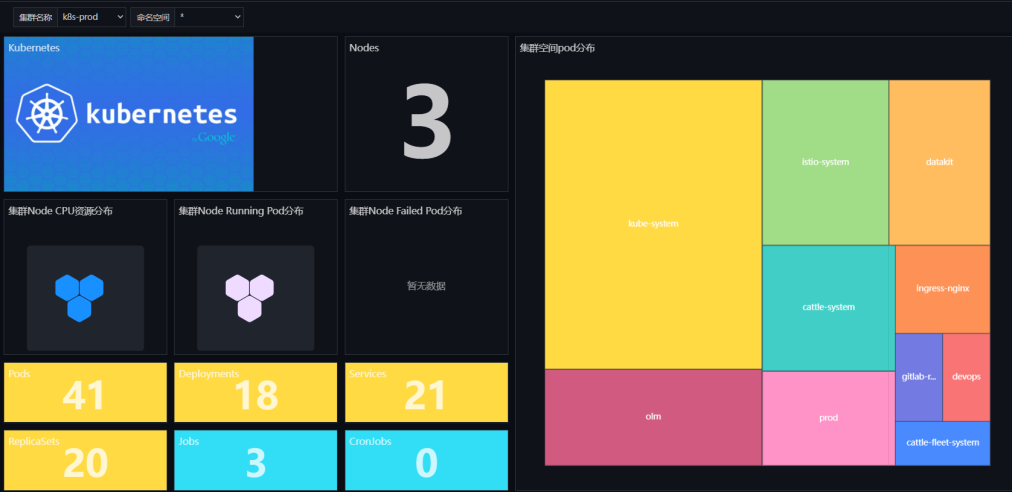
新しく作成された「Kubernetes Overview with KSM モニタリングビュー」をクリックし、クラスター情報を確認します。
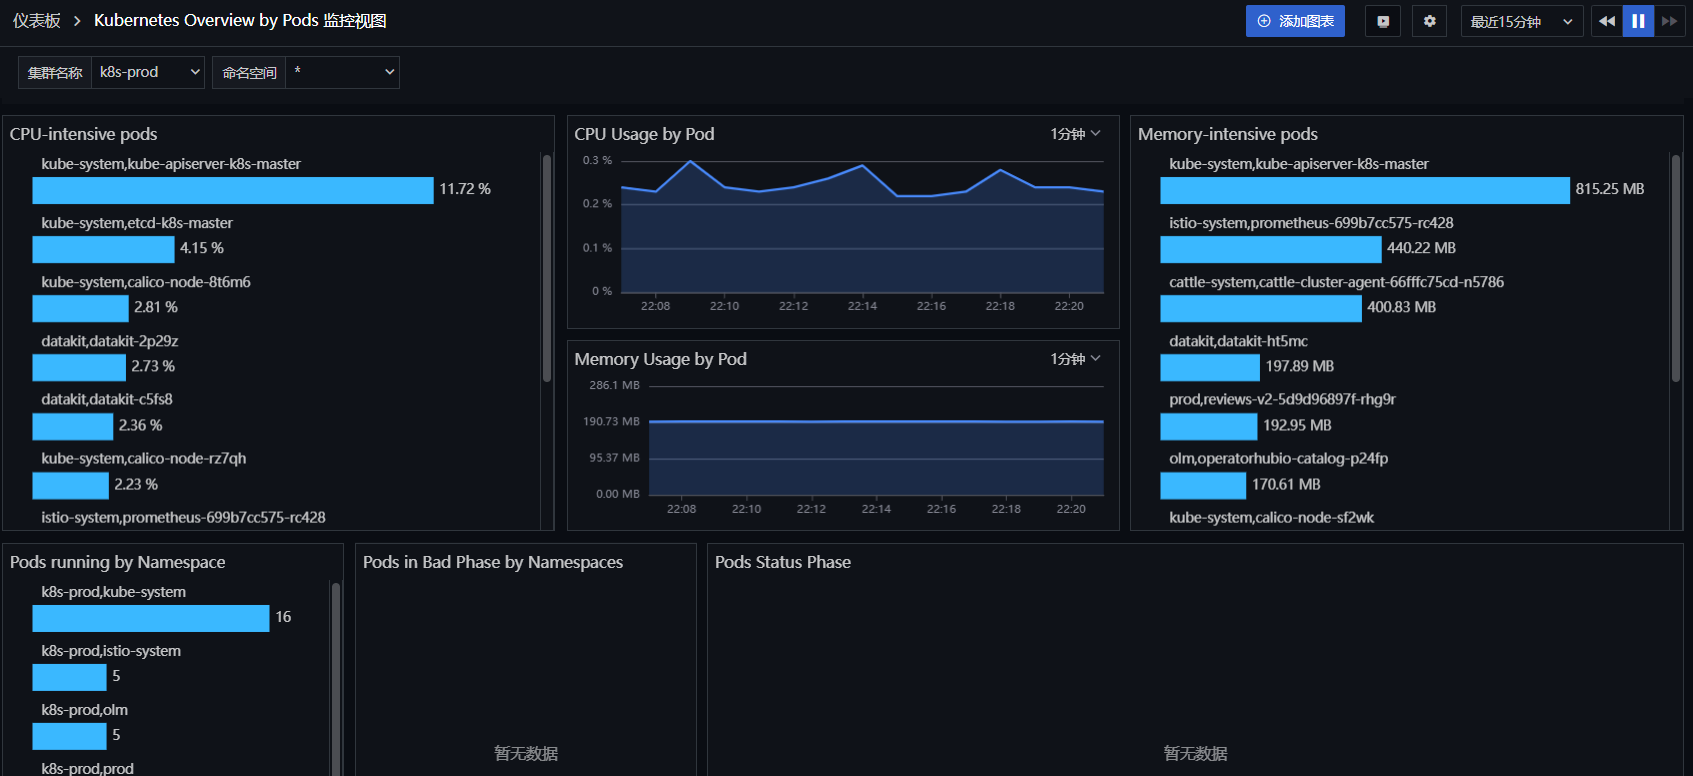
2.5 Kubernetes Overview by Pods のモニタリングビュー
「Guance」にログインし、「シナリオ」モジュールに進入します。「新規ダッシュボード」をクリックし、「kubernetes Overview by」と入力して「Kubernetes Overview by Pods モニタリングビュー」を選択し、「確定」をクリックします。
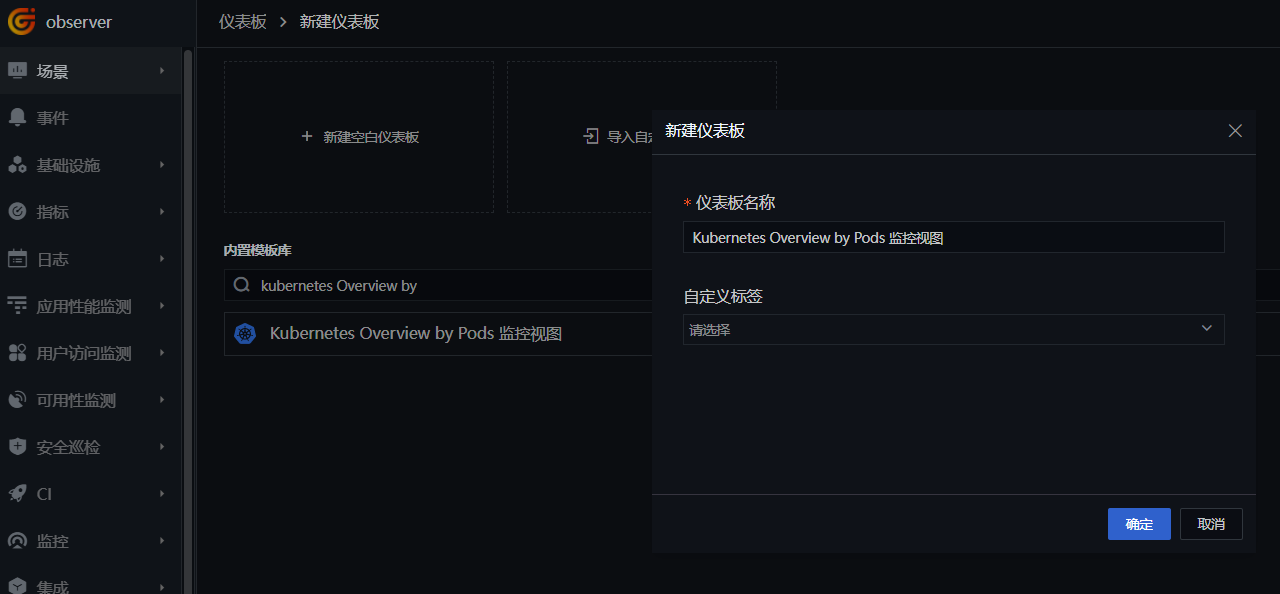
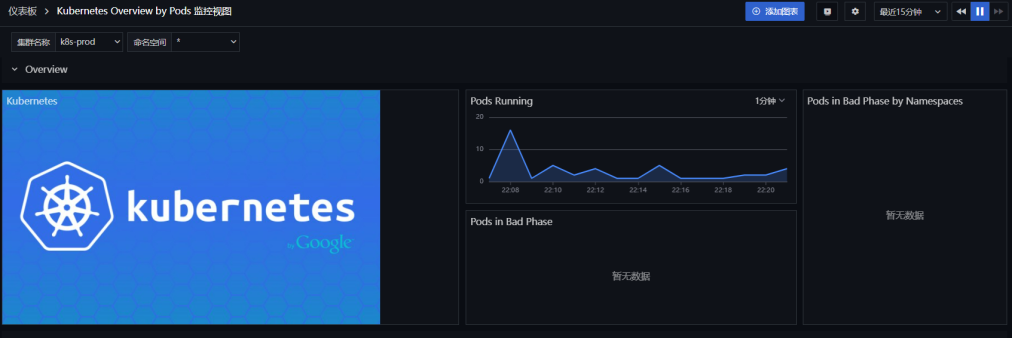
新しく作成された「Kubernetes Overview by Pods モニタリングビュー」をクリックし、クラスター情報を確認します。
2.6 Kubernetes Services のモニタリングビュー
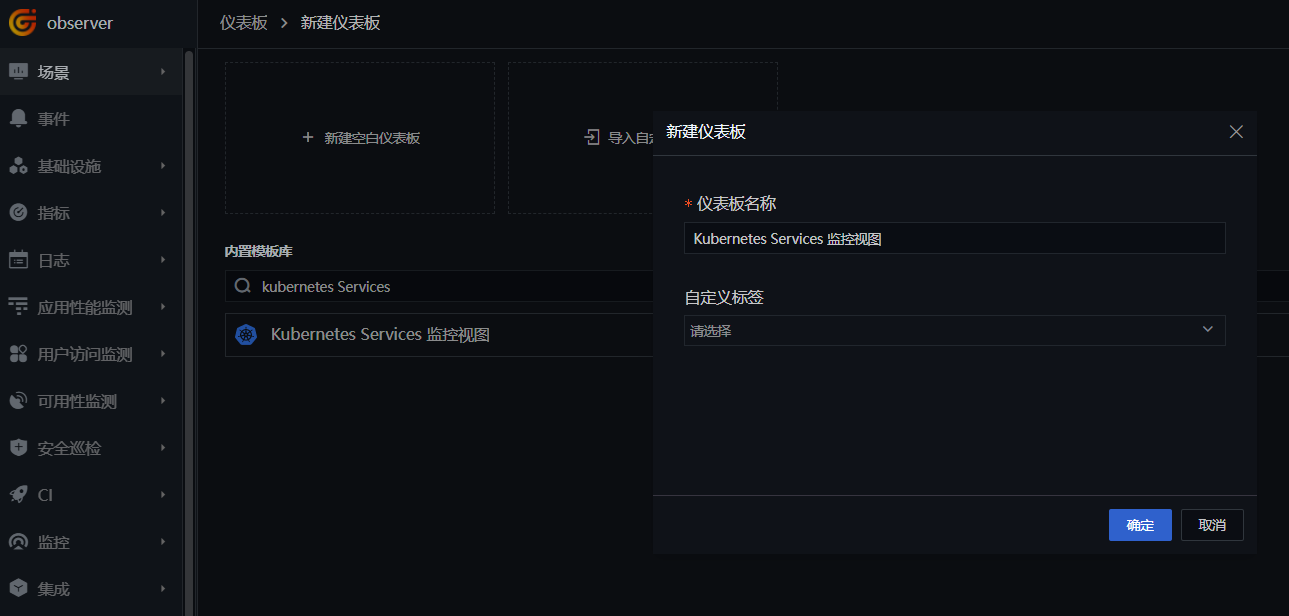
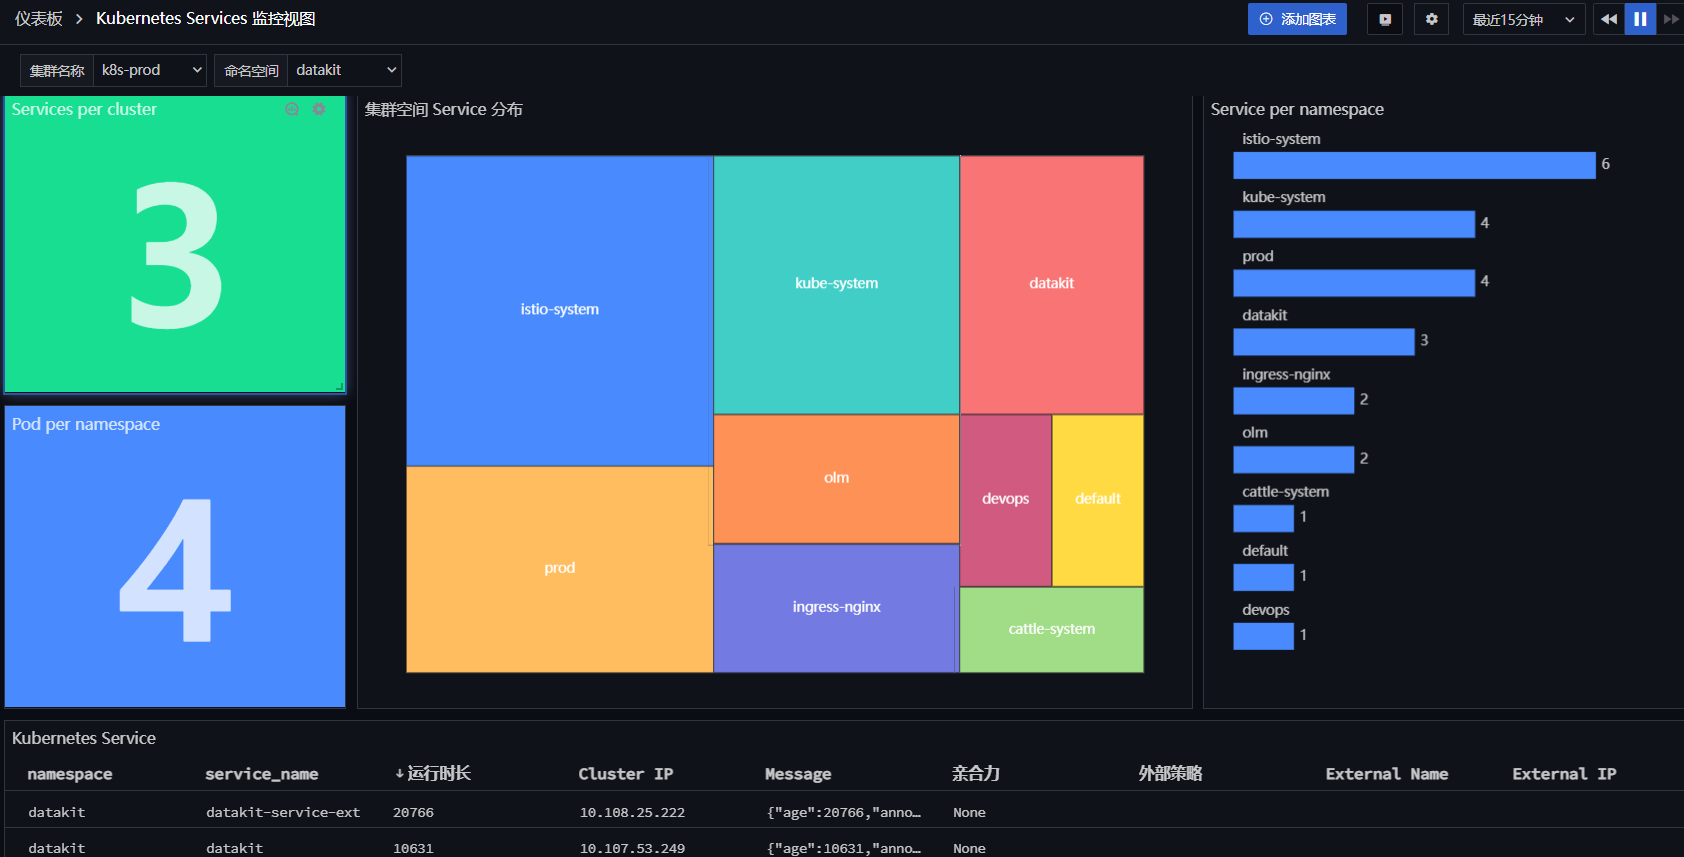
「Guance」にログインし、「シナリオ」モジュールに進入します。「新規ダッシュボード」をクリックし、「kubernetes Services」と入力して「Kubernetes Services モニタリングビュー」を選択し、「確定」をクリックします。
新しく作成された「Kubernetes Services モニタリングビュー」をクリックし、クラスター情報を確認します。
手順 3: Istio およびアプリケーションのデプロイ
3.1 Istio のデプロイ
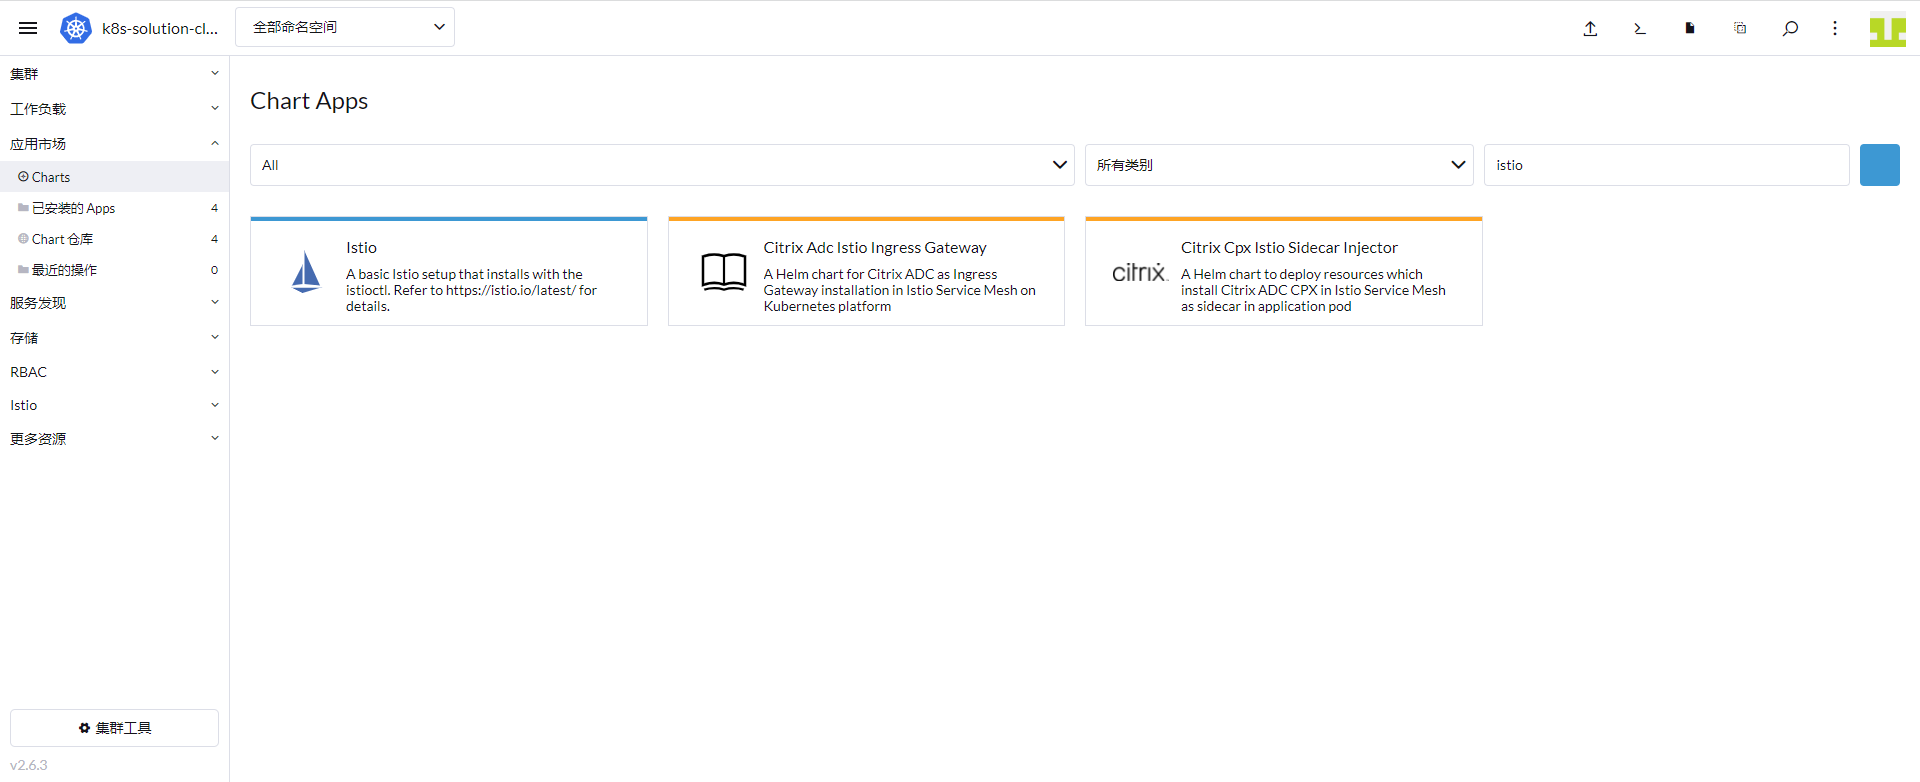
「Rancher」→「アプリケーションマーケット」→「Charts」に進み、Istio を選択してインストールします。
3.2 Sidecar インジェクションの有効化
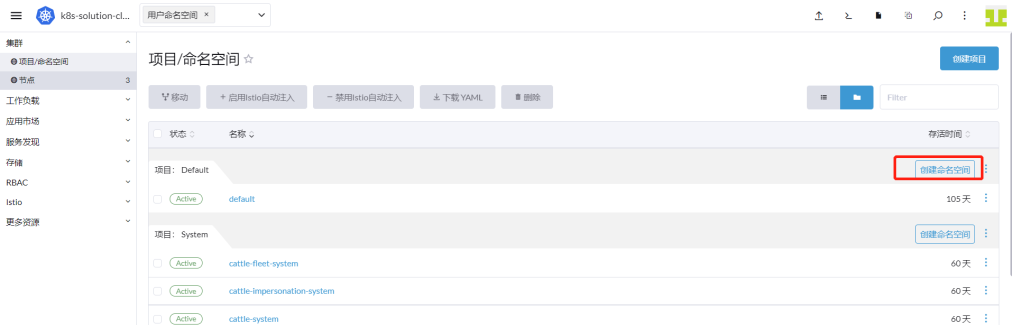
prod 名前空間を作成し、この名前空間で Pod 作成時に自動的に Sidecar が注入されるように設定して、Pod の出入力トラフィックを Sidecar で処理するようにします。
「Rancher」→「クラスター」→「プロジェクト/名前空間」に進み、「名前空間の作成」をクリックします。
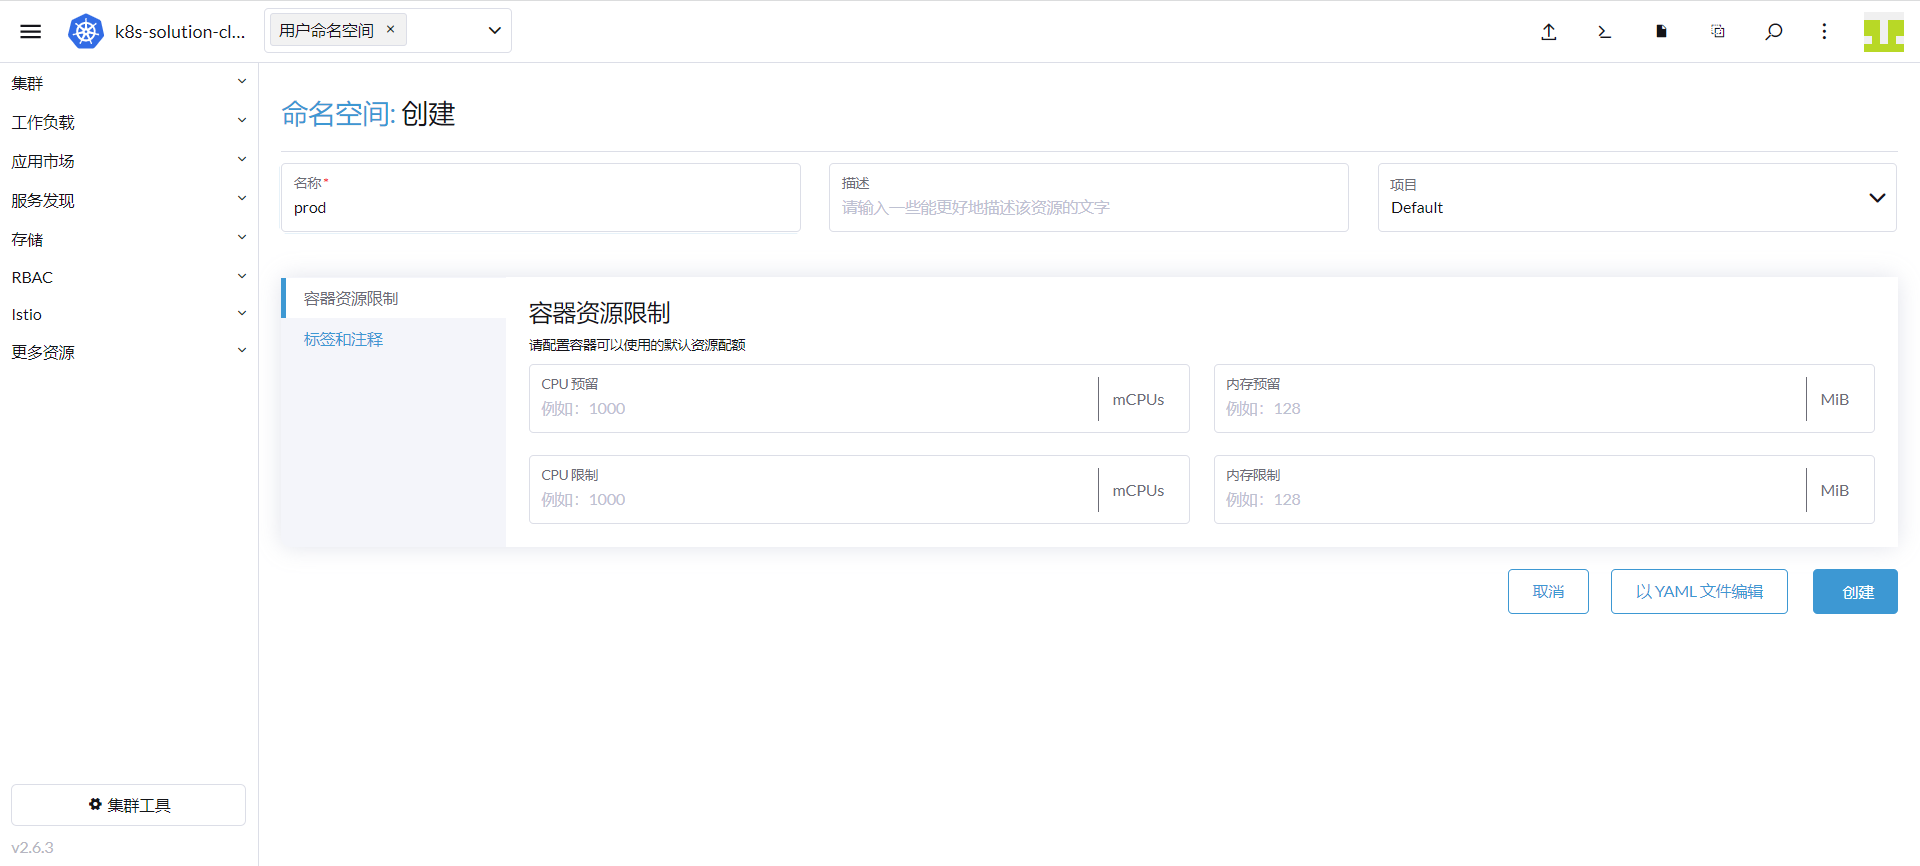
名前に「prod」と入力し、「作成」をクリックします。
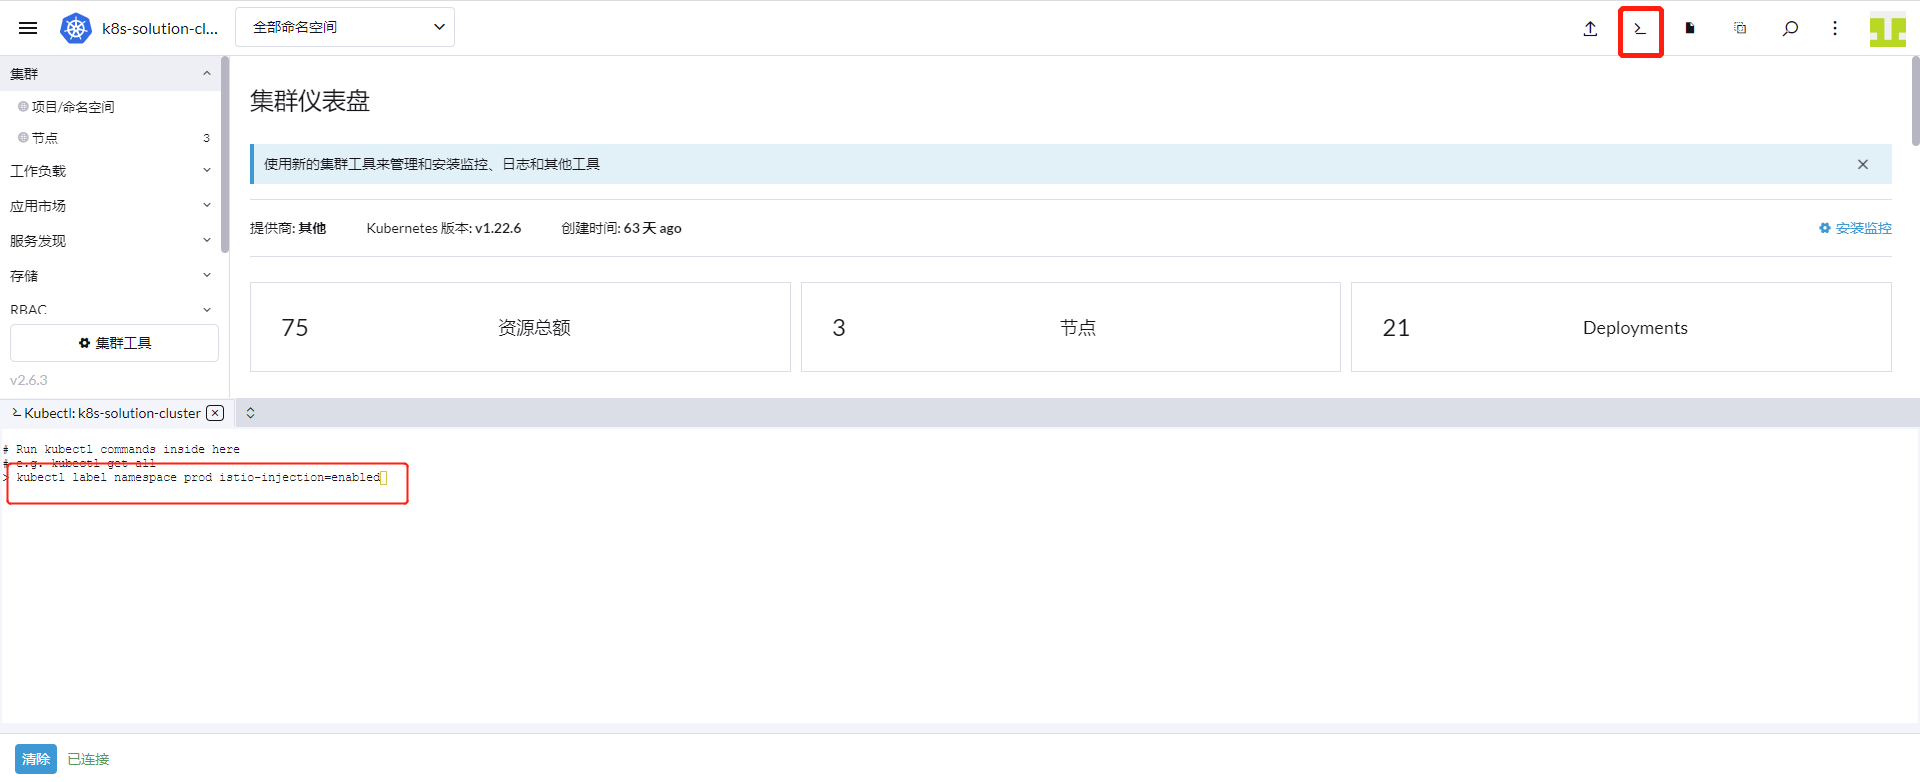
Rancher 上部の「コマンドライン」アイコンをクリックし、「kubectl label namespace prod istio-injection=enabled」と入力して Enter キーを押します。
3.3 Istiod コレクターの有効化
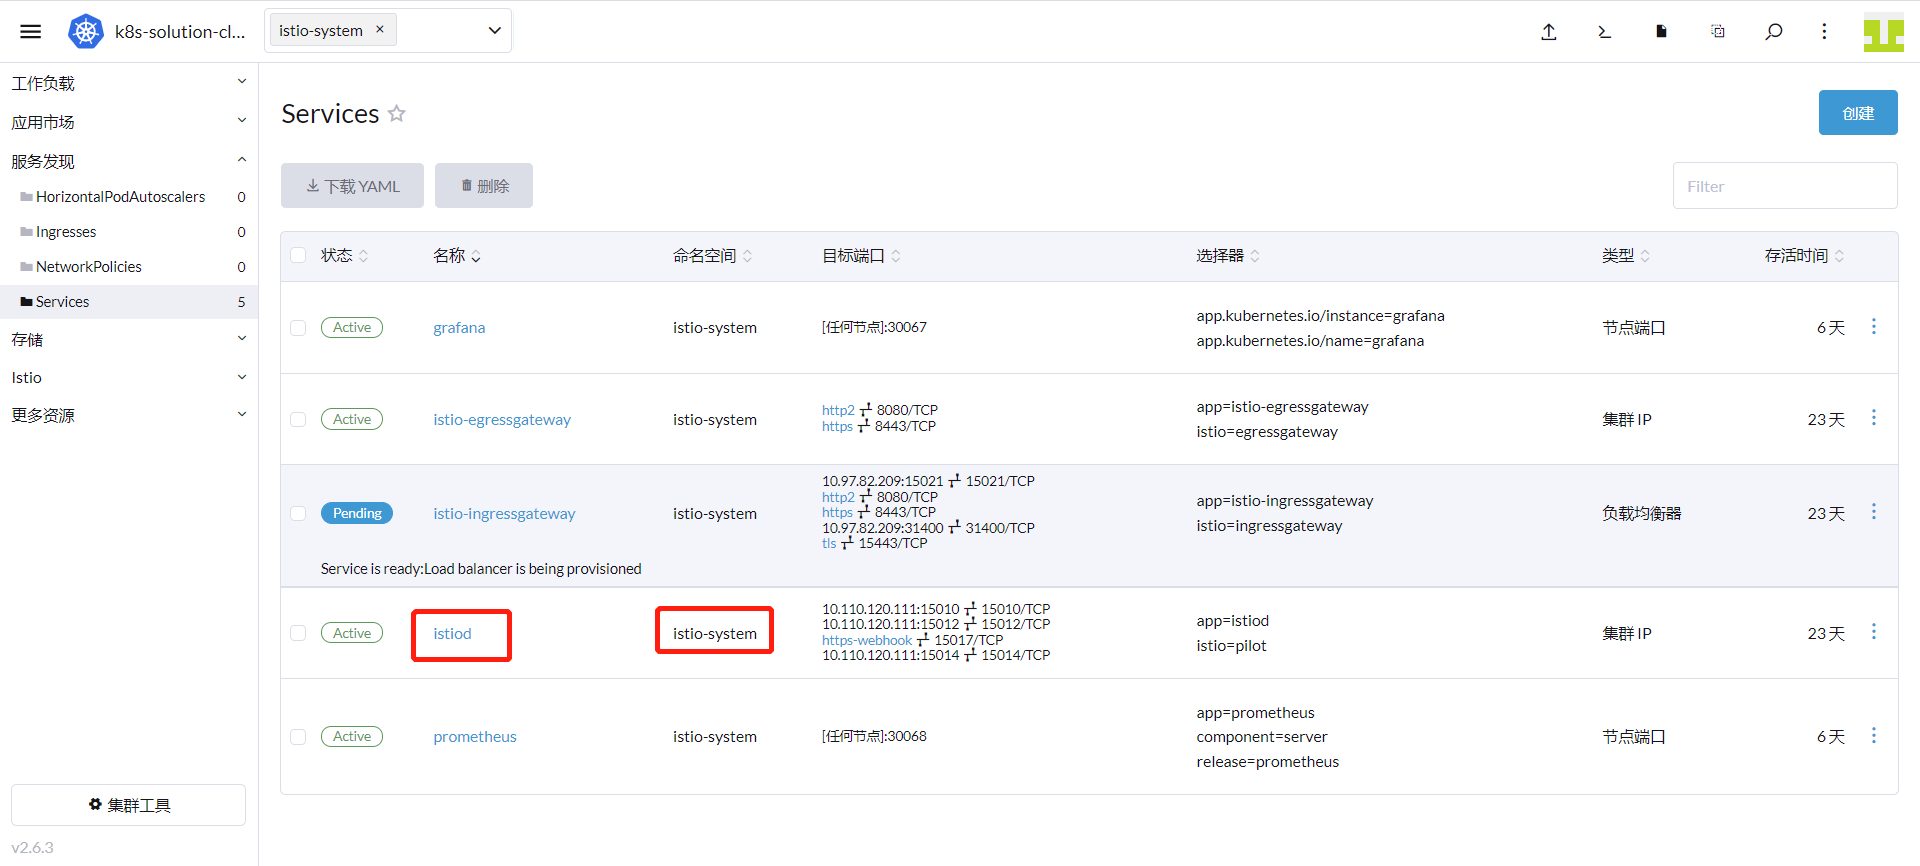
「Rancher」→「クラスター」→「サービスディスカバリ」→「Service」に進み、Service 名が istiod で、名前空間が istio-system であることを確認します。
「Rancher」→「クラスター」→「ストレージ」→「ConfigMaps」に進み、datakit-conf を見つけて「設定の編集」をクリックします。
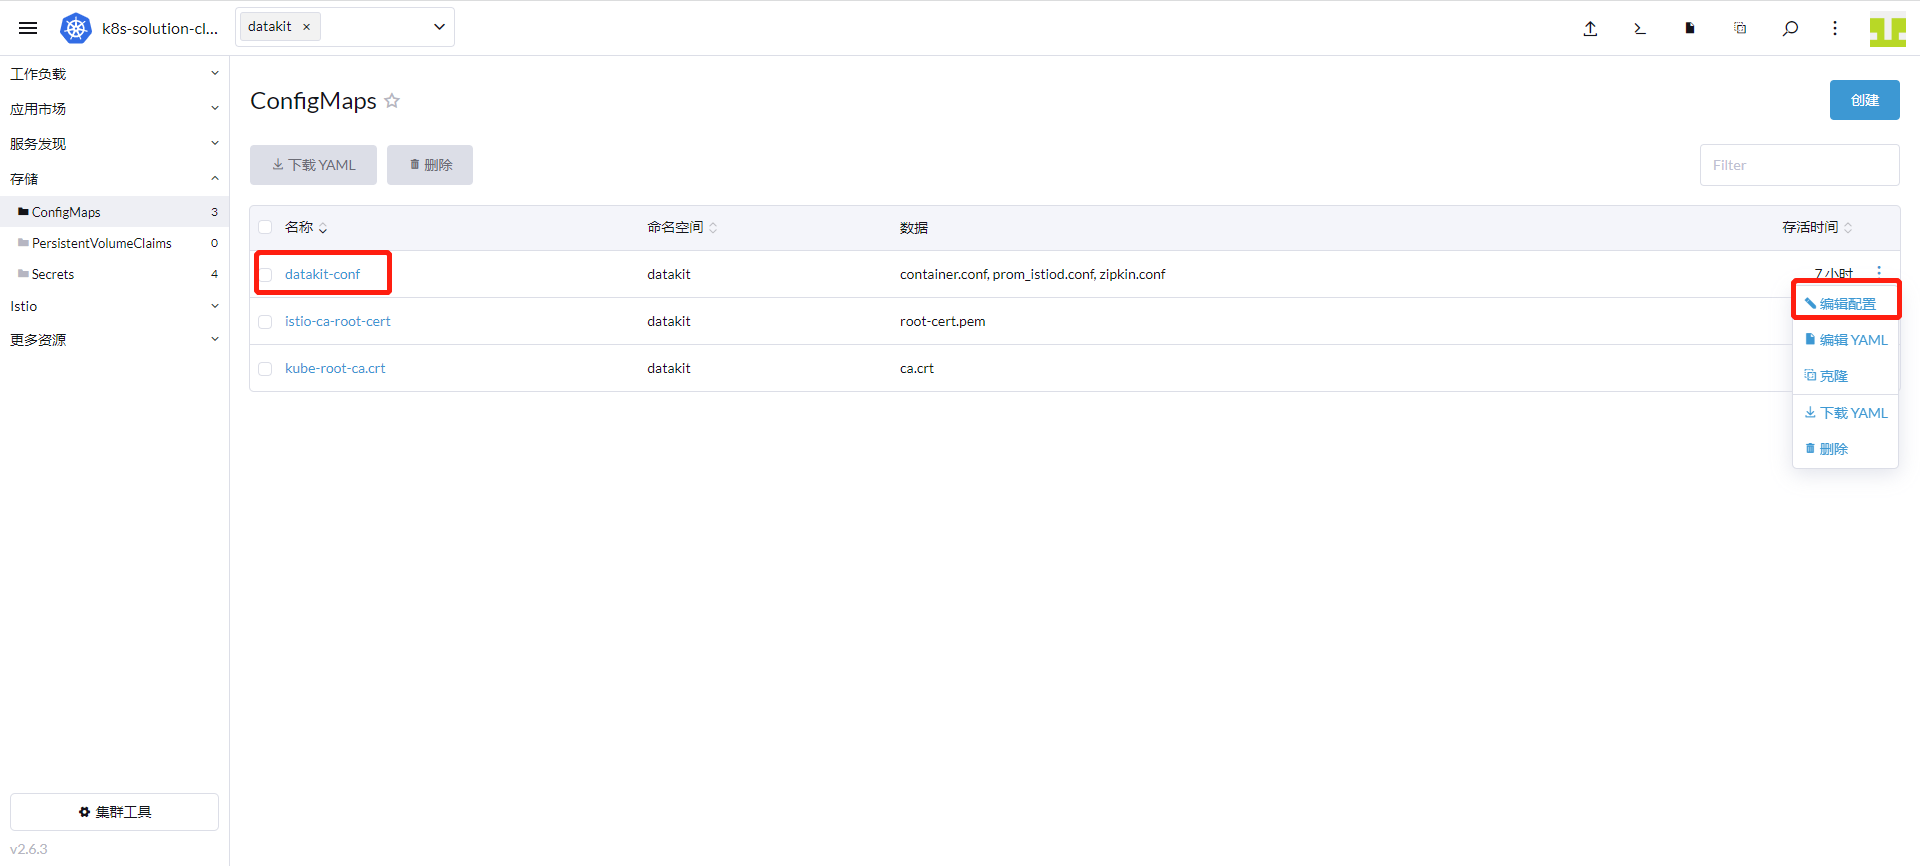
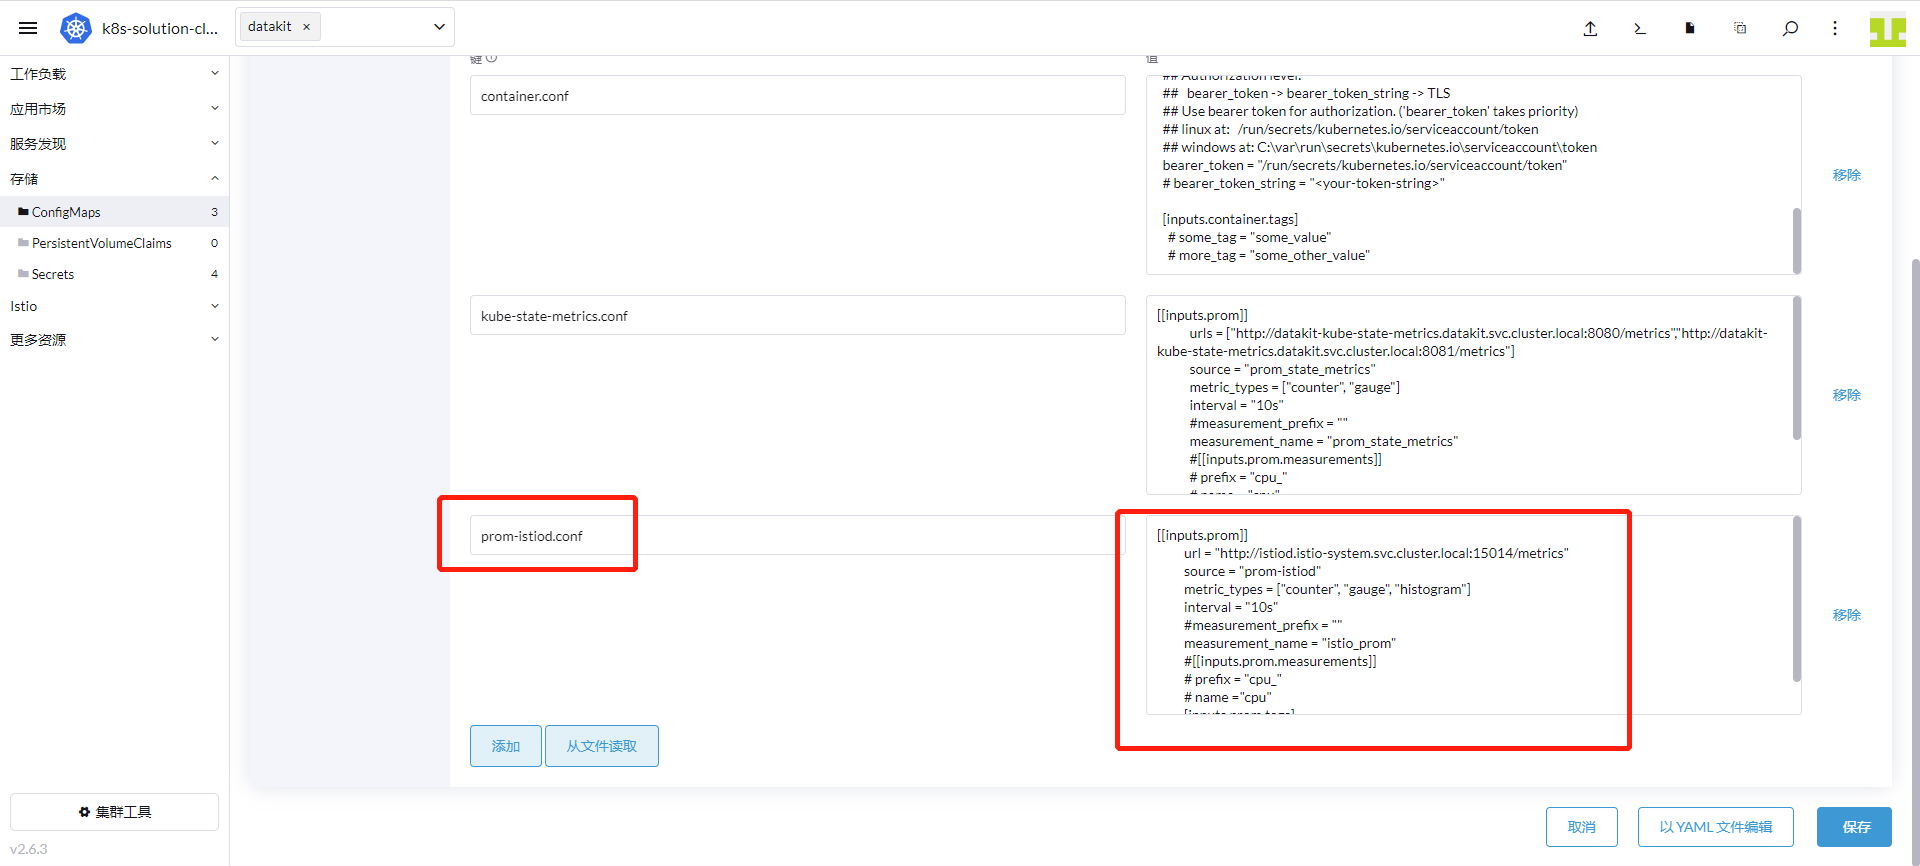
「追加」をクリックし、キーに「prom-istiod.conf」、値に以下の内容を入力して「保存」をクリックします。
        [[inputs.prom]]
          url = "http://istiod.istio-system.svc.cluster.local:15014/metrics"
          source = "prom-istiod"
          metric_types = ["counter", "gauge"]
          interval = "60s"
          tags_ignore = ["cache","cluster_type","component","destination_app","destination_canonical_revision","destination_canonical_service","destination_cluster","destination_principal","group","grpc_code","grpc_method","grpc_service","grpc_type","reason","request_protocol","request_type","resource","responce_code_class","response_flags","source_app","source_canonical_revision","source_canonical-service","source_cluster","source_principal","source_version","wasm_filter"]
          #measurement_prefix = ""
          metric_name_filter = ["istio_requests_total","pilot_k8s_cfg_events","istio_build","process_virtual_memory_bytes","process_resident_memory_bytes","process_cpu_seconds_total","envoy_cluster_assignment_stale","go_goroutines","pilot_xds_pushes","pilot_proxy_convergence_time_bucket","citadel_server_root_cert_expiry_timestamp","pilot_conflict_inbound_listener","pilot_conflict_outbound_listener_http_over_current_tcp","pilot_conflict_outbound_listener_tcp_over_current_tcp","pilot_conflict_outbound_listener_tcp_over_current_http","pilot_virt_services","galley_validation_failed","pilot_services","envoy_cluster_upstream_cx_total","envoy_cluster_upstream_cx_connect_fail","envoy_cluster_upstream_cx_active","envoy_cluster_upstream_cx_rx_bytes_total","envoy_cluster_upstream_cx_tx_bytes_total","istio_request_duration_milliseconds_bucket","istio_request_duration_seconds_bucket","istio_request_bytes_bucket","istio_response_bytes_bucket"]
          measurement_name = "istio_prom"
          #[[inputs.prom.measurements]]
          # prefix = "cpu_"
          # name ="cpu"
          [inputs.prom.tags]
            app_id="istiod"
「クラスター」→「ワークロード」→「DaemonSets」に進み、datakit 行の右側にある「設定の編集」を選択します。
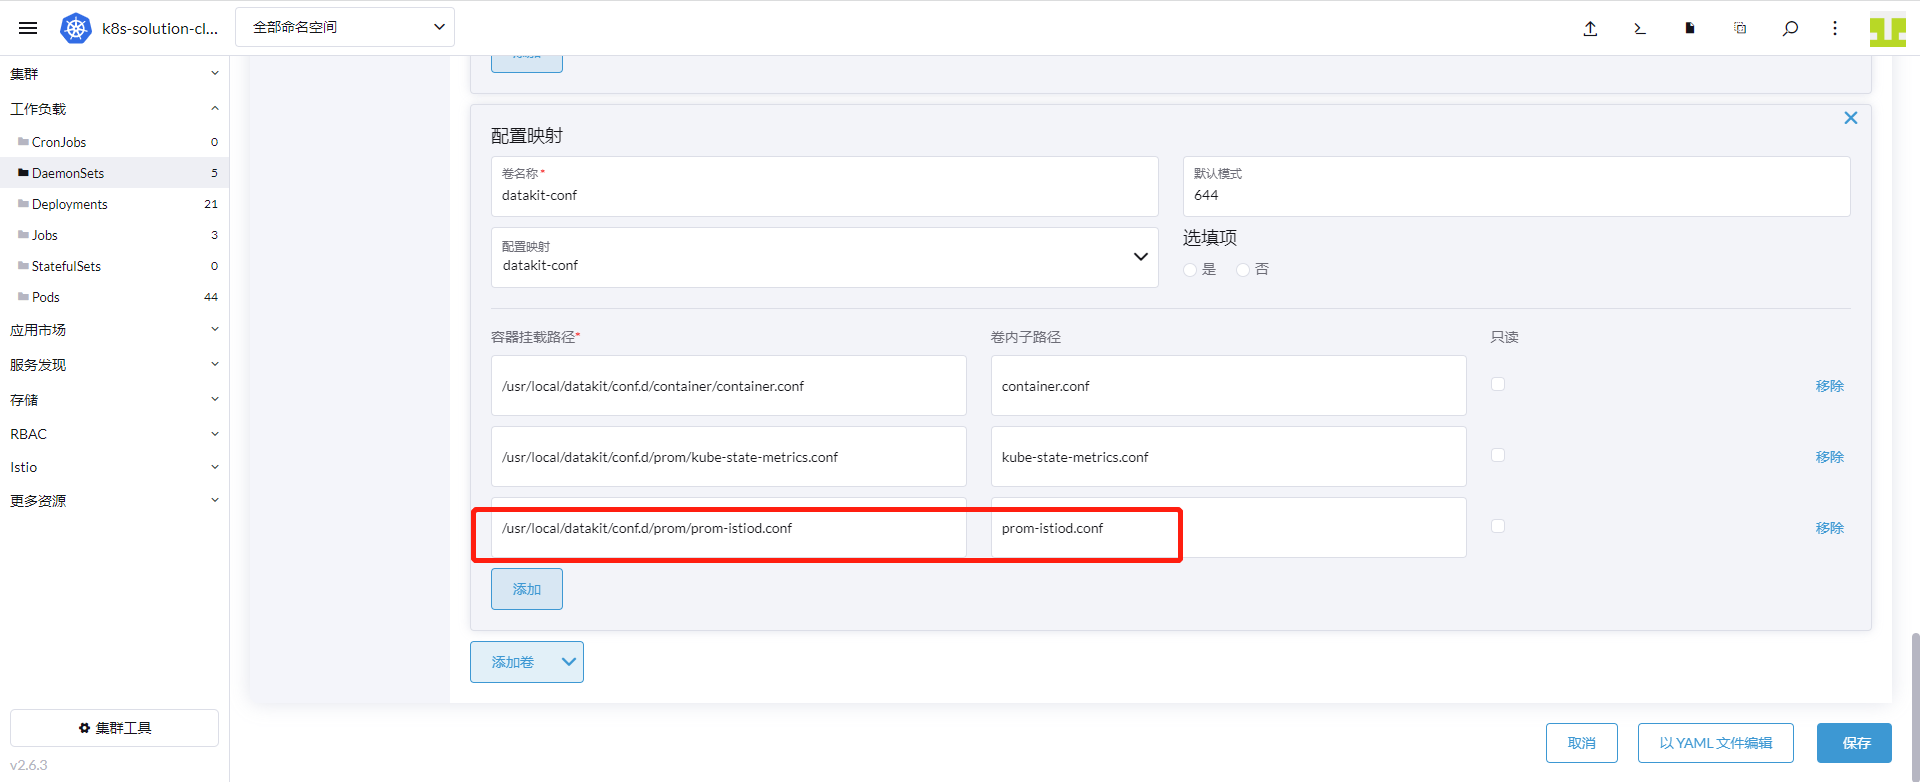
「ストレージ」をクリックし、ボリューム名が「datakit-conf」の設定マップを見つけて「追加」をクリックします。以下の内容を入力して「保存」をクリックします:
- コンテナマウントパス:
/usr/local/datakit/conf.d/prom/prom-istiod.conf - ボリューム内サブパス:
prom-istiod.conf
3.4 ingressgateway および egressgateway コレクターの有効化
ingressgateway と egressgateway の収集には、Service を使用して 15020 ポートにアクセスするため、ingressgateway と egressgateway の Service を新規作成する必要があります。
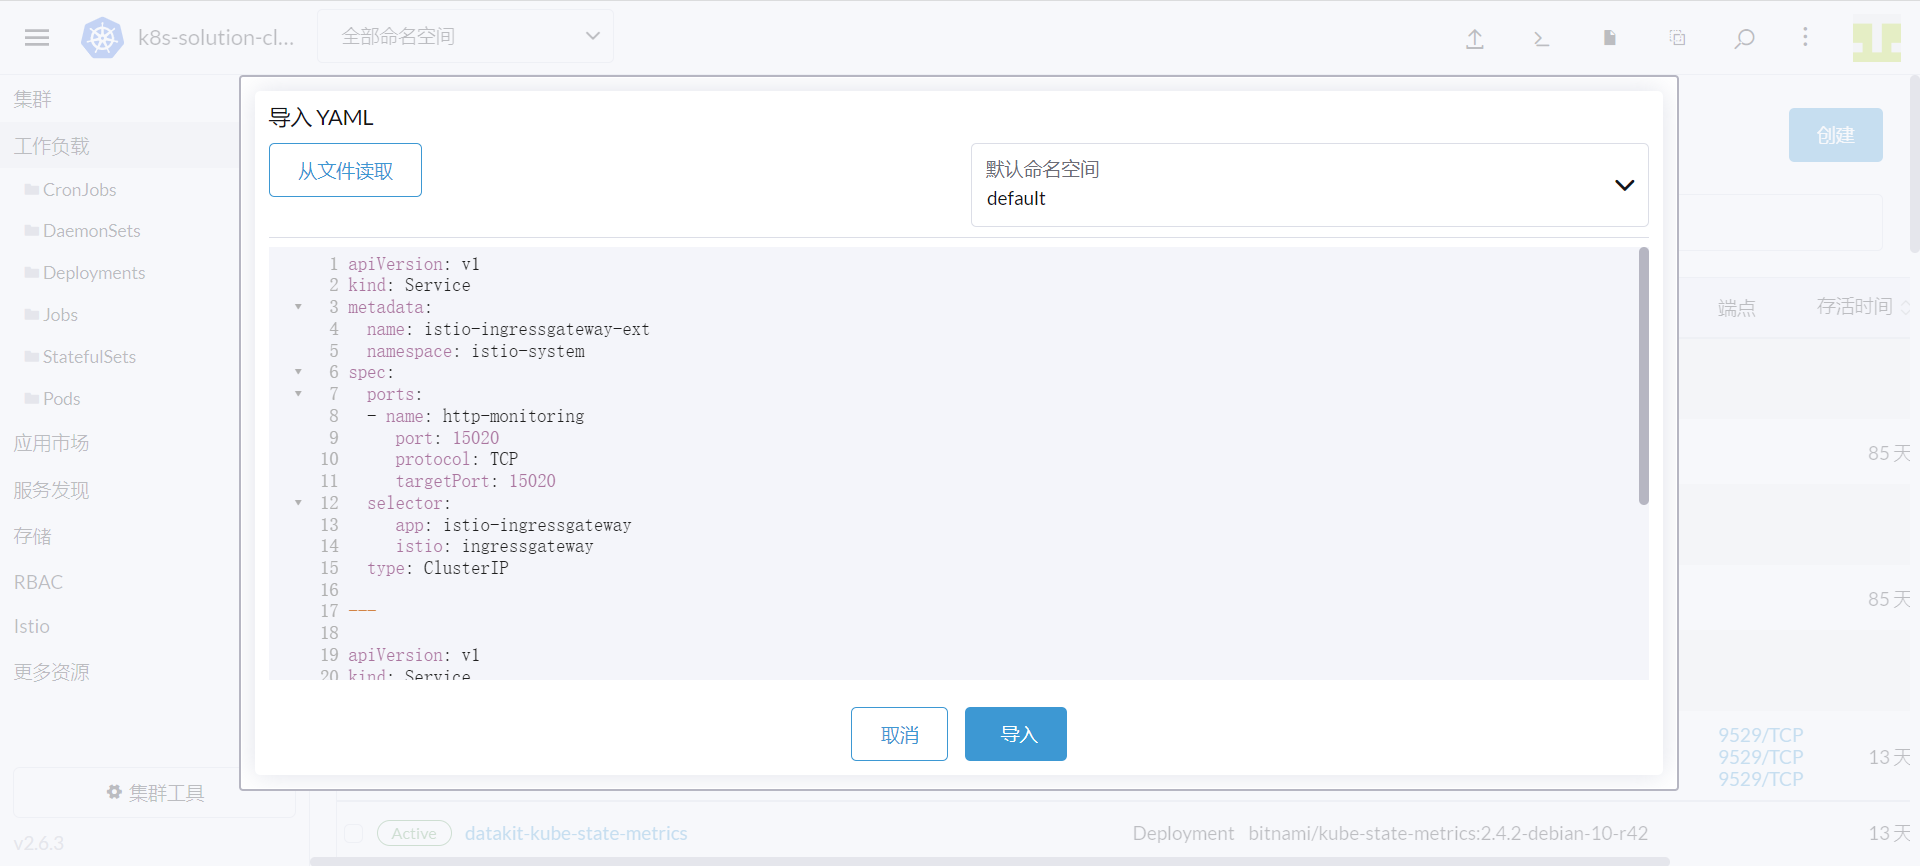
「Rancher」→「クラスター」に進み、上部の「YAML のインポート」アイコンをクリックし、以下の内容を入力して「インポート」をクリックすると Service の作成が完了します。
apiVersion: v1
kind: Service
metadata:
  name: istio-ingressgateway-ext
  namespace: istio-system
spec:
  ports:
    - name: http-monitoring
      port: 15020
      protocol: TCP
      targetPort: 15020
  selector:
    app: istio-ingressgateway
    istio: ingressgateway
  type: ClusterIP

---
apiVersion: v1
kind: Service
metadata:
  name: istio-egressgateway-ext
  namespace: istio-system
spec:
  ports:
    - name: http-monitoring
      port: 15020
      protocol: TCP
      targetPort: 15020
  selector:
    app: istio-egressgateway
    istio: egressgateway
  type: ClusterIP
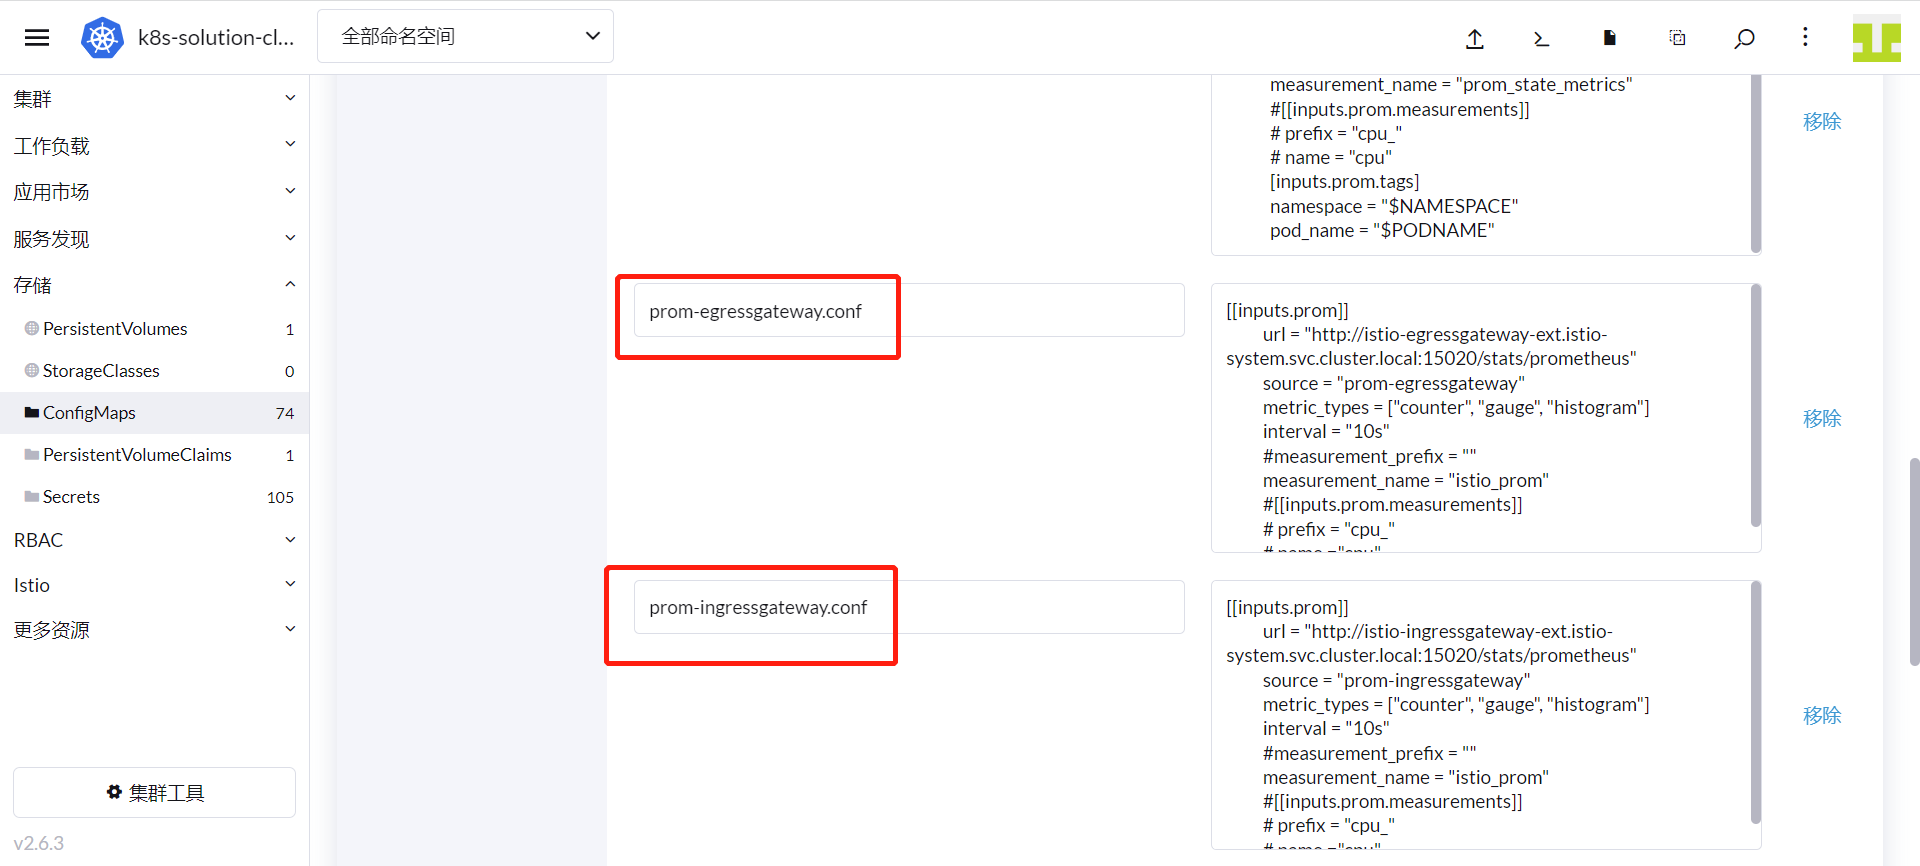
「Rancher」→「クラスター」→「ストレージ」→「ConfigMaps」に進み、datakit-conf を見つけて「設定の編集」をクリックします。
「追加」をクリックし、キーにそれぞれ「prom-ingressgateway.conf」と「prom-egressgateway.conf」を入力し、値は以下の内容を参考に入力します。「保存」をクリックします。
#### ingressgateway
prom-ingressgateway.conf: |-
  [[inputs.prom]]
    url = "http://istio-ingressgateway-ext.istio-system.svc.cluster.local:15020/stats/prometheus"
    source = "prom-ingressgateway"
    metric_types = ["counter", "gauge"]
    interval = "60s"
    tags_ignore = ["cache","cluster_type","component","destination_app","destination_canonical_revision","destination_canonical_service","destination_cluster","destination_principal","group","grpc_code","grpc_method","grpc_service","grpc_type","reason","request_protocol","request_type","resource","responce_code_class","response_flags","source_app","source_canonical_revision","source_canonical-service","source_cluster","source_principal","source_version","wasm_filter"]
    metric_name_filter = ["istio_requests_total","pilot_k8s_cfg_events","istio_build","process_virtual_memory_bytes","process_resident_memory_bytes","process_cpu_seconds_total","envoy_cluster_assignment_stale","go_goroutines","pilot_xds_pushes","pilot_proxy_convergence_time_bucket","citadel_server_root_cert_expiry_timestamp","pilot_conflict_inbound_listener","pilot_conflict_outbound_listener_http_over_current_tcp","pilot_conflict_outbound_listener_tcp_over_current_tcp","pilot_conflict_outbound_listener_tcp_over_current_http","pilot_virt_services","galley_validation_failed","pilot_services","envoy_cluster_upstream_cx_total","envoy_cluster_upstream_cx_connect_fail","envoy_cluster_upstream_cx_active","envoy_cluster_upstream_cx_rx_bytes_total","envoy_cluster_upstream_cx_tx_bytes_total","istio_request_duration_milliseconds_bucket","istio_request_duration_seconds_bucket","istio_request_bytes_bucket","istio_response_bytes_bucket"]
    #measurement_prefix = ""
    measurement_name = "istio_prom"
    #[[inputs.prom.measurements]]
    # prefix = "cpu_"
    # name ="cpu"
#### egressgateway
prom-egressgateway.conf: |-
  [[inputs.prom]]
    url = "http://istio-egressgateway-ext.istio-system.svc.cluster.local:15020/stats/prometheus"
    source = "prom-egressgateway"
    metric_types = ["counter", "gauge"]
    interval = "60s"
    tags_ignore = ["cache","cluster_type","component","destination_app","destination_canonical_revision","destination_canonical_service","destination_cluster","destination_principal","group","grpc_code","grpc_method","grpc_service","grpc_type","reason","request_protocol","request_type","resource","responce_code_class","response_flags","source_app","source_canonical_revision","source_canonical-service","source_cluster","source_principal","source_version","wasm_filter"]
    metric_name_filter = ["istio_requests_total","pilot_k8s_cfg_events","istio_build","process_virtual_memory_bytes","process_resident_memory_bytes","process_cpu_seconds_total","envoy_cluster_assignment_stale","go_goroutines","pilot_xds_pushes","pilot_proxy_convergence_time_bucket","citadel_server_root_cert_expiry_timestamp","pilot_conflict_inbound_listener","pilot_conflict_outbound_listener_http_over_current_tcp","pilot_conflict_outbound_listener_tcp_over_current_tcp","pilot_conflict_outbound_listener_tcp_over_current_http","pilot_virt_services","galley_validation_failed","pilot_services","envoy_cluster_upstream_cx_total","envoy_cluster_upstream_cx_connect_fail","envoy_cluster_upstream_cx_active","envoy_cluster_upstream_cx_rx_bytes_total","envoy_cluster_upstream_cx_tx_bytes_total","istio_request_duration_milliseconds_bucket","istio_request_duration_seconds_bucket","istio_request_bytes_bucket","istio_response_bytes_bucket"]
    #measurement_prefix = ""
    measurement_name = "istio_prom"
    #[[inputs.prom.measurements]]
    # prefix = "cpu_"
    # name ="cpu"
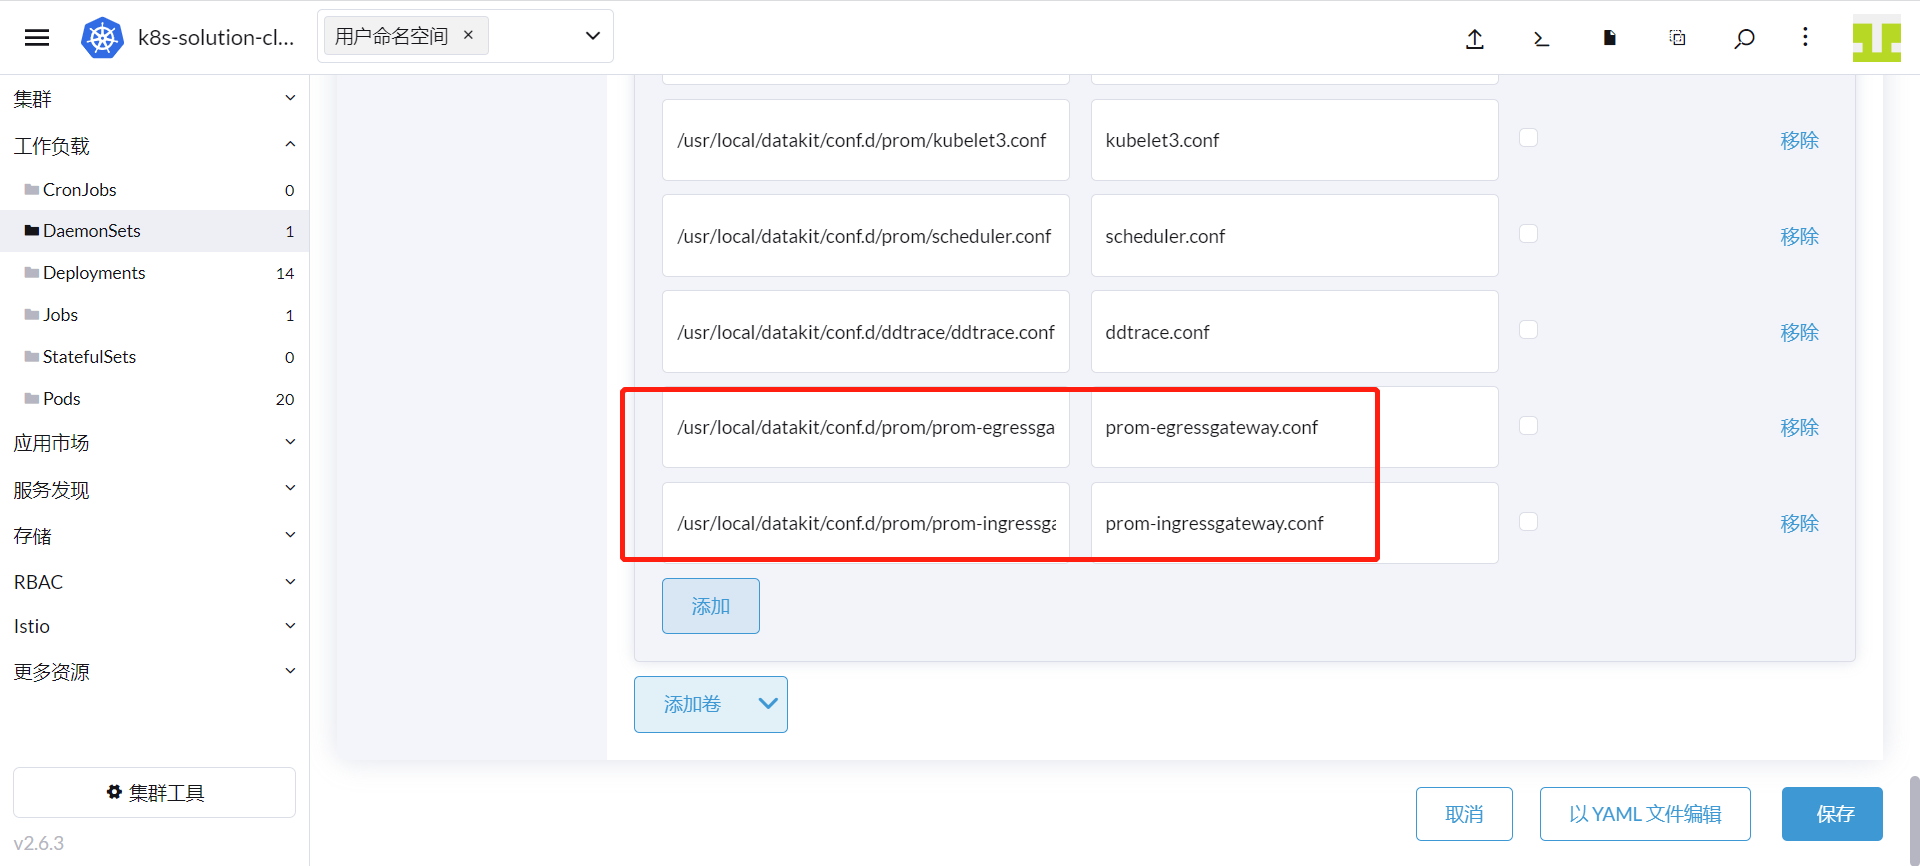
「クラスター」→「ワークロード」→「DaemonSets」に進み、datakit 行の右側にある「設定の編集」を選択します。
「ストレージ」をクリックし、ボリューム名が「datakit-conf」の設定マップを見つけて、2 回「追加」をクリックして保存します:
1 回目は「追加」をクリックし、以下の内容を入力して「保存」をクリックします:
- コンテナマウントパス:
/usr/local/datakit/conf.d/prom/prom-ingressgateway.conf - ボリューム内サブパス:
prom-ingressgateway.conf
2 回目は「追加」をクリックし、以下の内容を入力して「保存」をクリックします:
- コンテナマウントパス:
/usr/local/datakit/conf.d/prom/prom-egressgateway.conf - ボリューム内サブパス:
prom-egressgateway.conf
3.5 Zipkin コレクターの有効化
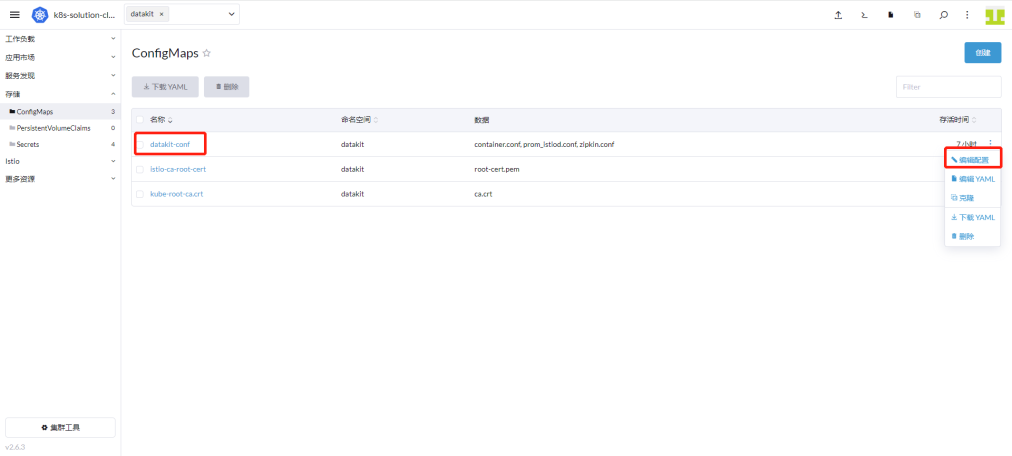
「Rancher」→「クラスター」→「ストレージ」→「ConfigMaps」に進み、datakit-conf を見つけて「設定の編集」をクリックします。
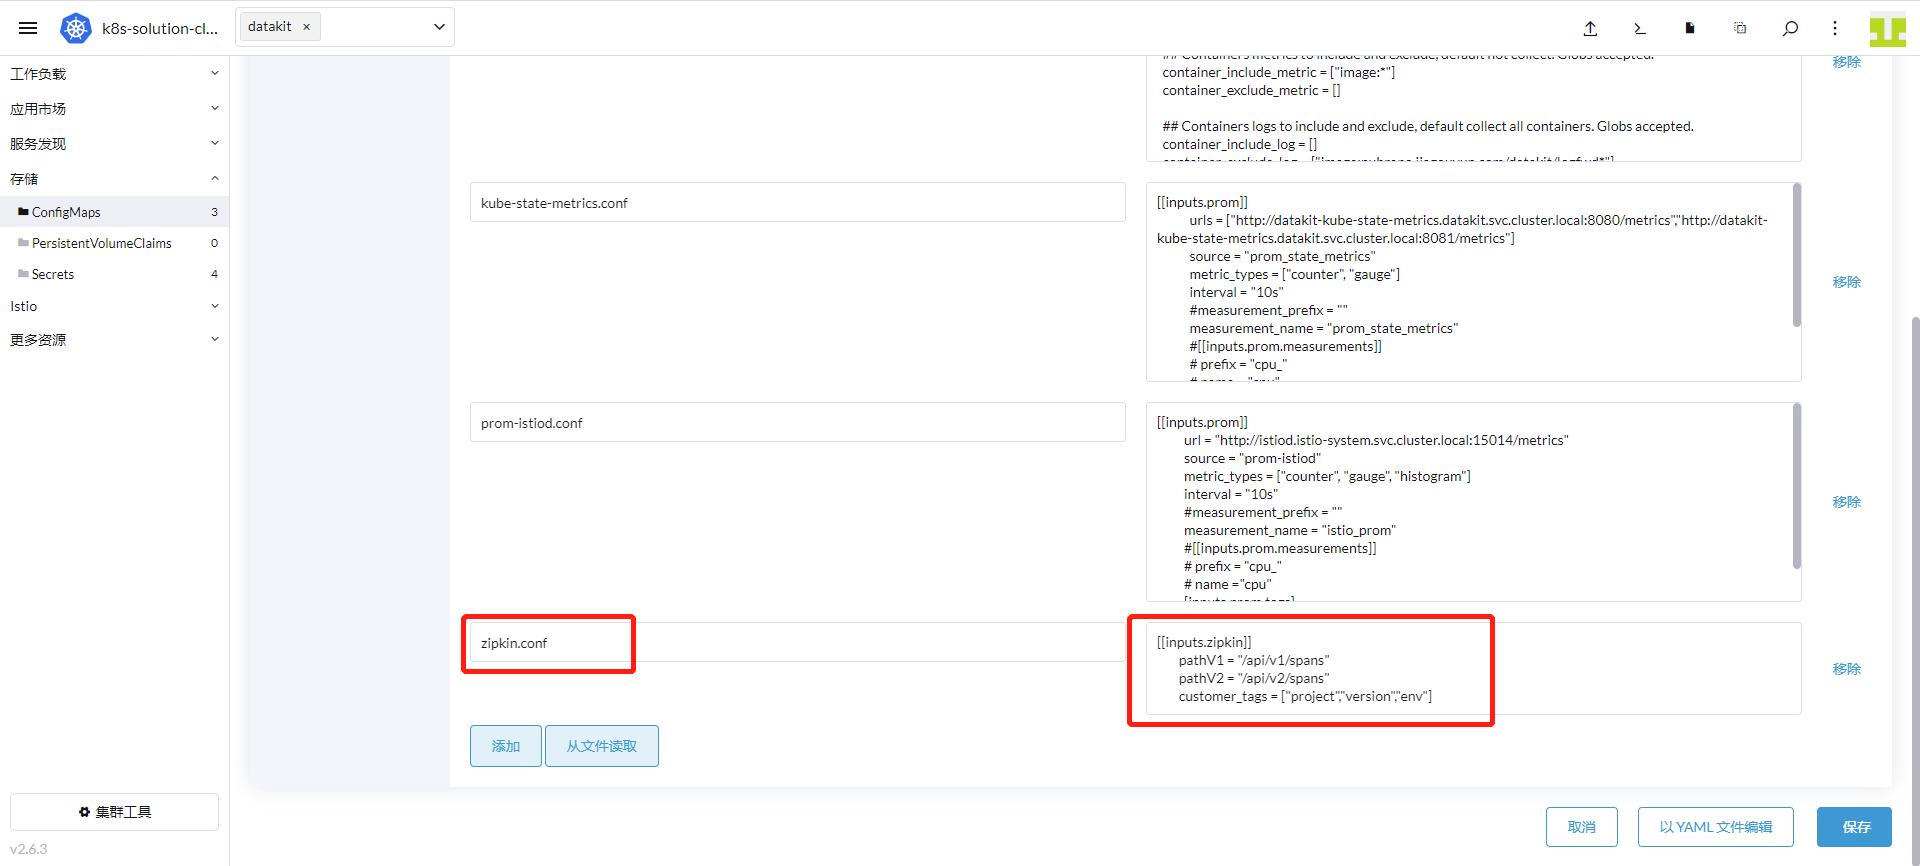
「追加」をクリックし、キーに「zipkin.conf」、値に以下の内容を入力して「保存」をクリックします。
      [[inputs.zipkin]]
        pathV1 = "/api/v1/spans"
        pathV2 = "/api/v2/spans"
        customer_tags = ["project","version","env"]
「クラスター」→「ワークロード」→「DaemonSets」に進み、datakit 行の右側にある「設定の編集」を選択します。「ストレージ」をクリックし、ボリューム名が「datakit-conf」の設定マップを見つけて「追加」をクリックし、以下の内容を入力して「保存」をクリックします:
- コンテナマウントパス:
/usr/local/datakit/conf.d/zipkin/zipkin.conf - ボリューム内サブパス:
zipkin.conf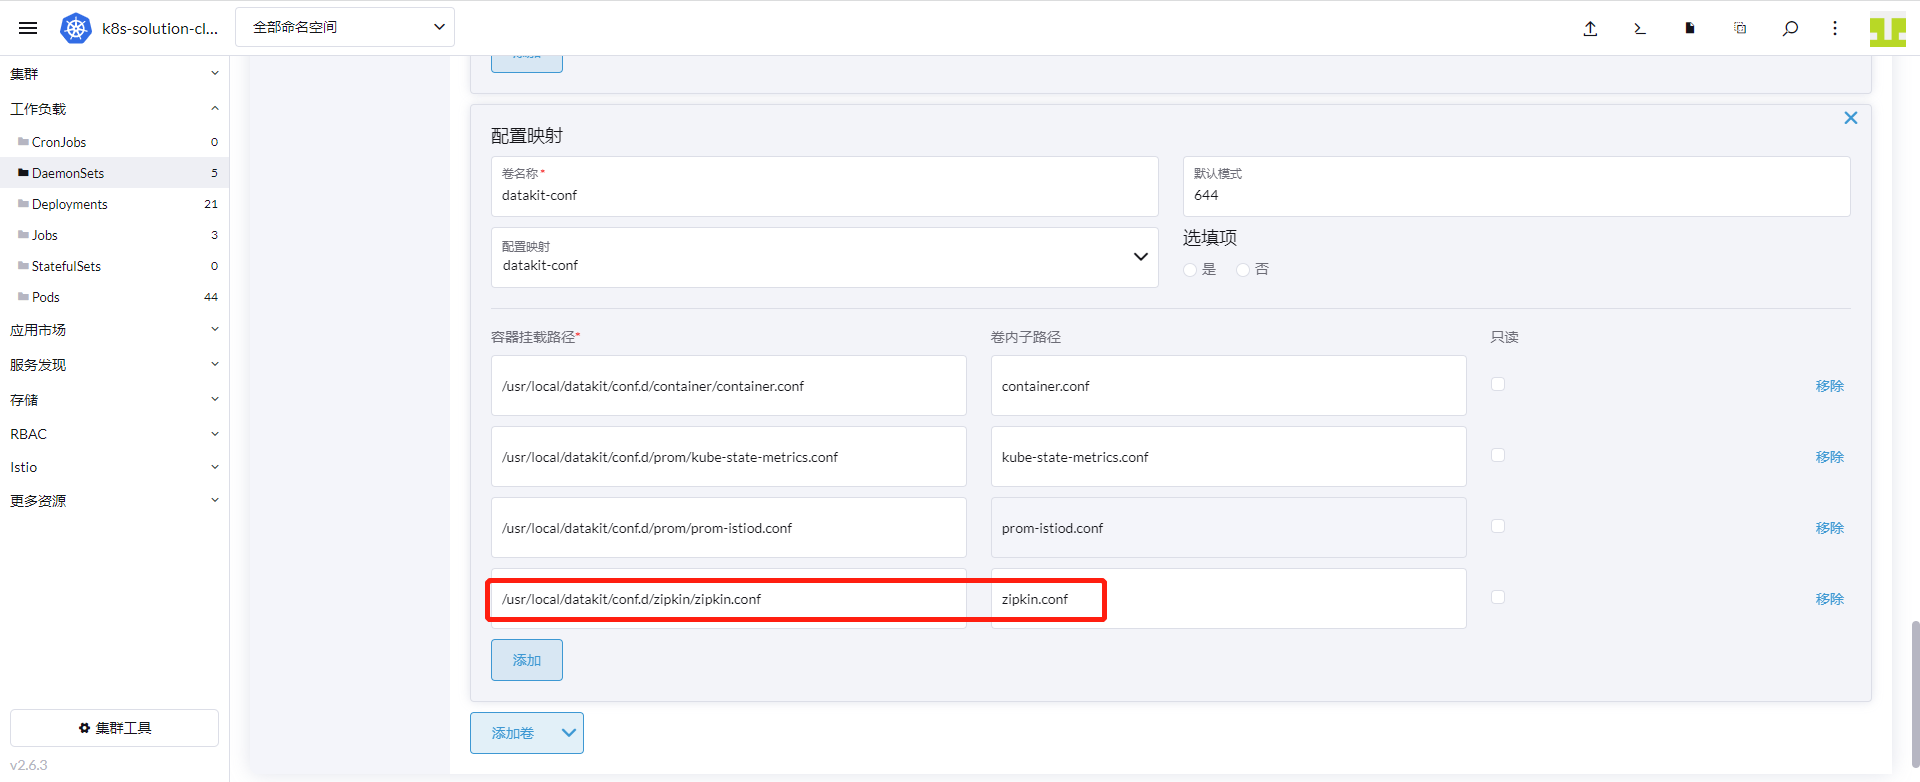
3.6 DataKit サービスのマッピング
Kubernetes クラスター内で DataKit を DaemonSet としてデプロイした後、デプロイされたアプリケーションが以前は istio-system 名前空間の zipkin サービス(ポート 9411)にトレースデータをプッシュしていた場合(アクセスアドレスは zipkin.istio-system.svc.cluster.local:9411)、Kubernetes の ExternalName サービス タイプを使用する必要があります。
まず、ClusterIP のサービス タイプを定義して 9529 ポートを 9411 に変換し、次に ExternalName サービスを使用して ClusterIP サービスを DNS 名にマッピングします。この 2 段階の変換により、アプリケーションは DataKit と通信できるようになります。
- Cluster IP サービスの定義
「Rancher」→「クラスター」→「サービスディスカバリ」→「Service」に進み、「作成」→「クラスター IP」を選択します。
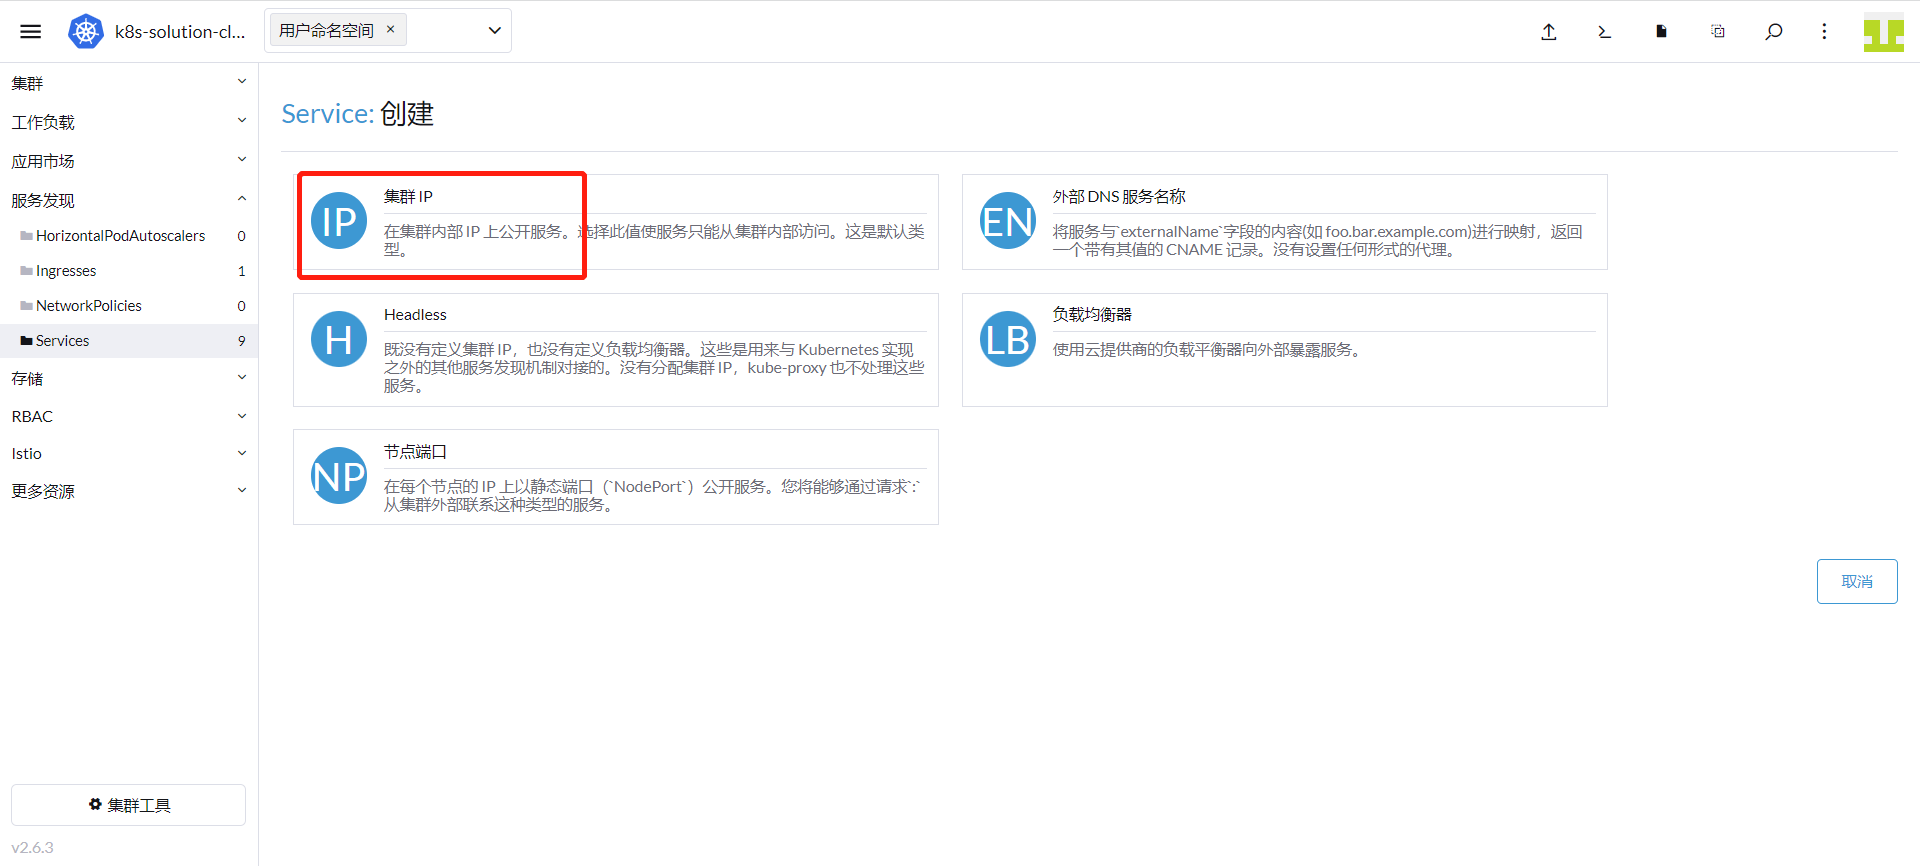
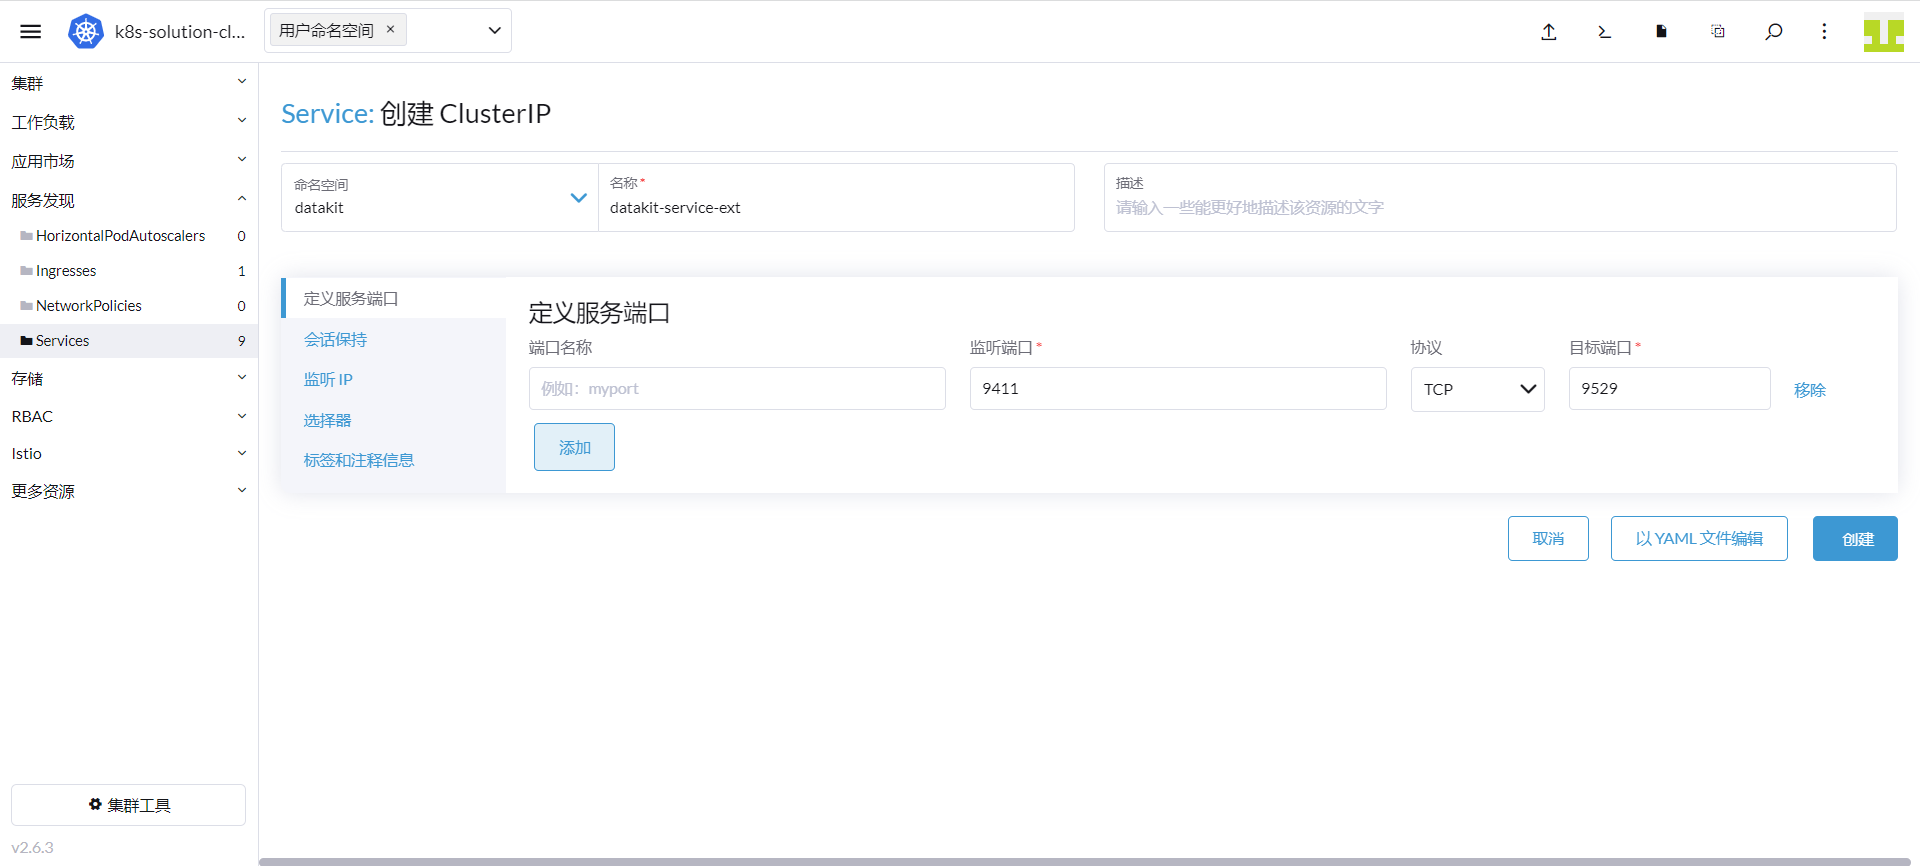
名前空間に「datakit」、名前に「datakit-service-ext」、リスニングポートに「9411」、ターゲットポートに「9529」を入力します。
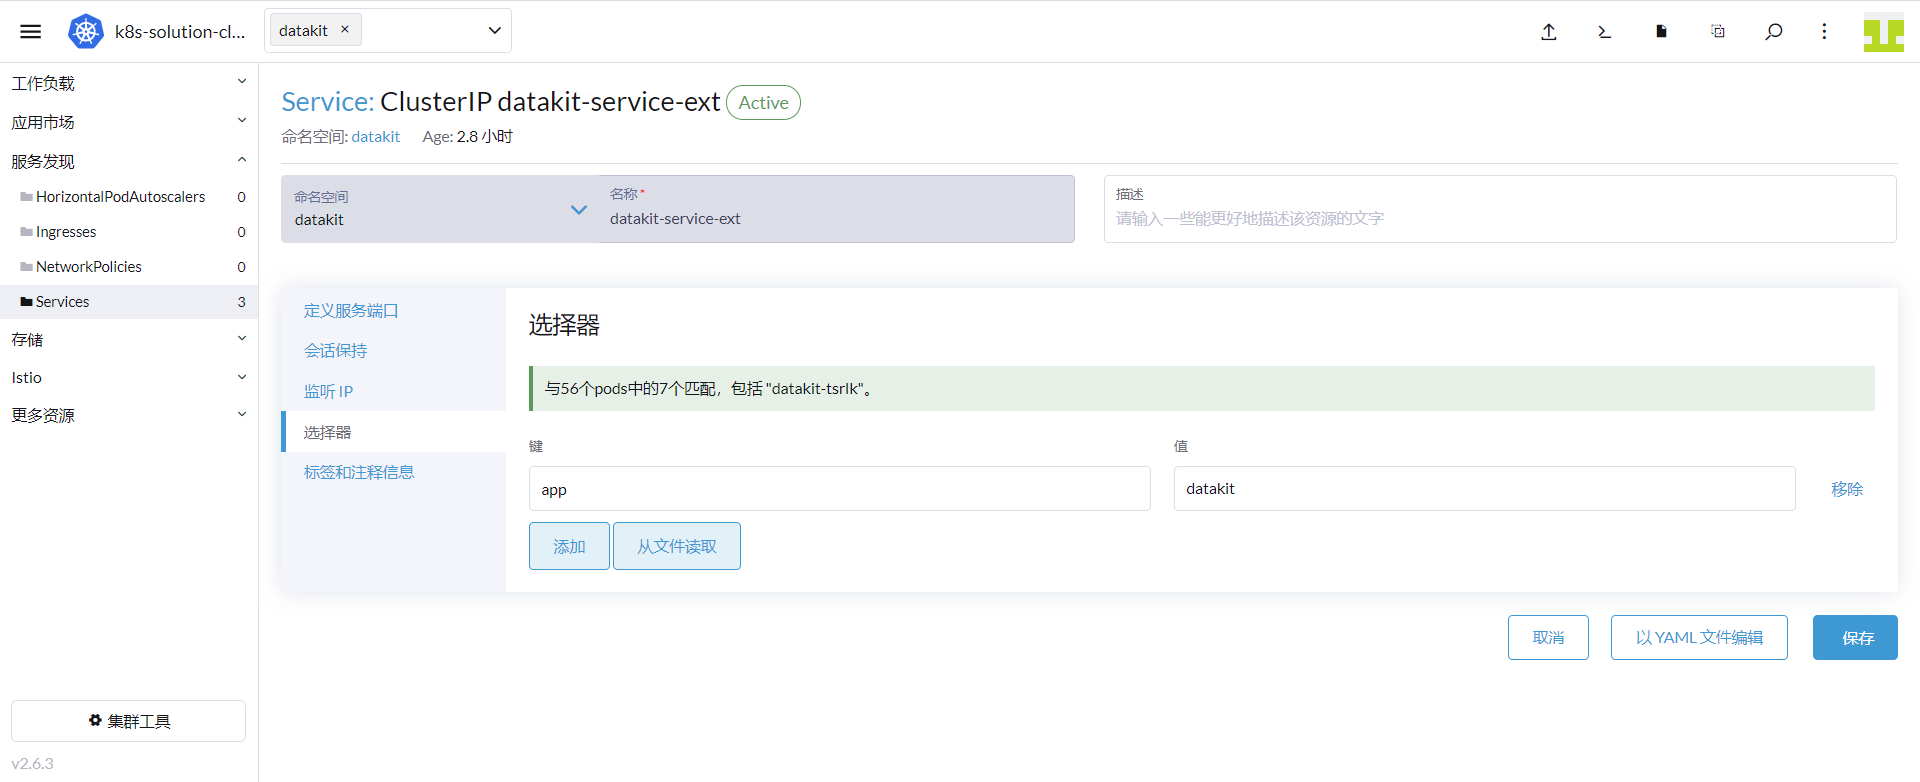
「セレクター」をクリックし、キーに「app」、値に「datakit」を入力して「保存」をクリックします。
- ExternalName サービスの定義
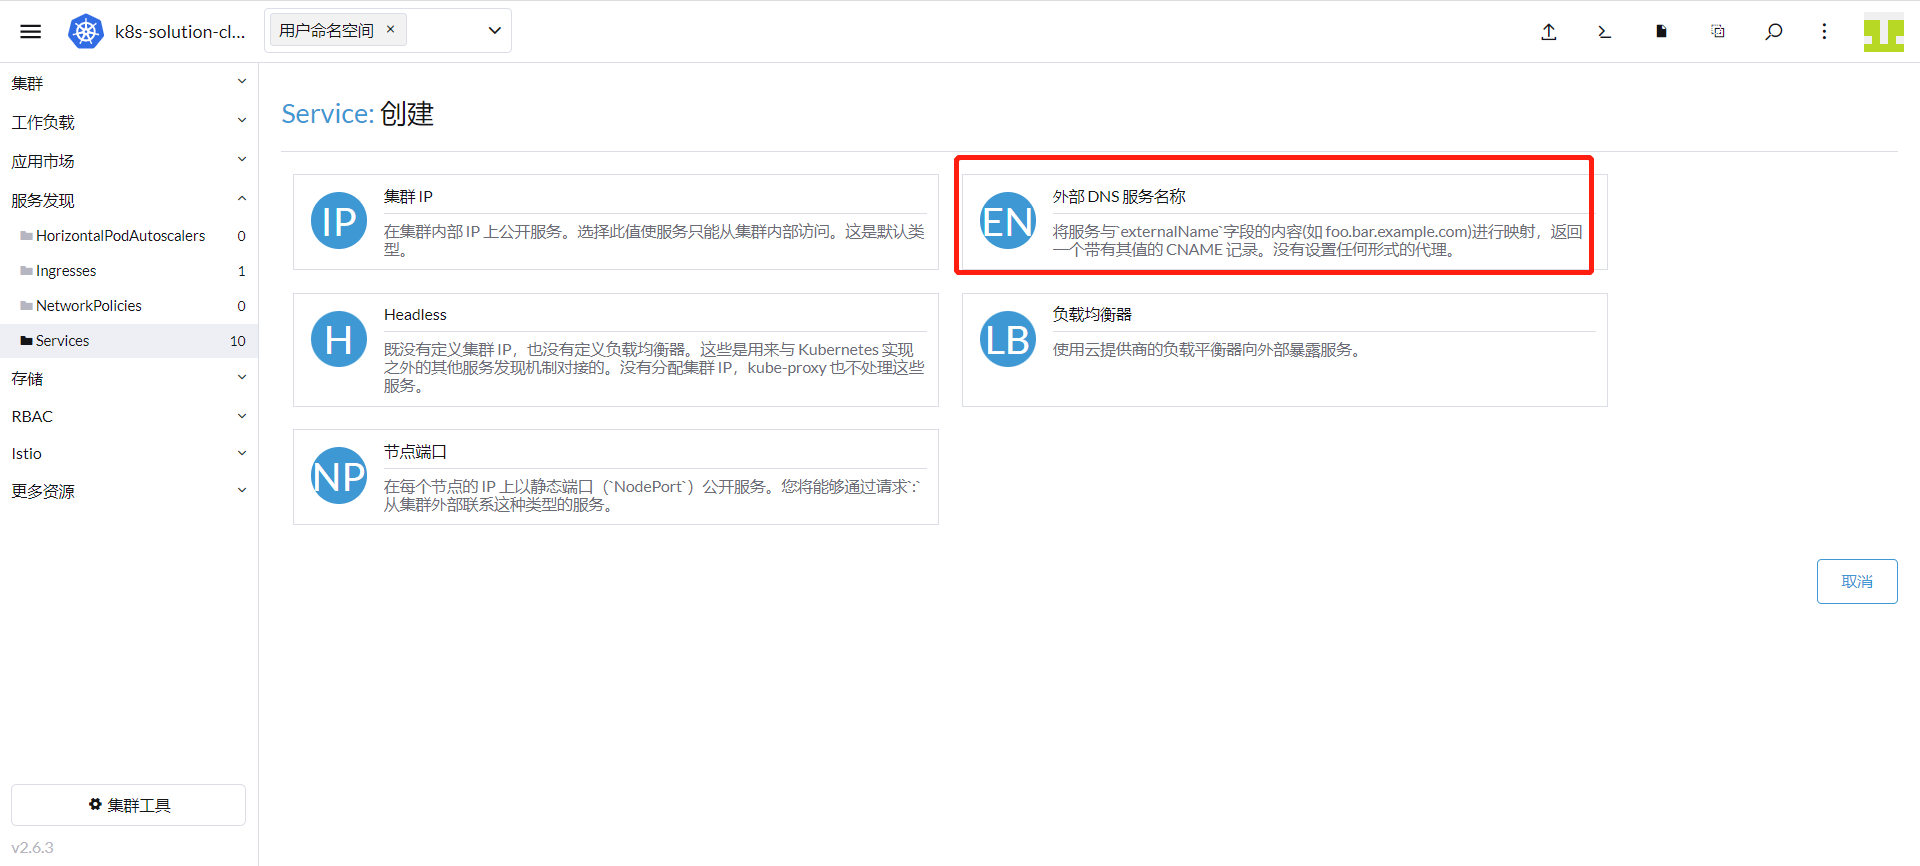
「クラスター」→「サービスディスカバリ」→「Service」に進み、「作成」→「外部 DNS サービス名」を選択します。
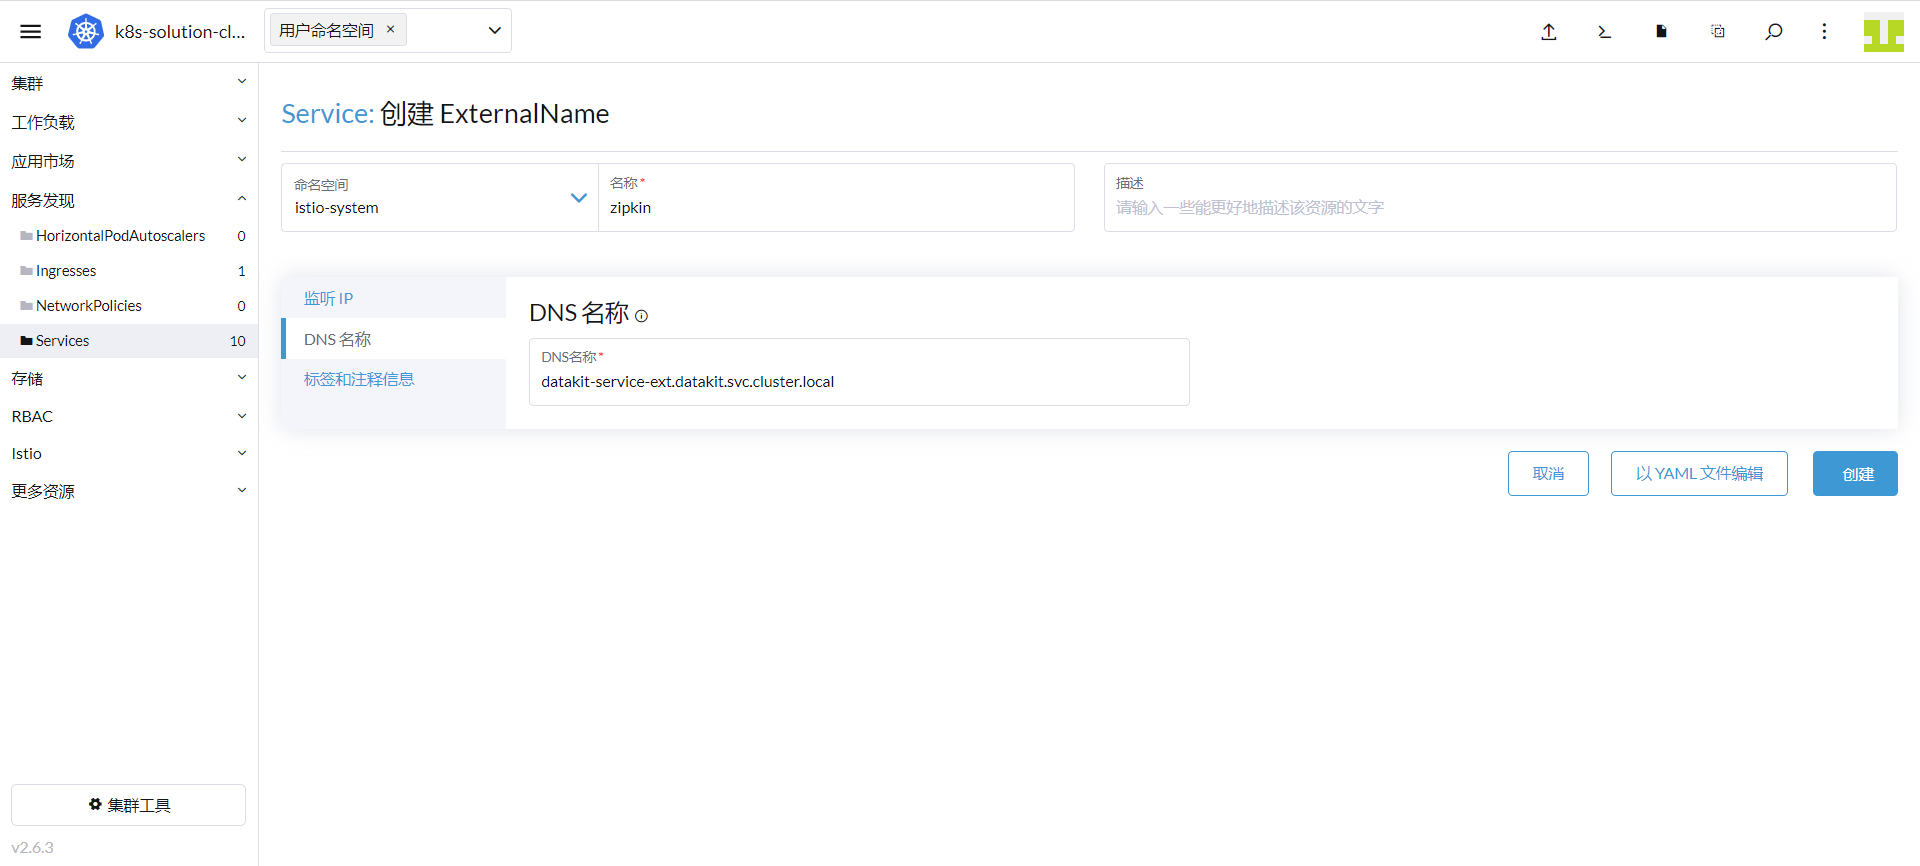
名前空間に「istio-system」、名前に「zipkin」、DNS 名に「datakit-service-ext.datakit.svc.cluster.local」を入力し、「作成」をクリックします。
3.7 Gateway リソースの作成
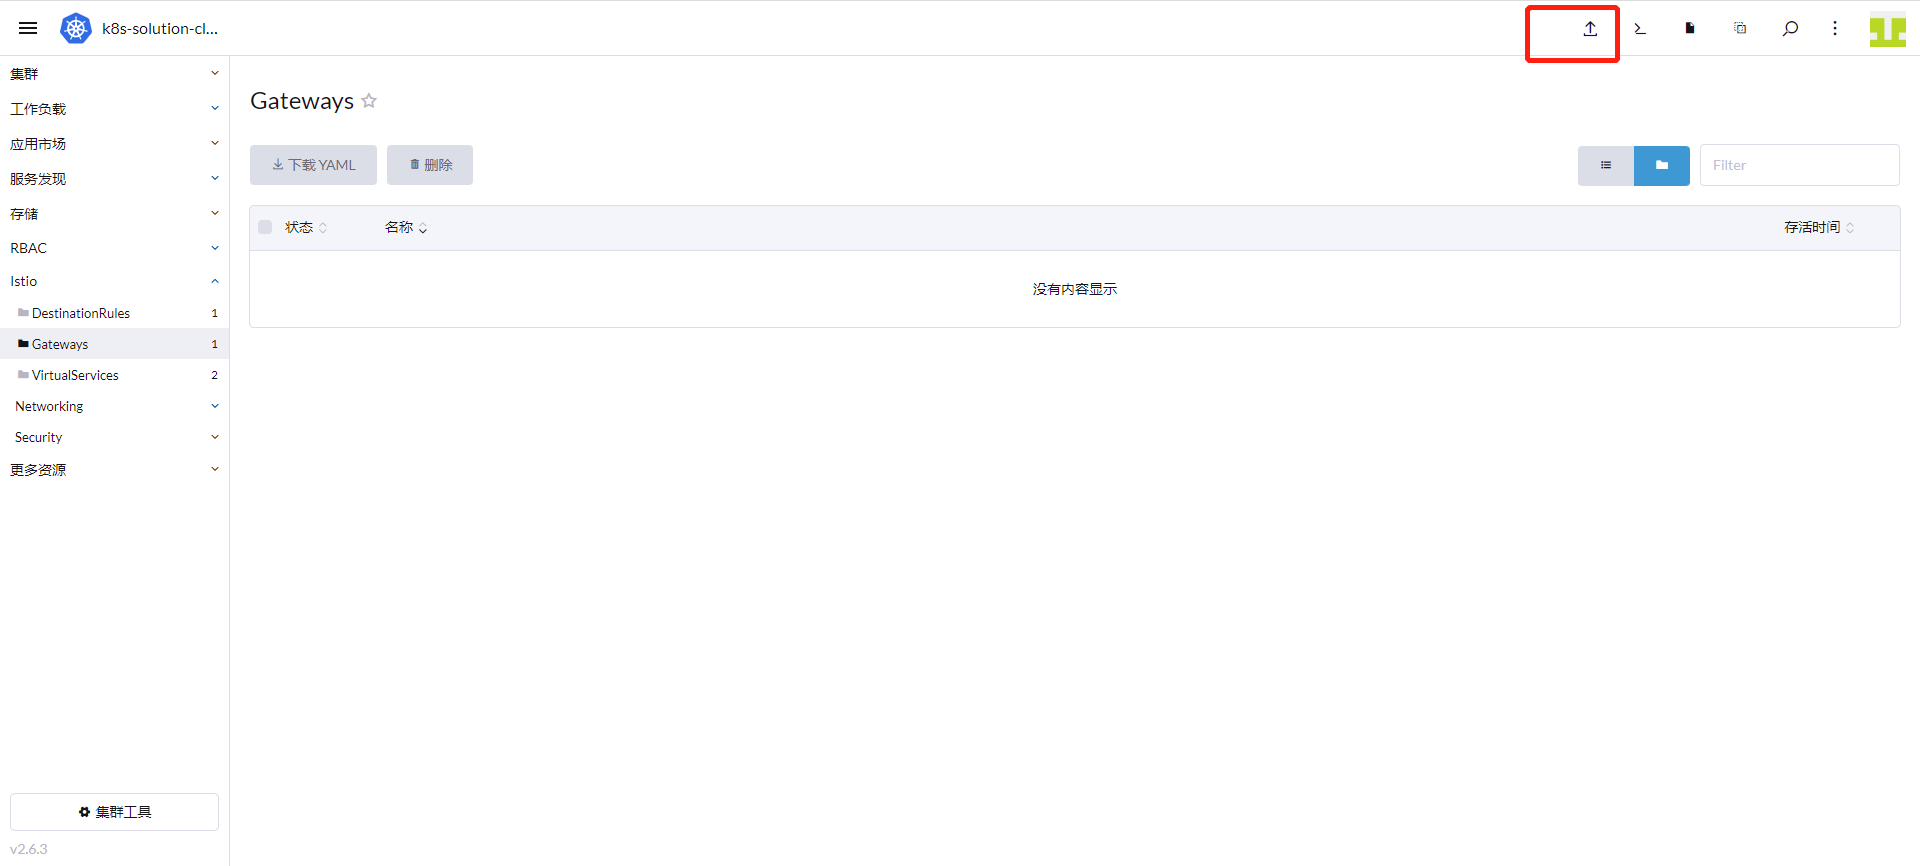
「Rancher」→「クラスター」→「Istio」→「Gateways」に進み、上部の「YAML のインポート」アイコンをクリックします。
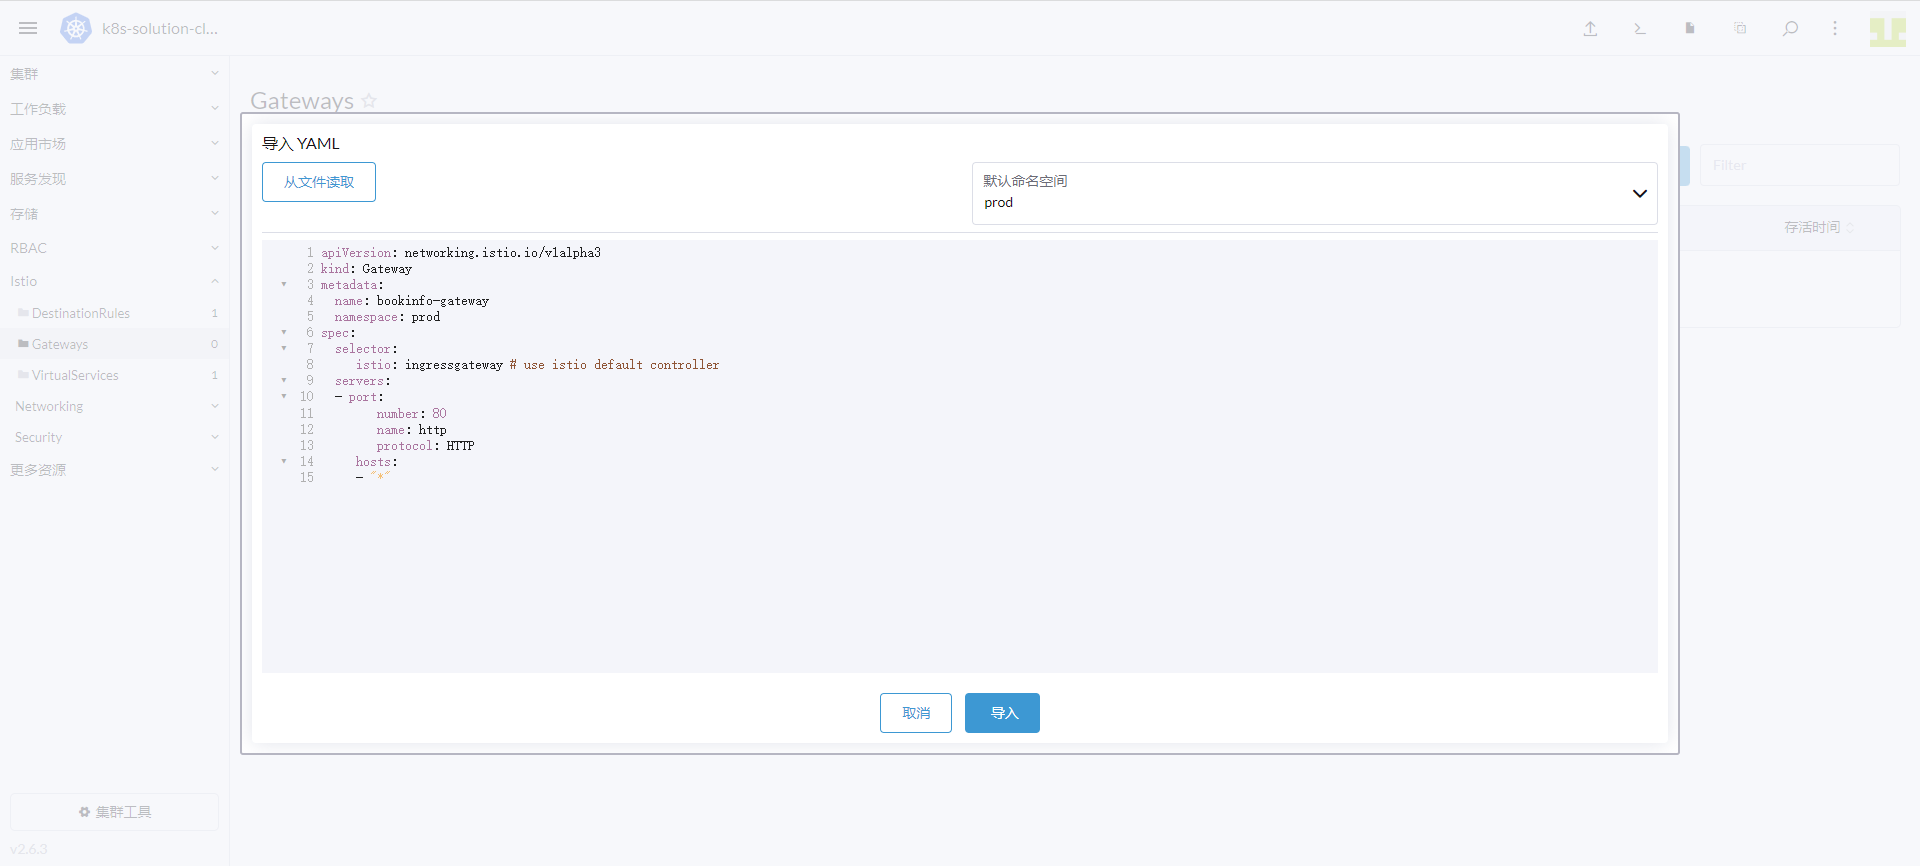
名前空間に「prod」を入力し、以下の内容を入力して「インポート」をクリックします。
apiVersion: networking.istio.io/v1alpha3
kind: Gateway
metadata:
  name: bookinfo-gateway
  namespace: prod
spec:
  selector:
    istio: ingressgateway # use istio default controller
  servers:
    - port:
        number: 80
        name: http
        protocol: HTTP
      hosts:
        - "*"
3.8 仮想サービスの作成
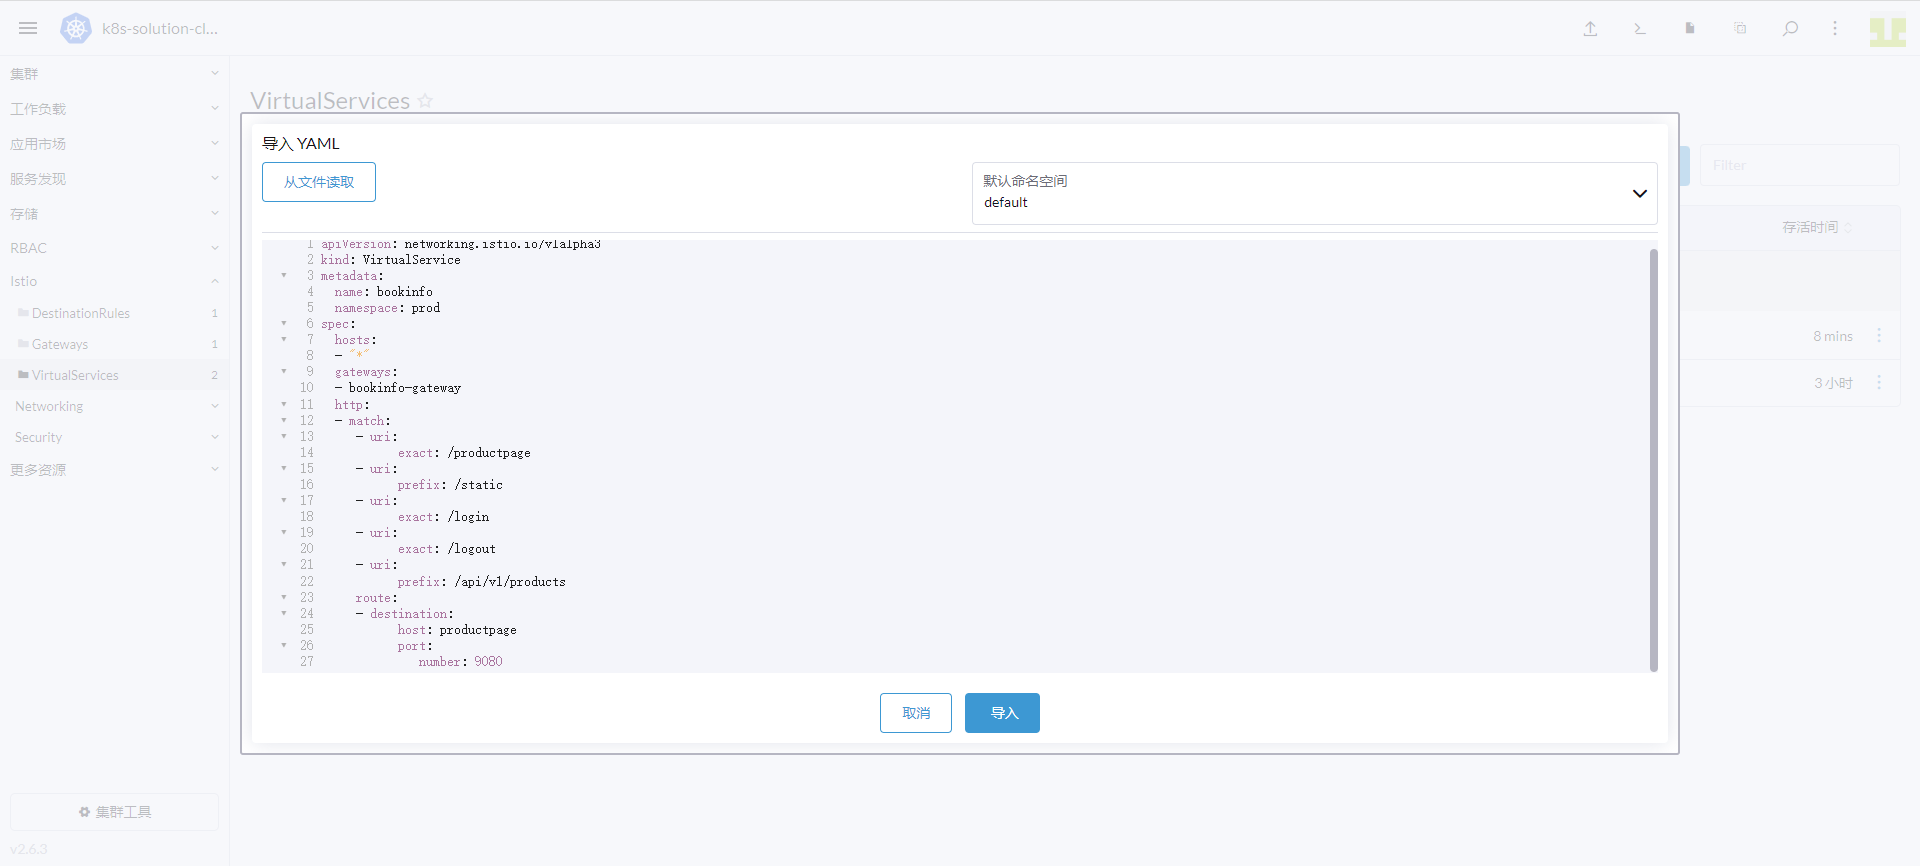
「Rancher」→「クラスター」→「Istio」→「VirtualServices」に進み、上部の「YAML のインポート」アイコンをクリックします。
名前空間に「prod」を入力し、以下の内容を入力して「インポート」をクリックします。
apiVersion: networking.istio.io/v1alpha3
kind: VirtualService
metadata:
  name: bookinfo
  namespace: prod
spec:
  hosts:
    - "*"
  gateways:
    - bookinfo-gateway
  http:
    - match:
        - uri:
            exact: /productpage
        - uri:
            prefix: /static
        - uri:
            exact: /login
        - uri:
            exact: /logout
        - uri:
            prefix: /api/v1/products
      route:
        - destination:
            host: productpage
            port:
              number: 9080
3.9 productpage、details、ratings の作成
ここでは、Pod に annotations を追加して Pod のメトリクスを収集します。追加する内容は以下の通りです。
annotations:
  datakit/prom.instances: |
    [[inputs.prom]]
      url = "http://$IP:15020/stats/prometheus"
      source = "bookinfo-istio-product"
      metric_types = ["counter", "gauge"]
      interval = "60s"
      tags_ignore = ["cache","cluster_type","component","destination_app","destination_canonical_revision","destination_canonical_service","destination_cluster","destination_principal","group","grpc_code","grpc_method","grpc_service","grpc_type","reason","request_protocol","request_type","resource","responce_code_class","response_flags","source_app","source_canonical_revision","source_canonical-service","source_cluster","source_principal","source_version","wasm_filter"]
      metric_name_filter = ["istio_requests_total","pilot_k8s_cfg_events","istio_build","process_virtual_memory_bytes","process_resident_memory_bytes","process_cpu_seconds_total","envoy_cluster_assignment_stale","go_goroutines","pilot_xds_pushes","pilot_proxy_convergence_time_bucket","citadel_server_root_cert_expiry_timestamp","pilot_conflict_inbound_listener","pilot_conflict_outbound_listener_http_over_current_tcp","pilot_conflict_outbound_listener_tcp_over_current_tcp","pilot_conflict_outbound_listener_tcp_over_current_http","pilot_virt_services","galley_validation_failed","pilot_services","envoy_cluster_upstream_cx_total","envoy_cluster_upstream_cx_connect_fail","envoy_cluster_upstream_cx_active","envoy_cluster_upstream_cx_rx_bytes_total","envoy_cluster_upstream_cx_tx_bytes_total","istio_request_duration_milliseconds_bucket","istio_request_duration_seconds_bucket","istio_request_bytes_bucket","istio_response_bytes_bucket"]
      #measurement_prefix = ""
      measurement_name = "istio_prom"
      #[[inputs.prom.measurements]]
      # prefix = "cpu_"
      # name = "cpu"
      [inputs.prom.tags]
      namespace = "$NAMESPACE"
  proxy.istio.io/config: |
    tracing:
      zipkin:
        address: zipkin.istio-system:9411
      custom_tags:
        project:
          literal:
            value: "productpage"
        version:
          literal:
            value: "v1"
        env:
          literal:
            value: "test"
パラメータ説明:
- url:Exporter アドレス
- source:コレクター名
- metric_types:メトリクスタイプのフィルター
- measurement_name:収集後のメジャーメント名
- interval:メトリクス収集の頻度(秒)
- $IP:Pod の内部 IP を通貨
- $NAMESPACE:Pod が属する名前空間
- tags_ignore:無視するタグ
以下は、productpage、details、ratings の完全なデプロイファイルです。
完全なデプロイファイル
##################################################################################################
# Details service
##################################################################################################
apiVersion: v1
kind: Service
metadata:
  name: details
  namespace: prod
  labels:
    app: details
    service: details
spec:
  ports:
  - port: 9080
    name: http
  selector:
    app: details
---
apiVersion: v1
kind: ServiceAccount
metadata:
  name: bookinfo-details
  namespace: prod
  labels:
    account: details
---
apiVersion: apps/v1
kind: Deployment
metadata:
  name: details-v1
  namespace: prod
  labels:
    app: details
    version: v1
spec:
  replicas: 1
  selector:
    matchLabels:
      app: details
      version: v1
  template:
    metadata:
      labels:
        app: details
        version: v1
      annotations:
        datakit/prom.instances: |
          [[inputs.prom]]
            url = "http://$IP:15020/stats/prometheus"
            source = "bookinfo-istio-details"
            metric_types = ["counter", "gauge"]
            interval = "60s"
      tags_ignore = ["cache","cluster_type","component","destination_app","destination_canonical_revision","destination_canonical_service","destination_cluster","destination_principal","group","grpc_code","grpc_method","grpc_service","grpc_type","reason","request_protocol","request_type","resource","responce_code_class","response_flags","source_app","source_canonical_revision","source_canonical-service","source_cluster","source_principal","source_version","wasm_filter"]
            metric_name_filter = ["istio_requests_total","pilot_k8s_cfg_events","istio_build","process_virtual_memory_bytes","process_resident_memory_bytes","process_cpu_seconds_total","envoy_cluster_assignment_stale","go_goroutines","pilot_xds_pushes","pilot_proxy_convergence_time_bucket","citadel_server_root_cert_expiry_timestamp","pilot_conflict_inbound_listener","pilot_conflict_outbound_listener_http_over_current_tcp","pilot_conflict_outbound_listener_tcp_over_current_tcp","pilot_conflict_outbound_listener_tcp_over_current_http","pilot_virt_services","galley_validation_failed","pilot_services","envoy_cluster_upstream_cx_total","envoy_cluster_upstream_cx_connect_fail","envoy_cluster_upstream_cx_active","envoy_cluster_upstream_cx_rx_bytes_total","envoy_cluster_upstream_cx_tx_bytes_total","istio_request_duration_milliseconds_bucket","istio_request_duration_seconds_bucket","istio_request_bytes_bucket","istio_response_bytes_bucket"]
            #measurement_prefix = ""
            measurement_name = "istio_prom"
            #[[inputs.prom.measurements]]
            # prefix = "cpu_"
            # name = "cpu"
            [inputs.prom.tags]
            namespace = "$NAMESPACE"
        proxy.istio.io/config: |
          tracing:
            zipkin:
              address: zipkin.istio-system:9411
            custom_tags:
              project:
                literal:
                  value: "details"
              version:
                literal:
                  value: "v1"
              env:
                literal:
                  value: "test"
    spec:
      serviceAccountName: bookinfo-details
      containers:
      - name: details
        image: docker.io/istio/examples-bookinfo-details-v1:1.16.2
        imagePullPolicy: IfNotPresent
        ports:
        - containerPort: 9080
        securityContext:
          runAsUser: 1000
---
##################################################################################################
# Ratings service
##################################################################################################
apiVersion: v1
kind: Service
metadata:
  name: ratings
  namespace: prod
  labels:
    app: ratings
    service: ratings
spec:
  ports:
  - port: 9080
    name: http
  selector:
    app: ratings
---
apiVersion: v1
kind: ServiceAccount
metadata:
  name: bookinfo-ratings
  namespace: prod
  labels:
    account: ratings
---
apiVersion: apps/v1
kind: Deployment
metadata:
  name: ratings-v1
  namespace: prod
  labels:
    app: ratings
    version: v1
spec:
  replicas: 1
  selector:
    matchLabels:
      app: ratings
      version: v1
  template:
    metadata:
      labels:
        app: ratings
        version: v1
      annotations:
        datakit/prom.instances: |
          [[inputs.prom]]
            url = "http://$IP:15020/stats/prometheus"
            source = "bookinfo-istio-ratings"
            metric_types = ["counter", "gauge"]
            interval = "60s"
      tags_ignore = ["cache","cluster_type","component","destination_app","destination_canonical_revision","destination_canonical_service","destination_cluster","destination_principal","group","grpc_code","grpc_method","grpc_service","grpc_type","reason","request_protocol","request_type","resource","responce_code_class","response_flags","source_app","source_canonical_revision","source_canonical-service","source_cluster","source_principal","source_version","wasm_filter"]
            metric_name_filter = ["istio_requests_total","pilot_k8s_cfg_events","istio_build","process_virtual_memory_bytes","process_resident_memory_bytes","process_cpu_seconds_total","envoy_cluster_assignment_stale","go_goroutines","pilot_xds_pushes","pilot_proxy_convergence_time_bucket","citadel_server_root_cert_expiry_timestamp","pilot_conflict_inbound_listener","pilot_conflict_outbound_listener_http_over_current_tcp","pilot_conflict_outbound_listener_tcp_over_current_tcp","pilot_conflict_outbound_listener_tcp_over_current_http","pilot_virt_services","galley_validation_failed","pilot_services","envoy_cluster_upstream_cx_total","envoy_cluster_upstream_cx_connect_fail","envoy_cluster_upstream_cx_active","envoy_cluster_upstream_cx_rx_bytes_total","envoy_cluster_upstream_cx_tx_bytes_total","istio_request_duration_milliseconds_bucket","istio_request_duration_seconds_bucket","istio_request_bytes_bucket","istio_response_bytes_bucket"]
            #measurement_prefix = ""
            measurement_name = "istio_prom"
            #[[inputs.prom.measurements]]
            # prefix = "cpu_"
            # name = "cpu"
            [inputs.prom.tags]
            namespace = "$NAMESPACE"
        proxy.istio.io/config: |
          tracing:
            zipkin:
              address: zipkin.istio-system:9411
            custom_tags:
              project:
                literal:
                  value: "ratings"
              version:
                literal:
                  value: "v1"
              env:
                literal:
                  value: "test"
    spec:
      serviceAccountName: bookinfo-ratings
      containers:
      - name: ratings
        image: docker.io/istio/examples-bookinfo-ratings-v1:1.16.2
        imagePullPolicy: IfNotPresent
        ports:
        - containerPort: 9080
        securityContext:
          runAsUser: 1000
---
##################################################################################################
# Productpage services
##################################################################################################
apiVersion: v1
kind: Service
metadata:
  name: productpage
  namespace: prod
  labels:
    app: productpage
    service: productpage
spec:
  ports:
  - port: 9080
    name: http
  selector:
    app: productpage
---
apiVersion: v1
kind: ServiceAccount
metadata:
  name: bookinfo-productpage
  namespace: prod
  labels:
    account: productpage
---
apiVersion: apps/v1
kind: Deployment
metadata:
  name: productpage-v1
  namespace: prod
  labels:
    app: productpage
    version: v1
spec:
  replicas: 1
  selector:
    matchLabels:
      app: productpage
      version: v1
  template:
    metadata:
      labels:
        app: productpage
        version: v1
      annotations:
        datakit/prom.instances: |
          [[inputs.prom]]
            url = "http://$IP:15020/stats/prometheus"
            source = "bookinfo-istio-product"
            metric_types = ["counter", "gauge"]
            interval = "60s"
      tags_ignore = ["cache","cluster_type","component","destination_app","destination_canonical_revision","destination_canonical_service","destination_cluster","destination_principal","group","grpc_code","grpc_method","grpc_service","grpc_type","reason","request_protocol","request_type","resource","responce_code_class","response_flags","source_app","source_canonical_revision","source_canonical-service","source_cluster","source_principal","source_version","wasm_filter"]
            metric_name_filter = ["istio_requests_total","pilot_k8s_cfg_events","istio_build","process_virtual_memory_bytes","process_resident_memory_bytes","process_cpu_seconds_total","envoy_cluster_assignment_stale","go_goroutines","pilot_xds_pushes","pilot_proxy_convergence_time_bucket","citadel_server_root_cert_expiry_timestamp","pilot_conflict_inbound_listener","pilot_conflict_outbound_listener_http_over_current_tcp","pilot_conflict_outbound_listener_tcp_over_current_tcp","pilot_conflict_outbound_listener_tcp_over_current_http","pilot_virt_services","galley_validation_failed","pilot_services","envoy_cluster_upstream_cx_total","envoy_cluster_upstream_cx_connect_fail","envoy_cluster_upstream_cx_active","envoy_cluster_upstream_cx_rx_bytes_total","envoy_cluster_upstream_cx_tx_bytes_total","istio_request_duration_milliseconds_bucket","istio_request_duration_seconds_bucket","istio_request_bytes_bucket","istio_response_bytes_bucket"]
            #measurement_prefix = ""
            measurement_name = "istio_prom"
            #[[inputs.prom.measurements]]
            # prefix = "cpu_"
            # name = "cpu"
            [inputs.prom.tags]
            namespace = "$NAMESPACE"
        proxy.istio.io/config: |
          tracing:
            zipkin:
              address: zipkin.istio-system:9411
            custom_tags:
              project:
                literal:
                  value: "productpage"
              version:
                literal:
                  value: "v1"
              env:
                literal:
                  value: "test"
    spec:
      serviceAccountName: bookinfo-productpage
      containers:
      - name: productpage
        image: docker.io/istio/examples-bookinfo-productpage-v1:1.16.2
        imagePullPolicy: IfNotPresent
        ports:
        - containerPort: 9080
        volumeMounts:
        - name: tmp
          mountPath: /tmp
        securityContext:
          runAsUser: 1000
      volumes:
      - name: tmp
        emptyDir: {}
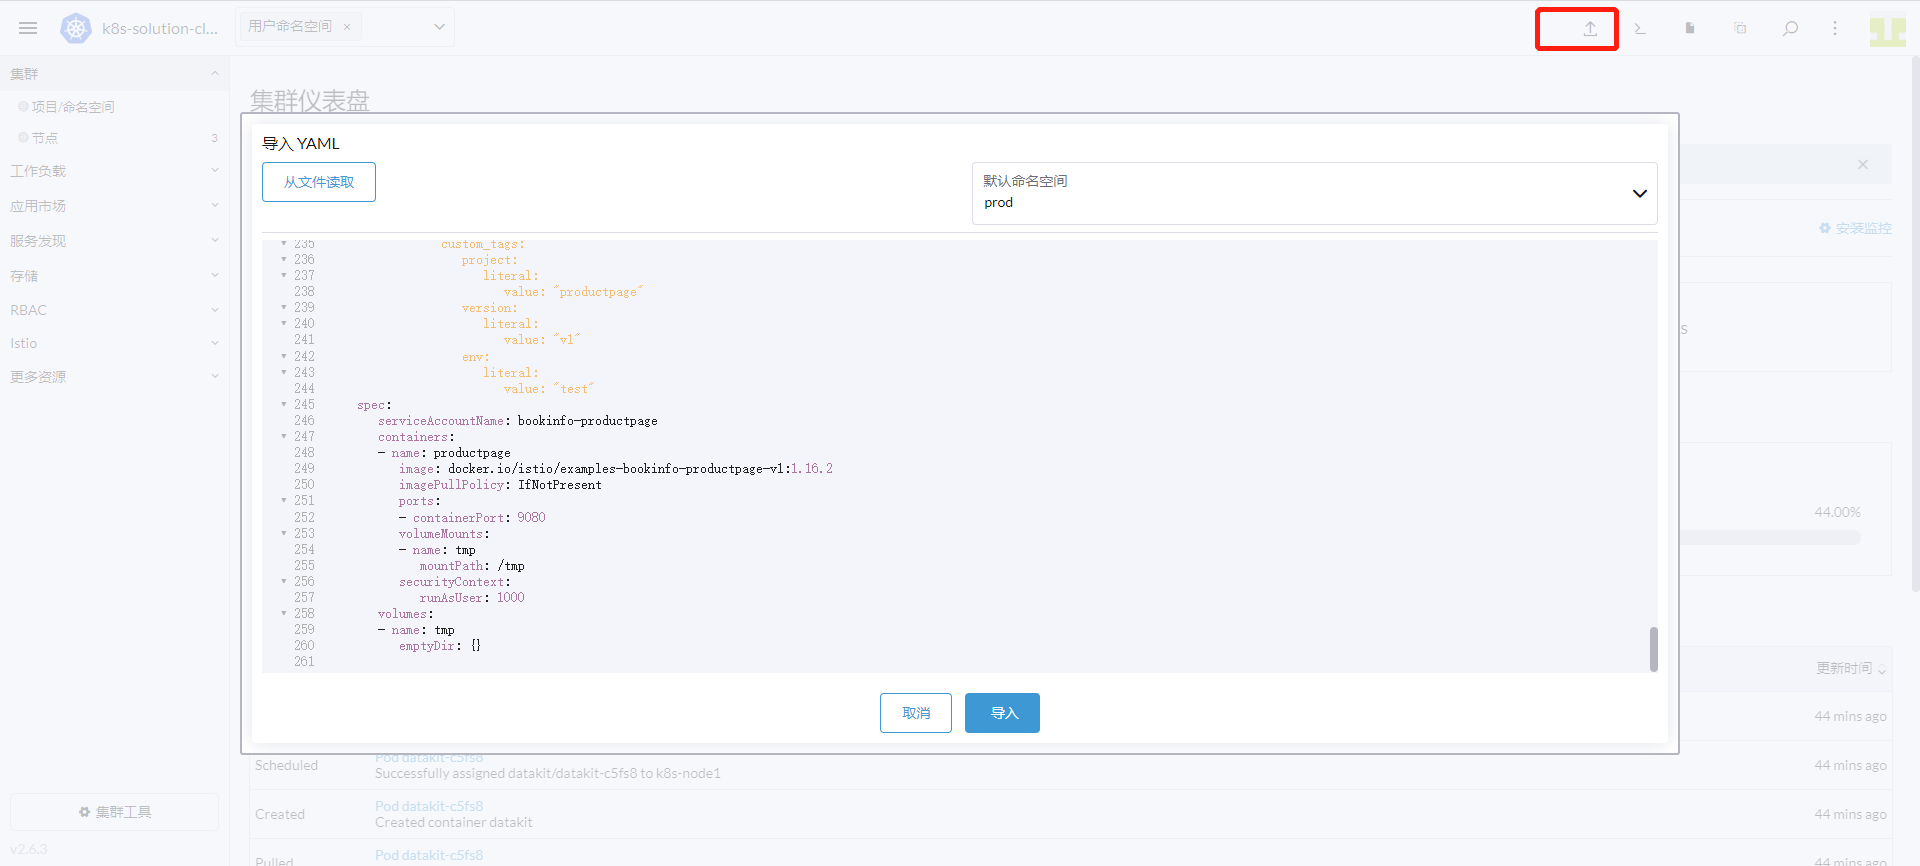
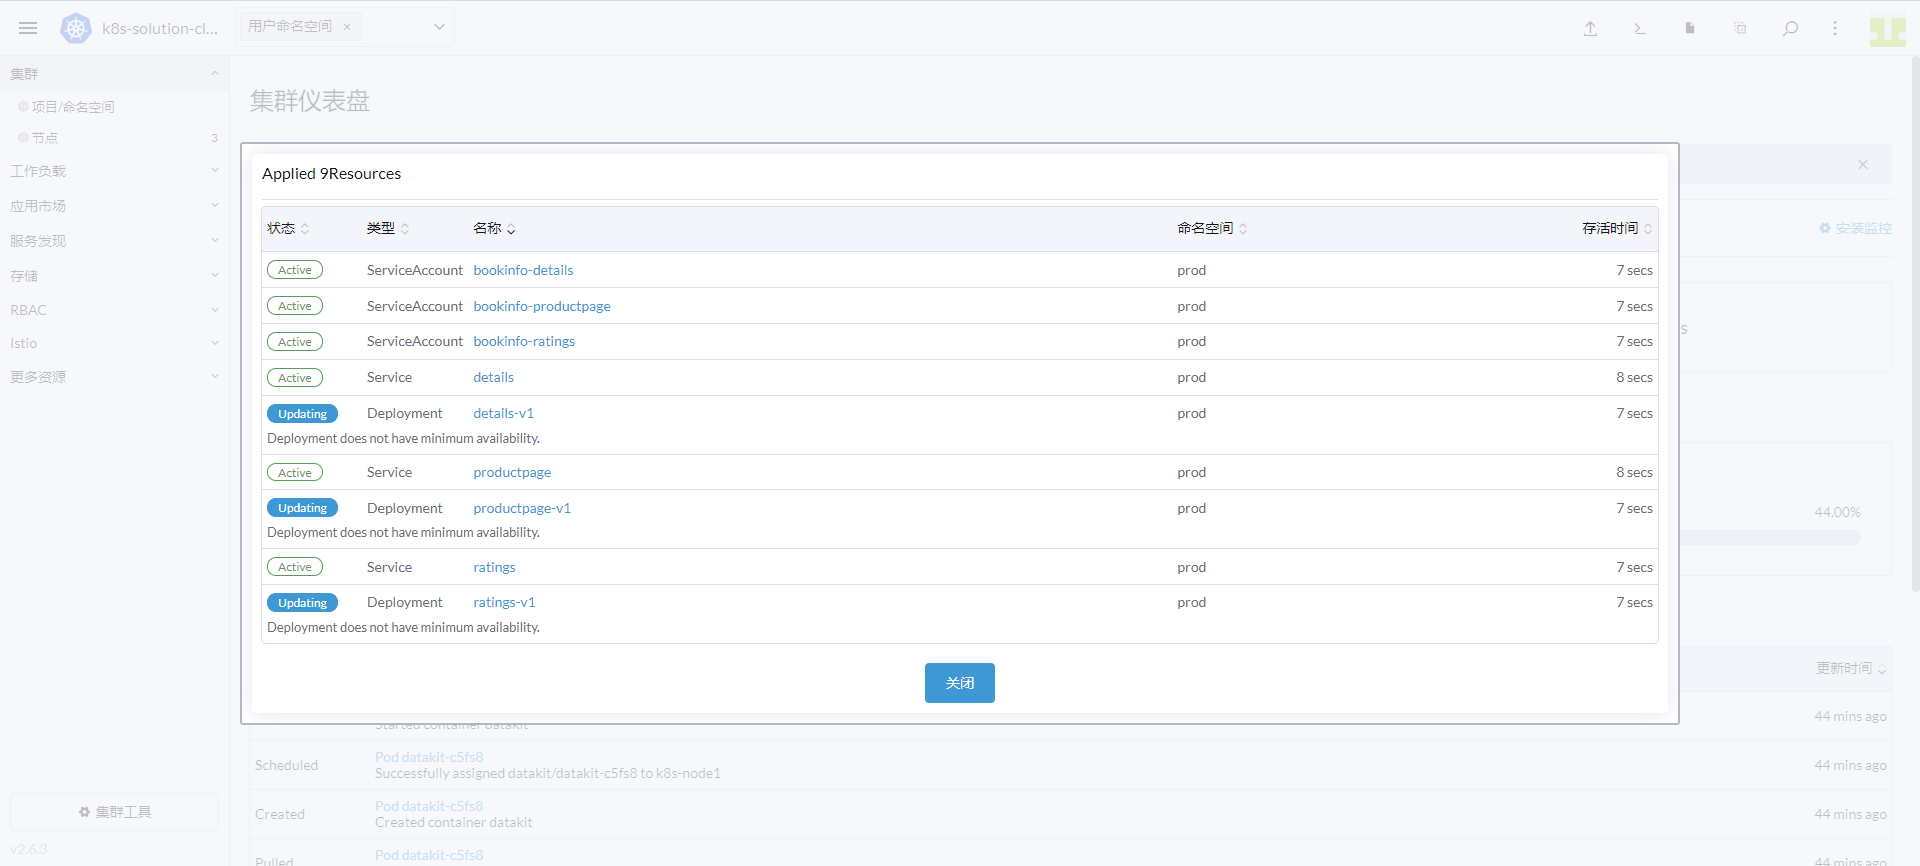
上部の「YAML のインポート」アイコンをクリックします。名前空間に「prod」を入力し、上記の内容を入力して「インポート」をクリックします。
3.10 reviews パイプラインのデプロイ
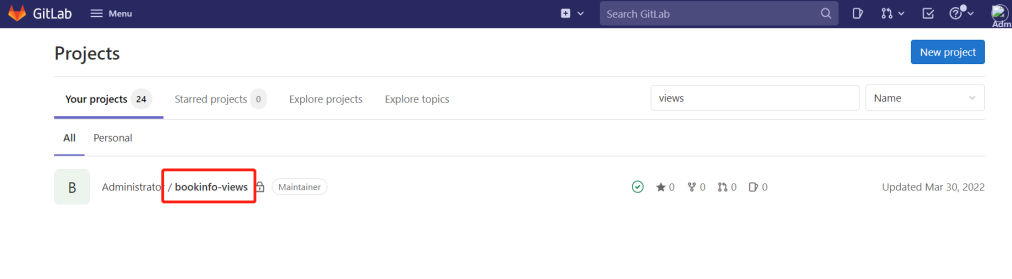
Gitlab にログインし、bookinfo-views プロジェクトを作成します。
gitlab 統合ドキュメント を参照して Gitlab と DataKit を連携させてください。ここでは Gitlab CI のみを設定します。
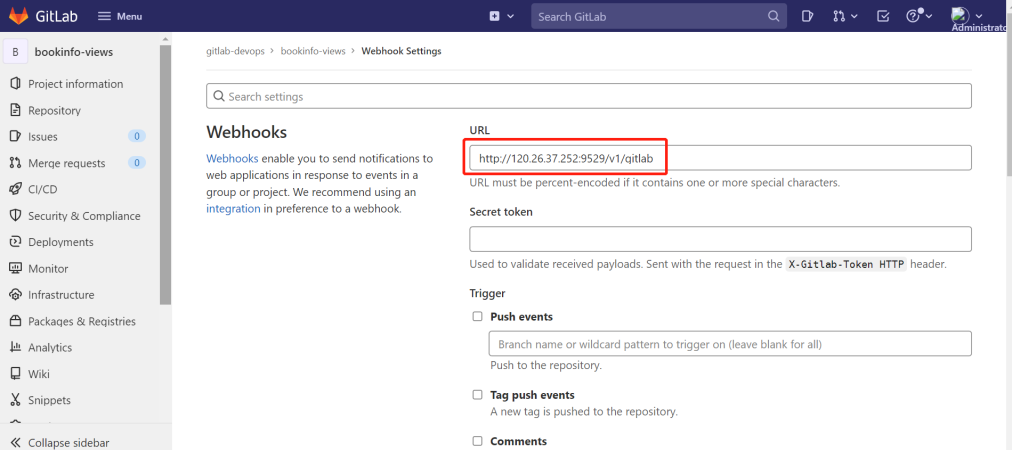
「Gitlab」にログインし、「bookinfo-views」→「Settings」→「Webhooks」に進みます。URL に DataKit が存在する ホスト IP と DataKit の 9529 ポート、さらに /v1/gitlab を入力します。下図の通りです:
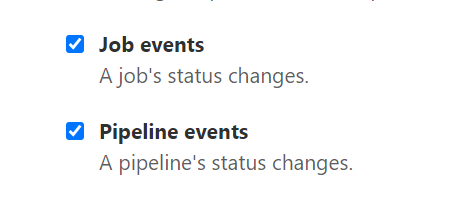
Job events と Pipeline events を選択し、Add webhook をクリックします。
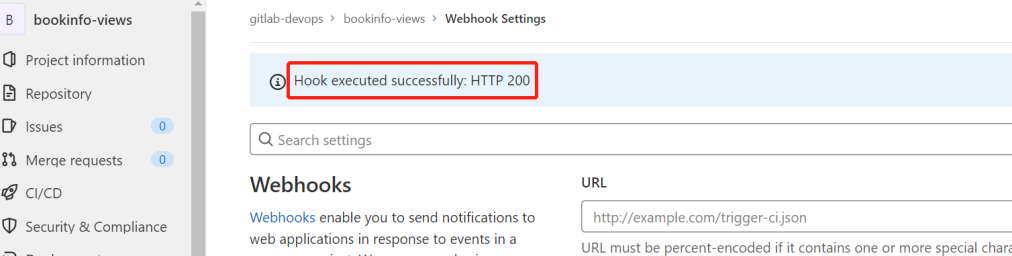
先ほど作成した Webhooks の右側にある Test をクリックし、「Pipeline events」を選択します。下図のように HTTP 200 が表示されれば設定成功です。
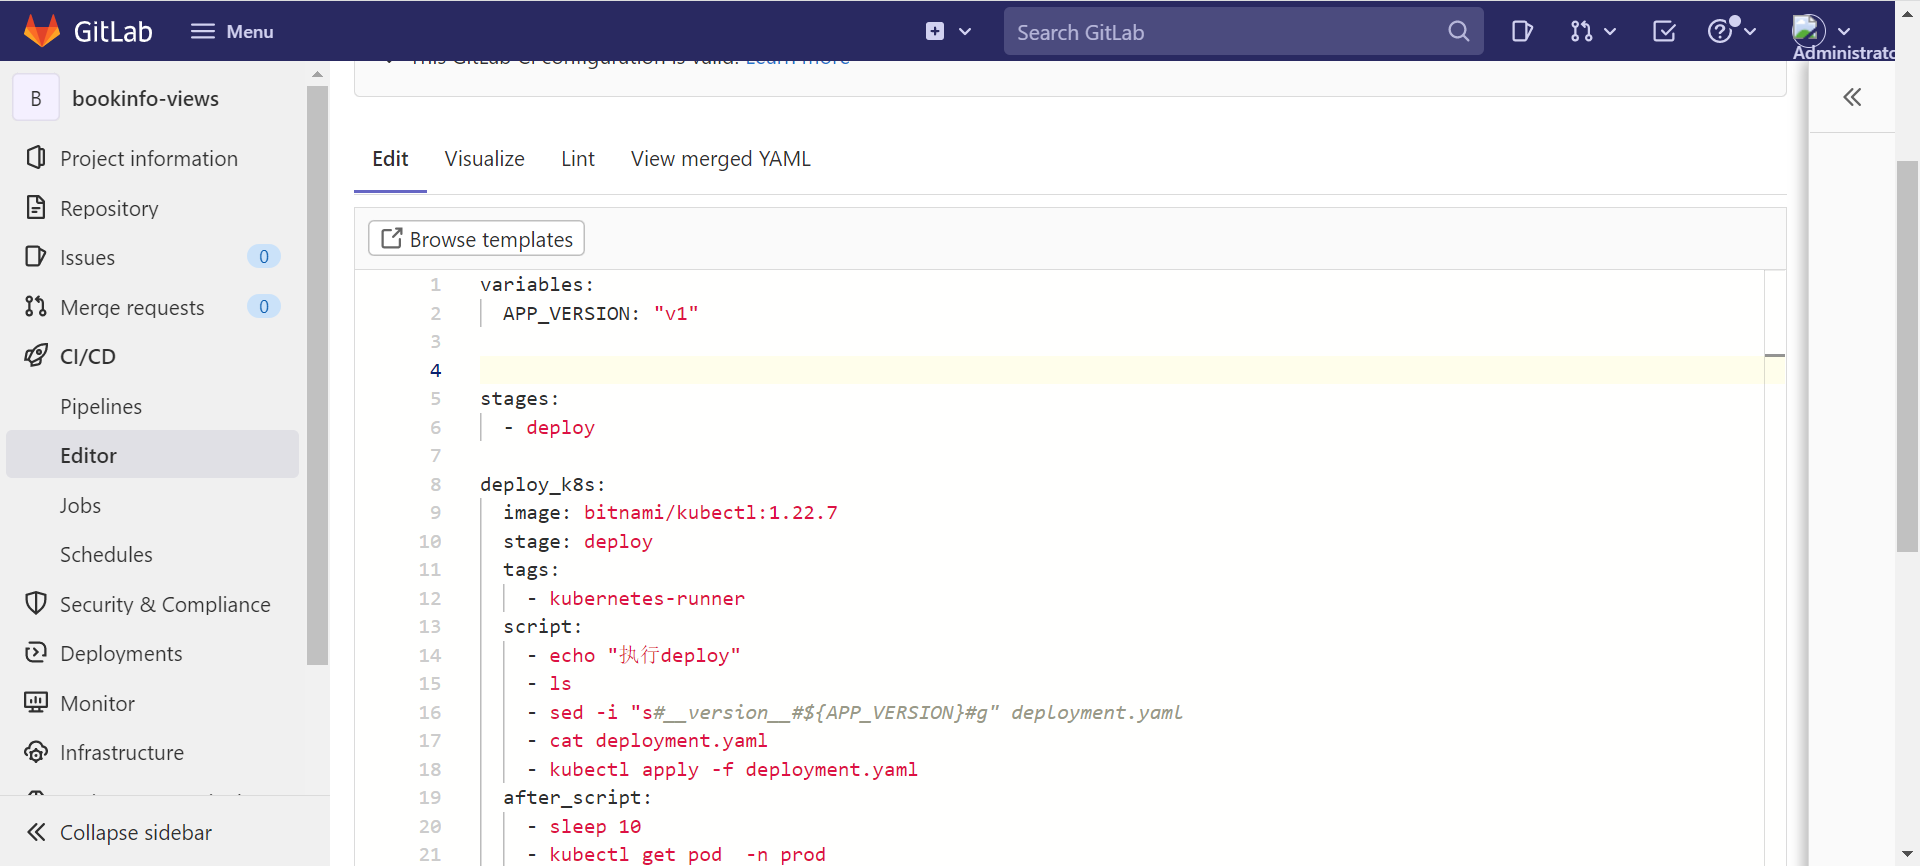
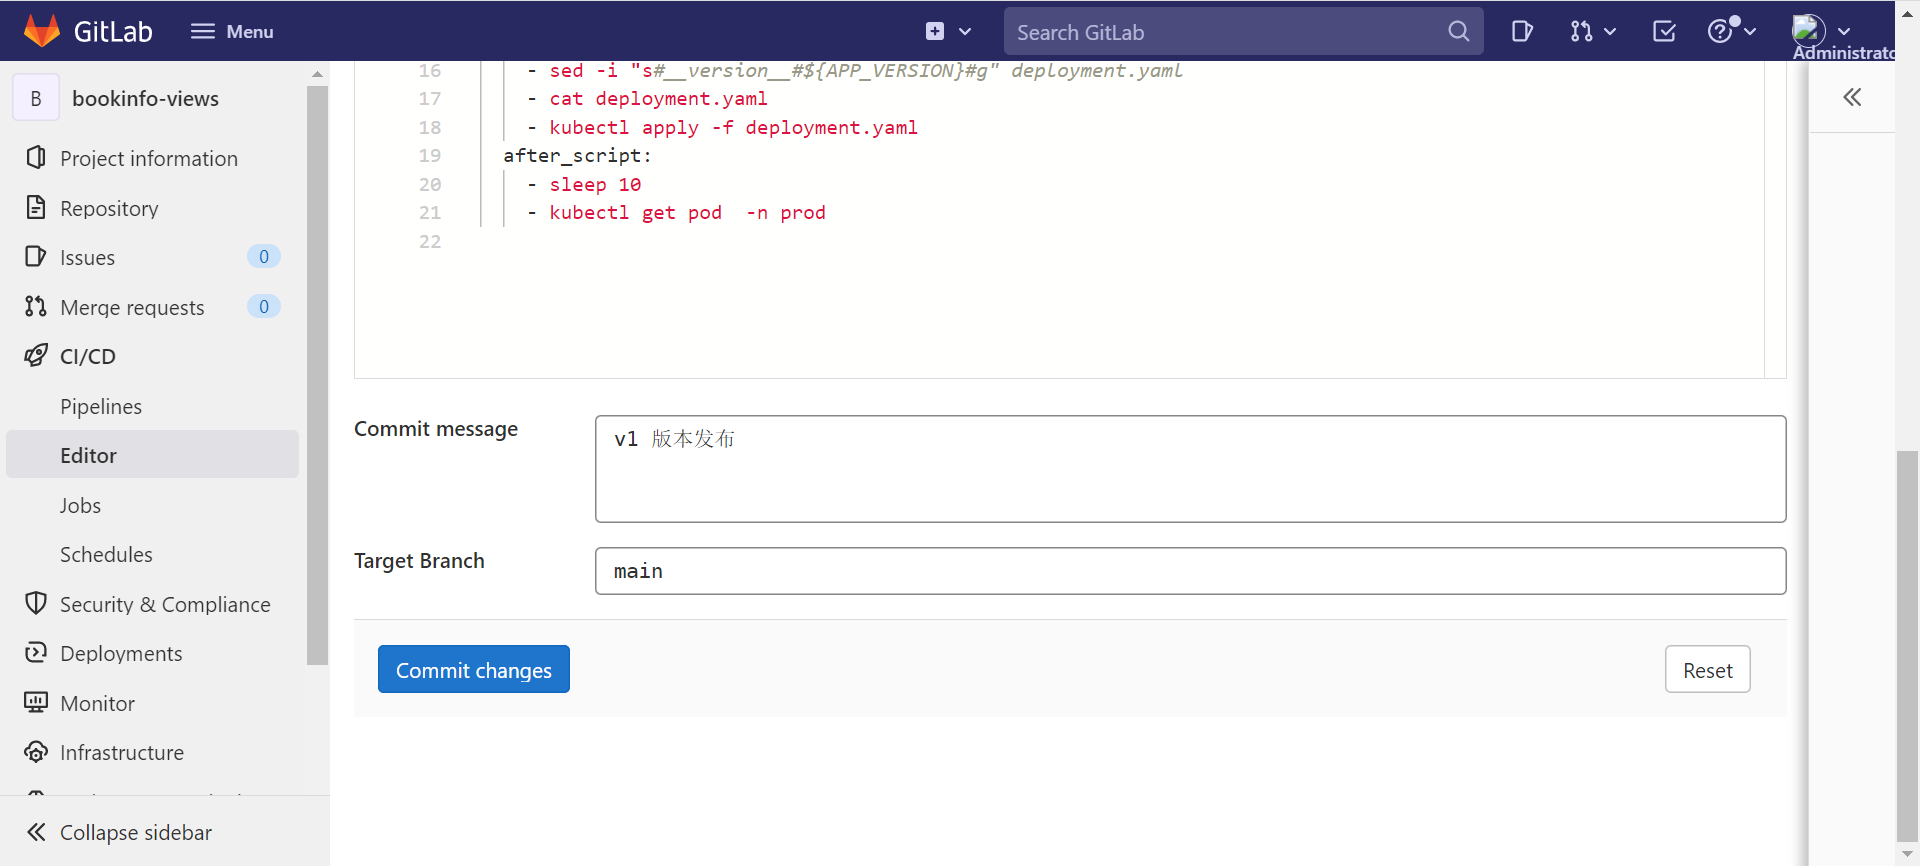
「bookinfo-views」プロジェクトに進入し、ルートディレクトリに deployment.yaml と .gitlab-ci.yml ファイルを作成します。annotations には project、env、version のラベルを定義し、異なるプロジェクトやバージョンを区別します。
設定ファイル
apiVersion: v1
kind: Service
metadata:
  name: reviews
  namespace: prod
  labels:
    app: reviews
    service: reviews
spec:
  ports:
    - port: 9080
      name: http
  selector:
    app: reviews
---
apiVersion: v1
kind: ServiceAccount
metadata:
  name: bookinfo-reviews
  namespace: prod
  labels:
    account: reviews
---
apiVersion: apps/v1
kind: Deployment
metadata:
  name: reviews-__version__
  namespace: prod
  labels:
    app: reviews
    version: __version__
spec:
  replicas: 1
  selector:
    matchLabels:
      app: reviews
      version: __version__
  template:
    metadata:
      labels:
        app: reviews
        version: __version__
      annotations:
        datakit/prom.instances: |
          [[inputs.prom]]
            url = "http://$IP:15020/stats/prometheus"
            source = "bookinfo-istio-review"
            metric_types = ["counter", "gauge"]
            interval = "60s"
            tags_ignore = ["cache","cluster_type","component","destination_app","destination_canonical_revision","destination_canonical_service","destination_cluster","destination_principal","group","grpc_code","grpc_method","grpc_service","grpc_type","reason","request_protocol","request_type","resource","responce_code_class","response_flags","source_app","source_canonical_revision","source_canonical-service","source_cluster","source_principal","source_version","wasm_filter"]
            metric_name_filter = ["istio_requests_total","pilot_k8s_cfg_events","istio_build","process_virtual_memory_bytes","process_resident_memory_bytes","process_cpu_seconds_total","envoy_cluster_assignment_stale","go_goroutines","pilot_xds_pushes","pilot_proxy_convergence_time_bucket","citadel_server_root_cert_expiry_timestamp","pilot_conflict_inbound_listener","pilot_conflict_outbound_listener_http_over_current_tcp","pilot_conflict_outbound_listener_tcp_over_current_tcp","pilot_conflict_outbound_listener_tcp_over_current_http","pilot_virt_services","galley_validation_failed","pilot_services","envoy_cluster_upstream_cx_total","envoy_cluster_upstream_cx_connect_fail","envoy_cluster_upstream_cx_active","envoy_cluster_upstream_cx_rx_bytes_total","envoy_cluster_upstream_cx_tx_bytes_total","istio_request_duration_milliseconds_bucket","istio_request_duration_seconds_bucket","istio_request_bytes_bucket","istio_response_bytes_bucket"]
            #measurement_prefix = ""
            measurement_name = "istio_prom"
            #[[inputs.prom.measurements]]
            # prefix = "cpu_"
            # name = "cpu"
            [inputs.prom.tags]
            namespace = "$NAMESPACE"
        proxy.istio.io/config: |
          tracing:
            zipkin:
              address: zipkin.istio-system:9411
            custom_tags:
              project:
                literal:
                  value: "reviews"
              version:
                literal:
                  value: __version__
              env:
                literal:
                  value: "test"
    spec:
      serviceAccountName: bookinfo-reviews
      containers:
        - name: reviews
          image: docker.io/istio/examples-bookinfo-reviews-__version__:1.16.2
          imagePullPolicy: IfNotPresent
          env:
            - name: LOG_DIR
              value: "/tmp/logs"
          ports:
            - containerPort: 9080
          volumeMounts:
            - name: tmp
              mountPath: /tmp
            - name: wlp-output
              mountPath: /opt/ibm/wlp/output
          securityContext:
            runAsUser: 1000
      volumes:
        - name: wlp-output
          emptyDir: {}
        - name: tmp
          emptyDir: {}
variables:
  APP_VERSION: "v1"

stages:
  - deploy

deploy_k8s:
  image: bitnami/kubectl:1.22.7
  stage: deploy
  tags:
    - kubernetes-runner
  script:
    - echo "deploy を実行"
    - ls
    - sed -i "s#__version__#${APP_VERSION}#g" deployment.yaml
    - cat deployment.yaml
    - kubectl apply -f deployment.yaml
  after_script:
    - sleep 10
    - kubectl get pod  -n prod
.gitlab-ci.yml ファイルの APP_VERSION の値を "v1" に変更してコードをコミットし、次に "v2" に変更して再度コミットします。
3.11 productpage へのアクセス
Rancher 上部の「コマンドライン」アイコンをクリックし、「kubectl get svc -n istio-system」と入力して Enter キーを押します。
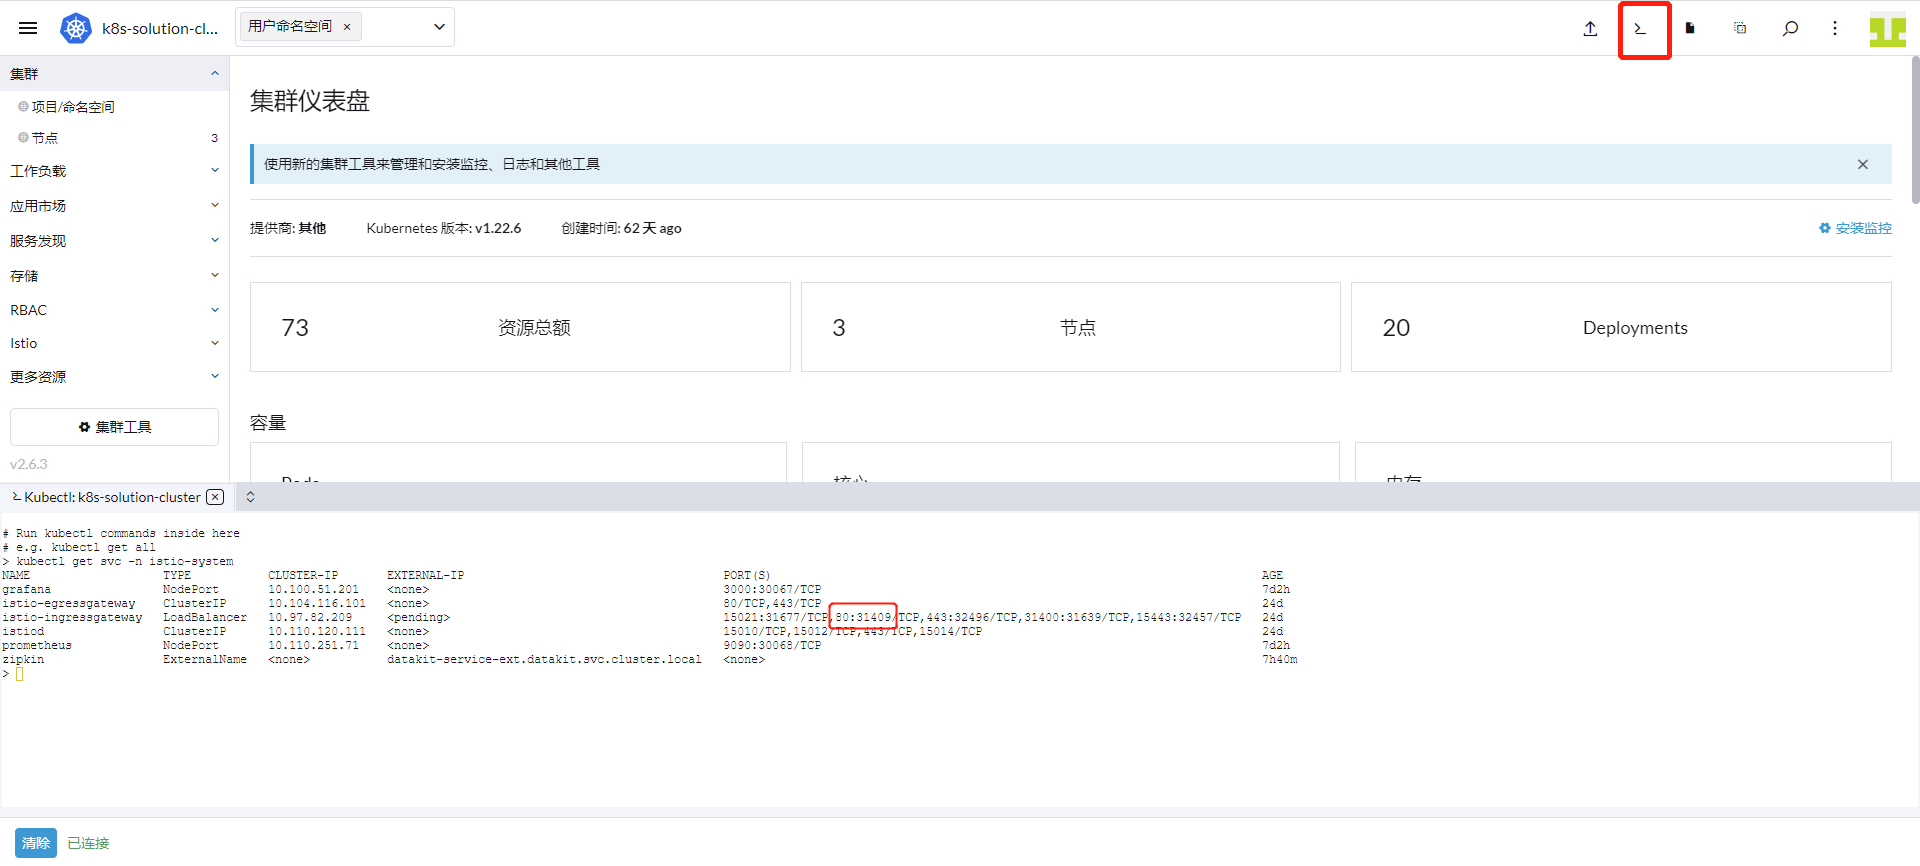
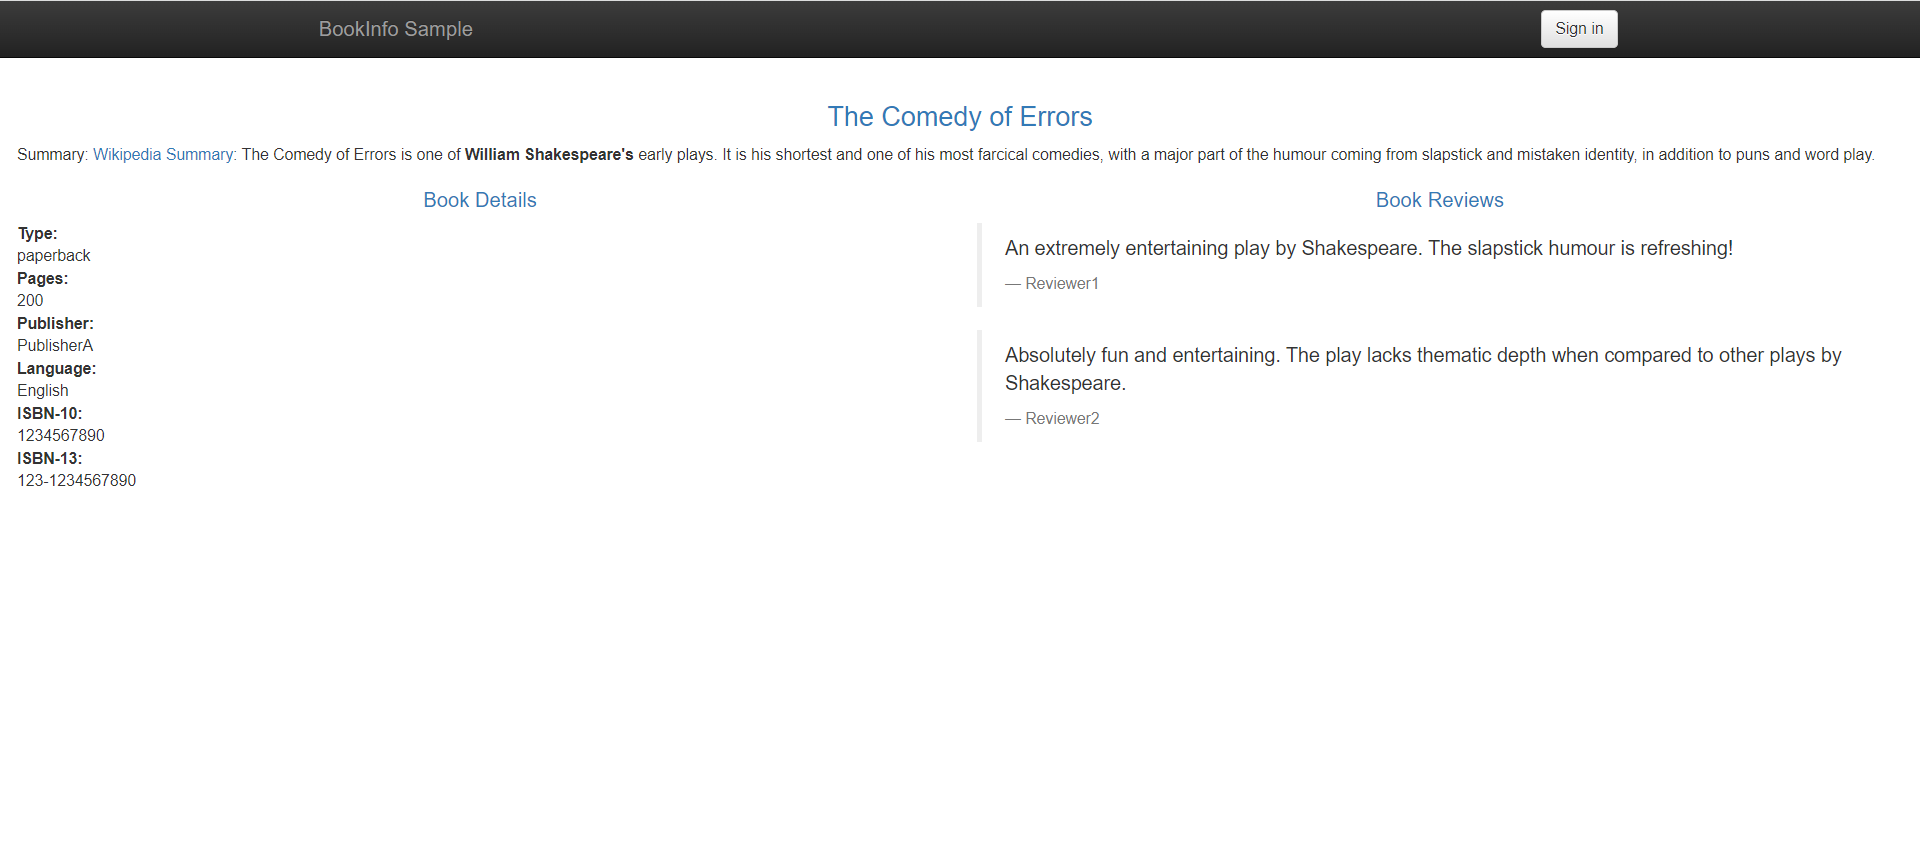
上の図からポートが 31409 であることがわかります。サーバーの IP に基づいて、productpage のアクセスパスは http://8.136.193.105:31409/productpage になります。
手順 4: Istio の可観測性
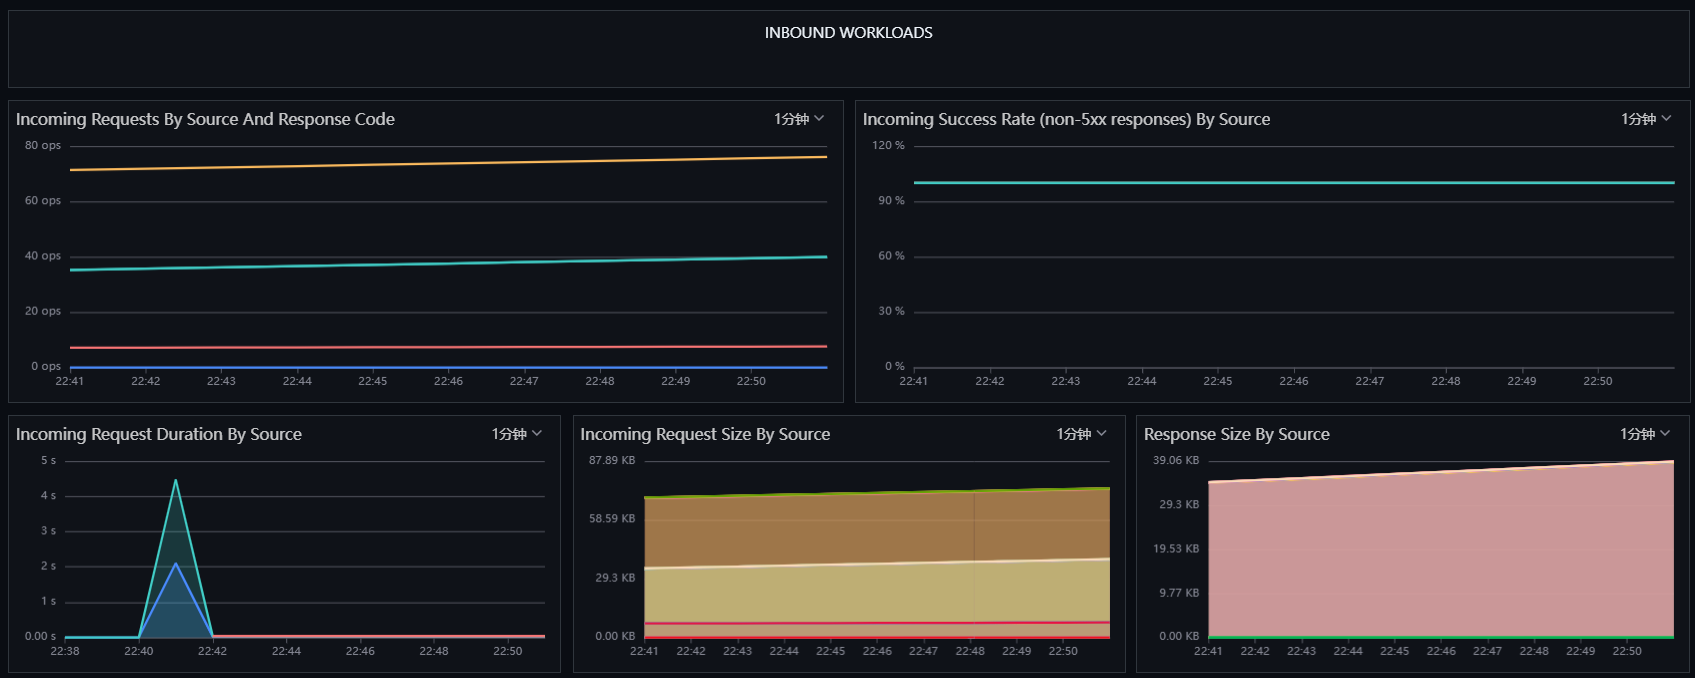
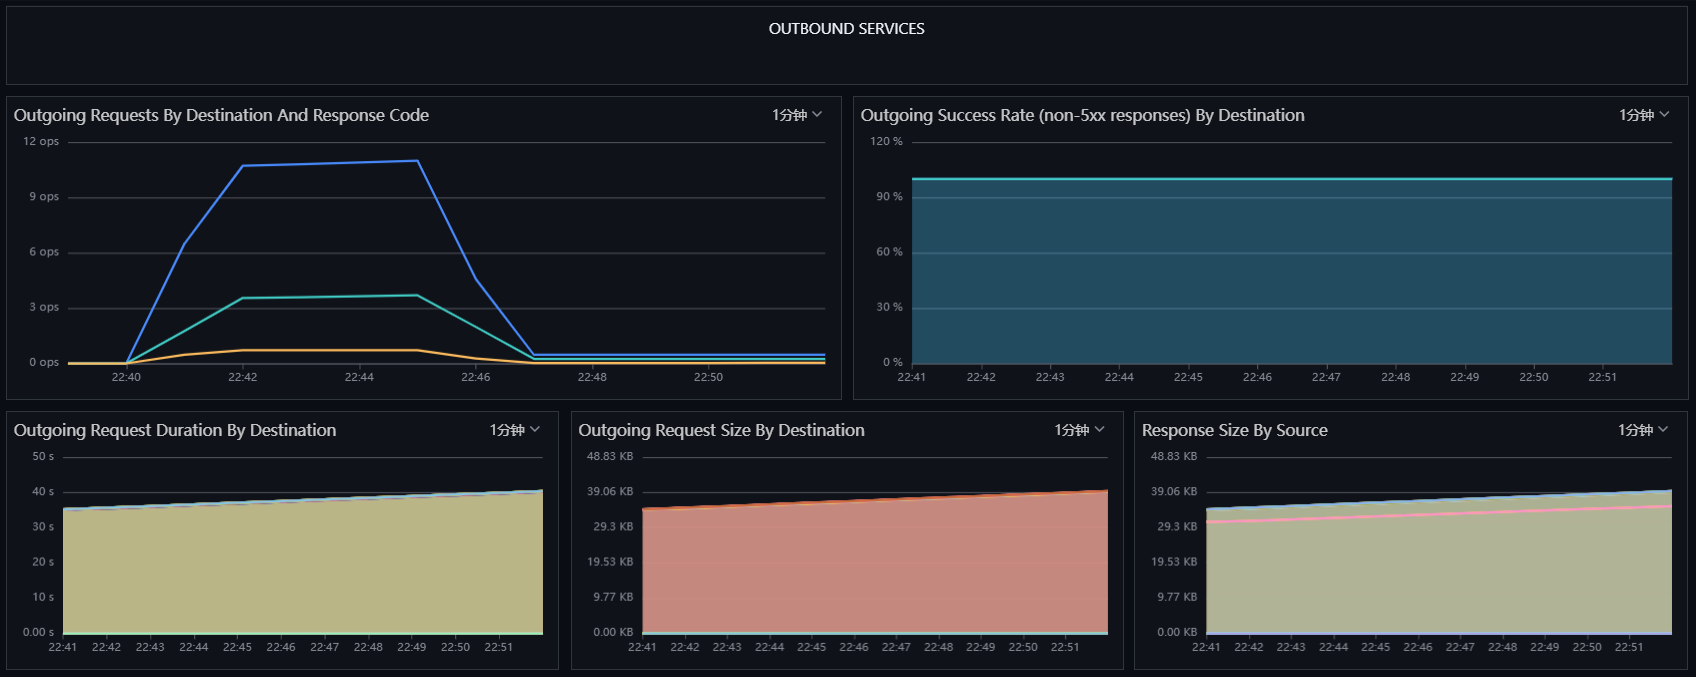
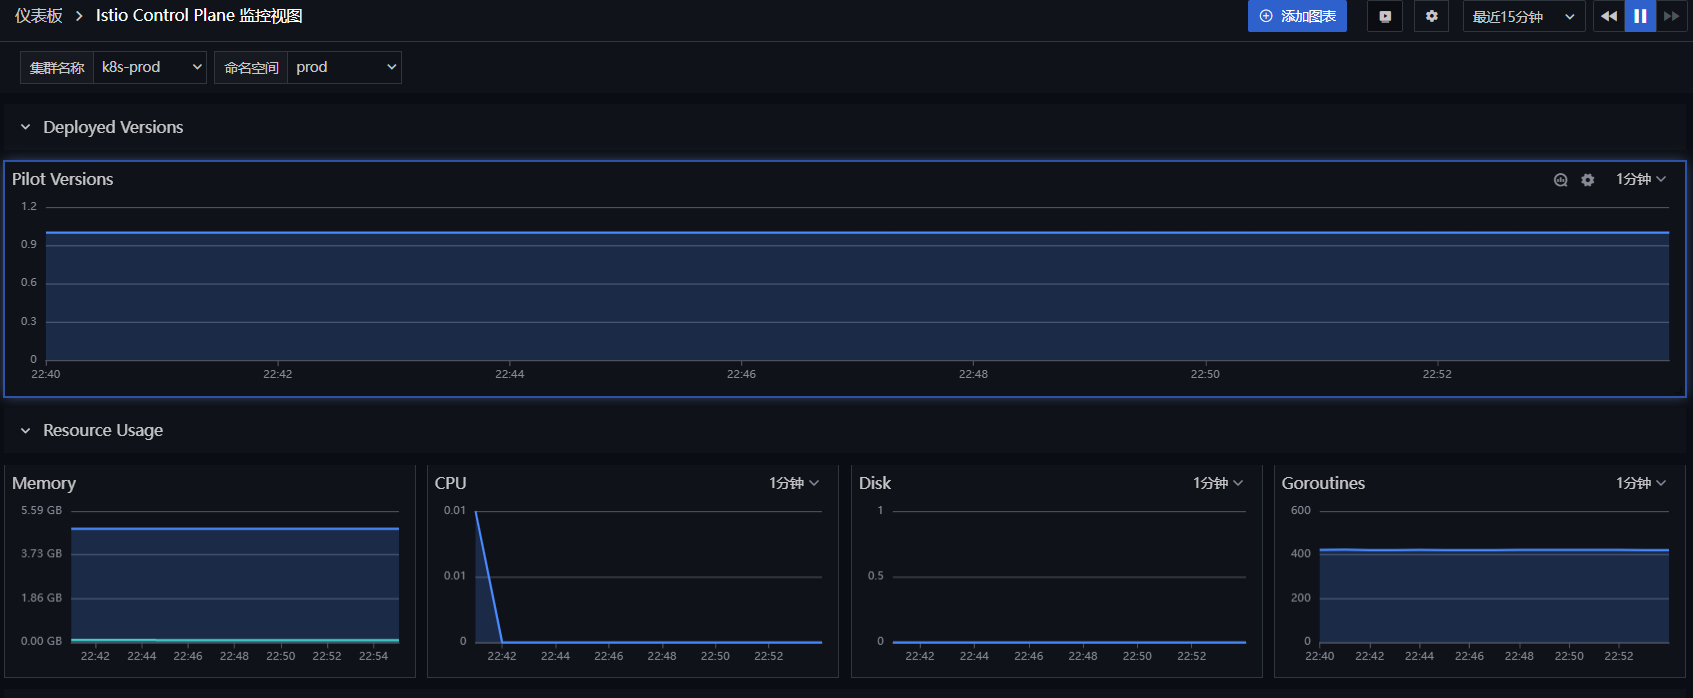
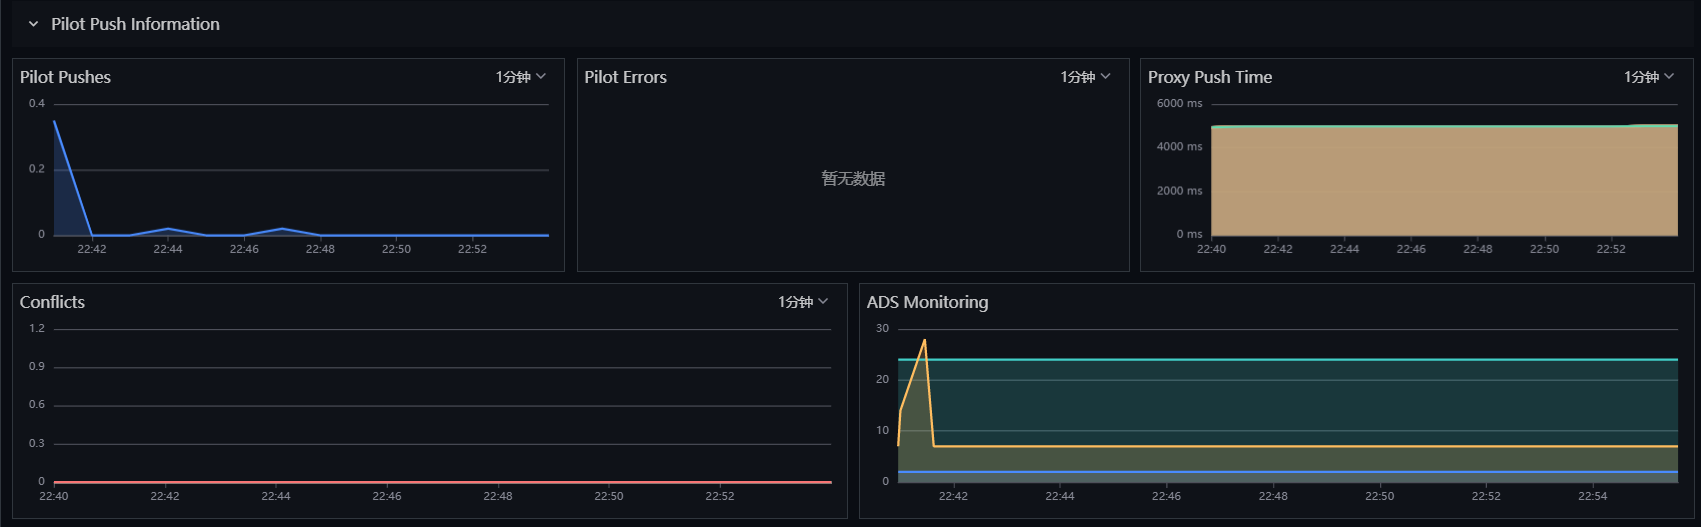
上記の手順で、Istiod および bookinfo アプリケーションのメトリクス収集が行われました。Guance はデフォルトで 4 つのモニタリングビューを提供し、Istio の実行状況を観測します。
4.1 Istio Workload モニタリングビュー
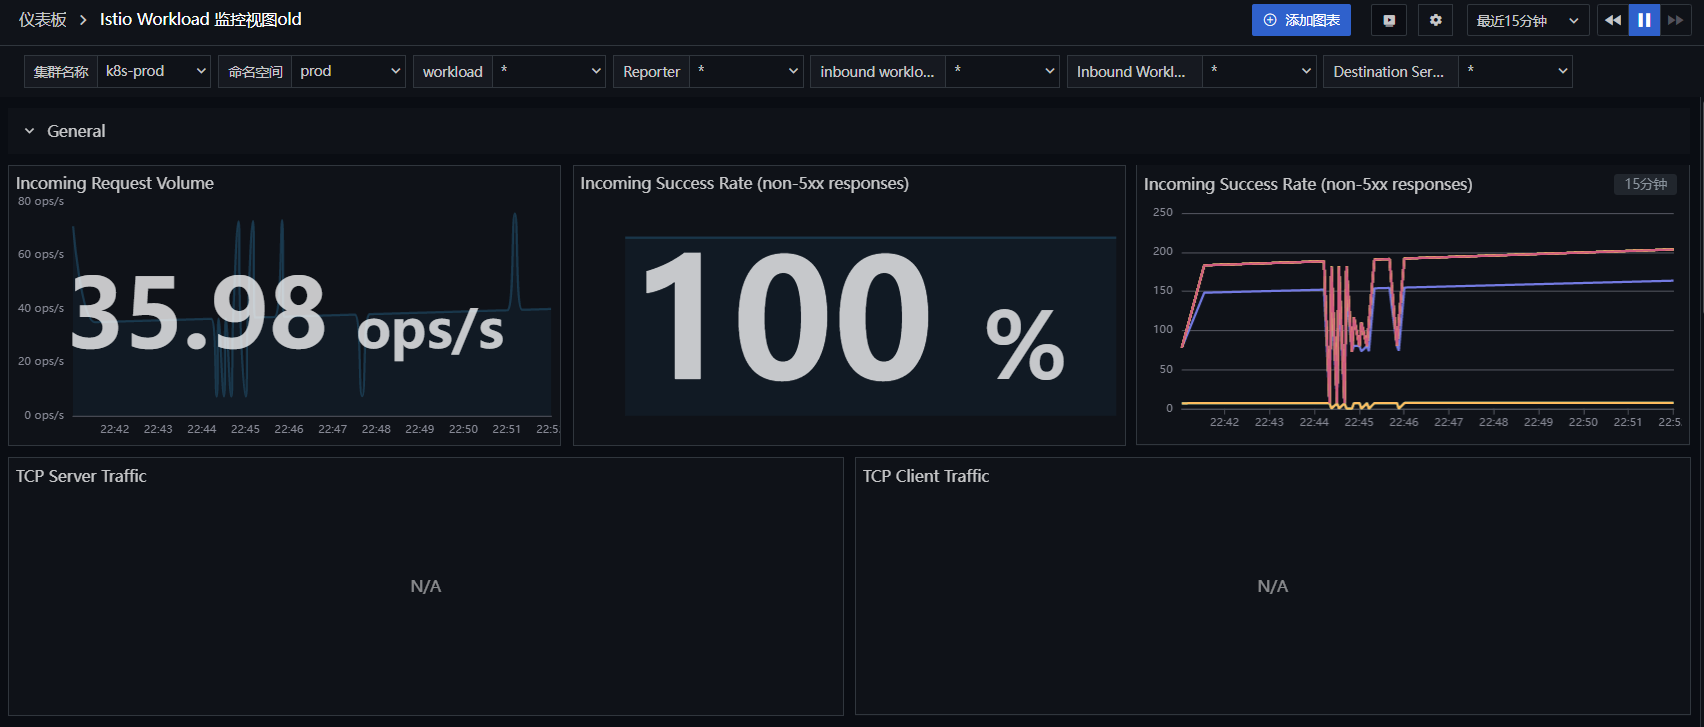
「Guance」にログインし、「シナリオ」モジュールに進入します。「新規ダッシュボード」をクリックし、「Istio」と入力して「Istio Workload モニタリングビュー」を選択し、「確定」をクリックします。次に、新しく作成された「Istio Workload モニタリングビュー」をクリックして観測します。
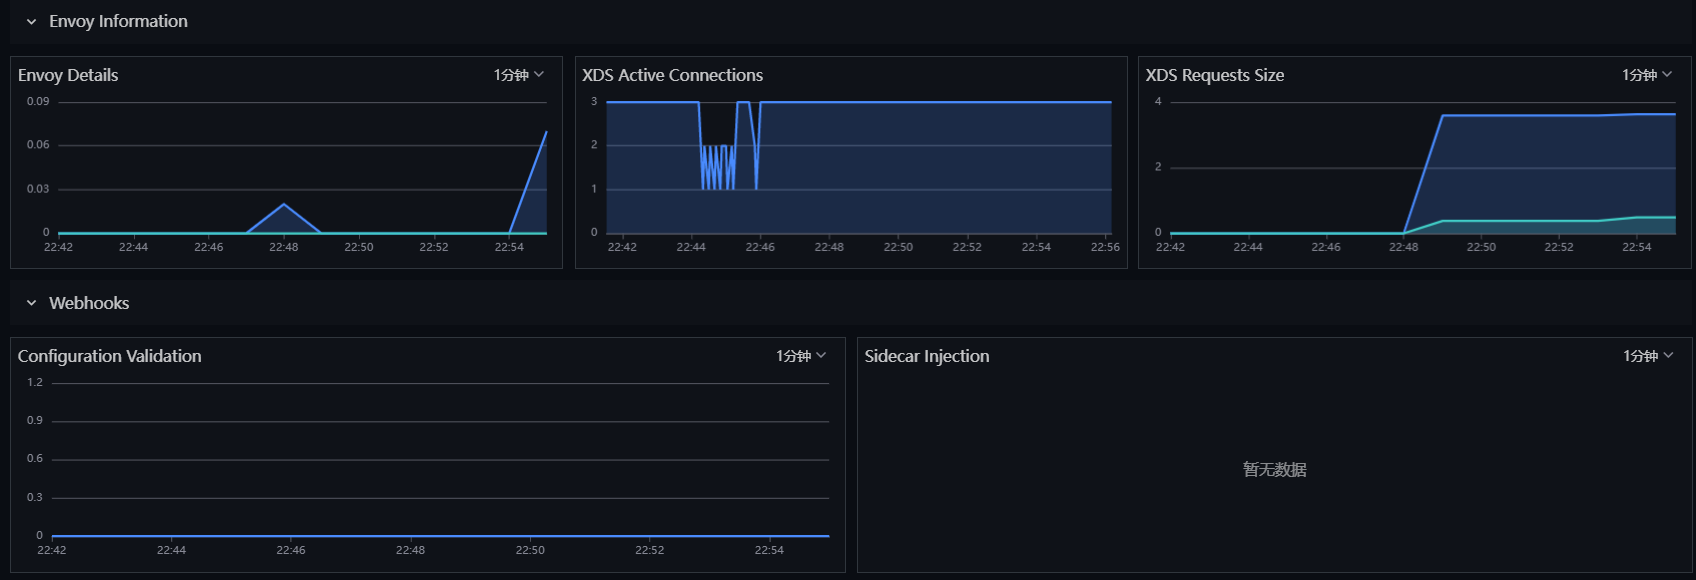
4.2 Istio Control Plane モニタリングビュー
「Guance」にログインし、「シナリオ」モジュールに進入します。「新規ダッシュボード」をクリックし、「Istio」と入力して「Istio Control Plane モニタリングビュー」を選択し、「確定」をクリックします。次に、新しく作成された「Istio Control Plane モニタリングビュー」をクリックして観測します。
4.3 Istio Service モニタリングビュー
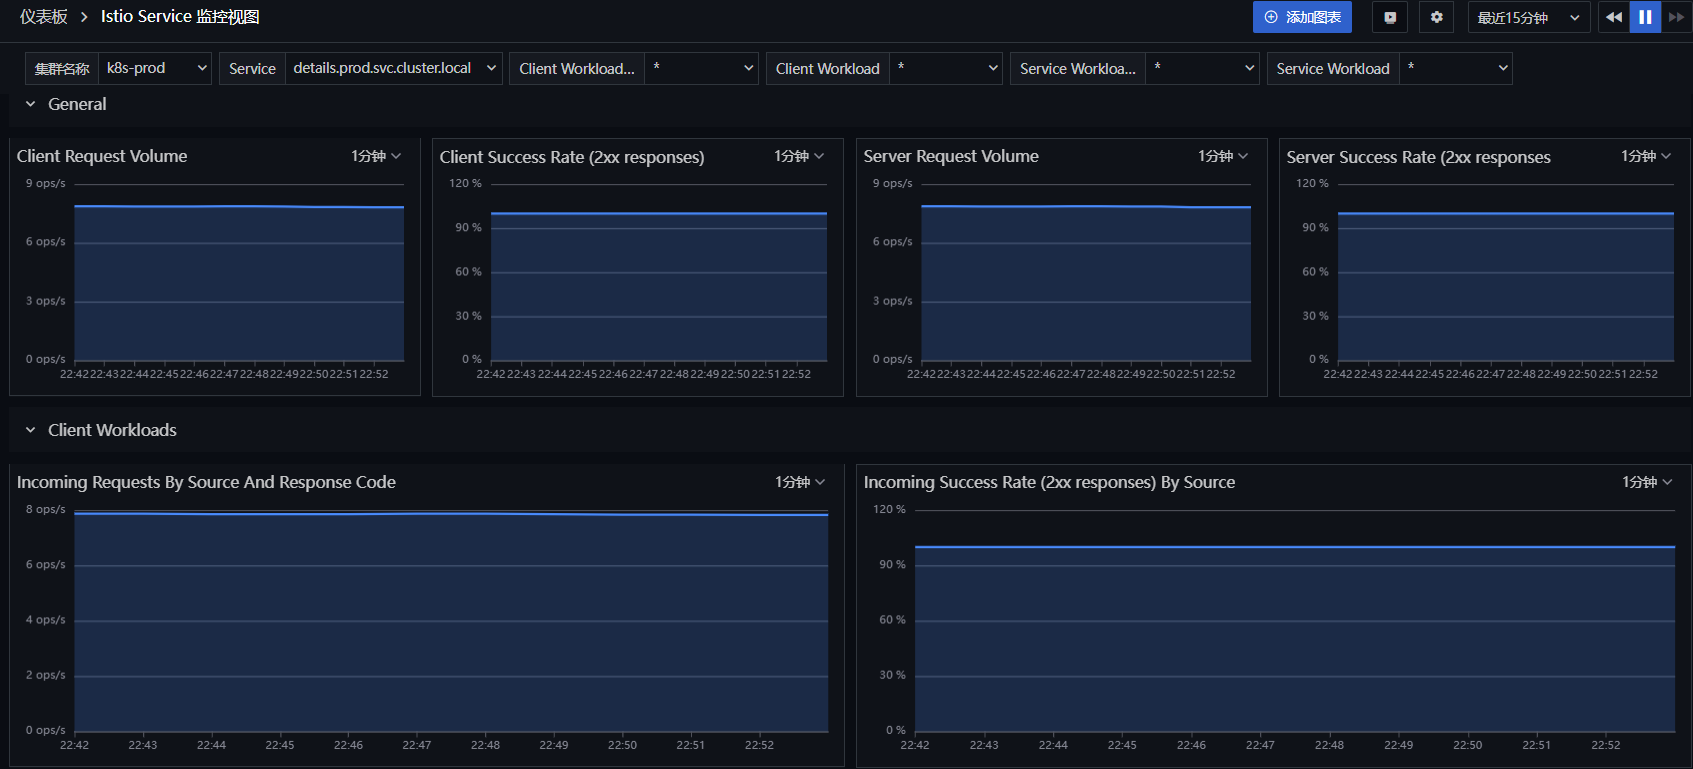
「Guance」にログインし、「シナリオ」モジュールに進入します。「新規ダッシュボード」をクリックし、「Istio」と入力して「Istio Service モニタリングビュー」を選択し、「確定」をクリックします。次に、新しく作成された「Istio Service モニタリングビュー」をクリックして観測します。
4.4 Istio Mesh モニタリングビュー
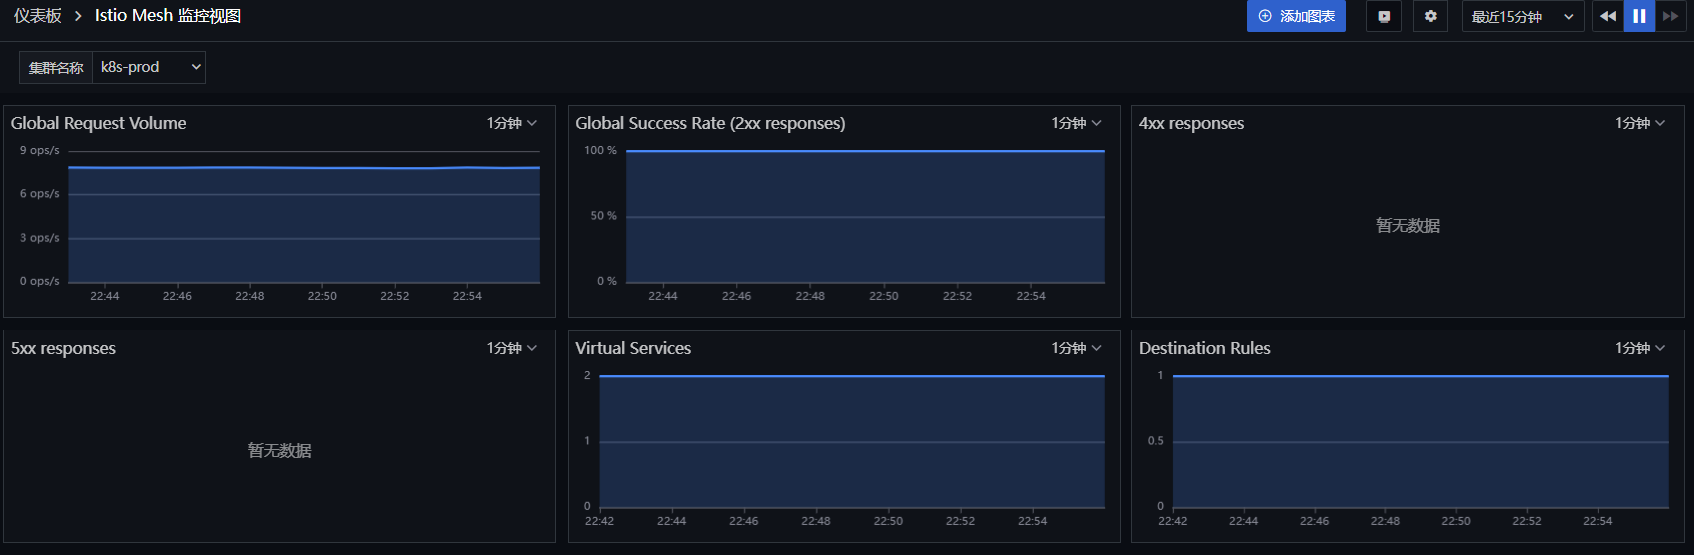
「Guance」にログインし、「シナリオ」モジュールに進入します。「新規ダッシュボード」をクリックし、「Istio」と入力して「Istio Mesh モニタリングビュー」を選択し、「確定」をクリックします。次に、新しく作成された「Istio Mesh モニタリングビュー」をクリックして観測します。
手順 5: RUM の可観測性
5.1 リアルユーザーモニタリング(RUM)の新規作成
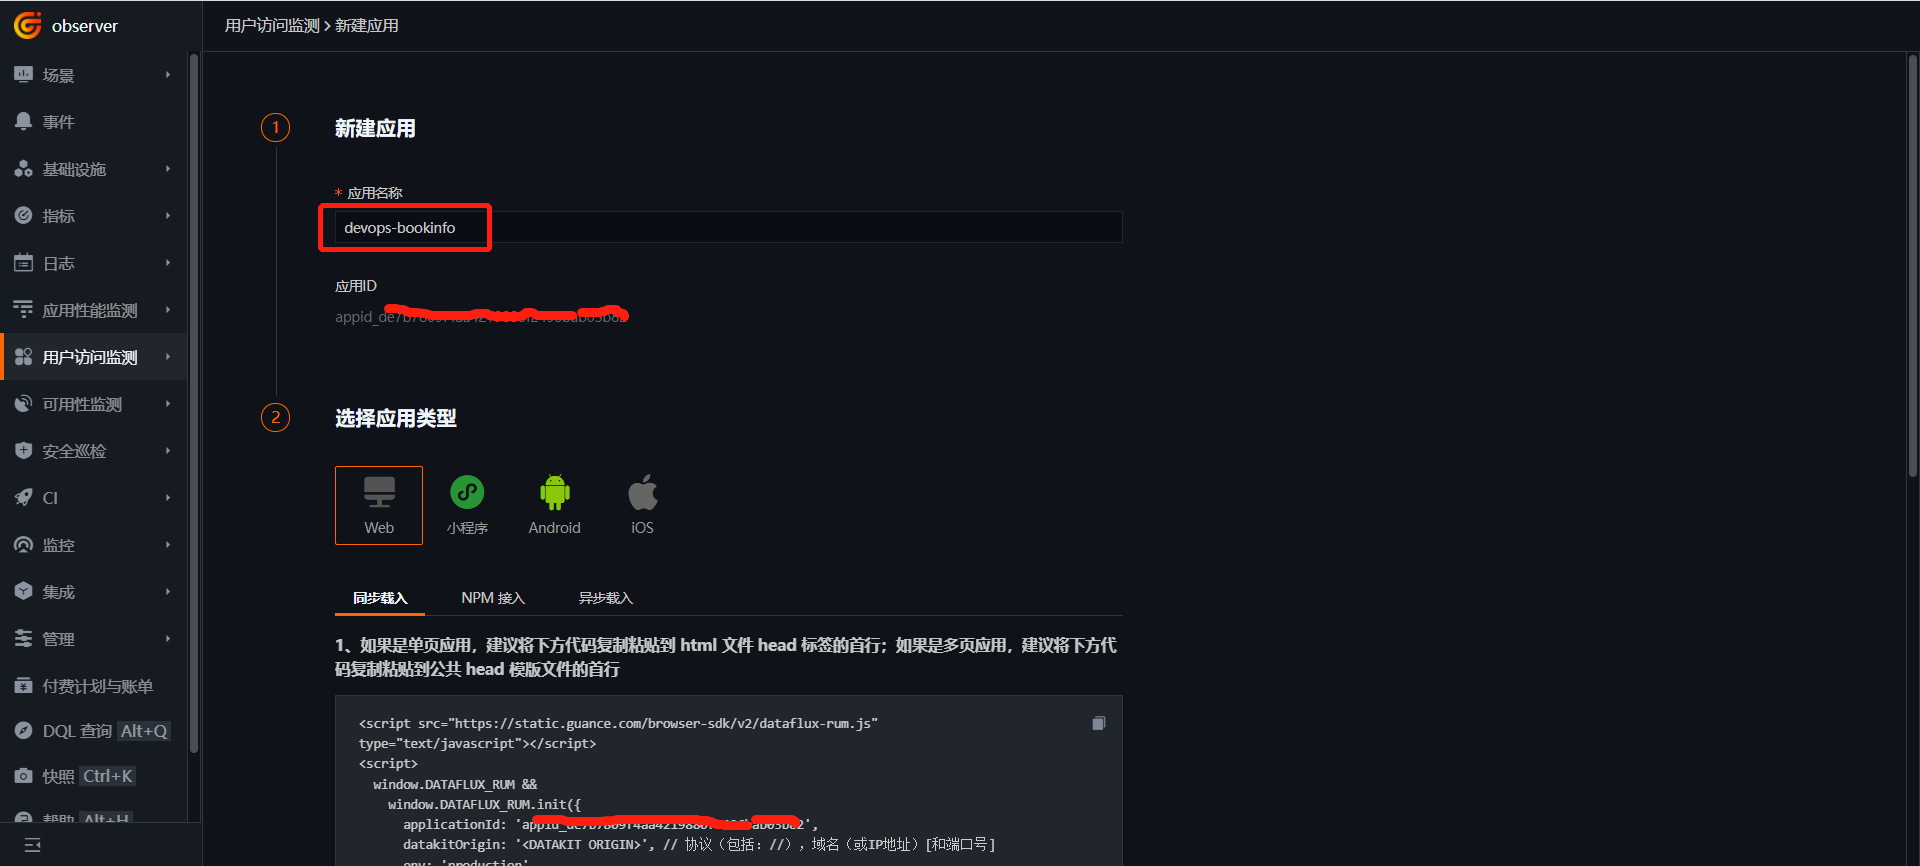
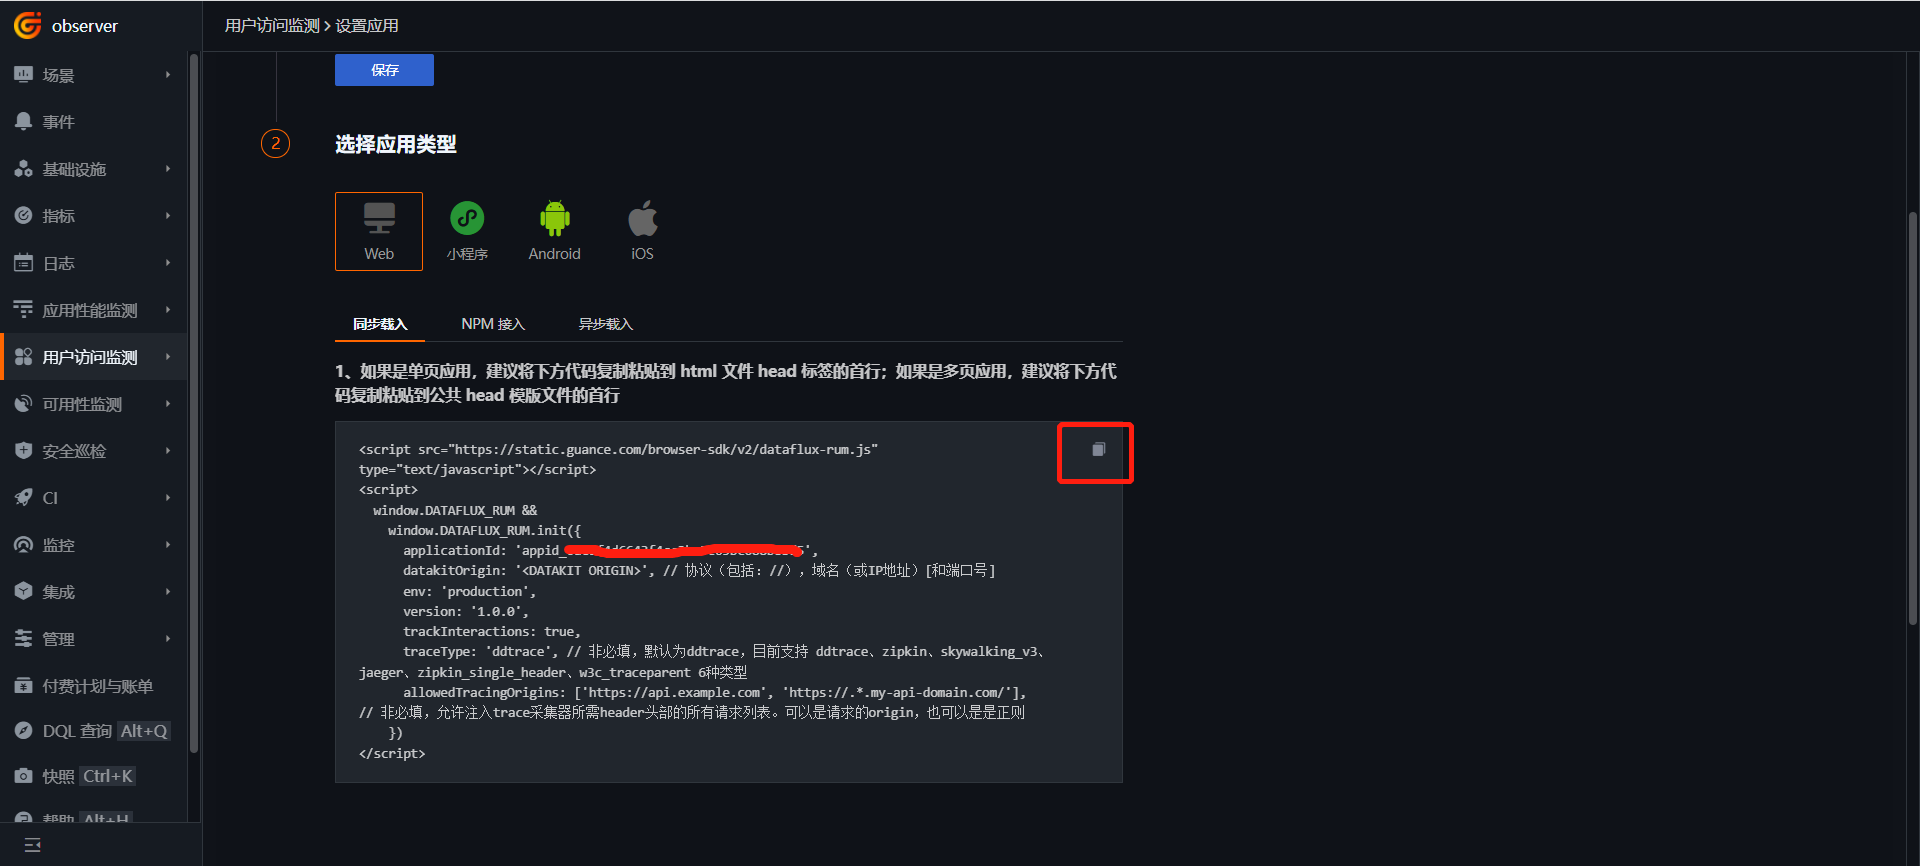
「Guance」にログインし、「ユーザーアクセスモニタリング」に進入します。新しいアプリケーション devops-bookinfo を作成し、下の JS をコピーします。
5.2 productpage イメージの作成
istio-1.13.2-linux-amd64.tar.gz をダウンロードし、解凍します。上記の JS は、productpage プロジェクトのすべての画面からアクセスできる場所に配置する必要があります。このプロジェクトでは、上記の JS を istio-1.13.2\samples\bookinfo\src\productpage\templates\productpage.html ファイルにコピーします。datakitOrigin の値は DataKit のアドレスです。
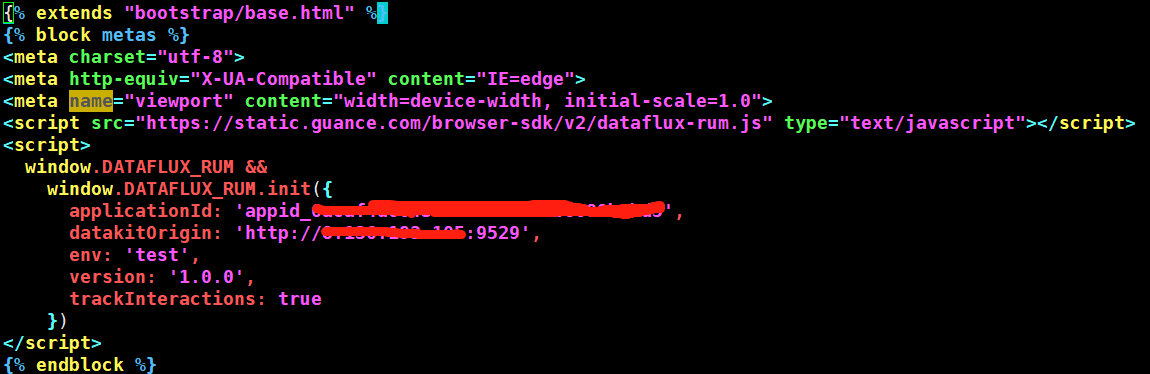
パラメータ説明:
- datakitOrigin:データ転送アドレス。ここでは datakit のドメイン名または IP です。必須。
- env:アプリケーションが属する環境。必須。
- version:アプリケーションが属するバージョン。必須。
- trackInteractions:ユーザー行動統計(ボタンクリック、情報送信などのアクション)を有効にするかどうか。必須。
- traceType:トレースタイプ。デフォルトは ddtrace。任意。
- allowedTracingOrigins:APM と RUM のトレースを連携させるために、バックエンドサービスのドメイン名または IP を指定します。任意。
イメージを作成し、イメージリポジトリにアップロードします。
cd istio-1.13.2\samples\bookinfo\src\productpage
docker build -t 172.16.0.238/df-demo/product-page:v1  .
docker push 172.16.0.238/df-demo/product-page:v1
5.3 productpage イメージの置き換え
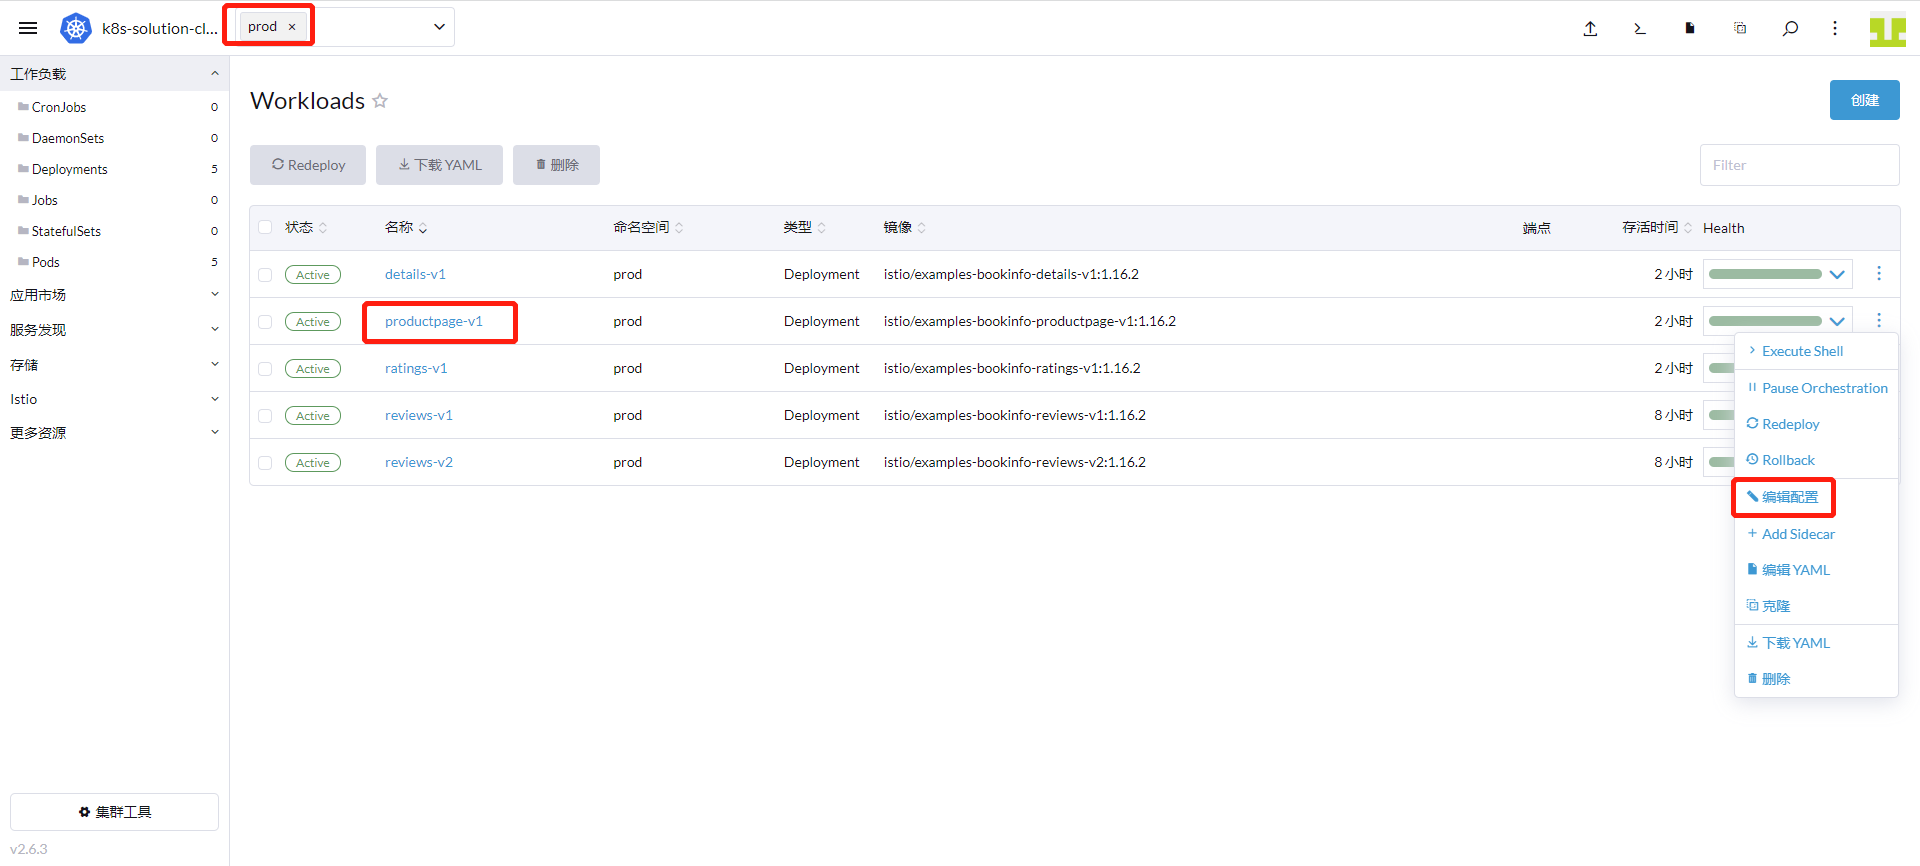
「クラスター」→「ワークロード」→「Deployments」に進み、「productpage-v1」を見つけて「設定の編集」をクリックします。
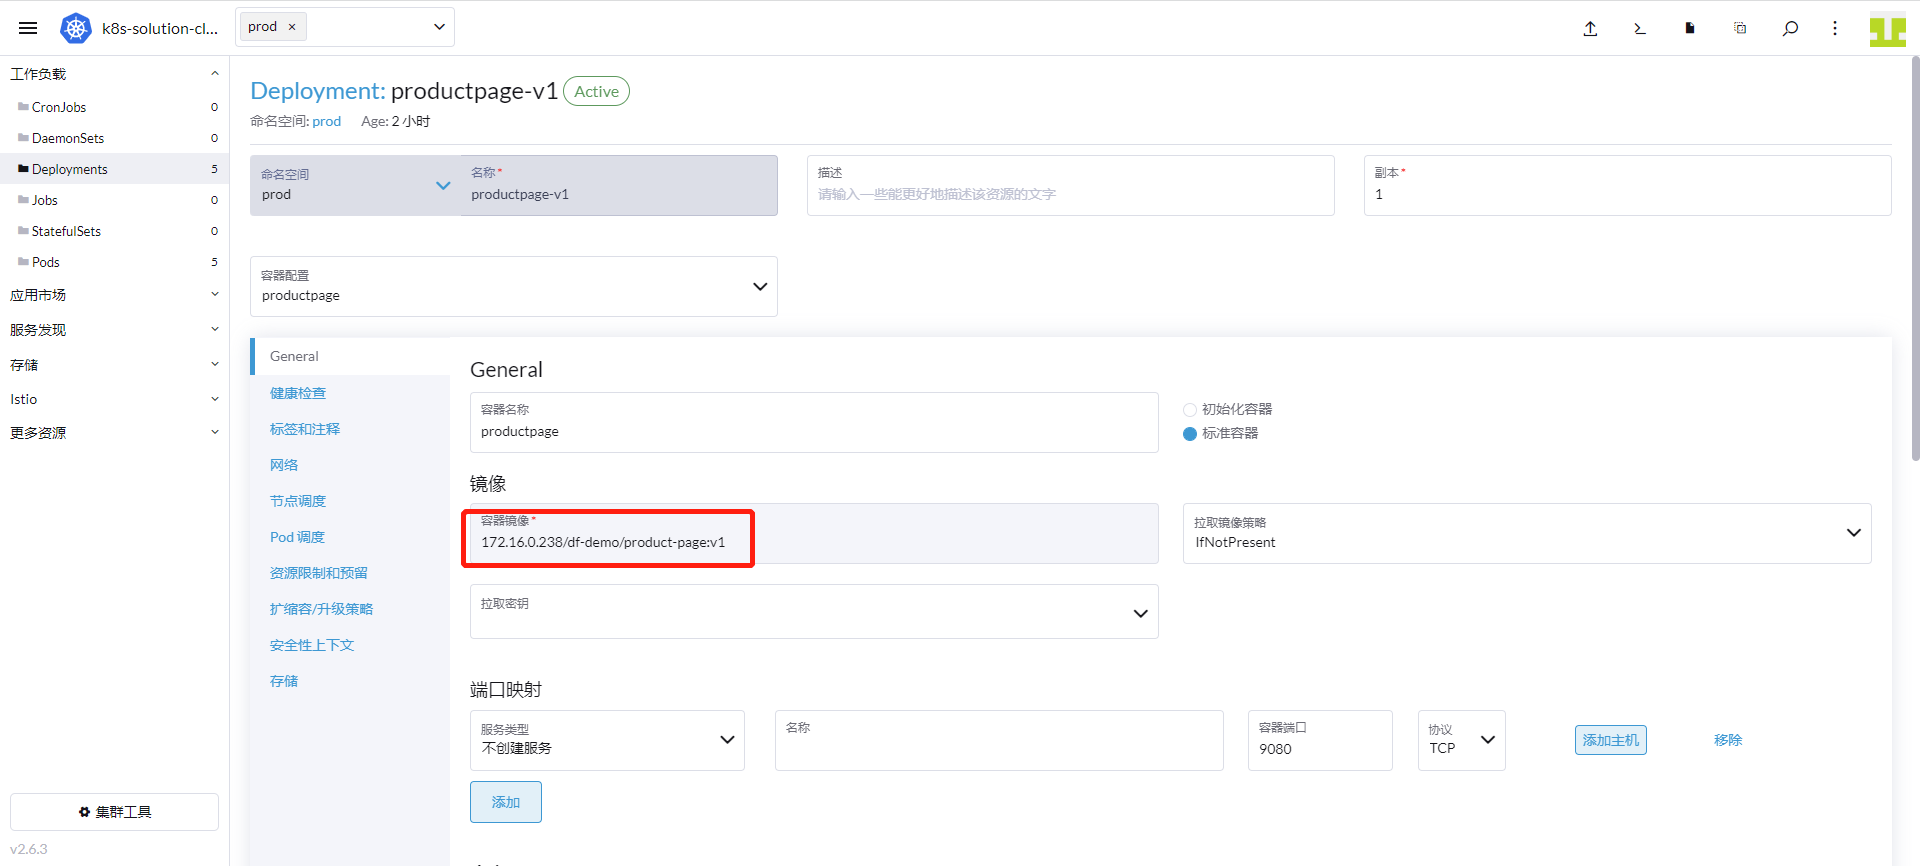
イメージ image: docker.io/istio/examples-bookinfo-productpage-v1:1.16.2 を以下のイメージに置き換えます。image: 172.16.0.238/df-demo/product-page:v1、「保存」をクリックします。
5.4 ユーザーアクセスモニタリング
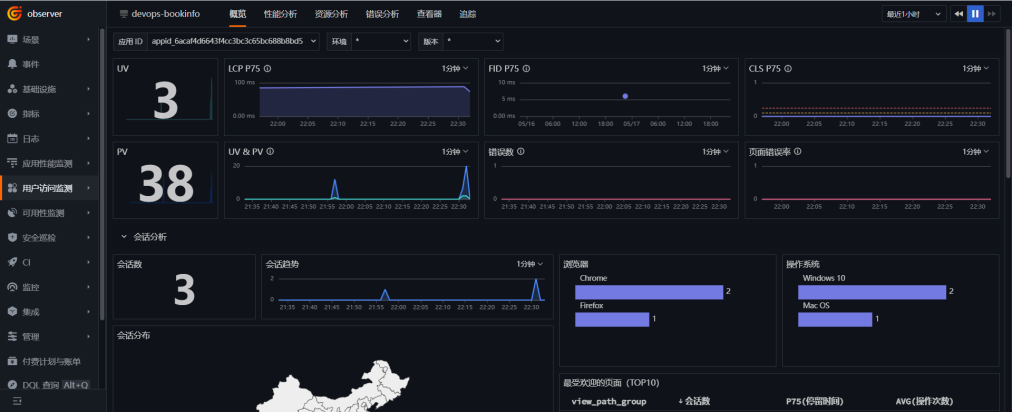
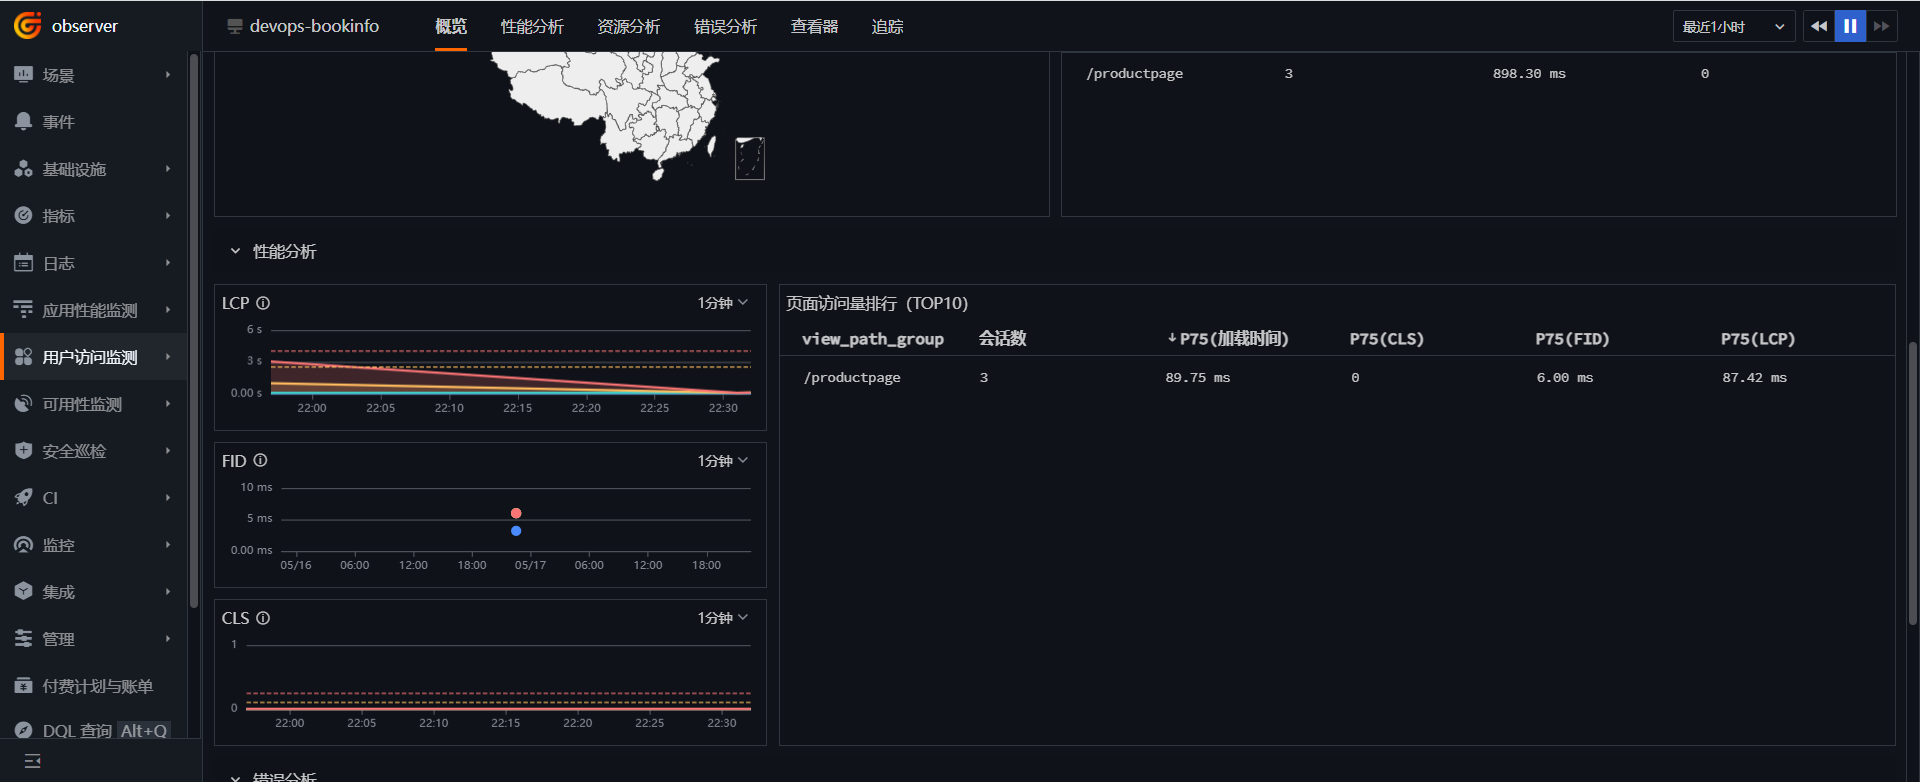
「Guance」にログインし、「ユーザーアクセスモニタリング」に進入します。devops-bookinfo アプリケーションを見つけてクリックし、UV、PV、セッション数、アクセスされたページなどの情報を確認します。
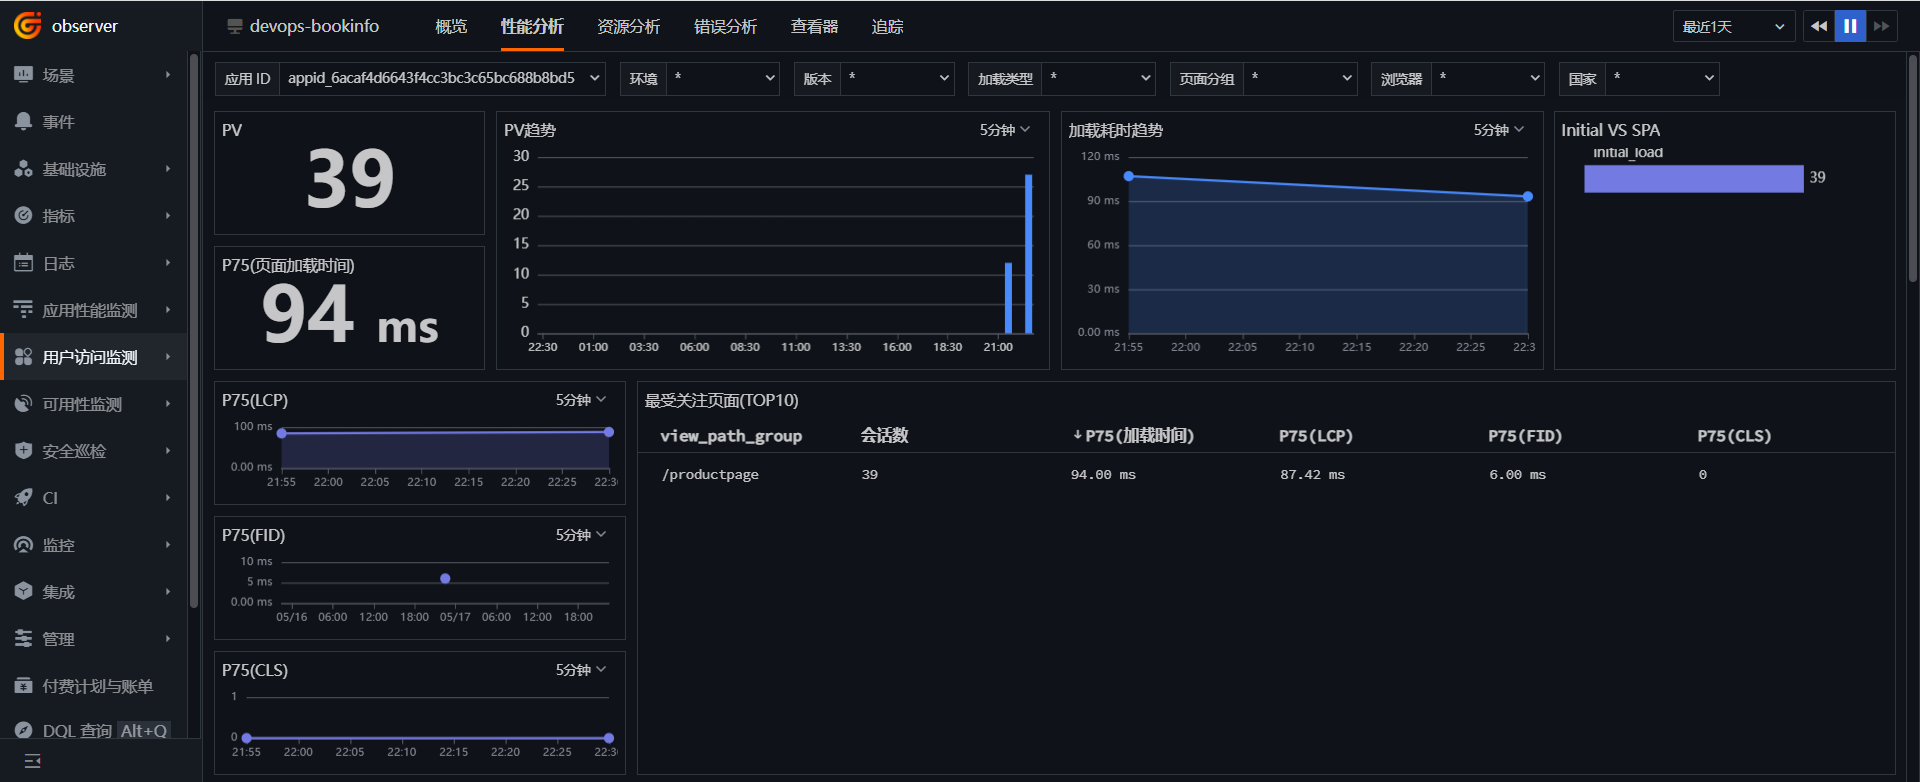
パフォーマンス分析
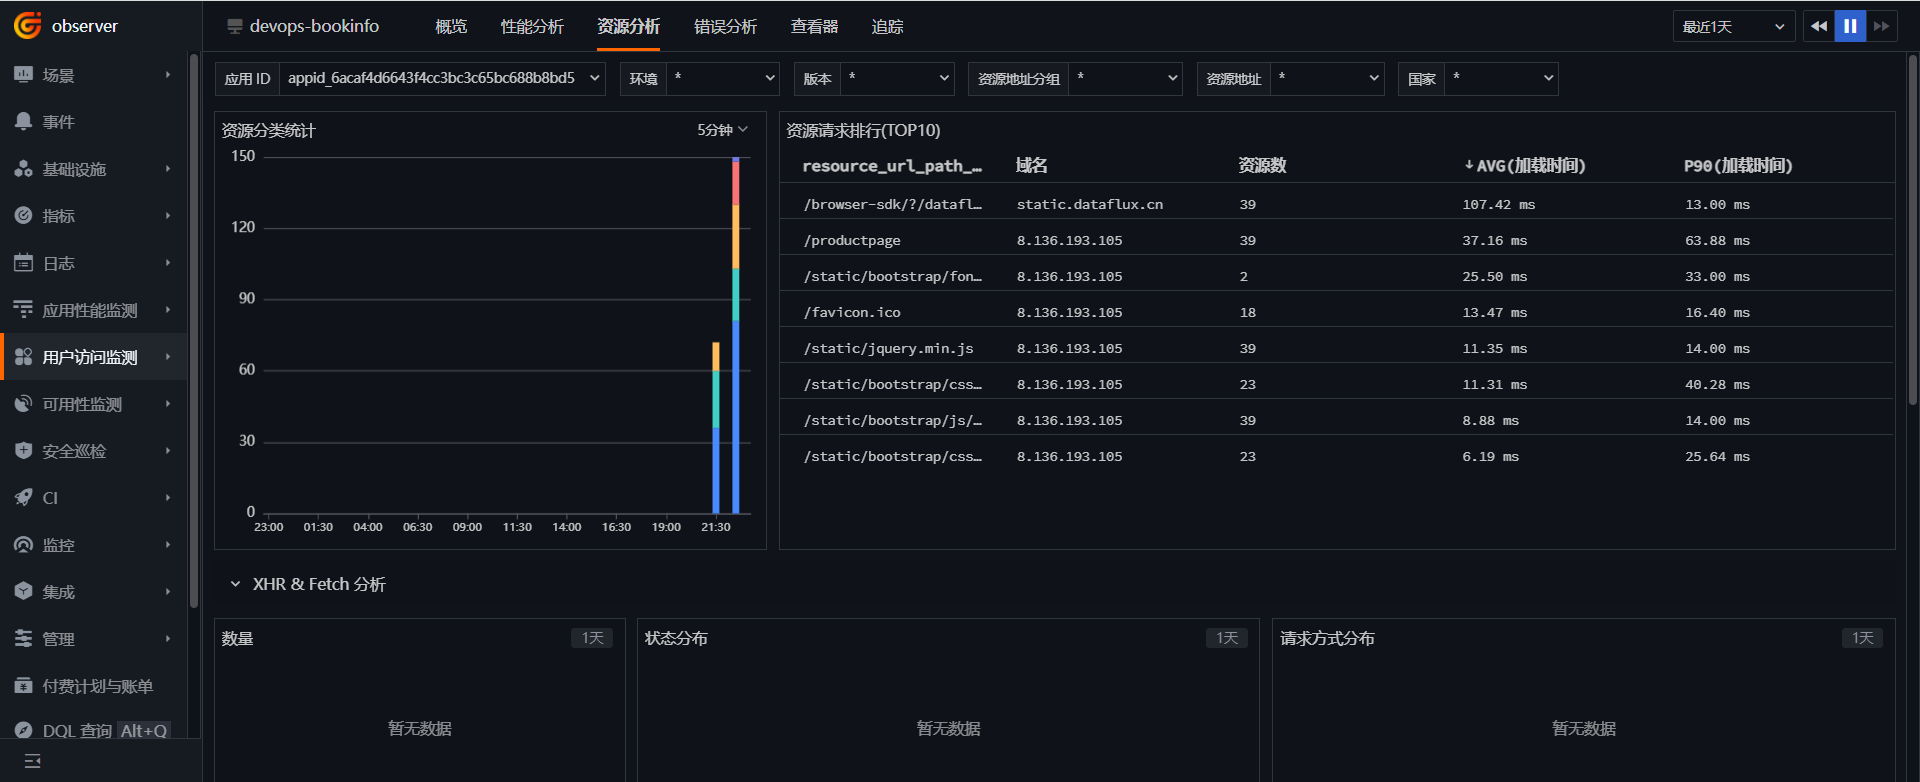
リソース分析
手順 6: ログの可観測性
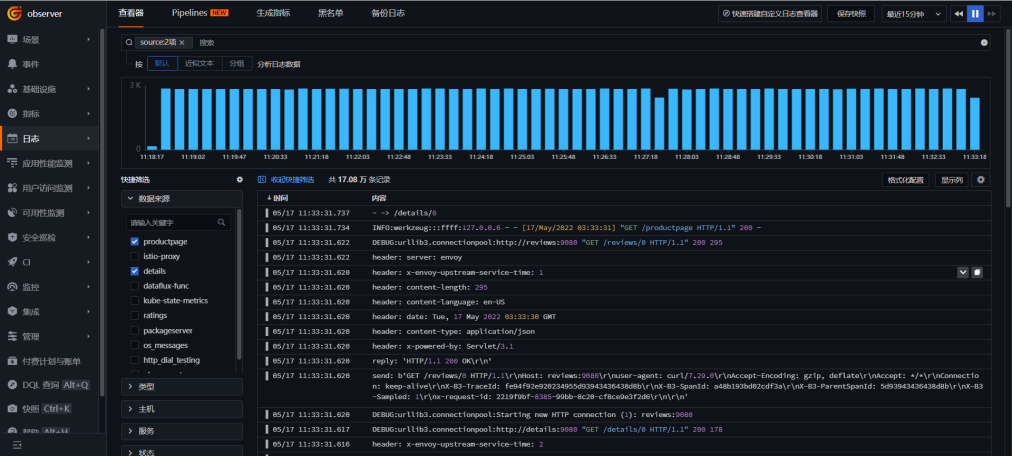
datakit のデプロイ時の設定に従い、デフォルトで /dev/stdout に出力されるログを収集します。「Guance」にログインし、「ログ」に進入してログ情報を確認します。さらに、Guance は RUM、APM、ログ間の連携機能も提供しています。詳細については、公式ドキュメントを参照して適切な設定を行ってください。
手順 7: Gitlab CI の可観測性
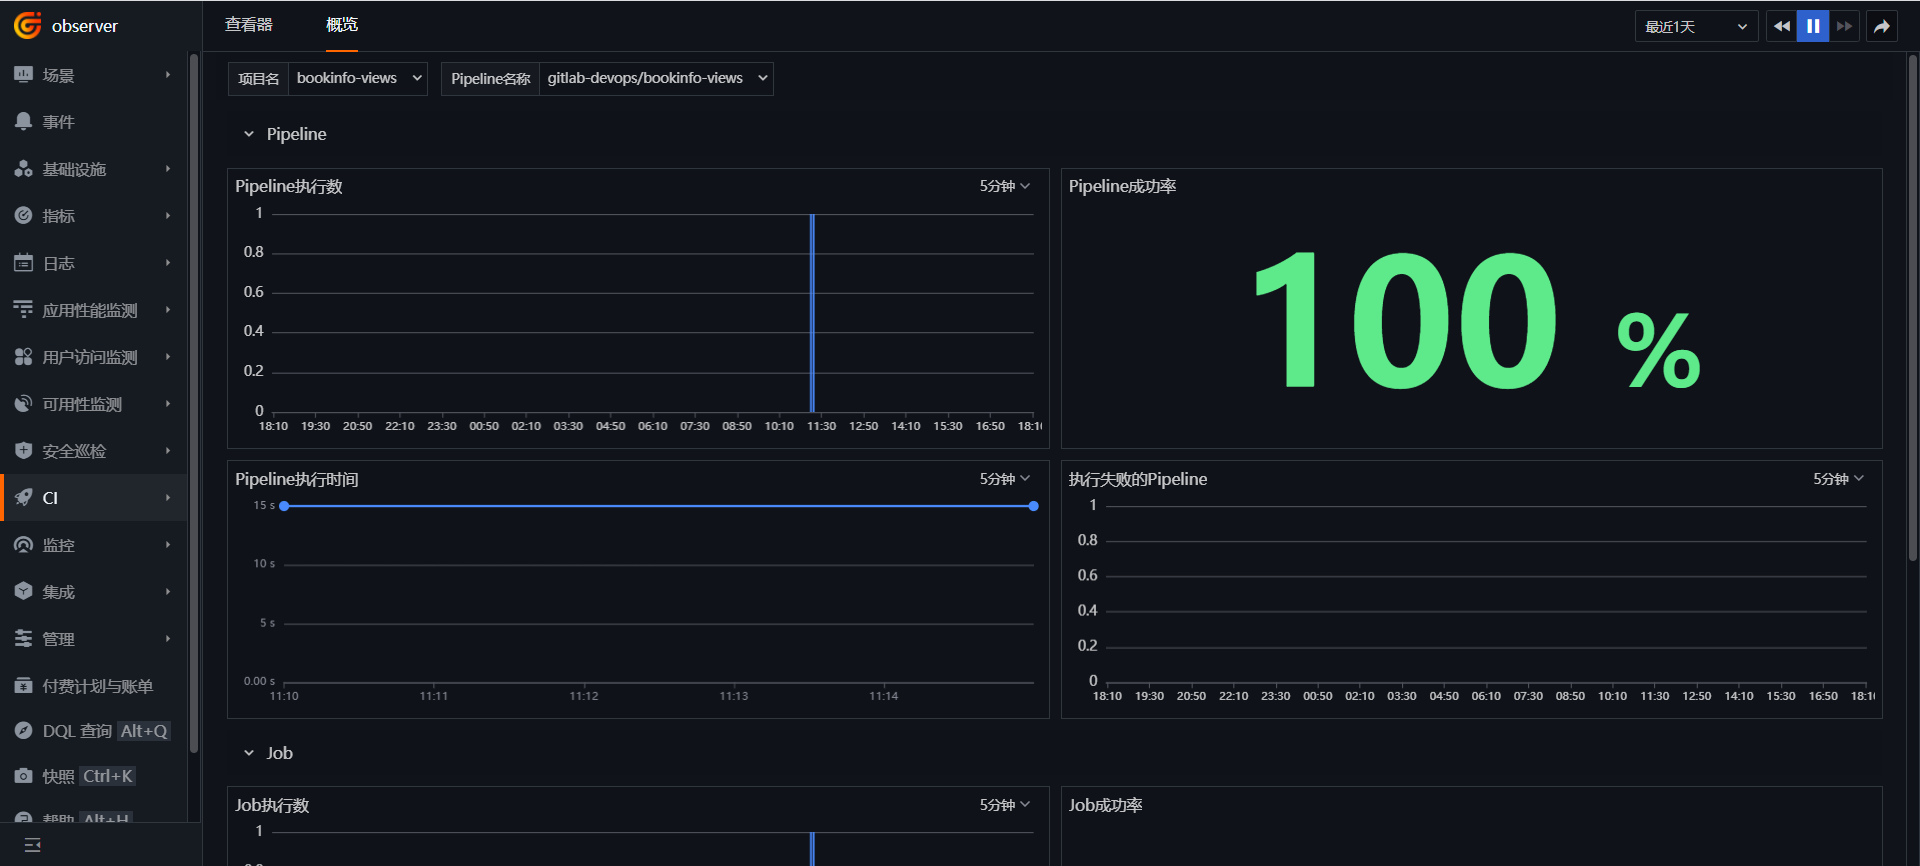
「Guance」にログインし、「CI」に進入します。「概要」をクリックして bookinfo-views プロジェクトを選択し、Pipeline と Job の実行状況を確認します。
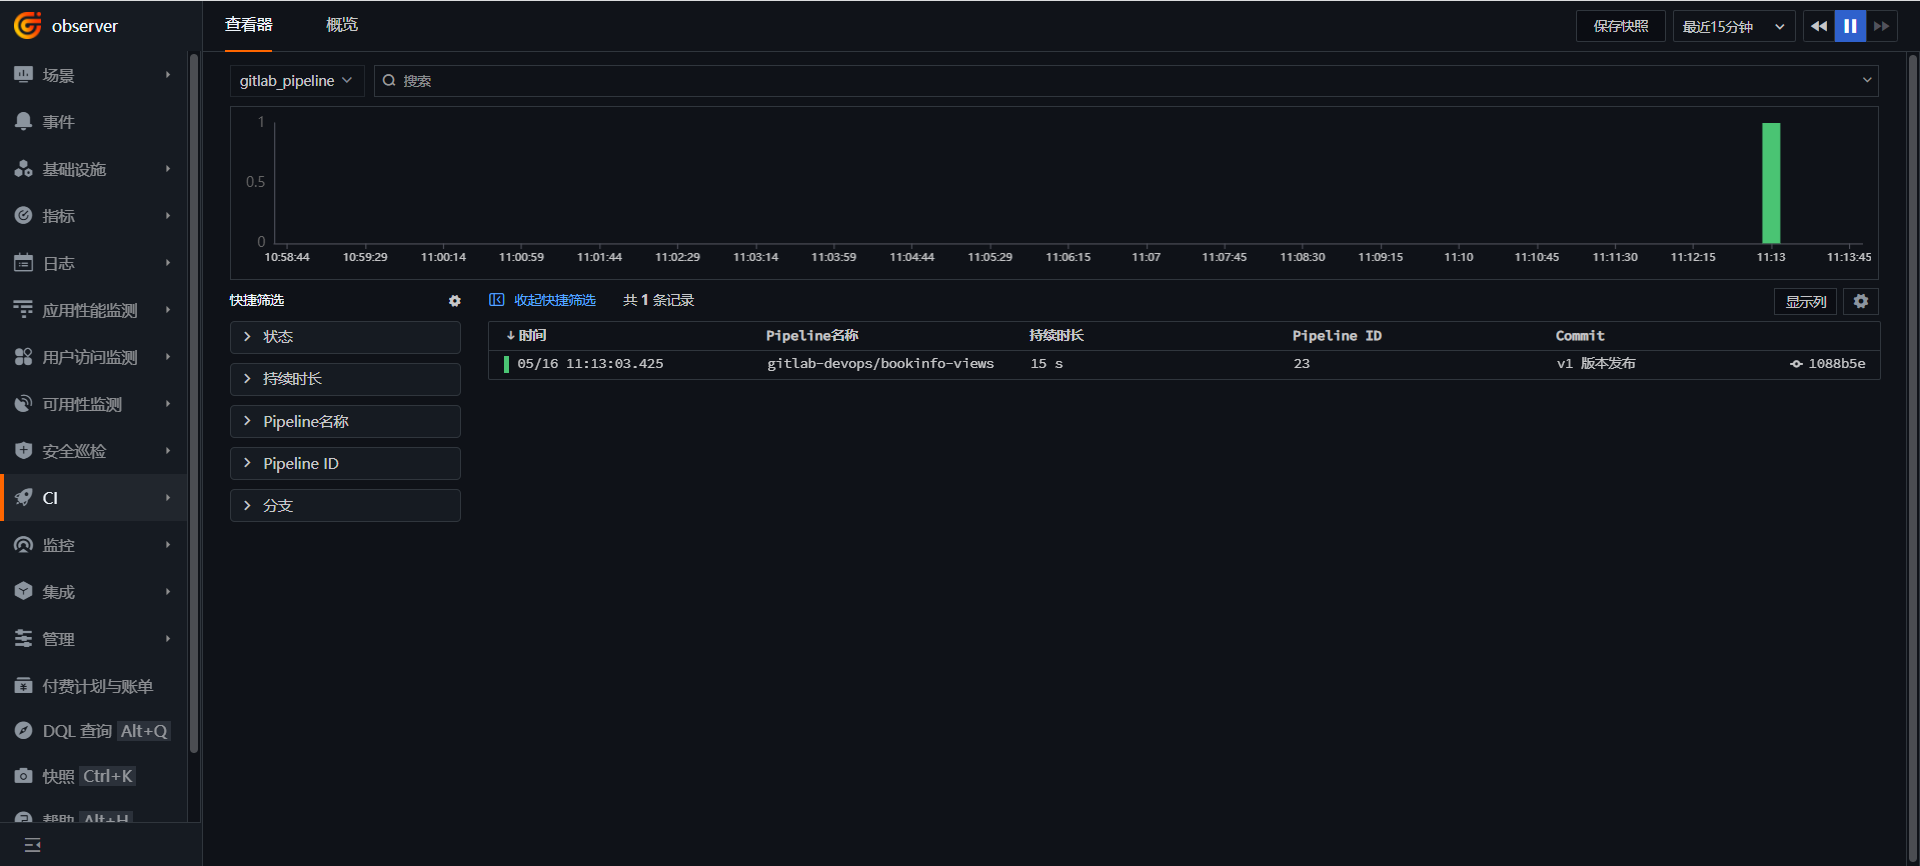
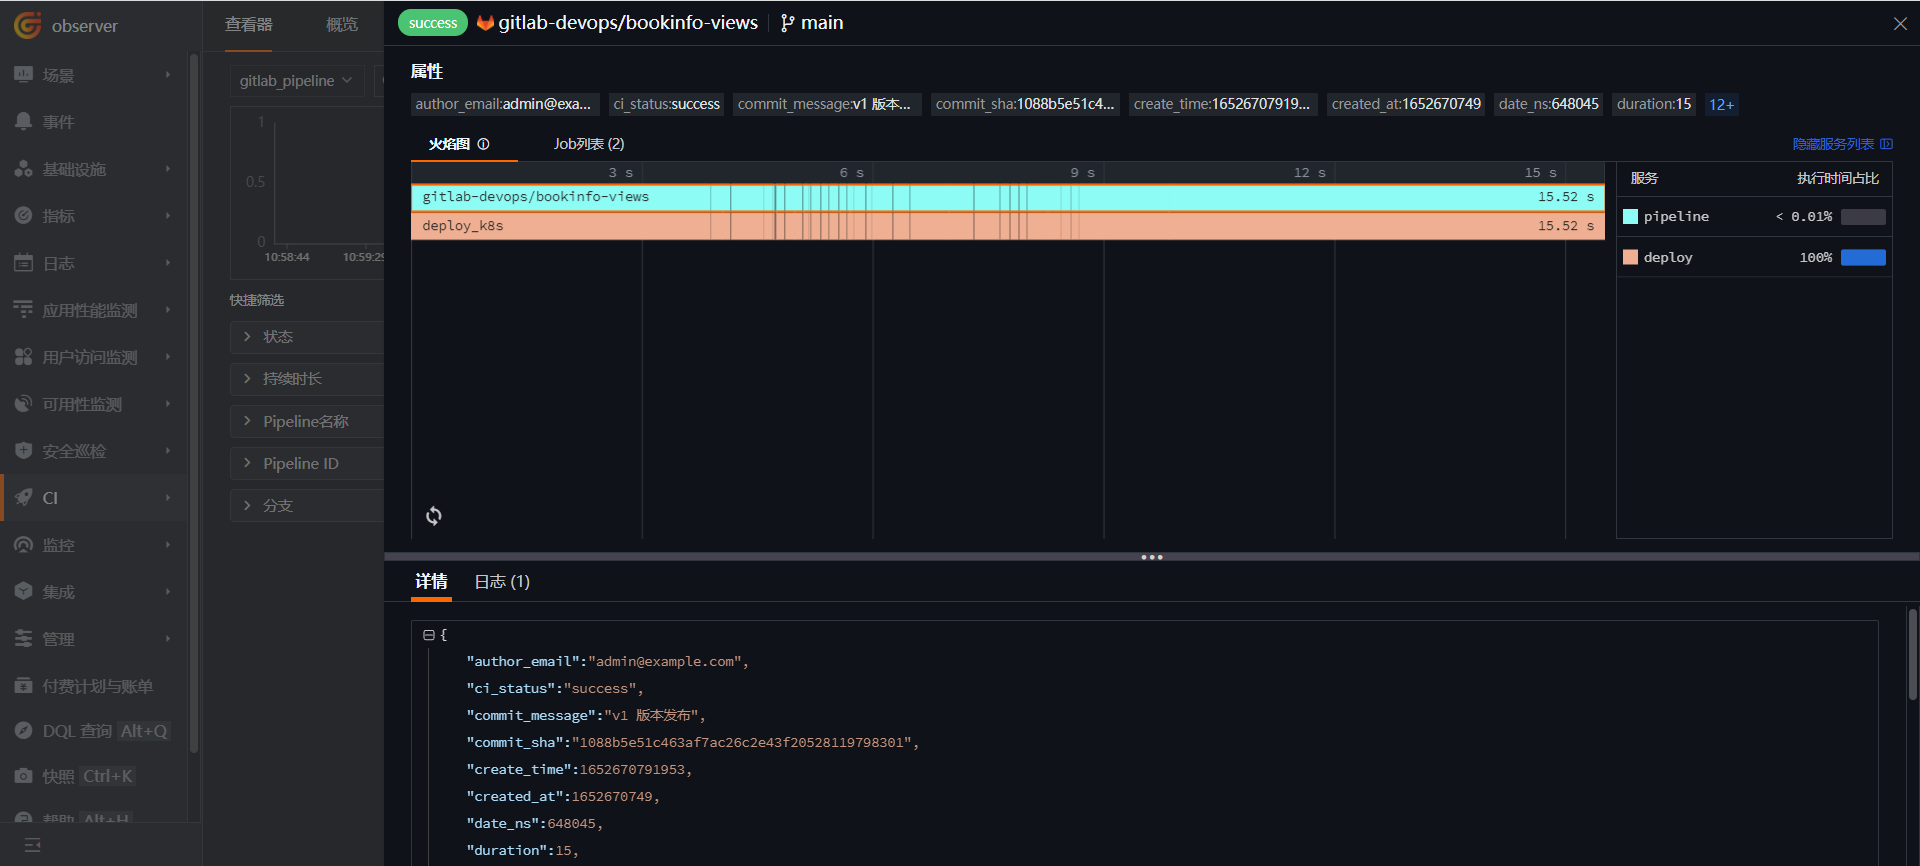
「CI」に進入し、「エクスプローラー」をクリックして gitlab_pipeline を選択します。
「CI」に進入し、「エクスプローラー」をクリックして gitlab_job を選択します。
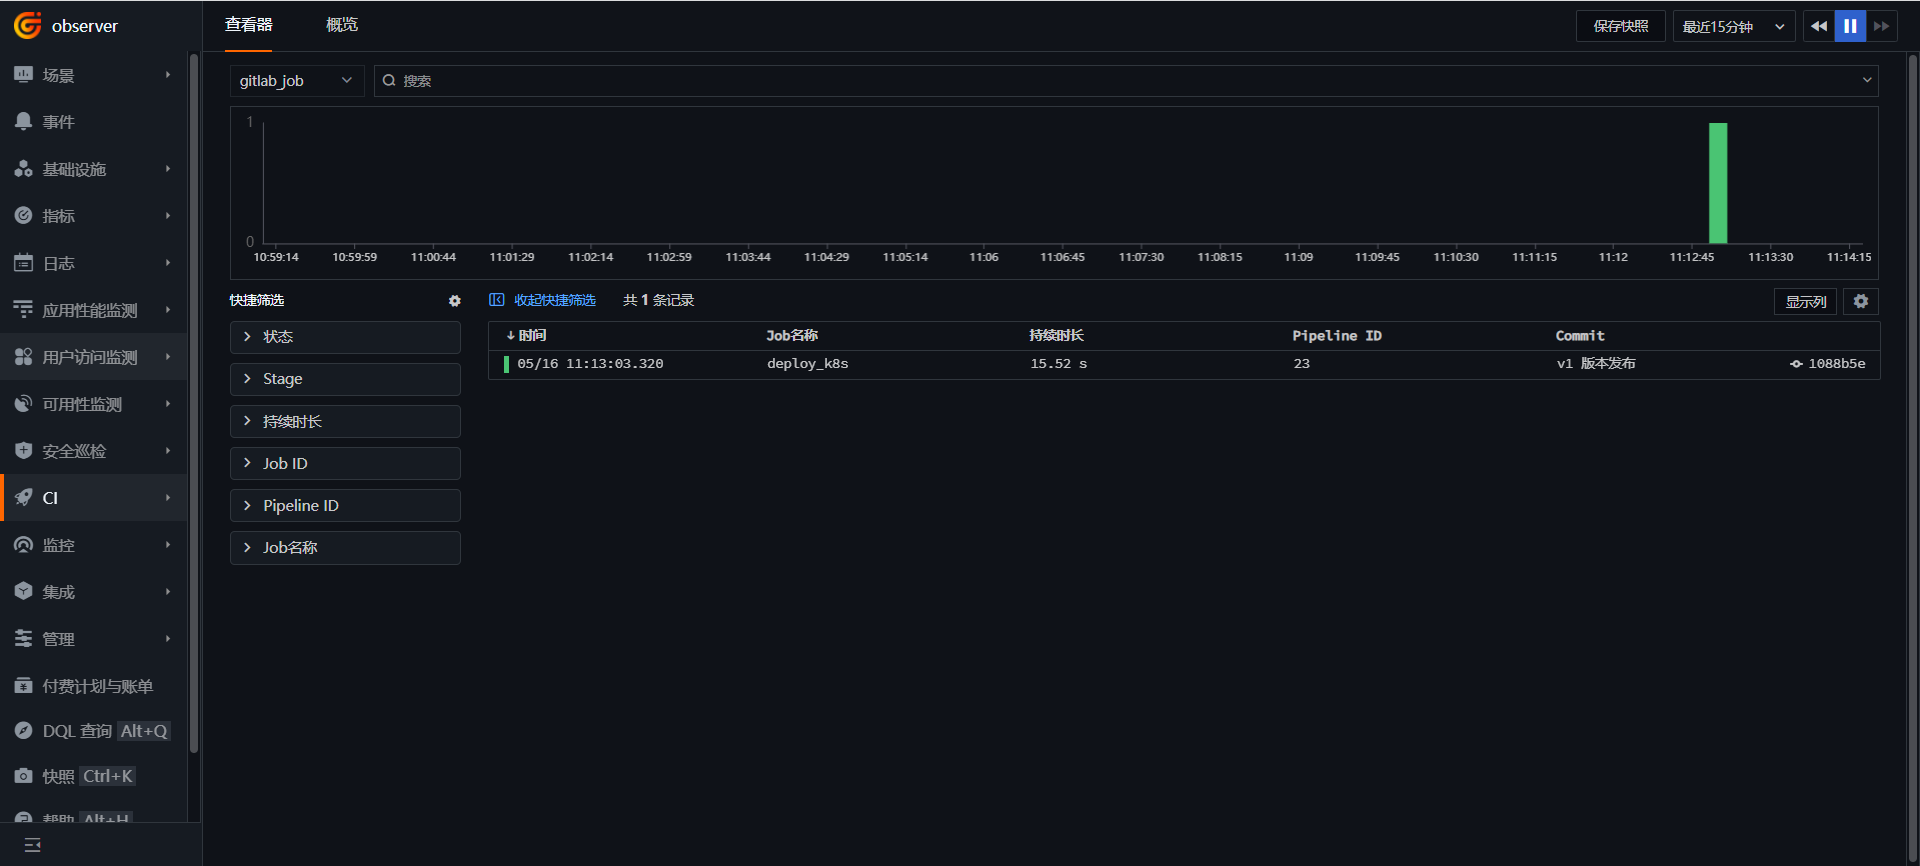
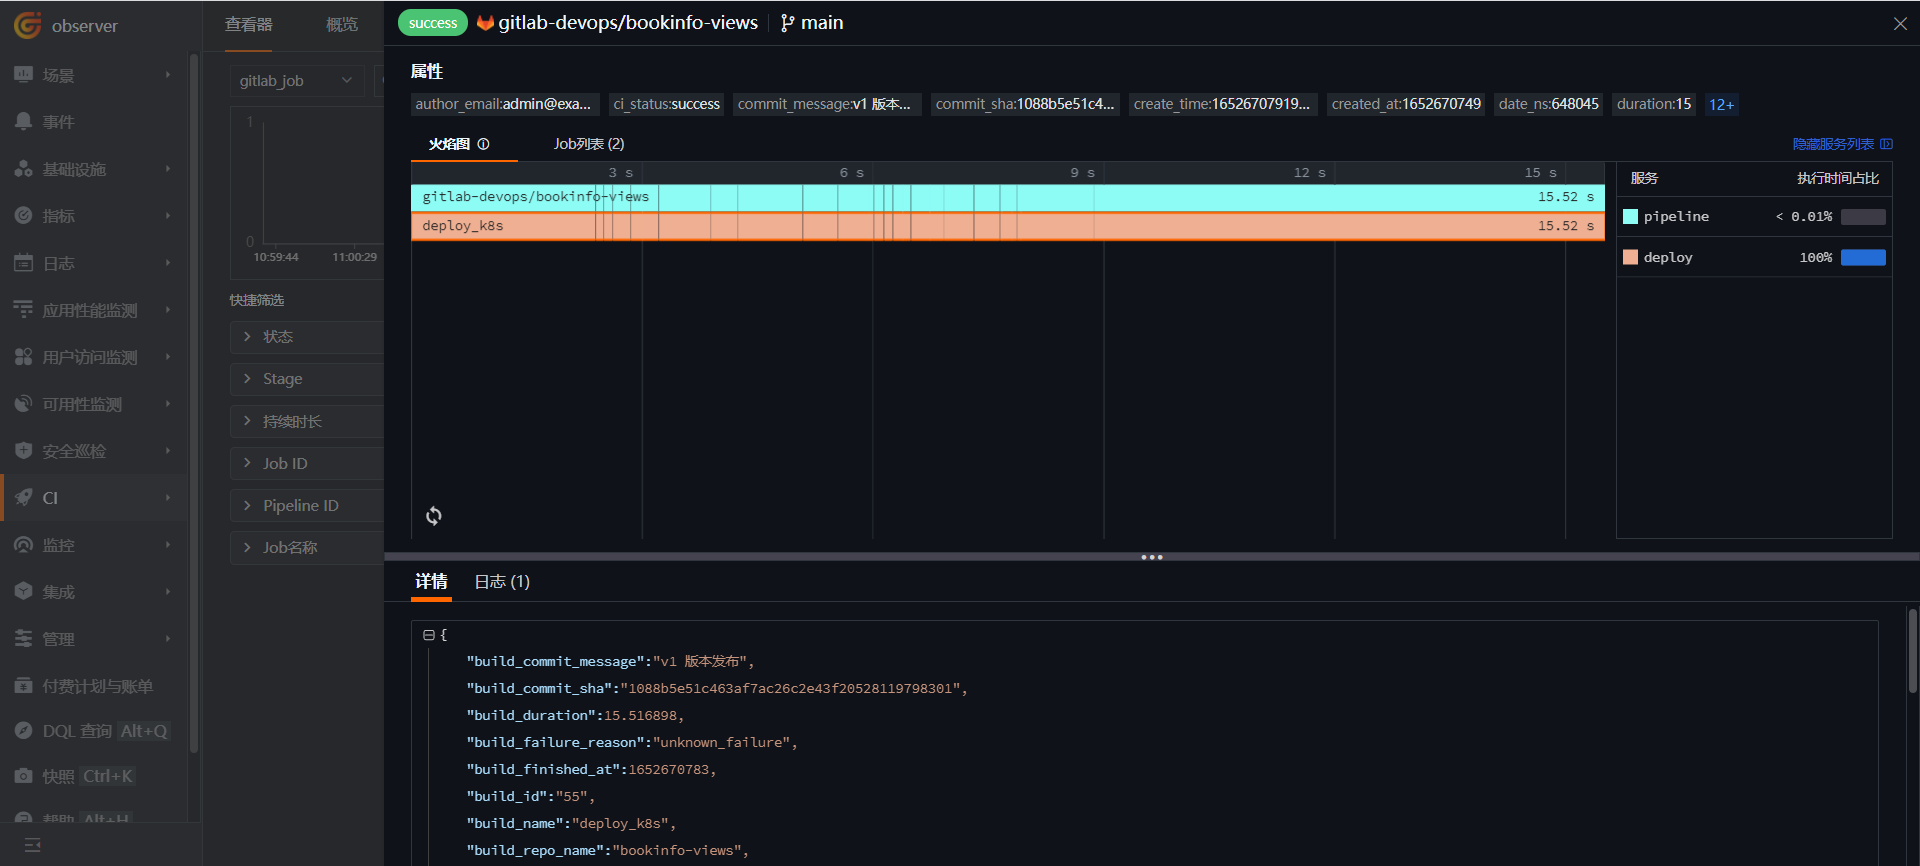
手順 8: カナリアリリースの可観測性
操作手順は、最初に DestinationRule と VirtualService を作成してトラフィックを reviews-v1 バージョンのみに流し、reviews-v2 をリリースして 10% のトラフィックを reviews-v2 に切り替え、Guance で検証が成功したら、トラフィックを完全に reviews-v2 に切り替え、reviews-v1 を停止します。
8.1 DestinationRule の作成
「Rancher」→「クラスター」→「Istio」→「DestinationRule」に進み、「作成」をクリックします。
名前空間に「prod」、名前に「reviews」、Input a host に「reviews」を入力し、「Subset v1」と「Subset v2」を追加します。詳細は下図の通りです。最後に「作成」をクリックします。
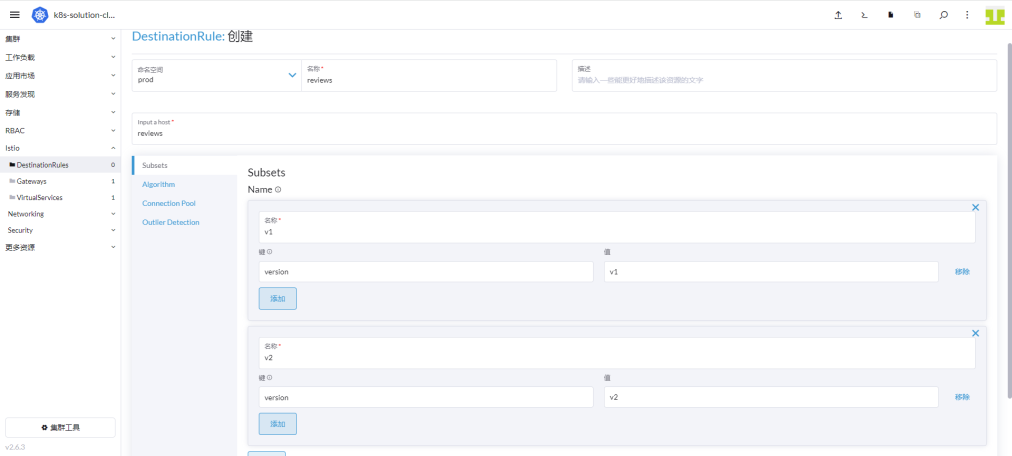
8.2 VirtualService の作成
「Rancher」→「クラスター」→「Istio」→「VirtualServices」に進み、上部の「YAML のインポート」アイコンをクリックし、以下の内容を入力して「インポート」をクリックします。
apiVersion: networking.istio.io/v1alpha3
kind: VirtualService
metadata:
  name: reviews
  namespace: prod
spec:
  hosts:
    - reviews
  http:
    - route:
        - destination:
            host: reviews
            subset: v1
8.3 reviews-v2 バージョンのリリース
「gitlab」にログインし、bookinfo-views プロジェクトを見つけます。.gitlab-ci.yml ファイルの APP_VERSION の値を v2 に変更し、コードをコミットします。
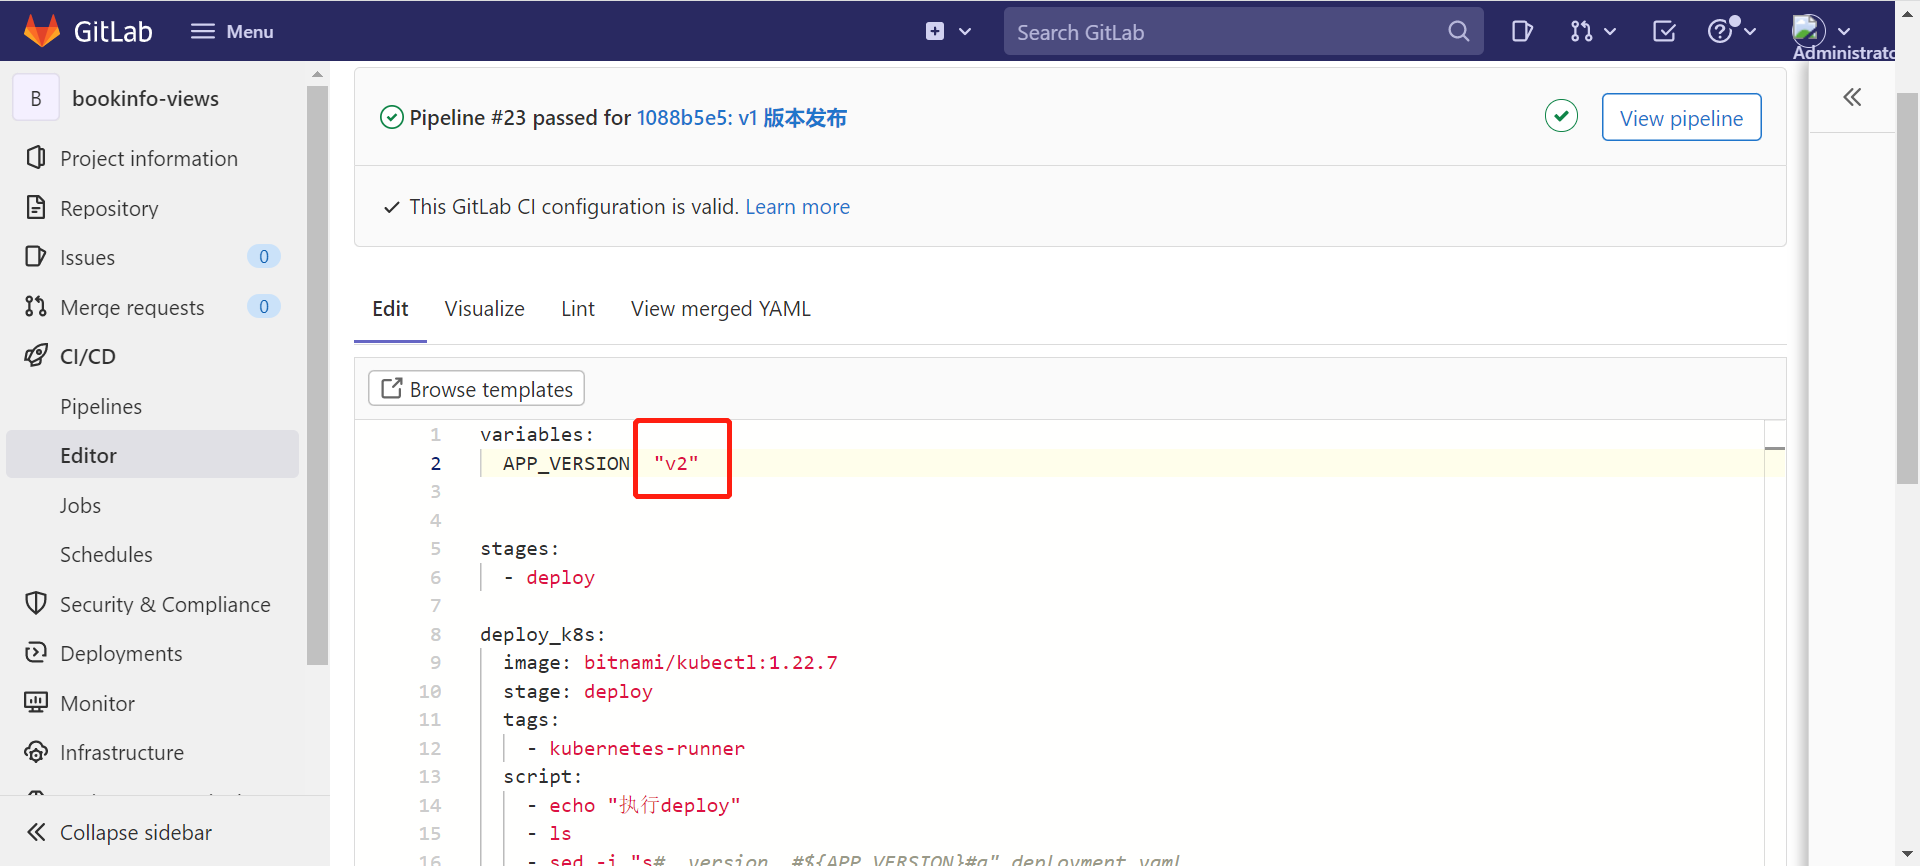
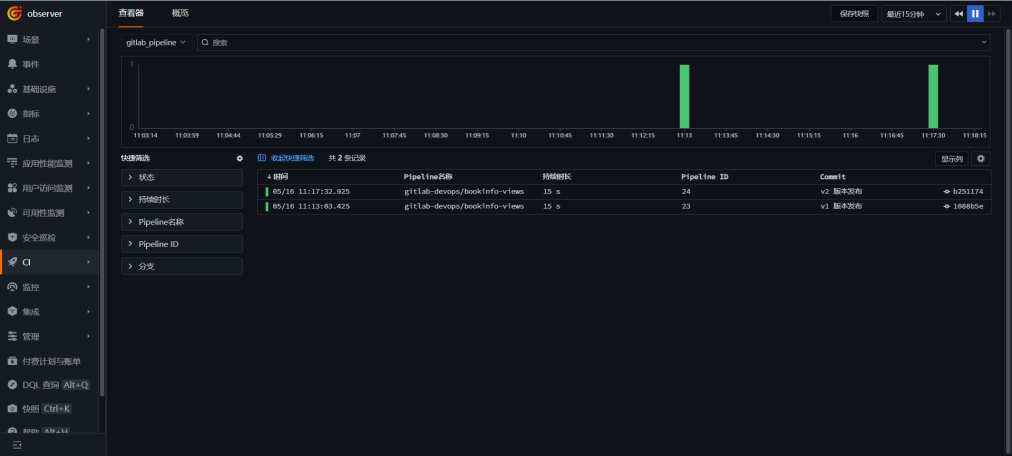
「Guance」にログインし、「CI」→「エクスプローラー」に進むと、v2 バージョンがリリースされていることを確認できます。
8.4 トラフィックを reviews-v2 バージョンに切り替え
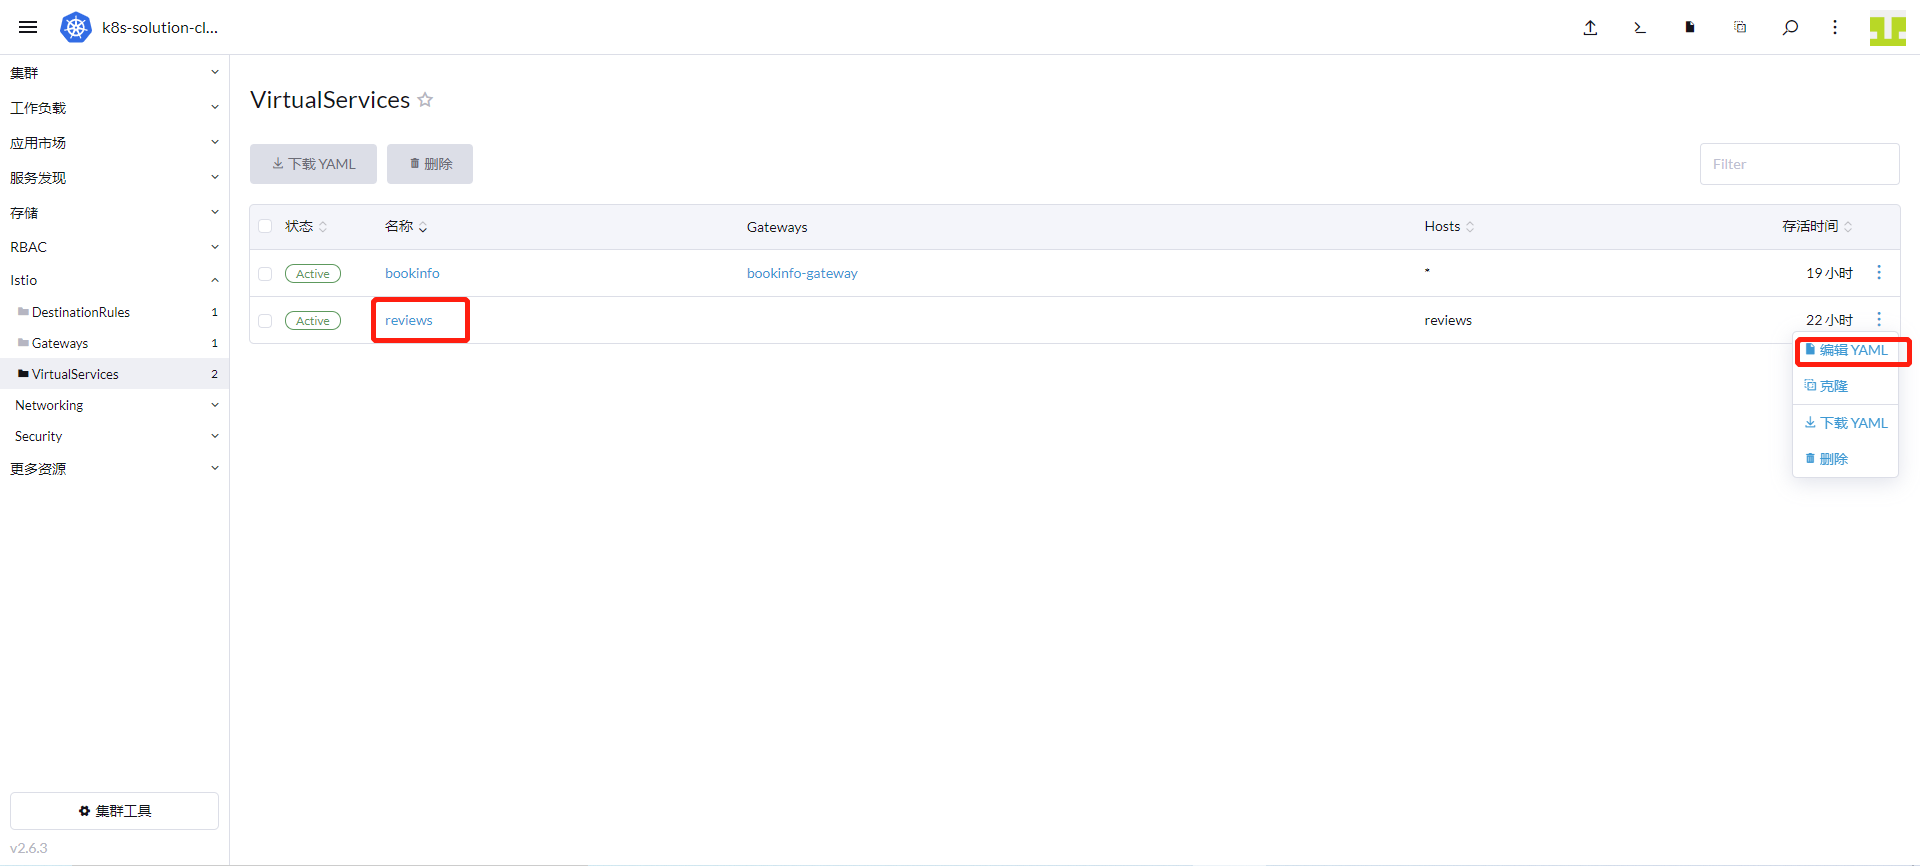
「Rancher」→「クラスター」→「Istio」→「VirtualServices」に進み、reviews の右側にある「YAML の編集」をクリックします。
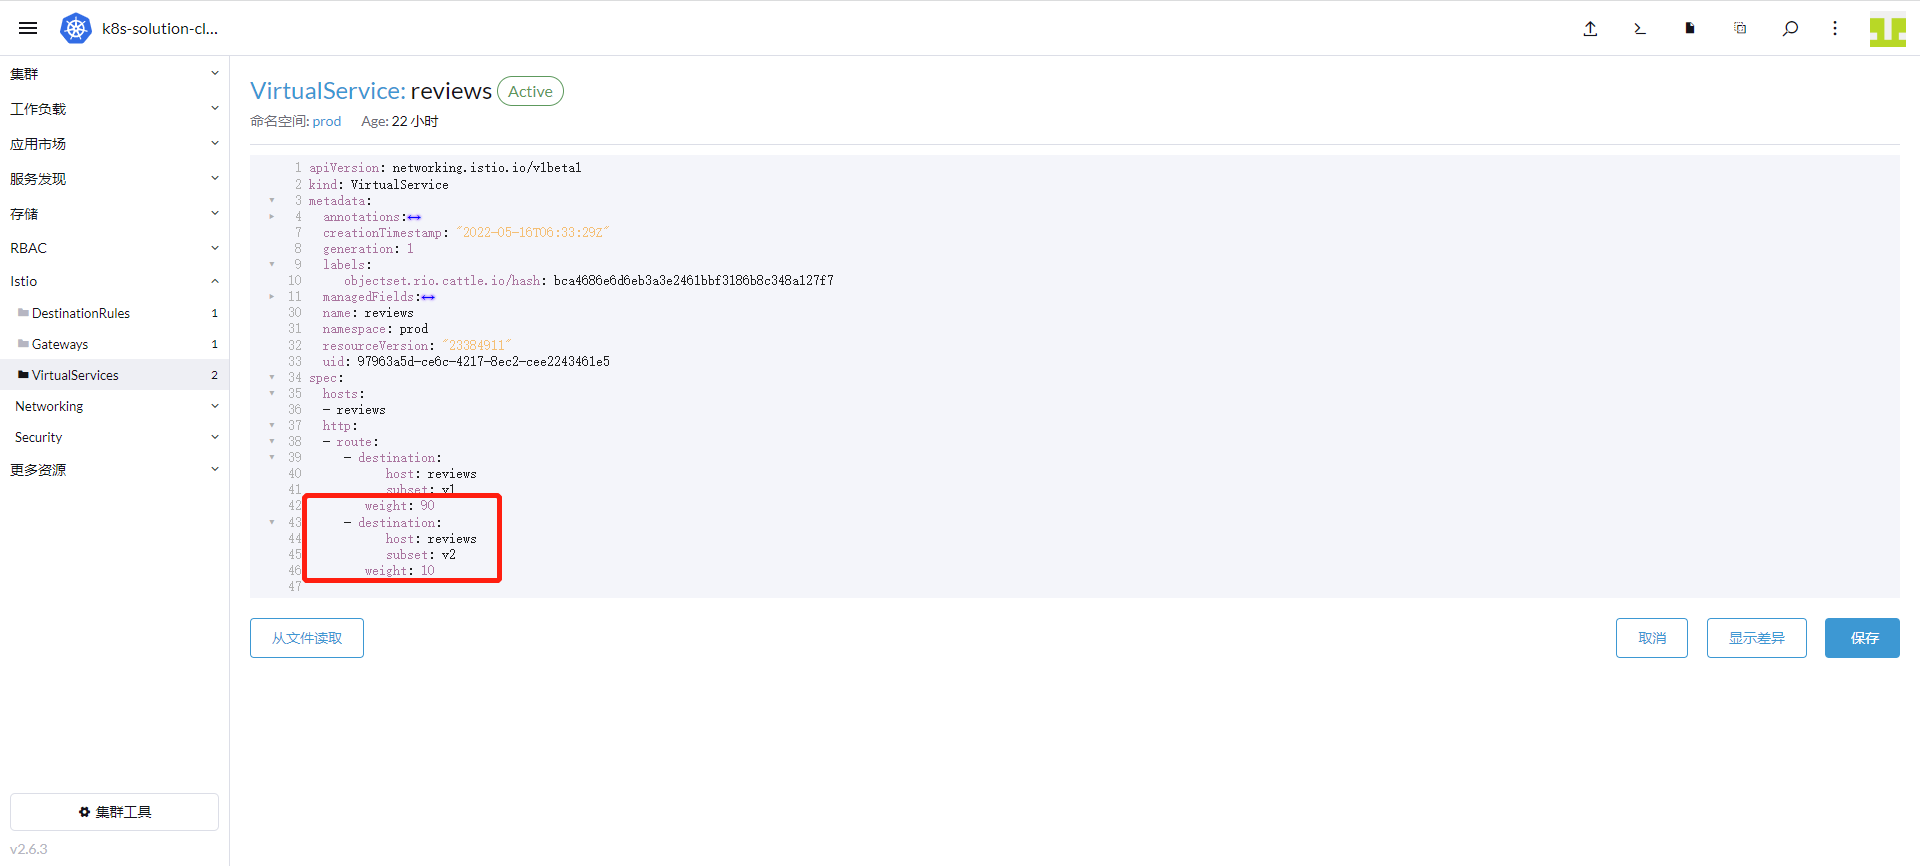
v1 の重みを 90、v2 の重みを 10 に設定し、最後に「保存」をクリックします。
8.5 reviews-v2 の実行状況の観測
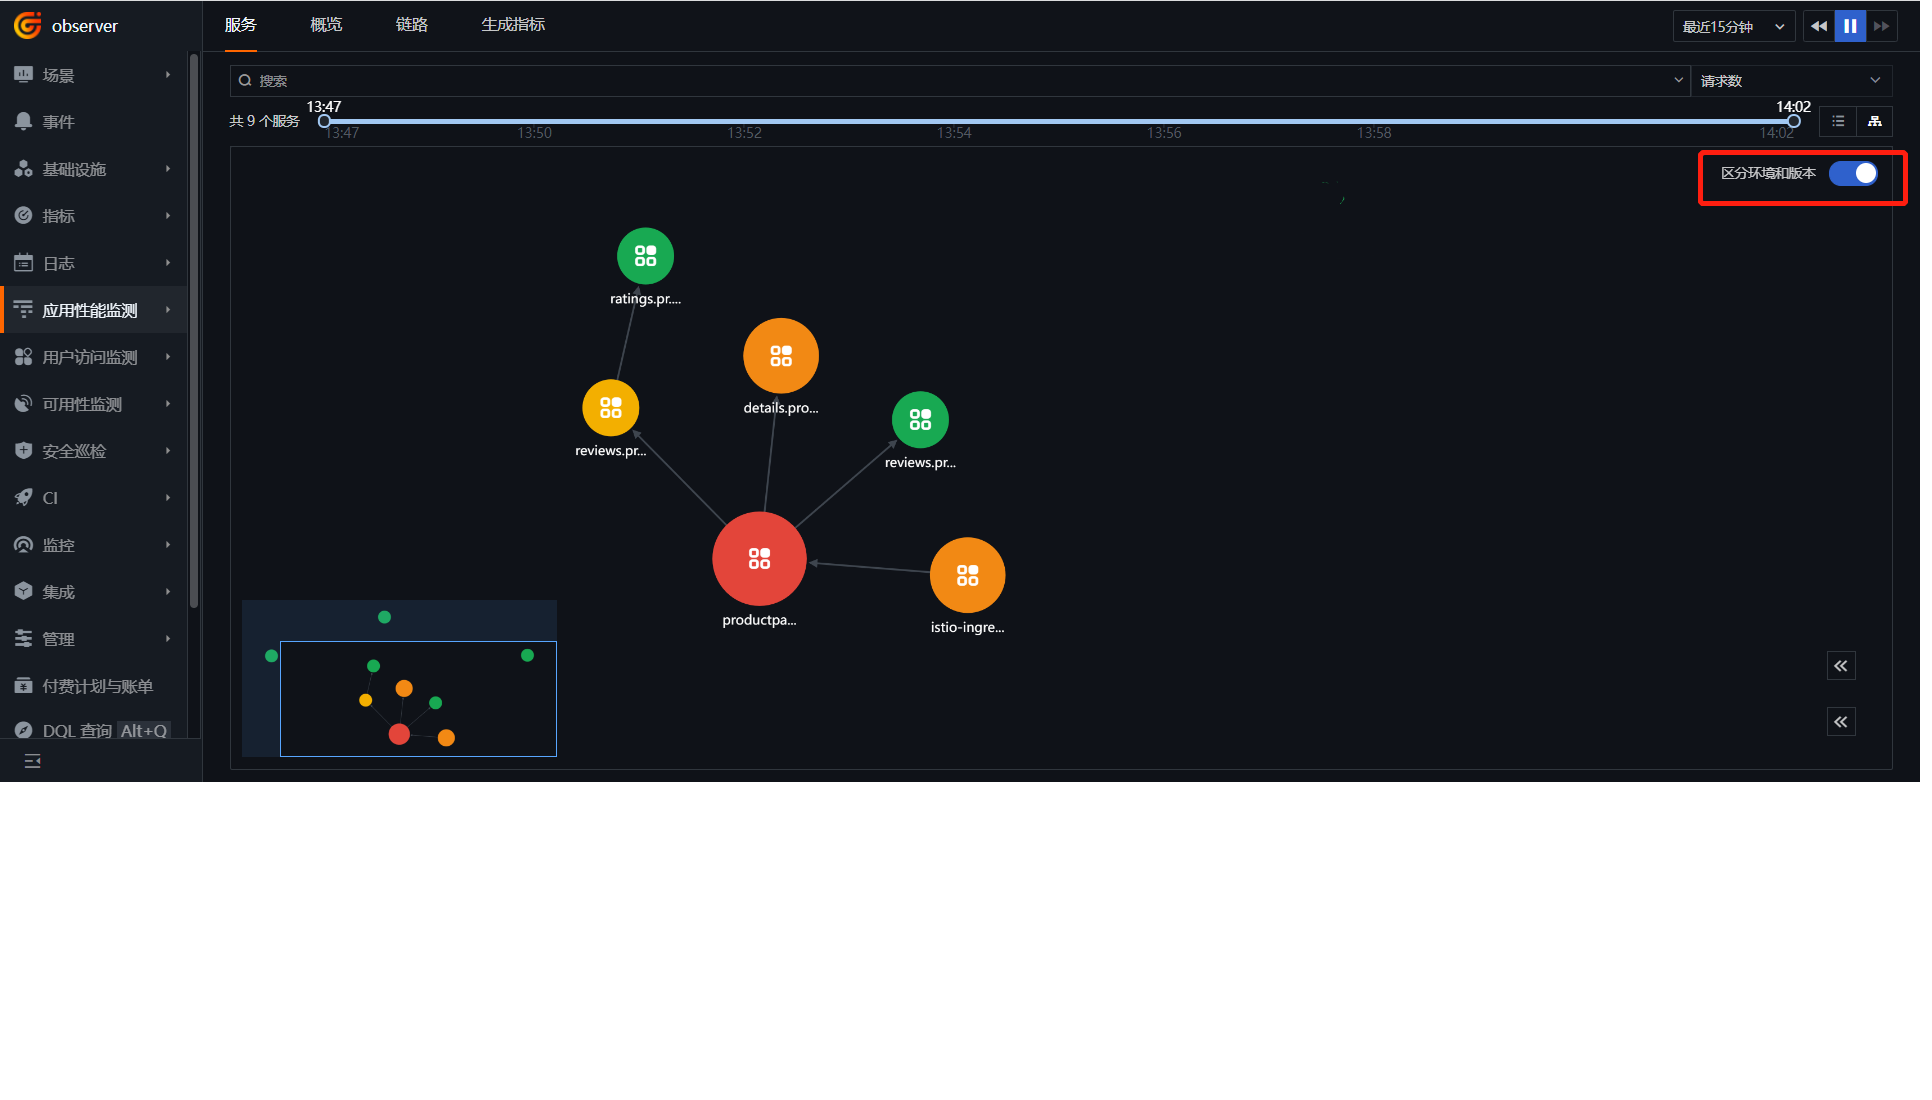
「Guance」にログインし、「APM」モジュールに進入し、右上のアイコンをクリックします。
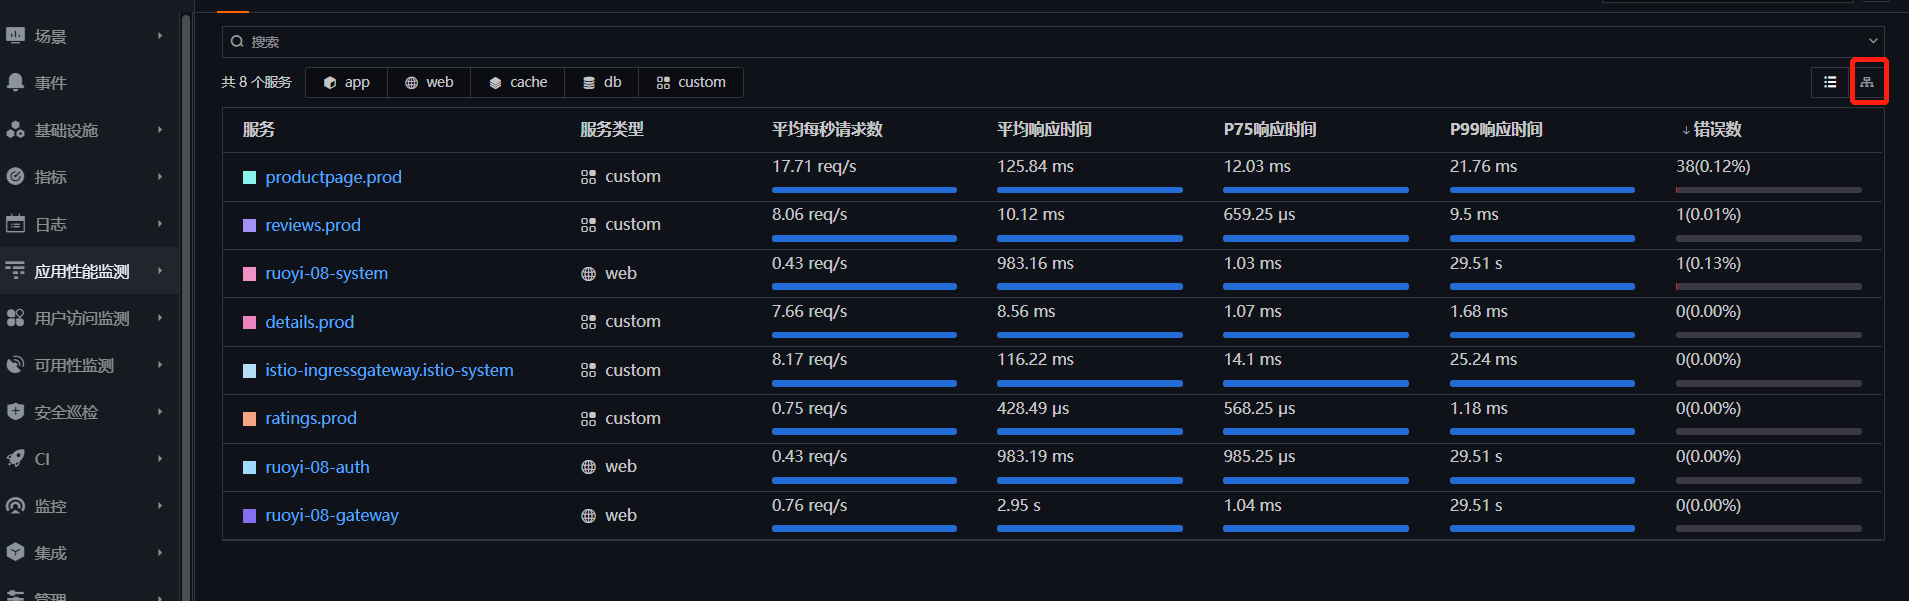
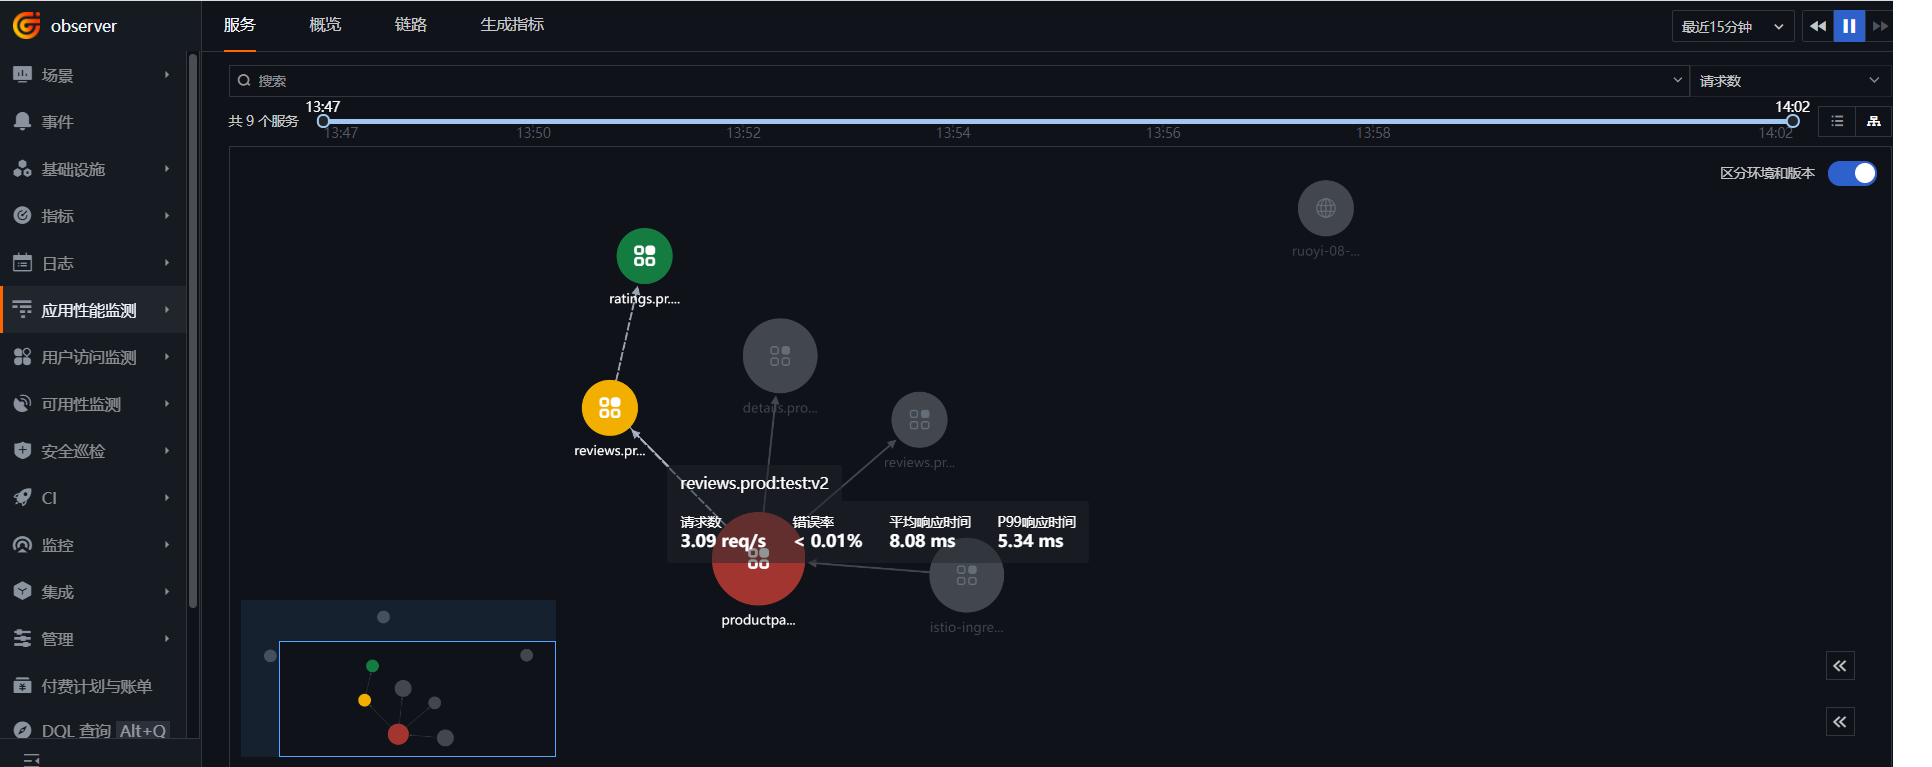
「環境とバージョンを区別する」を有効にし、bookinfo の呼び出しトポロジービューを確認します。
reviews-v2 上にマウスを移動すると、v2 が ratings に接続している一方で、reviews-v1 は ratings を呼び出していないことがわかります。
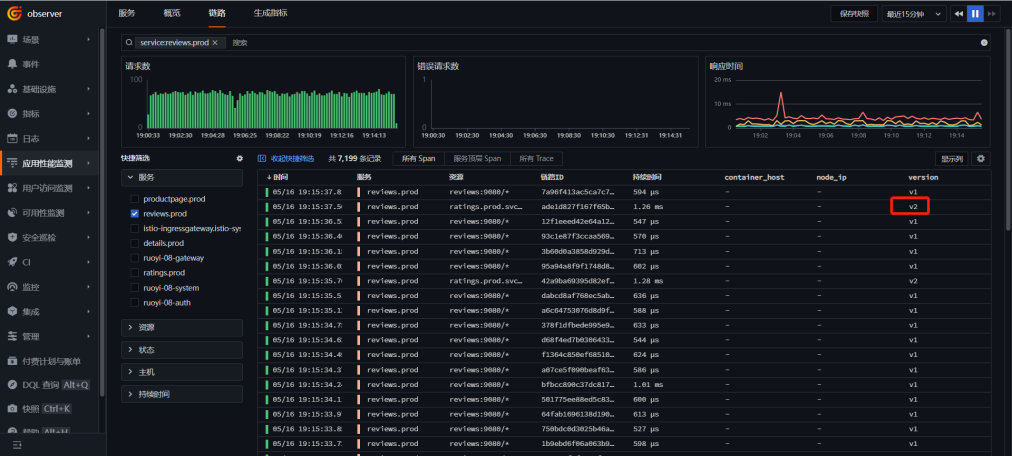
「トレース」をクリックし、「reviews.prod」サービスを選択して、v2 バージョンが含まれるトレースをクリックして進入します。
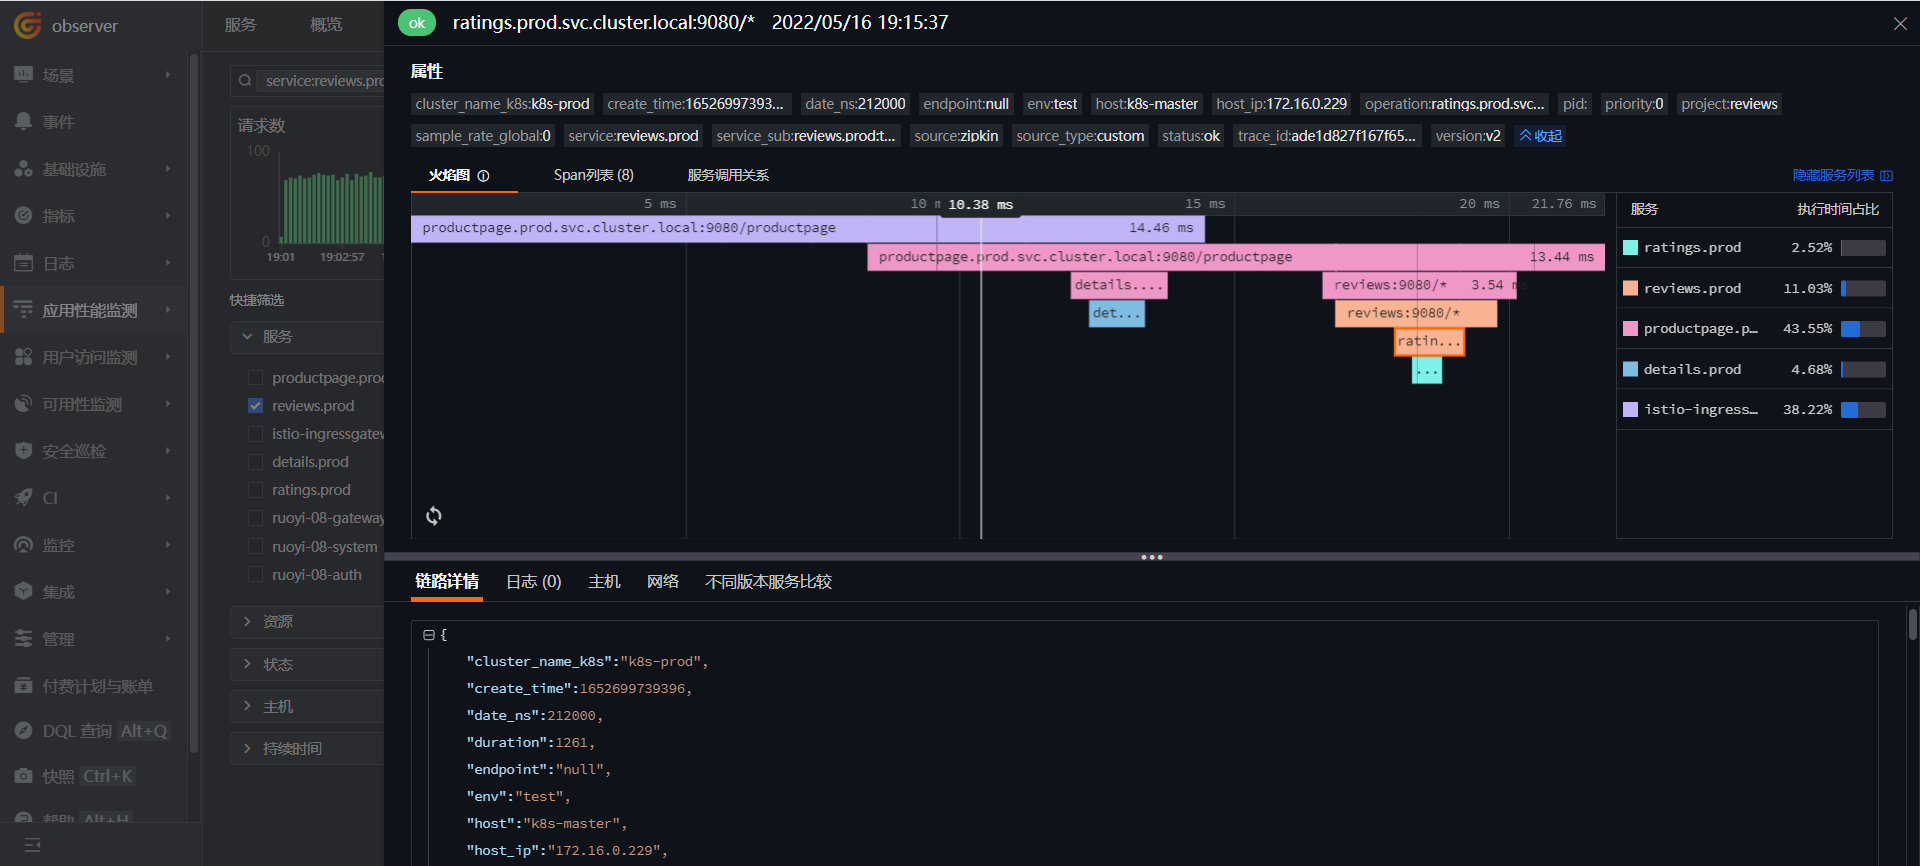
フレームグラフを確認します。
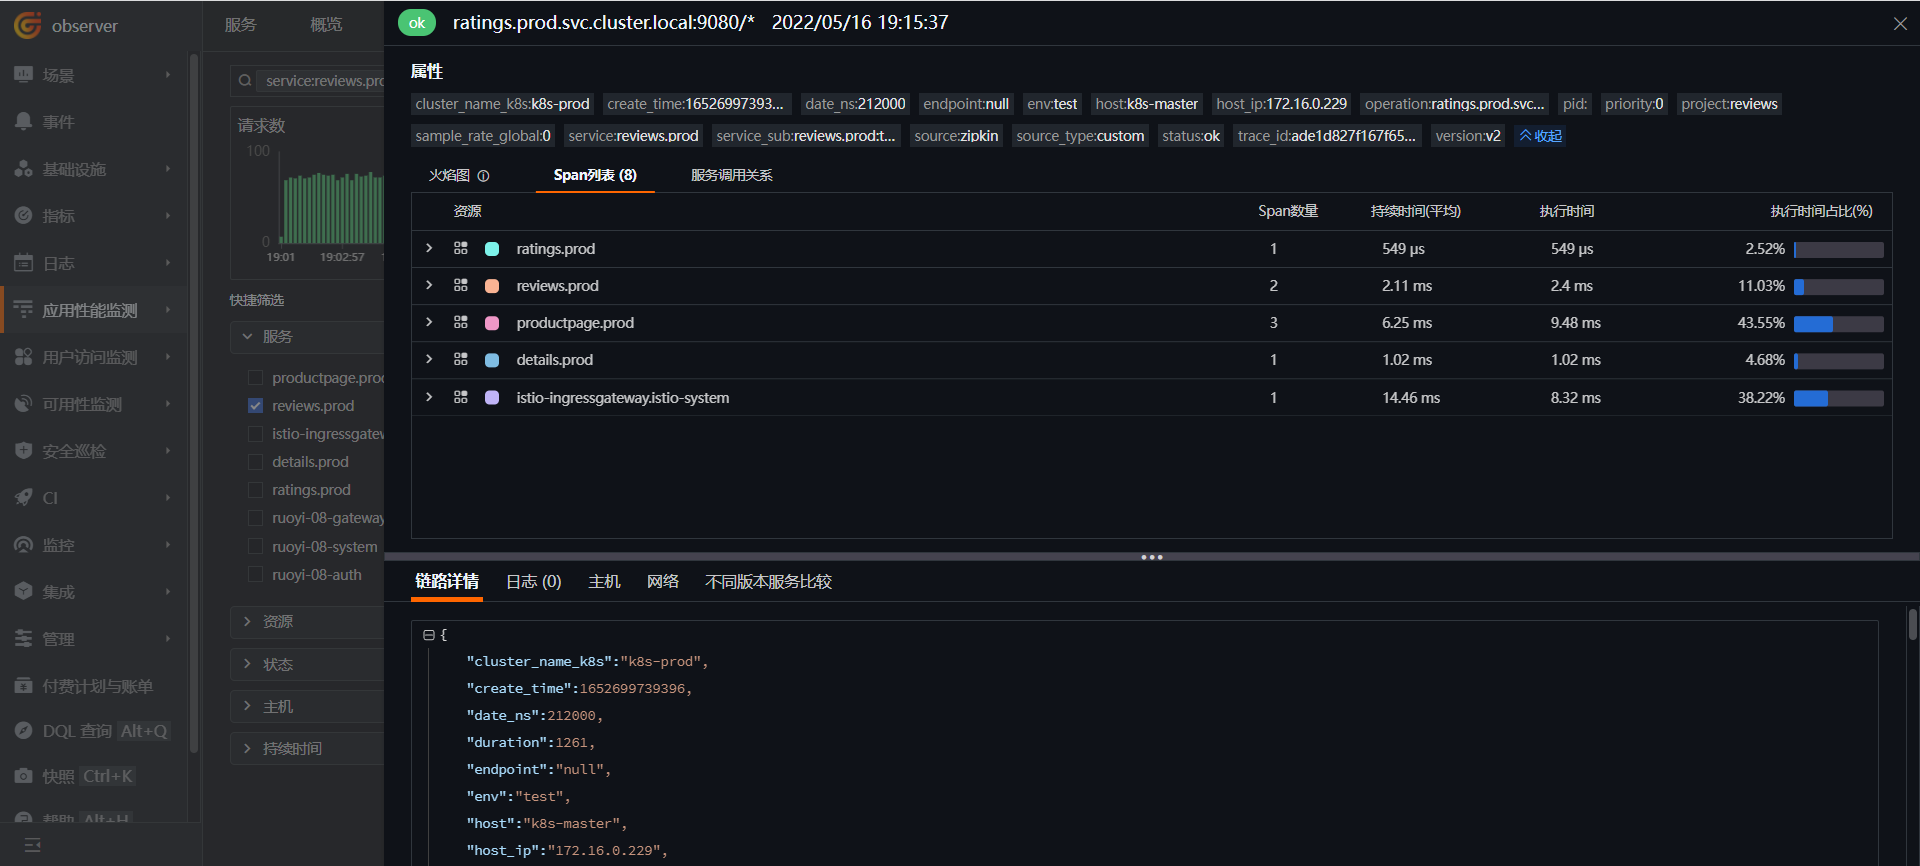
スパンリストを確認します。
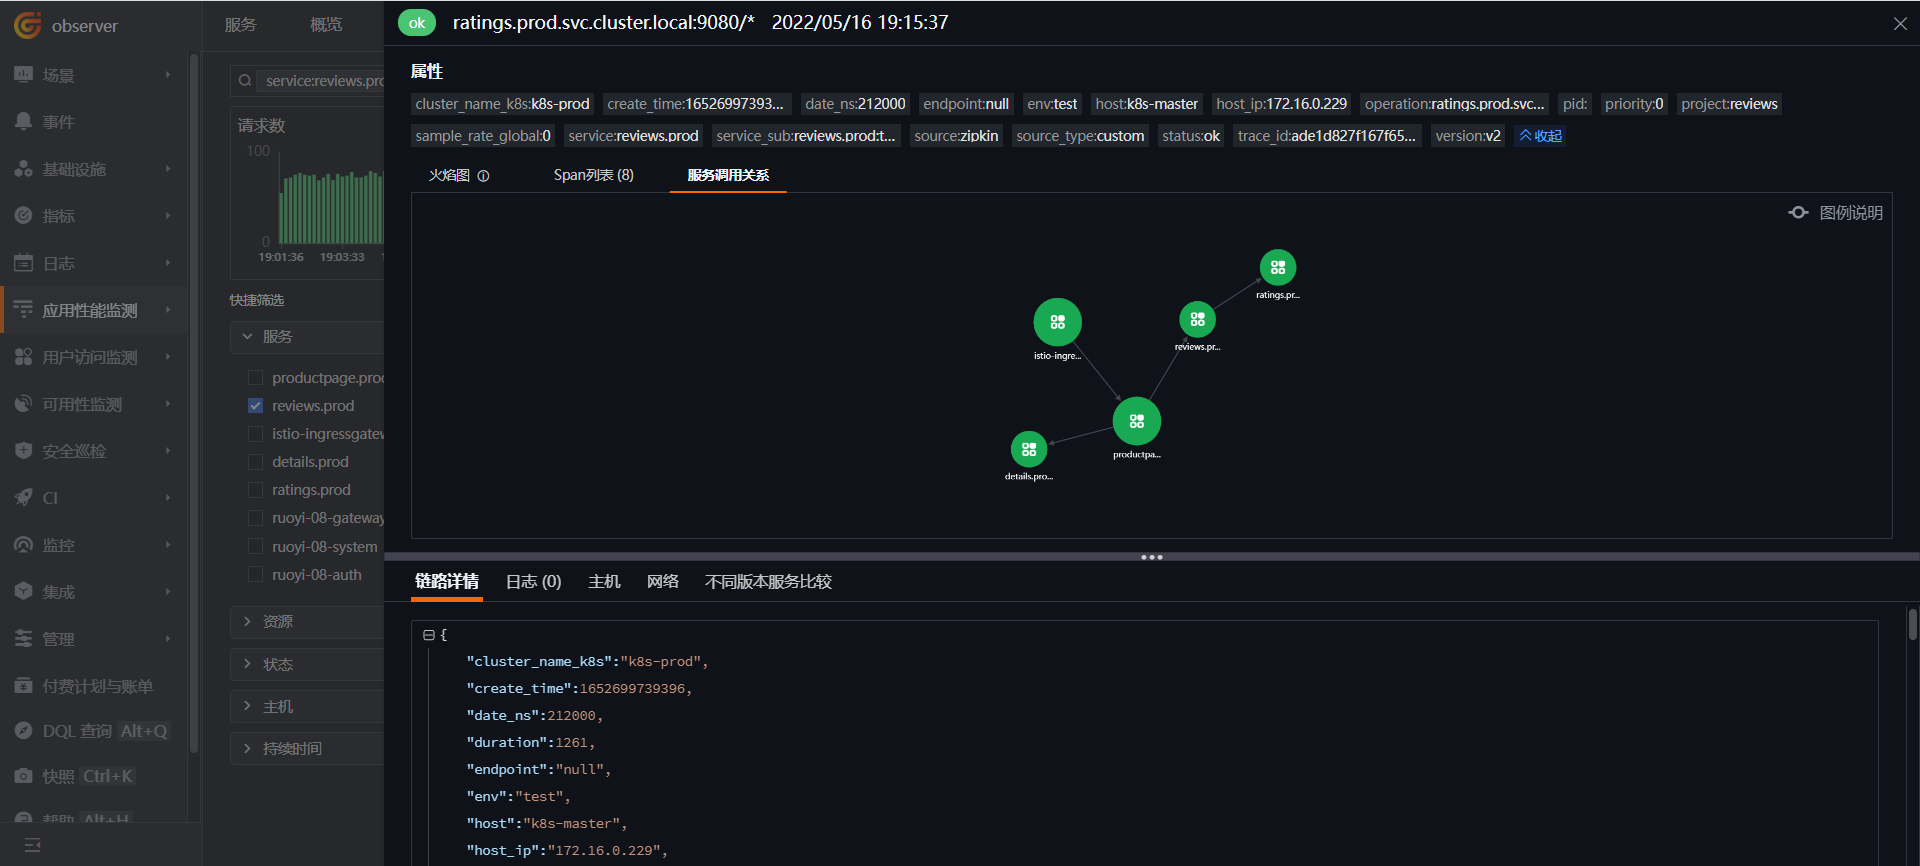
サービス呼び出し関係を確認します。
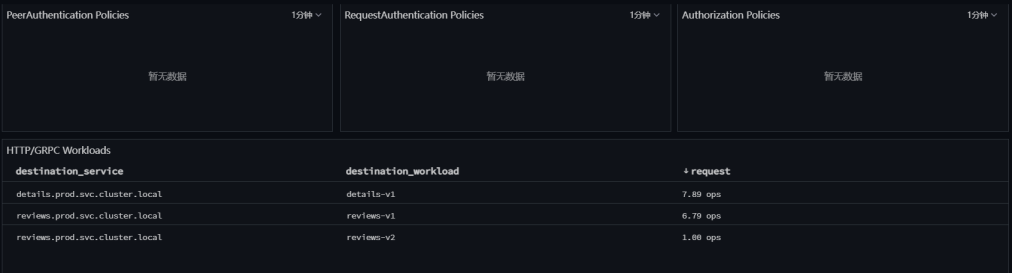
Istio Mesh モニタリングビューでもサービスの呼び出し状況を確認できます。v1、v2 バージョンのトラフィックはほぼ 9:1 です。
8.6 リリースの完了
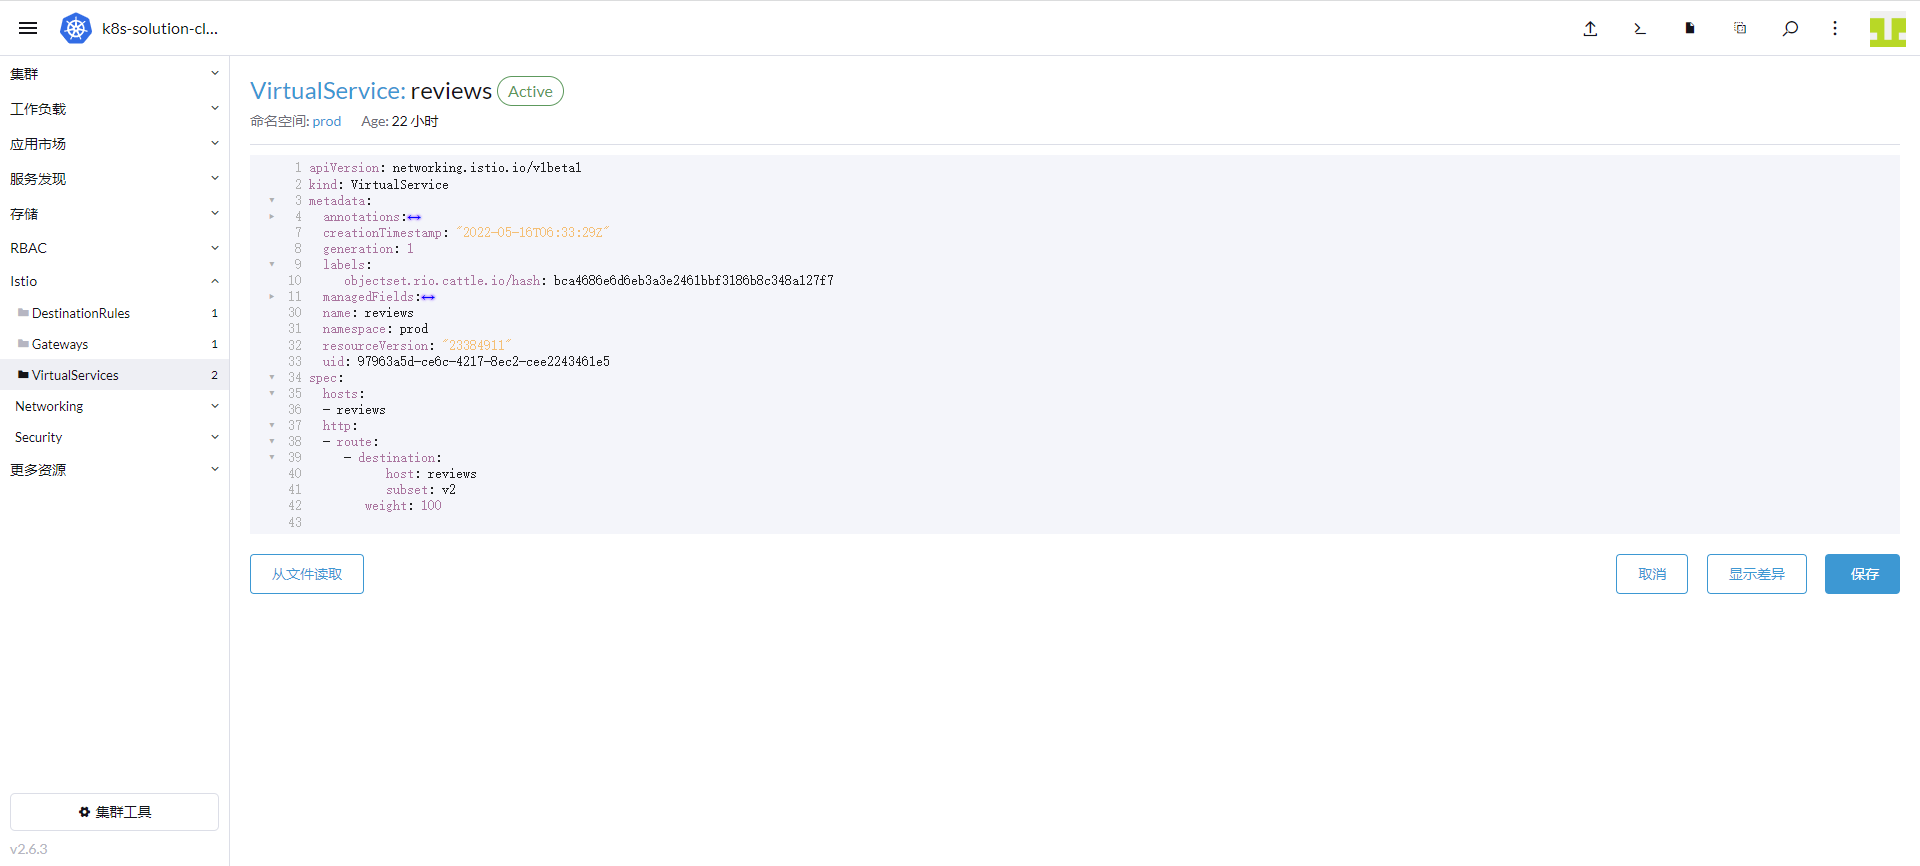
Guance での操作により、今回のリリースは期待通りであることが確認できました。「Rancher」→「クラスター」→「Istio」→「VirtualServices」に進み、reviews の右側にある「YAML の編集」をクリックし、「v2」の重みを 100 に設定し、「v1」を削除して「保存」をクリックします。
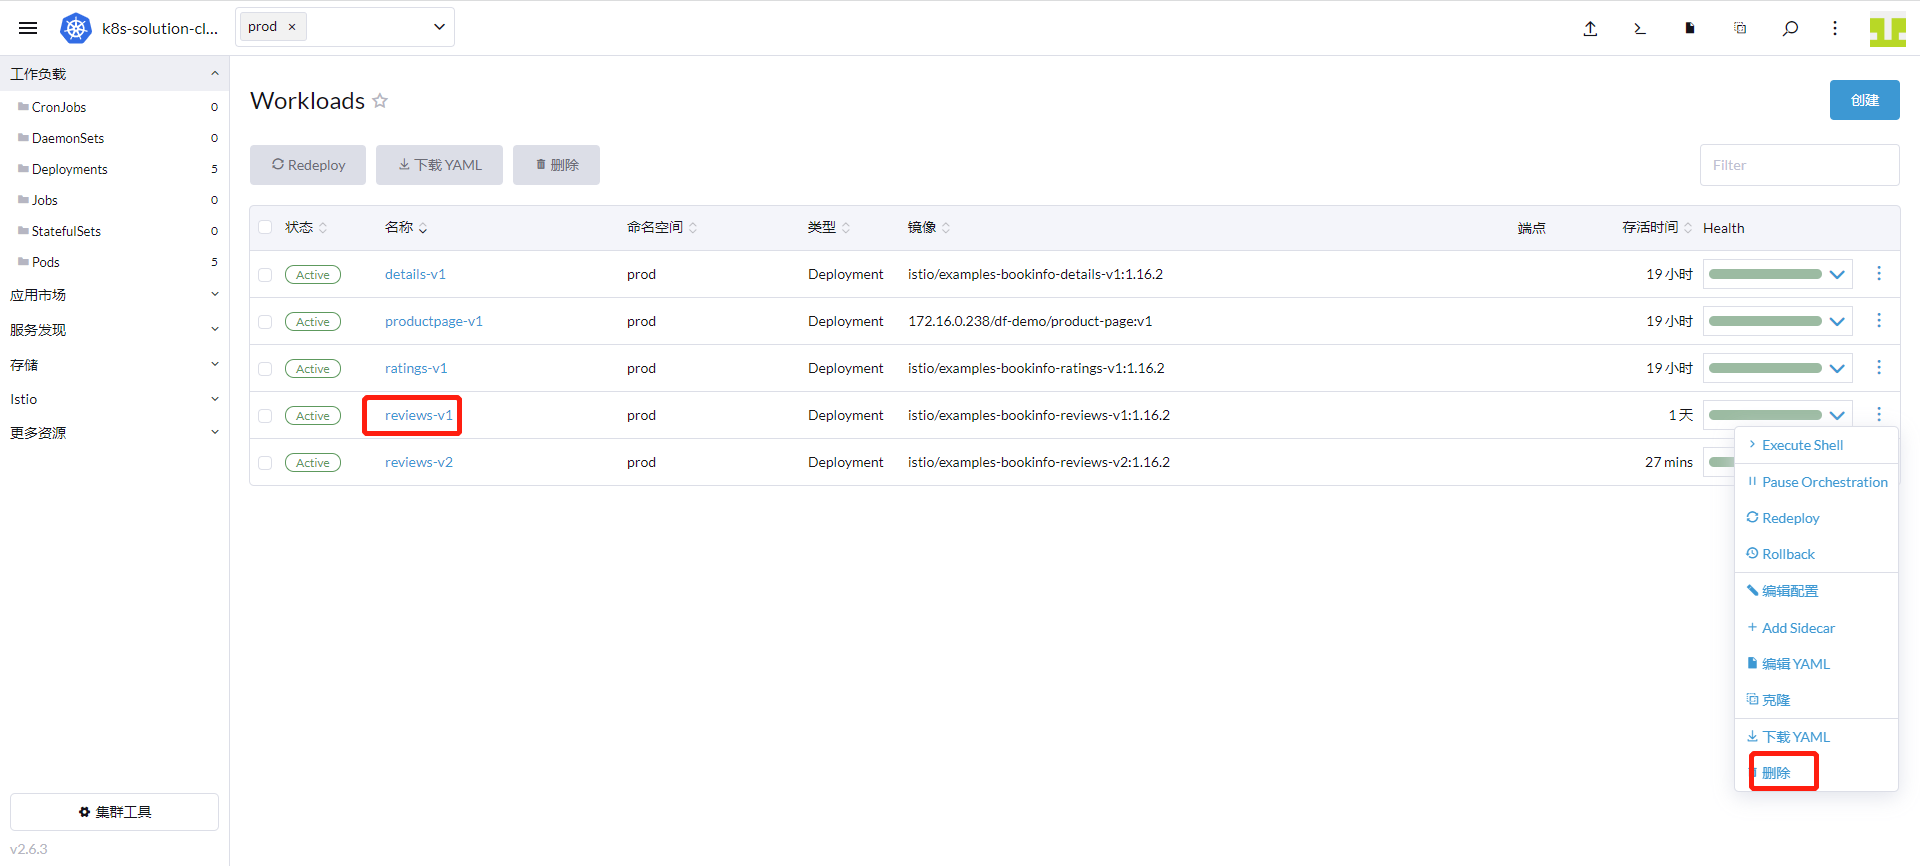
「クラスター」→「ワークロード」→「Deployments」に進み、「reviews-v1」を見つけて「削除」をクリックします。