Infrastructure Network Analysis
1. Why Perform Network Analysis
Whether running in a local server or a cloud environment, modern services and applications are particularly dependent on network performance. The stability of the network is crucial for business systems. If critical business applications fail and become unusable, you may need to sift through logs, check systems, access programs, view processes, debug services, etc., to find the fault point, which can consume a lot of valuable time.
However, if you have the right network traffic analysis and understand the business chain of network traffic, you can quickly locate the fault point and determine where data packets are being lost. This saves time by eliminating the need to confirm intermediate MIDDLEWARE devices that are not problematic, significantly reducing troubleshooting time and allowing faster resolution of faults.
Therefore, full visibility into the network becomes a key part of monitoring the operational status and performance of applications. But as your application scale grows larger and more complex, achieving this visibility becomes challenging. Guance will provide comprehensive observability for host networks.
2. Scope of Network Analysis Functions
Guance will offer you host network analysis from the following two aspects:
- Host Network Distribution Diagram: Automatically generates a network topology diagram based on host network connection conditions, intuitively presenting network connection statuses and network traffic sizes.
- Host Network Detail View: Parses important network-related Metrics from different angles based on transmission direction and protocols, as well as network connection statuses, supporting real-time viewing of network flow data.
Prerequisites
You need to first create a Guance account, and then install DataKit on your host, enabling the eBPF integration to collect network data.
Using Network Observability to Solve Our Problems
Guance provides comprehensive monitoring of host network performance by breaking down and visualizing network data streams. It helps you understand in real-time the network operation status of your business system, quickly analyze, track, and pinpoint issues, preventing or avoiding business problems caused by degraded or interrupted network performance.
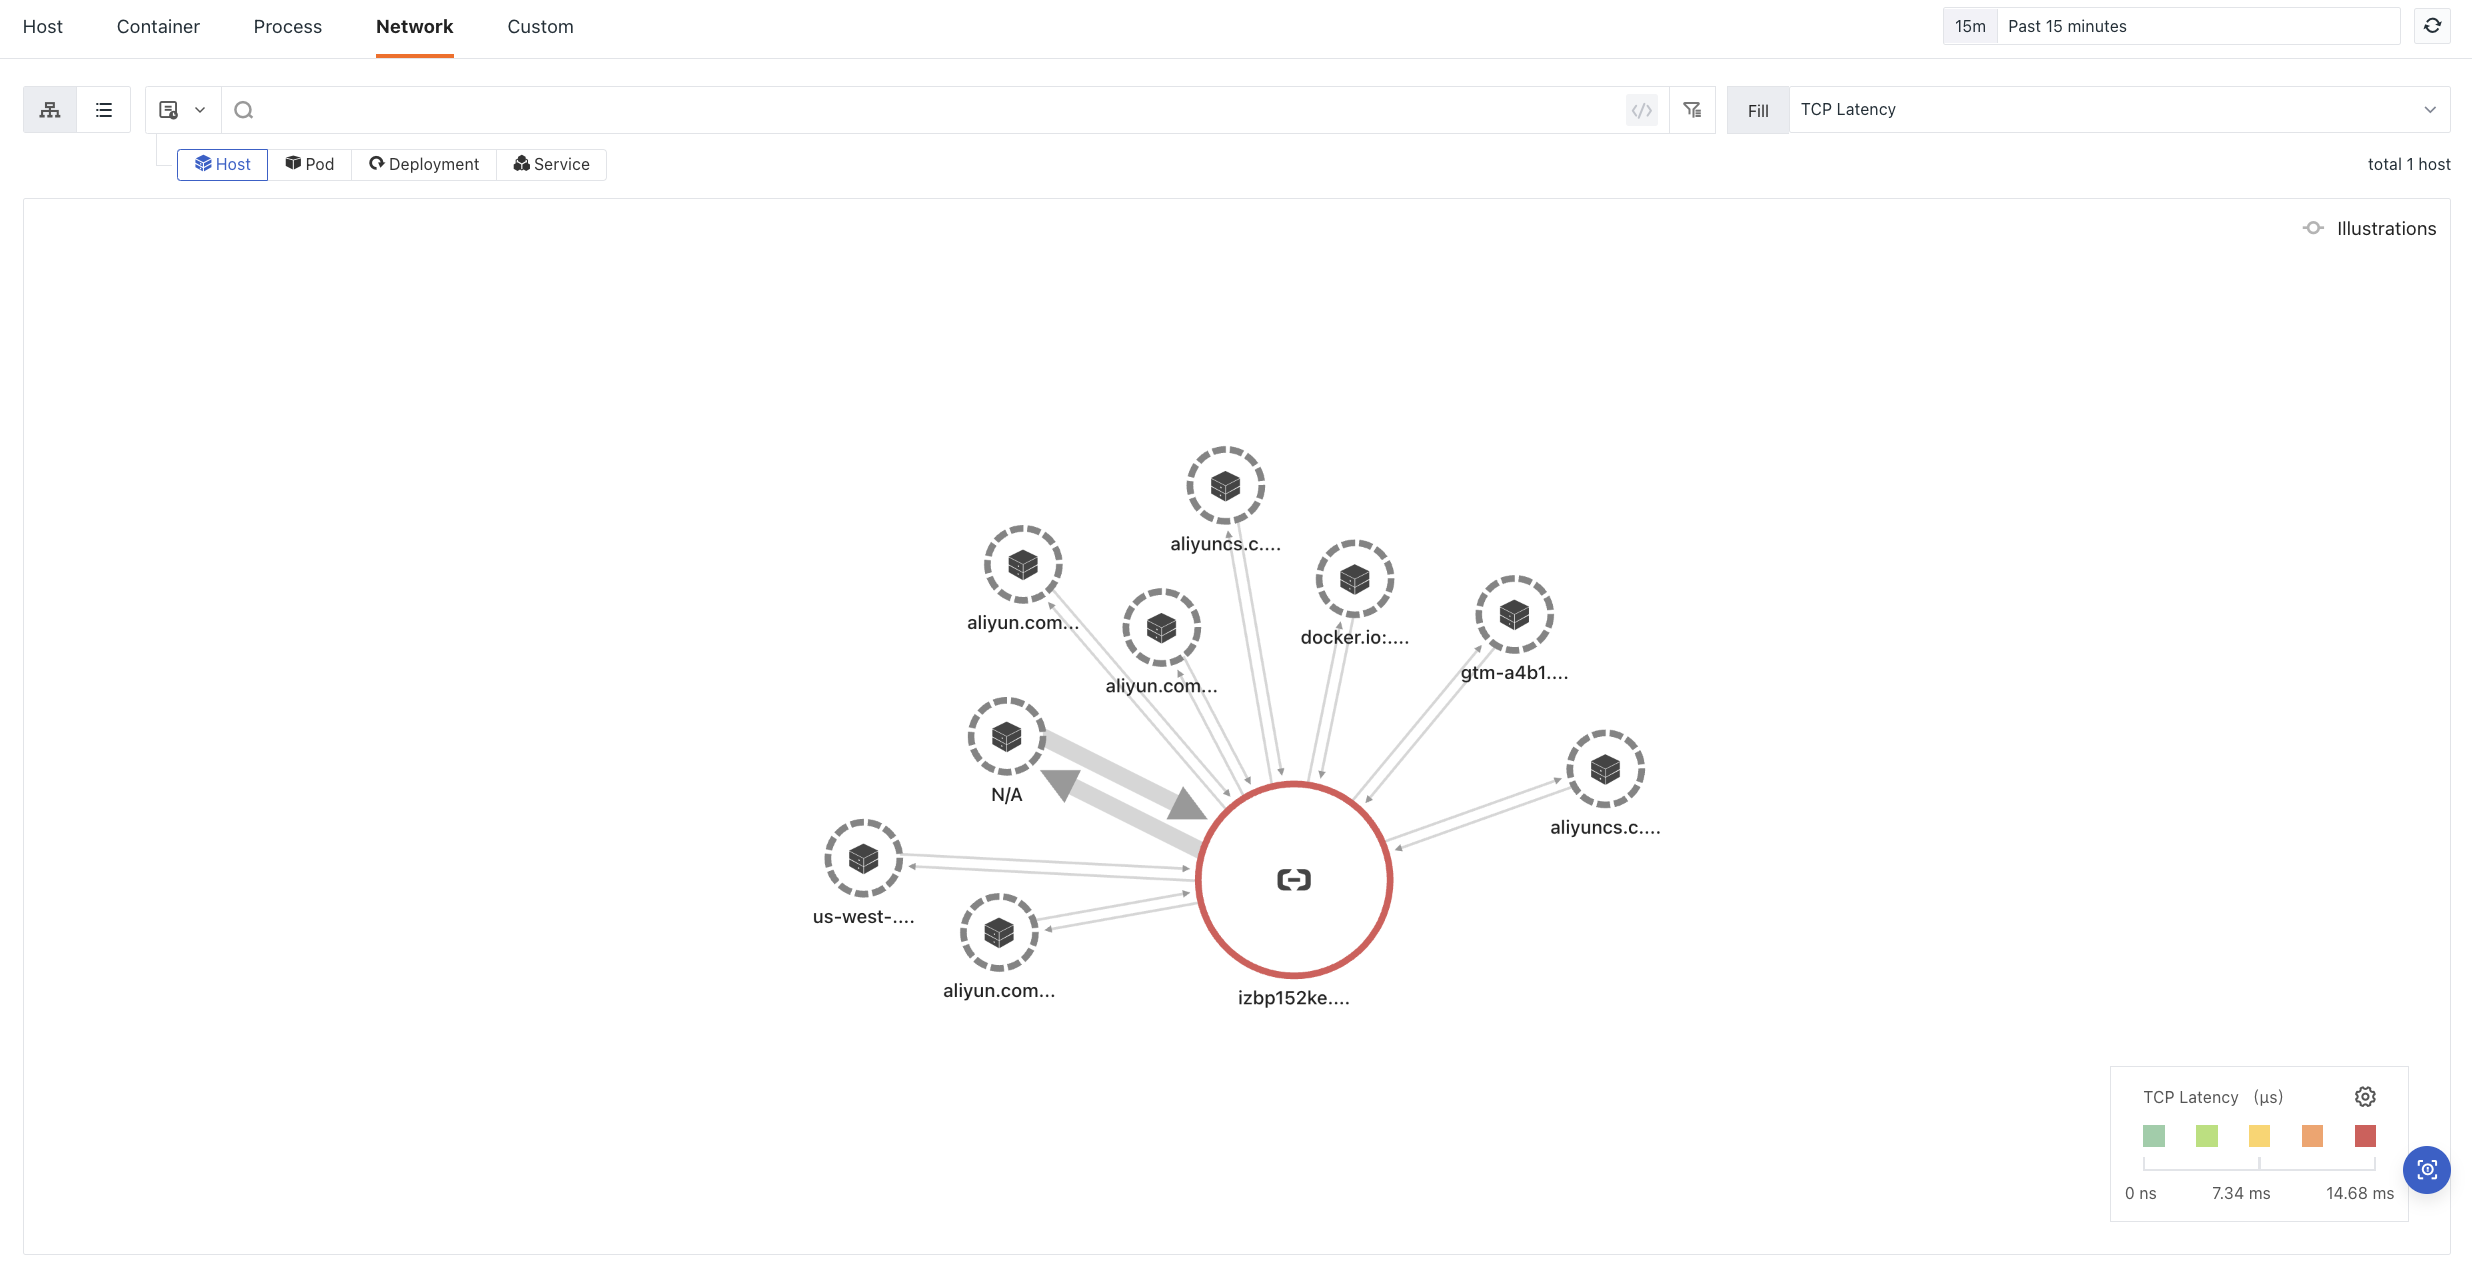
Host Network Distribution Diagram
Based on IP/port, it shows the network traffic and data connections between source hosts and targets, automatically generating a host network distribution topology diagram that presents the flow exchange situation between hosts. It also automatically calculates key network performance indicators, including TCP delay, TCP jitter, TCP retransmission count, TCP connection count, and TCP close count. These are represented visually through node color, size, etc., providing users with more intuitive metric data.
| Concept | Description |
|---|---|
| Node | Represents source and target hosts. When the target host is not within the Guance workspace, the node displays as the target domain name. |
| Node Size | Represents the size of incoming traffic. |
| Node Color | Fills corresponding colors based on the size of the selected analysis indicator value (e.g., as shown: the currently selected analysis indicator is "TCP Delay"). |
| Connection Direction | Represents the direction of traffic. |
| Connection Thickness | Represents the size of incoming and outgoing traffic. |
By observing the host network distribution and key performance indicators, you can understand the current traffic situation. For example, if an added managed service unintentionally consumes all your bandwidth, you can visualize your bandwidth data and use TCP retransmission technology to quickly reveal where network issues are causing connection problems in your infrastructure. You can then investigate related logs, traces, etc., and request tracking of monitored traffic for troubleshooting.

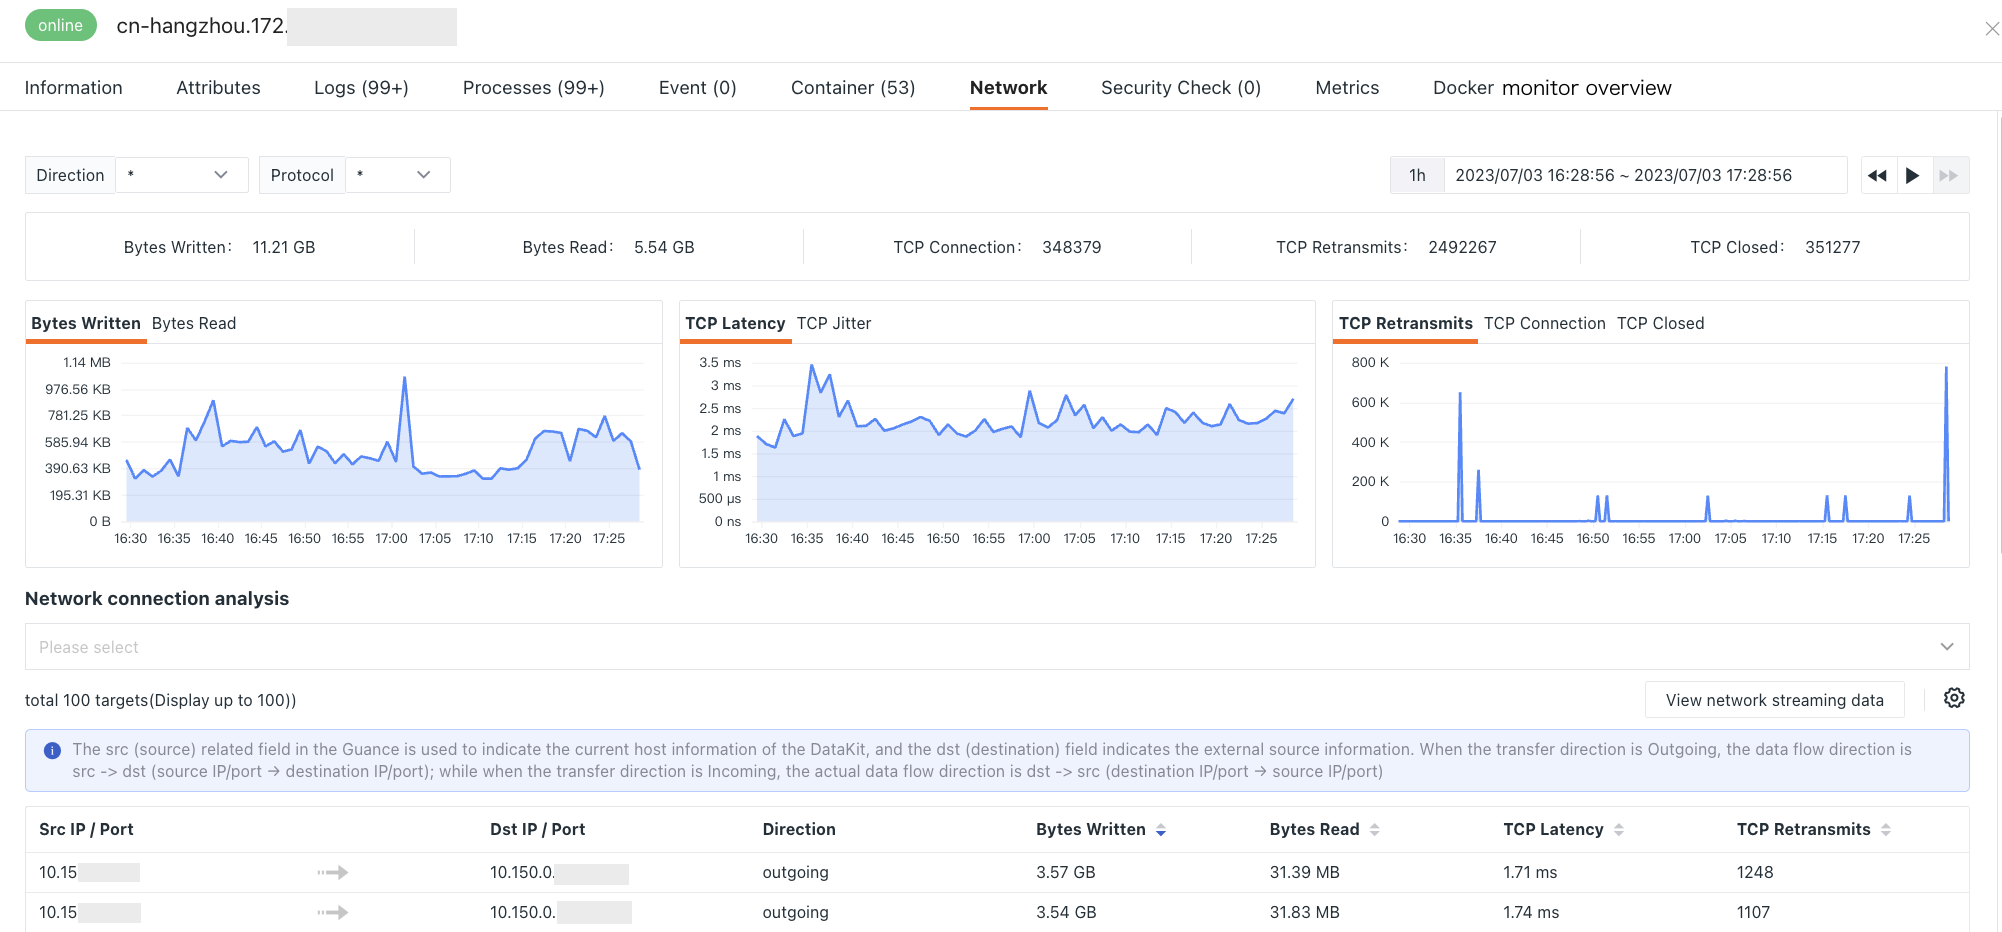
Host Network Detail View
Guance can query detailed network information for a single host. Currently, it supports TCP and UDP protocols combined with incoming (inbound) and outgoing (outbound) directions for multiple network performance monitoring options.
Guance also provides seven types of network Metrics statistics for real-time monitoring of network traffic: received/sent bytes, TCP delay, TCP jitter, TCP connection count, TCP retransmission count, and TCP close count. It supports viewing network connection data based on source IP/port and destination IP/port. You can customize and add metrics of interest and filter data based on fields.