Pinpoint
The built-in Pinpoint Agent in DataKit is used to receive, calculate, and analyze Pinpoint Tracing protocol data.
Configuration
Collector Configuration
Enter the conf.d/samples directory under the DataKit installation directory, copy pinpoint.conf.sample and name it pinpoint.conf. Examples are as follows:
[[inputs.pinpoint]]
  ## Pinpoint service endpoint for
  ## - Span Server
  ## - Agent Server(unimplemented, for service intactness and compatibility)
  ## - Metadata Server(unimplemented, for service intactness and compatibility)
  ## - Profiler Server(unimplemented, for service intactness and compatibility)
  address = "127.0.0.1:9991"

  ## Keep rare tracing resources list switch.
  ## If some resources are rare enough(not presend in 1 hour), those resource will always send
  ## to data center and do not consider samplers and filters.
  # keep_rare_resource = false

  ## delete trace message
  # del_message = true

  ## Ignore tracing resources map like service:[resources...].
  ## The service name is the full service name in current application.
  ## The resource list is regular expressions uses to block resource names.
  ## If you want to block some resources universally under all services, you can set the
  ## service name as "*". Note: double quotes "" cannot be omitted.
  # [inputs.pinpoint.close_resource]
    # service1 = ["resource1", "resource2", ...]
    # service2 = ["resource1", "resource2", ...]
    # "*" = ["close_resource_under_all_services"]
    # ...

  ## Sampler config uses to set global sampling strategy.
  ## sampling_rate used to set global sampling rate.
  # [inputs.pinpoint.sampler]
    # sampling_rate = 1.0

  # [inputs.pinpoint.tags]
    # key1 = "value1"
    # key2 = "value2"
    # ...

  ## Storage config a local storage space in hard dirver to cache trace data.
  ## path is the local file path used to cache data.
  ## capacity is total space size(MB) used to store data.
  # [inputs.pinpoint.storage]
    # path = "./pinpoint_storage"
    # capacity = 5120
DataKit Pinpoint Agent listening address configuration items are:
# Pinpoint GRPC service endpoint for
# - Span Server
# - Agent Server(unimplemented, for service intactness and compatibility)
# - Metadata Server(unimplemented, for service intactness and compatibility)
# - Profiler Server(unimplemented, for service intactness and compatibility)
address = "127.0.0.1:9991"
After configuration, Restart DataKit.
Can be turned on by ConfigMap Injection Collector Configuration or Config ENV_DATAKIT_INPUTS .
Can also be turned on by environment variables, (needs to be added as the default collector in ENV_DEFAULT_ENABLED_INPUTS):
-
ENV_INPUT_PINPOINT_ADDRESS
Agent span server
Type: String
input.conf:
addressExample: 127.0.0.1:9991
-
ENV_INPUT_PINPOINT_KEEP_RARE_RESOURCE
Keep rare tracing resources list switch
Type: Boolean
input.conf:
keep_rare_resourceDefault: false
-
ENV_INPUT_PINPOINT_DEL_MESSAGE
Delete trace message
Type: Boolean
input.conf:
del_messageDefault: false
-
ENV_INPUT_PINPOINT_CLOSE_RESOURCE
Ignore tracing resources that service (regular)
Type: JSON
input.conf:
close_resourceExample:
'{"service1":["resource1","other"],"service2":["resource2","other"]}' -
ENV_INPUT_PINPOINT_SAMPLER
Global sampling rate
Type: Float
input.conf:
samplerExample: 0.3
-
ENV_INPUT_PINPOINT_STORAGE
Local cache file path and size (MB)
Type: JSON
input.conf:
storageExample:
'{"storage":"./pinpoint_storage", "capacity": 5120}' -
ENV_INPUT_PINPOINT_TAGS
Customize tags. If there is a tag with the same name in the configuration file, it will be overwritten
Type: JSON
input.conf:
tagsExample:
'{"k1":"v1", "k2":"v2", "k3":"v3"}'
The Pinpoint Agent in DataKit has the following limitations
- Currently only supports gRPC protocol
- Multiple services (Agent/Metadata/Stat/Span) combined into one service use the same port
- There are differences between Pinpoint links and DataKit links, see below for details
Pinpoint Agent configuration
- Download the required Pinpoint APM Agent
Pinpoint supports the multi-language APM Collector. This document uses JAVA Agent for configuration. Download JAVA APM Collector.
-
Configure Pinpoint APM Collector, open /path_to_pinpoint_agent/pinpoint-root.config and configure the corresponding multi-service ports
- Configure
profiler.transport.module = GRPC - Configure
profiler.transport.grpc.agent.collector.port = 9991(i.e. the port configured in DataKit Pinpoint Agent) - Configure
profiler.transport.grpc.metadata.collector.port = 9991(i.e. the port configured in DataKit Pinpoint Agent) - Configure
profiler.transport.grpc.stat.collector.port = 9991(i.e. the port configured in DataKit Pinpoint Agent) - Configure
profiler.transport.grpc.span.collector.port = 9991(i.e. the port configured in DataKit Pinpoint Agent)
- Configure
-
Start Pinpoint APM Agent startup command
$ java -javaagent:/path_to_pinpoint/pinpoint-bootstrap.jar \
    -Dpinpoint.agentId=agent-id \
    -Dpinpoint.applicationName=app-name \
    -Dpinpoint.config=/path_to_pinpoint/pinpoint-root.config \
    -jar /path_to_your_app.jar
DataKit link data follows the OpenTracing protocol. A link in DataKit is concatenated through a simple parent-child (the child span stores the id of the parent span) structure and each span corresponds to a function call.
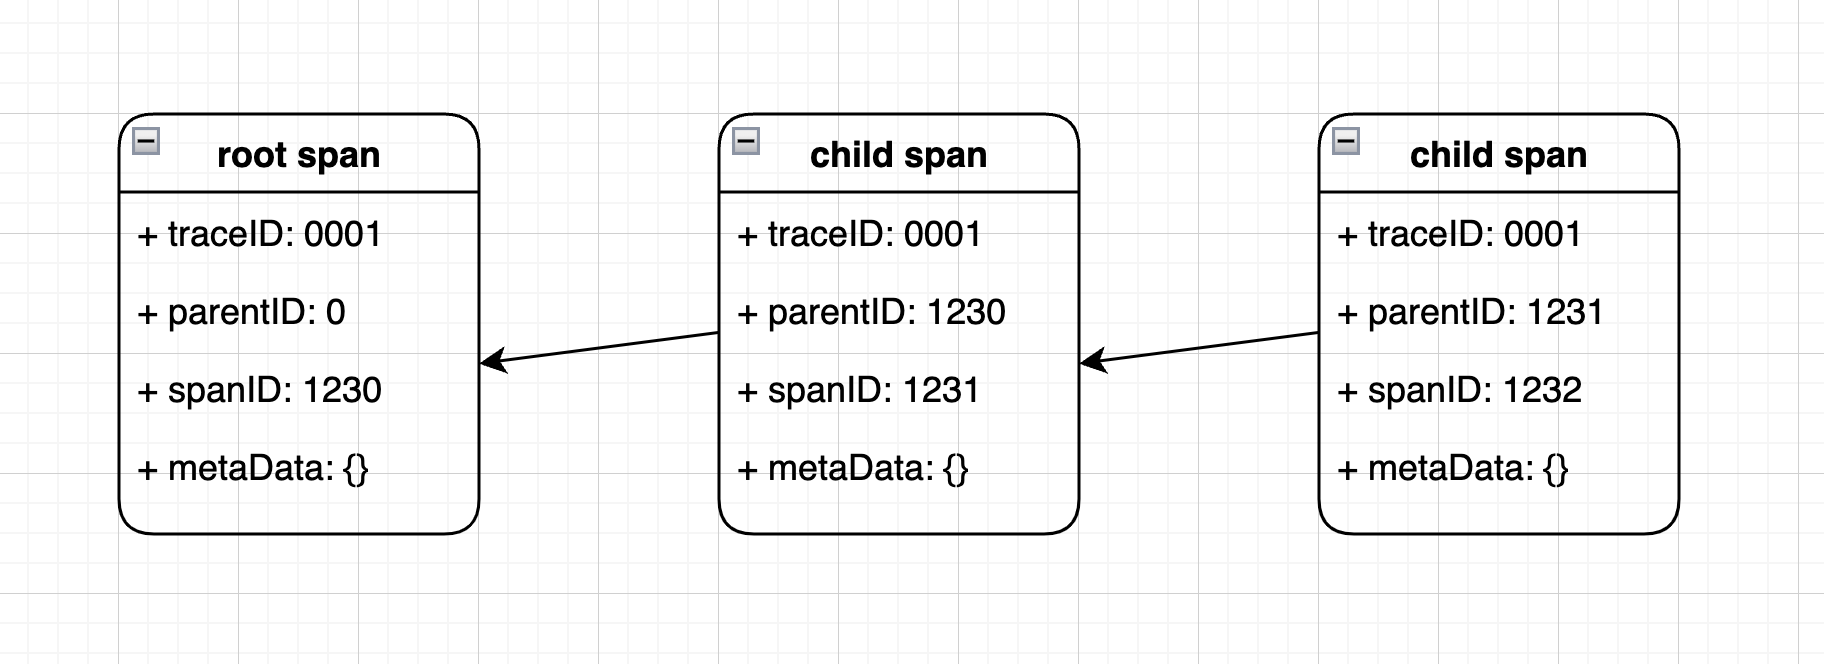
Pinpoint APM link data is more complex:
- The parent span is responsible for generating the ID of the child span
- The ID of the parent span must also be stored in the child span.
- Use span event instead of span in OpenTracing
- A span is a response process for a service
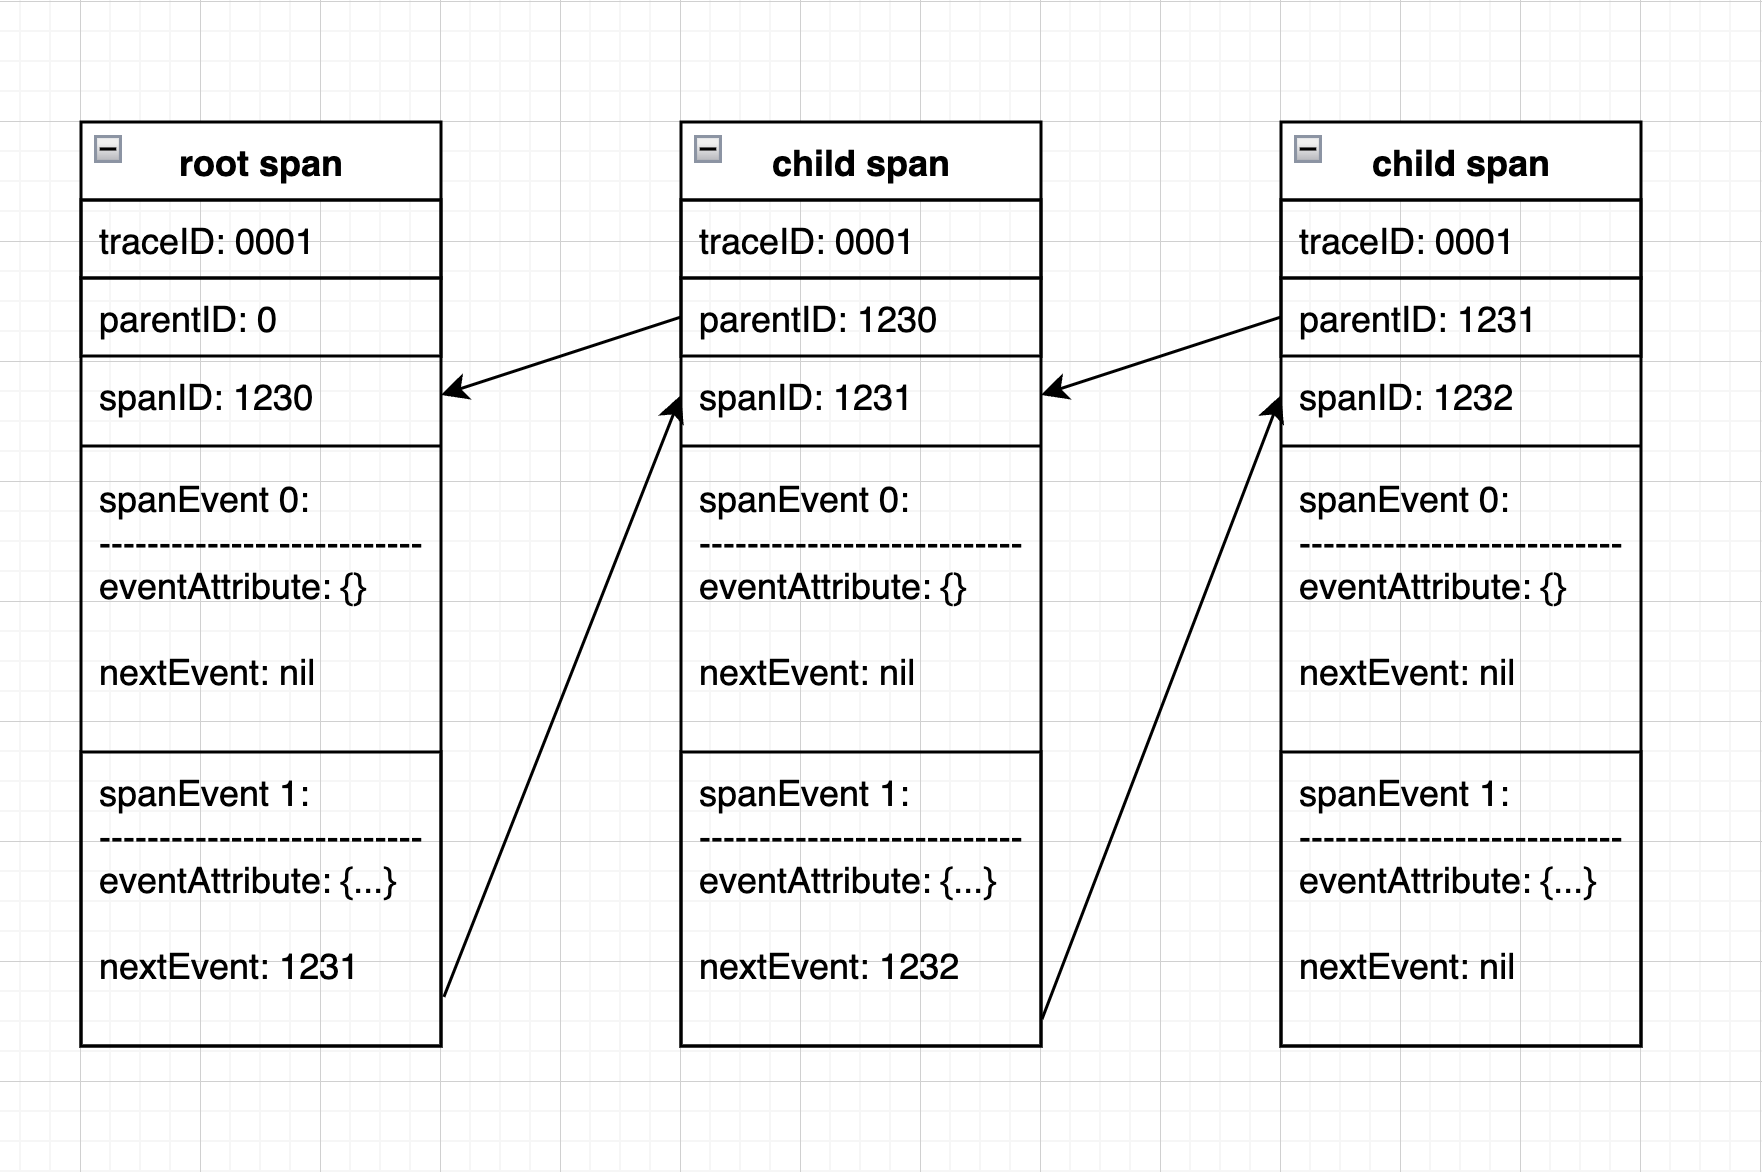
PinPointV2
DataKit 1.19.0 version has been re-optimized and changed source to PinPointV2. The new version of link data reorganizes the relationship between SpanChunk and Span, the relationship between Event and Span, and the relationship between Span and Span.
And the time alignment problem between startElapsed and endElapsed in Event.
Main logical points:
- Cache the
serviceTypeservice table and write it to a file to prevent data loss when DataKit restarts. - Cache if
parentSpanIdinSpanis not -1. For example, ifparentSpanId:-1is used, theSpanwill be fetched from the cache and spliced into a link based on thenextSpanIdinspanEvent. - Cache all
eventinSpanChunk, until the mainSpanis received, all are taken out from the cache and appended to the link. - Accumulate
startElapsedin the currentEventin order as the start time of the nextEvent. - Determine the parent-child relationship of the current
Eventaccording to theDepthfield. - Database queries will replace the current 'resource' name with
sqlstatements.
Tracing
pinpoint
Following is tags/fields of tracing data
| Tags & Fields | Description |
|---|---|
| base_service ( tag) |
Span base service name |
| container_host ( tag) |
Container hostname. Available in OpenTelemetry. Optional. |
| db_host ( tag) |
DB host name: ip or domain name. Optional. |
| db_name ( tag) |
Database name. Optional. |
| db_system ( tag) |
Database system name:mysql,oracle... Optional. |
| dk_fingerprint ( tag) |
DataKit fingerprint(always DataKit's hostname) |
| endpoint ( tag) |
Endpoint info. Available in SkyWalking, Zipkin. Optional. |
| env ( tag) |
Application environment info. Available in Jaeger. Optional. |
| host ( tag) |
Hostname. |
| http_method ( tag) |
HTTP request method name. Available in DDTrace, OpenTelemetry. Optional. |
| http_route ( tag) |
HTTP route. Optional. |
| http_status_code ( tag) |
HTTP response code. Available in DDTrace, OpenTelemetry. Optional. |
| http_url ( tag) |
HTTP URL. Optional. |
| operation ( tag) |
Span name |
| out_host ( tag) |
This is the database host, equivalent to db_host,only DDTrace-go. Optional. |
| project ( tag) |
Project name. Available in Jaeger. Optional. |
| service ( tag) |
Service name. Optional. |
| source_type ( tag) |
Tracing source type |
| span_type ( tag) |
Span type |
| status ( tag) |
Span status |
| version ( tag) |
Application version info. Available in Jaeger. Optional. |
| duration | Duration of span Type: int | (gauge) Unit: time,μs |
| message | Origin content of span Type: string Unit: N/A |
| parent_id | Parent span ID of current span Type: string Unit: N/A |
| resource | Resource name produce current span Type: string Unit: N/A |
| span_id | Span id Type: string Unit: N/A |
| start | start time of span. Type: int | (gauge) Unit: timeStamp,usec |
| trace_id | Trace id Type: string Unit: N/A |
Metric
pp-agentStats-metric
Pinpoint agent JVM runtime statistics converted from Pinpoint PAgentStat batches.
| Tags & Fields | Description |
|---|---|
| agentVersion ( tag) |
Pinpoint agent version |
| agent_id ( tag) |
Agent ID |
| container ( tag) |
Whether it is a container |
| hostname ( tag) |
Host name |
| ip ( tag) |
Agent IP |
| pid ( tag) |
Process ID |
| ports ( tag) |
Open ports |
| GcNewCount | Cumulative new-generation garbage collection count reported by the Pinpoint agent. Type: int | (count) Unit: count Tagged by: agentVersion, agent_id, container, hostname, ip, pid, ports |
| GcNewTime | Cumulative new-generation garbage collection time in milliseconds reported by the Pinpoint agent. Type: int | (count) Unit: time,ms Tagged by: agentVersion, agent_id, container, hostname, ip, pid, ports |
| JvmCpuLoad | Recent JVM process CPU load ratio reported by the Pinpoint agent, in the range 0 to 1. Type: float | (gauge) Unit: percent,percent_decimal Tagged by: agentVersion, agent_id, container, hostname, ip, pid, ports |
| JvmGcOldCount | Cumulative old-generation garbage collection count reported by the Pinpoint agent. Type: int | (count) Unit: count Tagged by: agentVersion, agent_id, container, hostname, ip, pid, ports |
| JvmGcOldTime | Cumulative old-generation garbage collection time in milliseconds reported by the Pinpoint agent. Type: int | (count) Unit: time,ms Tagged by: agentVersion, agent_id, container, hostname, ip, pid, ports |
| JvmMemoryHeapMax | Maximum JVM heap memory in bytes. Type: int | (gauge) Unit: digital,B Tagged by: agentVersion, agent_id, container, hostname, ip, pid, ports |
| JvmMemoryHeapUsed | Current JVM heap memory used in bytes. Type: int | (gauge) Unit: digital,B Tagged by: agentVersion, agent_id, container, hostname, ip, pid, ports |
| JvmMemoryNonHeapMax | Maximum JVM non-heap memory in bytes; Pinpoint may report -1 when the maximum is undefined. Type: int | (gauge) Unit: digital,B Tagged by: agentVersion, agent_id, container, hostname, ip, pid, ports |
| JvmMemoryNonHeapUsed | Current JVM non-heap memory used in bytes. Type: int | (gauge) Unit: digital,B Tagged by: agentVersion, agent_id, container, hostname, ip, pid, ports |
| PoolCodeCacheUsed | JVM code-cache memory pool usage ratio reported by the Pinpoint agent, in the range 0 to 1. Type: float | (gauge) Unit: percent,percent_decimal Tagged by: agentVersion, agent_id, container, hostname, ip, pid, ports |
| PoolMetaspaceUsed | JVM metaspace memory pool usage ratio reported by the Pinpoint agent, in the range 0 to 1. Type: float | (gauge) Unit: percent,percent_decimal Tagged by: agentVersion, agent_id, container, hostname, ip, pid, ports |
| PoolNewGenUsed | JVM new-generation memory pool usage ratio reported by the Pinpoint agent, in the range 0 to 1. Type: float | (gauge) Unit: percent,percent_decimal Tagged by: agentVersion, agent_id, container, hostname, ip, pid, ports |
| PoolOldGenUsed | JVM old-generation memory pool usage ratio reported by the Pinpoint agent, in the range 0 to 1. Type: float | (gauge) Unit: percent,percent_decimal Tagged by: agentVersion, agent_id, container, hostname, ip, pid, ports |
| PoolPermGenUsed | JVM permanent-generation memory pool usage ratio reported by the Pinpoint agent; -1 means unavailable on JVMs without PermGen. Type: float | (gauge) Unit: percent,percent_decimal Tagged by: agentVersion, agent_id, container, hostname, ip, pid, ports |
| PoolSurvivorSpaceUsed | JVM survivor-space memory pool usage ratio reported by the Pinpoint agent, in the range 0 to 1. Type: float | (gauge) Unit: percent,percent_decimal Tagged by: agentVersion, agent_id, container, hostname, ip, pid, ports |
| SystemCpuLoad | Recent system CPU load ratio reported by the Pinpoint agent, in the range 0 to 1. Type: float | (gauge) Unit: percent,percent_decimal Tagged by: agentVersion, agent_id, container, hostname, ip, pid, ports |