DDTrace
DDTrace 是 DataDog 开源的 APM 产品,DataKit 内嵌的 DDTrace Agent 用于接收,运算,分析 DataDog Tracing 协议数据。
DDTrace 文档和示例
Info
我们对 DDTrace 做了一些功能扩展,便于支持更多的主流框架和更细粒度的数据追踪。
配置
进入 DataKit 安装目录下的 conf.d/samples 目录,复制 ddtrace.conf.sample 并命名为 ddtrace.conf。示例如下:
[[inputs.ddtrace]]
  ## DDTrace Agent endpoints register by version respectively.
  ## Endpoints can be skipped listen by remove them from the list.
  ## NOTE: DO NOT EDIT.
  endpoints = ["/v0.3/traces", "/v0.4/traces", "/v0.5/traces"]

  ## customer_tags will work as a whitelist to prevent tags send to data center.
  ## All . will replace to _ ,like this :
  ## "project.name" to send to center is "project_name"
  # customer_tags = ["sink_project", "custom_dd_tag", "reg:key_*"]

  ## Keep rare tracing resources list switch.
  ## If some resources are rare enough(not presend in 1 hour), those resource will always send
  ## to data center and do not consider samplers and filters.
  # keep_rare_resource = false

  ## By default every error presents in span will be send to data center and omit any filters or
  ## sampler. If you want to get rid of some error status, you can set the error status list here.
  # omit_err_status = ["404"]

  ## compatible otel: It is possible to compatible OTEL Trace with DDTrace trace.
  ## make span_id and parent_id to hex encoding.
  # compatible_otel=true

  ##  It is possible to compatible B3/B3Multi TraceID with DDTrace.
  # trace_id_64_bit_hex=true

  ## api:/telemetry/proxy/api/v2/apmtelemetry is collect jvm metadata.
  ## data is: app-dependencies-loaded,app-client-configuration-change,app-integrations-change ...
  ## default is true.
  # apmtelemetry_route_enable = true

  ## When true, the tracer generates 128 bit Trace IDs,
  ## and encodes Trace IDs as 32 lowercase hexadecimal characters with zero padding.
  ## default is true.
  # trace_128_bit_id = true

  ## delete trace message
  # del_message = true

  ## max spans limit on each trace. default 100000 or set to -1 to remove this limit.
  # trace_max_spans = 100000

  ## max trace body(Content-Length) limit. default 32MiB or set to -1 to remove this limit.
  # max_trace_body_mb = 32

  ## tracing_metric_enable: trace_hits trace_hits_by_http_status trace_latency trace_errors trace_errors_by_http_status trace_apdex.
  ## Extract the above metrics from the collection traces.
  # tracing_metric_enable = true

  ## Blacklist of metric tags: There are many labels in the metric: "tracing_metrics".
  ## If you want to remove certain tag, you can use the blacklist to remove them.
  ## By default, it includes: source,span_name,env,service,status,version,resource,http_status_code,http_status_class
  ## and "customer_tags", k8s related tags, and others service.
  # tracing_metric_tag_blacklist = ["resource","operation","tag_x"]

  ## Whitelist of metric tags: There are many labels in the metric: "tracing_metrics".
  # tracing_metric_tag_whitelist = []

  ## Ignore tracing resources map like service:[resources...].
  ## The service name is the full service name in current application.
  ## The resource list is regular expressions uses to block resource names.
  ## If you want to block some resources universally under all services, you can set the
  ## service name as "*". Note: double quotes "" cannot be omitted.
  # [inputs.ddtrace.close_resource]
  #   service1 = ["resource1", "resource2", ...]
  #   service2 = ["resource1", "resource2", ...]
  #   "*" = ["close_resource_under_all_services"]
  #   ...

  ## Sampler config uses to set global sampling strategy.
  ## sampling_rate used to set global sampling rate.
  # [inputs.ddtrace.sampler]
  #   sampling_rate = 1.0

  # [inputs.ddtrace.tags]
  #   key1 = "value1"
  #   key2 = "value2"
  #   ...

  ## Threads config controls how many goroutines an agent cloud start to handle HTTP request.
  ## buffer is the size of jobs' buffering of worker channel.
  ## threads is the total number fo goroutines at running time.
  # [inputs.ddtrace.threads]
  #   buffer = 100
  #   threads = 8

  ## Storage config a local storage space in hard dirver to cache trace data.
  ## path is the local file path used to cache data.
  ## capacity is total space size(MB) used to store data.
  # [inputs.ddtrace.storage]
  #   path = "./ddtrace_storage"
  #   capacity = 5120
配置好后,重启 DataKit 即可。
可通过 ConfigMap 方式注入采集器配置 或 配置 ENV_DATAKIT_INPUTS 开启采集器。
也支持以环境变量的方式修改配置参数(需要在 ENV_DEFAULT_ENABLED_INPUTS 中加为默认采集器):
-
ENV_INPUT_DDTRACE_ENDPOINTS
代理端点
字段类型: JSON
采集器配置字段:
endpoints示例:
'["/v0.3/traces", "/v0.4/traces", "/v0.5/traces"]' -
ENV_INPUT_DDTRACE_CUSTOMER_TAGS
标签白名单
字段类型: JSON
采集器配置字段:
customer_tags示例:
'["sink_project", "custom_dd_tag"]' -
ENV_INPUT_DDTRACE_KEEP_RARE_RESOURCE
保持稀有跟踪资源列表
字段类型: Boolean
采集器配置字段:
keep_rare_resource默认值: false
-
ENV_INPUT_DDTRACE_COMPATIBLE_OTEL
将
otel Trace与DDTrace Trace兼容字段类型: Boolean
采集器配置字段:
compatible_otel默认值: false
-
ENV_INPUT_DDTRACE_TRACE_ID_64_BIT_HEX
将
B3/B3Multi-TraceID与DDTrace兼容字段类型: Boolean
采集器配置字段:
trace_id_64_bit_hex默认值: false
-
ENV_INPUT_DDTRACE_TRACE_128_BIT_ID
将链路 ID 转成长度为 32 的 16 进制编码的字符串
字段类型: Boolean
采集器配置字段:
trace_128_bit_id默认值: true
-
ENV_INPUT_DDTRACE_DEL_MESSAGE
删除 trace 消息
字段类型: Boolean
采集器配置字段:
del_message默认值: false
-
ENV_INPUT_DDTRACE_TRACING_METRIC_ENABLE
开启请求计数,错误计数和延迟指标的采集
字段类型: Boolean
采集器配置字段:
tracing_metric_enable默认值: false
-
ENV_INPUT_DDTRACE_APMTELEMETRY_ROUTE_ENABLE
开启路由
/telemetry/proxy/api/v2/apmtelemetry并接收 JVM 数据字段类型: Boolean
采集器配置字段:
apmtelemetry_route_enable默认值: true
-
ENV_INPUT_DDTRACE_TRACING_METRIC_TAG_BLACKLIST
指标集 tracing_metrics 中标签的黑名单
字段类型: JSON
采集器配置字段:
tracing_metric_tag_blacklist示例:
'["tag_a", "tag_b"]' -
ENV_INPUT_DDTRACE_TRACING_METRIC_TAG_WHITELIST
指标集 tracing_metrics 中标签的白名单
字段类型: JSON
采集器配置字段:
tracing_metric_tag_whitelist示例:
'["tag_c", "tag_d"]' -
ENV_INPUT_DDTRACE_OMIT_ERR_STATUS
错误状态白名单
字段类型: JSON
采集器配置字段:
omit_err_status示例:
'["404", "403", "400"]' -
ENV_INPUT_DDTRACE_CLOSE_RESOURCE
忽略指定服务器的 tracing(正则匹配)
字段类型: JSON
采集器配置字段:
close_resource示例:
'{"service1":["resource1","other"],"service2":["resource2","other"]}' -
ENV_INPUT_DDTRACE_SAMPLER
全局采样率
字段类型: Float
采集器配置字段:
sampler示例: 0.3
-
ENV_INPUT_DDTRACE_THREADS
线程和缓存的数量
字段类型: JSON
采集器配置字段:
threads示例:
'{"buffer":1000, "threads":100}' -
ENV_INPUT_DDTRACE_STORAGE
本地缓存路径和大小(MB)
字段类型: JSON
采集器配置字段:
storage示例:
'{"storage":"./ddtrace_storage", "capacity": 5120}' -
ENV_INPUT_DDTRACE_TAGS
自定义标签。如果配置文件有同名标签,将会覆盖它
字段类型: JSON
采集器配置字段:
tags示例:
'{"k1":"v1", "k2":"v2", "k3":"v3"}' -
ENV_INPUT_DDTRACE_ENV_INPUT_DDTRACE_MAX_SPANS
单个 trace 最大 span 个数,如果超过该限制,多余的 span 将截断,置为 -1 可关闭该限制
字段类型: Int
采集器配置字段:
env_input_ddtrace_max_spans示例: 1000
默认值: 100000
-
ENV_INPUT_DDTRACE_ENV_INPUT_DDTRACE_MAX_BODY_MB
单个 trace API 请求最大 body 字节数(单位 MiB),置为 -1 可关闭该限制
字段类型: Int
采集器配置字段:
env_input_ddtrace_max_body_mb示例: 32
默认值: 10
customer_tags 参数支持正则表达式,但是有固定的前缀格式
reg:,例如reg:key_*,表示匹配所有以key_开头的 key 。
多线路工具串联注意事项
DDTrace 数据结构中 TraceID 是 uint64 类型,在使用透传协议 tracecontext 时,DDTrace 链路详情内部会增加一个 _dd.p.tid:67c573cf00000000 原因是因为 tracecontext 协议
中的 trace_id 是 128 位 16 进制编码的字符串,为了兼容只能增加了一个高位的 tag 。
DDTrace 目前支持的透传协议有:datadog/b3multi/tracecontext ,有两种情况需要注意:
- 当使用
tracecontext时,由于链路 ID 为 128 位需要将配置中的compatible_otel=true和trace_128_bit_id开关打开。 - 当使用
b3multi时,需要注意trace_id的长度,如果为 64 位的 16 进制编码,需要将配置文件中的trace_id_64_bit_hex=true打开。 - 更多的透传协议及工具使用请查看: 多链路串联
Info
compatible_otel:将span_id和parent_id转成 16 进制的字符串trace_128_bit_id:将meta中的_dd.p.tid加上trace_id组合成一个长度为 32 的 16 进制编码的字符串trace_id_64_bit_hex:将 64 位的trace_id转成 16 进制编码的字符串
注入 Pod 和 Node 信息
当应用在 Kubernetes 等容器环境部署时,我们可以在在最终的 Span 数据上追加 Pod/Node 信息,通过修改应用的 Yaml 即可,下面是一个 Kubernetes Deployment 的 yaml 示例:
---
apiVersion: apps/v1
kind: Deployment
metadata:
  name: my-app
spec:
  selector:
    matchLabels:
      app: my-app
  replicas: 3
  template:
    metadata:
      labels:
        app: my-app
        service: my-service
    spec:
      containers:
        - name: my-app
          image: my-app:v0.0.1
          env:
            - name: POD_NAME
              valueFrom:
                fieldRef:
                  fieldPath: metadata.name
            - name: NODE_NAME
              valueFrom:
                fieldRef:
                  fieldPath: spec.nodeName
            - name: DD_TAGS
              value: pod_name:$(POD_NAME),host:$(NODE_NAME)
            - name: DD_SERVICE
              valueFrom:
                fieldRef:
                  fieldPath: metadata.labels['service']
注意,此处要先定义 POD_NAME 和 NODE_NAME,然后再将它们嵌入到到 DDTrace 专用的环境变量中。
应用启动后,进入对应的 Pod,我们可以验证 ENV 是否生效:
一旦注入成功,在最终的 Span 数据中,我们就能看到该 Span 所处的 Pod 以及 Node 名称。
Warning
- 不要修改这里的
endpoints列表(除非明确知道配置逻辑和效果)。
- 如果要关闭采样(即采集所有数据),采样率字段需做如下设置:
不要只注释 sampling_rate = 1.0 这一行,必须连同 [inputs.ddtrace.sampler] 也一并注释掉,否则采集器会认为 sampling_rate 被置为 0.0,从而导致所有数据都被丢弃。
HTTP 设置
如果 Trace 数据是跨机器发送过来的,那么需要设置 DataKit 的 HTTP 设置。
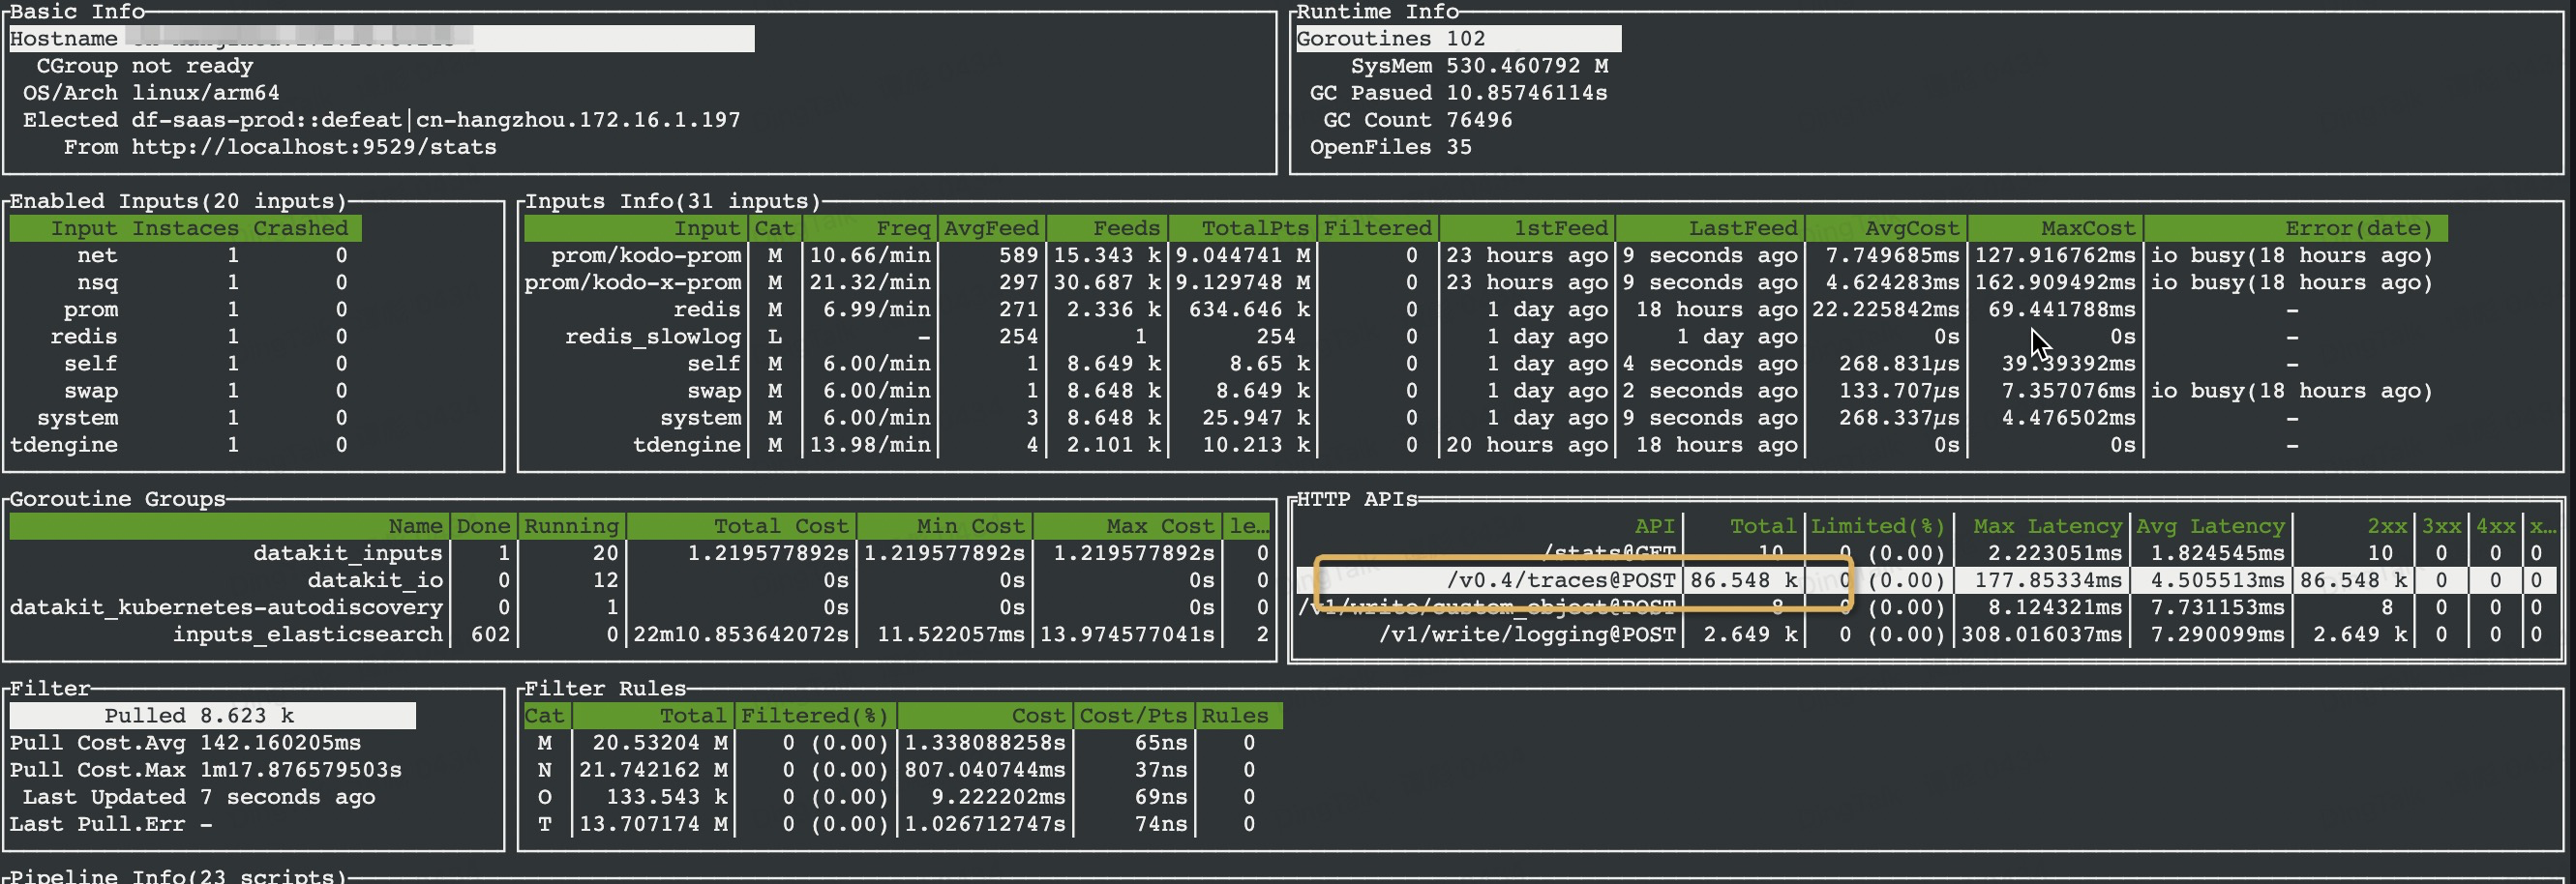
如果有 DDTrace 数据发送给 DataKit,那么在 DataKit 的 monitor 上能看到:
开启磁盘缓存
如果 Trace 数据量很大,为避免给主机造成大量的资源开销,可以将 Trace 数据临时缓存到磁盘中,延迟处理:
DDtrace SDK 配置
配置完采集器之后,还可以对 DDtrace SDK 端做一些配置。
环境变量设置
DD_TRACE_ENABLED: Enable global tracer (部分语言平台支持)DD_AGENT_HOST: DDtrace agent host addressDD_TRACE_AGENT_PORT: DDtrace agent host portDD_SERVICE: Service nameDD_TRACE_SAMPLE_RATE: Set sampling rateDD_VERSION: Application version (optional)DD_TRACE_STARTUP_LOGS: DDtrace loggerDD_TRACE_DEBUG: DDtrace debug modeDD_ENV: Application env valuesDD_TAGS: Application
除了在应用初始化时设置项目名,环境名以及版本号外,还可通过如下两种方式设置:
- 通过命令行注入环境变量
- 在 ddtrace.conf 中直接配置自定义标签。这种方式会影响所有发送给 DataKit tracing 服务的数据,需慎重考虑:
# tags is ddtrace configed key value pairs
[inputs.ddtrace.tags]
  some_tag = "some_value"
  more_tag = "some_other_value"
APMTelemetry
DDTrace 探针启动后,会不断通额外的接口上报服务有关的信息,比如启动配置、心跳、加载的探针列表等信息。可在观测云 基础设施 -> 资源目录 中查看。展示的数据对于排查启动命令和引用的三方库版本问题有帮助。其中还包括主机信息、服务信息、产生的 Span 数信息等。
语言不同和版本不同数据可能会有很大的差异,以实际收到的数据为准。
固定提取 tag
从 DataKit 版本 1.21.0 开始,黑名单功能废弃,并且不在将 Span.Mate 中全部都提前到一级标签中,而是选择性提取。
以下是可能会提取出的标签列表:
| 原始 Meta 字段 | 提取出来的字段名 | 说明 |
|---|---|---|
http.url |
http_url |
HTTP 请求完整路径 |
http.hostname |
http_hostname |
hostname |
http.route |
http_route |
路由 |
http.status_code |
http_status_code |
状态码 |
http.method |
http_method |
请求方法 |
http.client_ip |
http_client_ip |
客户端 IP |
sampling.priority |
sampling_priority |
采样 |
span.kind |
span_kind |
span 类型 |
error |
error |
是否错误 |
runtime.name |
runtime_name |
运行时名称 |
dd.version |
dd_version |
agent 版本 |
error.message |
error_message |
错误信息 |
error.stack |
error_stack |
堆栈信息 |
error.type |
error_type |
错误类型 |
system.pid |
pid |
pid |
error.msg |
error_message |
错误信息 |
project |
project |
project |
version |
version |
版本 |
env |
env |
环境 |
host |
host |
tag 中的主机名 |
pod_name |
pod_name |
tag 中的 pod 名称 |
pod_namespace |
pod_namespace |
tag 中的 pod 名称 |
_dd.base_service |
_dd_base_service |
上级服务 |
peer.hostname |
db_host |
可能是 IP 或者域名,这取决于配置 |
db.type |
db_system |
数据库类型: mysql oracle 等等 |
db.instance |
db_name |
数据库名称 |
out.host |
out_host |
链接中间件的 Host |
dd_ext_version |
sdk_version |
SDK 扩展版本号 |
language |
sdk_language |
SDK 语言 |
在 Studio 的链路界面,不在列表中的标签也可以进行筛选。
从 DataKit 版本 1.22.0 恢复白名单功能,如果有必须要提取到一级标签列表中的标签,可以在 customer_tags 中配置。配置的白名单标签如果是原生的 message.meta 中,会使用 . 作为分隔符,采集器会进行转换将 . 替换成 _ 。
数据采集字段说明
链路
ddtrace
以下是采集上来的 tracing 字段说明
| Tags & Fields | Description |
|---|---|
| base_service ( tag) |
Span base service name |
| container_host ( tag) |
Container hostname. Available in OpenTelemetry. Optional. |
| db_host ( tag) |
DB host name: ip or domain name. Optional. |
| db_name ( tag) |
Database name. Optional. |
| db_system ( tag) |
Database system name:mysql,oracle... Optional. |
| dk_fingerprint ( tag) |
DataKit fingerprint(always DataKit's hostname) |
| endpoint ( tag) |
Endpoint info. Available in SkyWalking, Zipkin. Optional. |
| env ( tag) |
Application environment info. Available in Jaeger. Optional. |
| host ( tag) |
Hostname. |
| http_method ( tag) |
HTTP request method name. Available in DDTrace, OpenTelemetry. Optional. |
| http_route ( tag) |
HTTP route. Optional. |
| http_status_code ( tag) |
HTTP response code. Available in DDTrace, OpenTelemetry. Optional. |
| http_url ( tag) |
HTTP URL. Optional. |
| operation ( tag) |
Span name |
| out_host ( tag) |
This is the database host, equivalent to db_host,only DDTrace-go. Optional. |
| project ( tag) |
Project name. Available in Jaeger. Optional. |
| service ( tag) |
Service name. Optional. |
| source_type ( tag) |
Tracing source type |
| span_type ( tag) |
Span type |
| status ( tag) |
Span status |
| version ( tag) |
Application version info. Available in Jaeger. Optional. |
| duration | Duration of span Type: int | (gauge) Unit: time,μs |
| message | Origin content of span Type: string Unit: N/A |
| parent_id | Parent span ID of current span Type: string Unit: N/A |
| resource | Resource name produce current span Type: string Unit: N/A |
| span_id | Span id Type: string Unit: N/A |
| start | start time of span. Type: int | (gauge) Unit: timeStamp,usec |
| trace_id | Trace id Type: string Unit: N/A |
指标
tracing_metrics
基于 DDTrace 统计得到的指标数据,它记录了所产生的 span 计数、span 耗时等指标
| Tags & Fields | Description |
|---|---|
| collector_source_ip ( tag) |
Remote agent IP. |
| env ( tag) |
Application environment info(if set in span). |
| host ( tag) |
Hostname. |
| http_status_class ( tag) |
HTTP response code class, such as 2xx/3xx/4xx/5xx |
| http_status_code ( tag) |
HTTP response code |
| operation ( tag) |
Span name |
| pod_name ( tag) |
Pod name(if set in span). |
| pod_namespace ( tag) |
Pod namespace(if set in span). |
| project ( tag) |
Project name(if set in span). |
| resource ( tag) |
Application resource name. |
| service ( tag) |
Service name. |
| source ( tag) |
Source, always ddtrace |
| status ( tag) |
Span status(ok/error) |
| version ( tag) |
Application version info. |
| apdex | Measures the Apdex score for each web service. The currently set satisfaction threshold is 2 seconds.The tags for this metric are fixed: service/env/version/resource/source. The value range is 0~1.Type: float | (gauge) Unit: N/A |
| errors | Represent the count of errors for spans. Type: int | (gauge) Unit: count |
| errors_by_http_status | Represent the count of errors for a given span group by HTTP status code. Type: int | (gauge) Unit: count |
| hits | Count of spans. Type: int | (count) Unit: count |
| hits_by_http_status | Represent the count of hits for a given span group by HTTP status code. Type: int | (gauge) Unit: count |
| latency_bucket | Represent the latency distribution for all services, resources, and versions across different environments and additional primary tags. Recommended for all latency measurement use cases. Use the 'le' tag for filtering Type: int | (histogram) Unit: count |
| latency_count | The number of spans is equal to the number of web type spans. Type: int | (count) Unit: count |
| latency_sum | The total latency of all web spans, corresponding to the 'latency_count' Type: int | (gauge) Unit: time,μs |
资源对象
DDTrace 在启动后会上报自身配置信息、集成列表、依赖关系以及服务相关信息到 DataKit 。目前仅支持 Java Agent ,以下是各个字段说明:
app_client_configuration_change其中包含 Agent 的配置信息app_dependencies_loaded依赖列表,包括包名和版本信息app_integrations_change集成列表,包括包名和是否开启探针- 其他主机信息和服务等信息
tracing_service
采集 DDTrace 的 Service、Host、进程等配置信息
| Tags & Fields | Description |
|---|---|
| architecture ( tag) |
Architecture |
| env ( tag) |
Service ENV |
| hostname ( tag) |
Host name |
| kernel_name ( tag) |
Kernel name |
| kernel_release ( tag) |
Kernel release |
| kernel_version ( tag) |
Kernel version |
| language_name ( tag) |
Language name |
| language_version ( tag) |
Language version |
| name ( tag) |
Same as service name |
| os ( tag) |
OS name |
| os_version ( tag) |
OS version |
| runtime_id ( tag) |
Runtime ID |
| runtime_name ( tag) |
Runtime name |
| runtime_patches ( tag) |
Runtime patches |
| runtime_version ( tag) |
Runtime version |
| service ( tag) |
Service |
| service_version ( tag) |
Service version |
| tracer_version ( tag) |
DDTrace version |
| app_client_configuration_change | JSON payload from a DDTrace APM telemetry client-configuration-change request. Type: string | (string) Unit: N/A |
| app_closing | JSON payload from a DDTrace APM telemetry app-closing request. Type: string | (string) Unit: N/A |
| app_dependencies_loaded | JSON payload containing dependencies loaded by the traced application. Type: string | (string) Unit: N/A |
| app_integrations_change | JSON payload from a DDTrace APM telemetry integrations-change request. Type: string | (string) Unit: N/A |
| app_started | JSON payload from the DDTrace APM telemetry app-started request. Type: string | (string) Unit: N/A |
| spans_created | Number of spans created by the traced application as reported by DDTrace telemetry. Type: float | (count) Unit: count |
| spans_finished | Number of spans finished by the traced application as reported by DDTrace telemetry. Type: float | (count) Unit: count |