AWS Lambda
The displayed Metrics for AWS Lambda include cold start time, execution time, concurrent executions, and memory usage. These Metrics reflect the response speed, scalability, and resource utilization of Lambda functions.
Configuration
Install Func
It is recommended to activate the Guance Integration - Extensions - DataFlux Func (Automata): All prerequisites are automatically installed, please proceed with the script installation.
If deploying Func manually, refer to Manual Deployment of Func
Install Script
Note: Please prepare an Amazon Cloud AK that meets the requirements in advance (for simplicity, you can directly grant the CloudWatch read-only permission
CloudWatchReadOnlyAccess)
Automated Script Activation
- Log in to the Guance console
- Click on the 【Integration】 menu, select 【Cloud Account Management】
- Click on 【Add Cloud Account】, select 【AWS】, and fill in the required information on the interface. If the cloud account information has been configured before, skip this step.
- Click on 【Test】, and if the test is successful, click on 【Save】. If the test fails, please check the relevant configuration information and retest.
- Click on the 【Cloud Account Management】 list to view the added cloud account, click on the corresponding cloud account to enter the details page.
- Click on the 【Integration】 button on the cloud account details page, find
AWS Lambdaunder theNot Installedlist, and click on the 【Install】 button to install it.
Manual Script Activation
-
Log in to the Func console, click on 【Script Market】, enter the Guance script market, and search for:
integration_aws_lambda -
Click on 【Install】, and enter the corresponding parameters: AWS AK ID, AK Secret, and account name.
-
Click on 【Deploy Startup Script】, the system will automatically create a
Startupscript set and configure the corresponding startup scripts. -
After enabling, you can see the corresponding automatic trigger configuration in 「Management / Automatic Trigger Configuration」. Click on 【Execute】 to immediately execute it once without waiting for the scheduled time. After a while, you can view the execution task records and corresponding logs.
Verification
- In 「Management / Automatic Trigger Configuration」, confirm whether the corresponding task has the corresponding automatic trigger configuration, and you can also check the corresponding task records and logs for any anomalies.
- In Guance, 「Infrastructure / Custom」, check if there is asset information.
- In Guance, 「Metrics」, check if there is corresponding monitoring data.
Metrics
After configuring Amazon CloudWatch, the default Measurement is as follows. More Metrics can be collected through configuration:
Amazon CloudWatch Lambda Metrics Details
Invocation Metrics
| Metric | Description |
|---|---|
Invocations |
The number of times the function code is invoked, including successful invocations and invocations that result in a function error. If the invocation request is throttled or results in an invocation error, the invocation is not recorded. The value of Invocations equals the number of billed requests. |
Errors |
The number of invocations that result in a function error. Function errors include exceptions thrown by your code and exceptions thrown by the Lambda runtime. The runtime returns errors due to timeouts, configuration errors, etc. To calculate the error rate, divide the value of Errors by the value of Invocations. Note that the timestamp on the error metric reflects the time the function was invoked, not the time the error occurred. |
DeadLetterErrors |
For asynchronous invocations, the number of times Lambda attempts to send an event to a dead letter queue (DLQ) but fails. Resource misconfiguration or size limits may cause dead letter errors. |
DestinationDeliveryFailures |
For asynchronous invocations and supported event source mappings, the number of times Lambda attempts to send an event to a destination but fails. For event source mappings, Lambda supports destinations for stream sources (DynamoDB and Kinesis). Permission errors, resource misconfiguration, or size limits may cause delivery errors. This error may occur if you configure a destination that is an unsupported destination type, such as an Amazon SQS FIFO queue or an Amazon SNS FIFO topic. |
Throttles |
The number of throttled invocation requests. When all function instances are processing requests and there is no available concurrency for scaling out, Lambda rejects additional requests with a TooManyRequestsException error. Throttled requests and other invocation errors are not counted as Invocations or Errors. |
ProvisionedConcurrencyInvocations |
The number of times the function code is invoked using provisioned concurrency. |
ProvisionedConcurrencySpilloverInvocations |
The number of times the function code is invoked using standard concurrency when all provisioned concurrency is in use. |
RecursiveInvocationsDropped |
The number of times Lambda stops invoking your function because it detects that your function is part of an infinite recursive loop. Lambda recursive loop detection monitors the number of times your function is invoked as part of a request chain by tracking metadata added by supported AWS SDKs. If your function is invoked more than 16 times as part of a request chain, Lambda interrupts the next invocation. |
Performance Metrics
Performance Metrics provide detailed information about the performance of individual function invocations. For example, the Duration metric indicates the amount of time (in milliseconds) the function spends processing an event. To understand how quickly your function processes events, view these Metrics using the Average or Max statistics.
| Metric | Description |
|---|---|
Duration |
The amount of time the function code spends processing an event. The billed duration of an invocation is the Duration value rounded up to the nearest millisecond. |
PostRuntimeExtensionsDuration |
The cumulative amount of time the runtime spends running code for extensions after the function code completes. |
IteratorAge |
For event source mappings that read from a stream, the age of the last record in the event. This metric measures the amount of time between when the stream receives the record and when the event source mapping sends the event to the function. |
OffsetLag |
For self-managed Apache Kafka and Amazon Managed Streaming for Apache Kafka (Amazon MSK) event sources, the difference in offset between the last record written to the topic and the last record processed by the function's consumer group. Although Kafka topics can have multiple partitions, this metric measures offset lag at the topic level. |
Concurrency Metrics
Lambda reports concurrency Metrics as a total count of instances processing events across functions, versions, aliases, or AWS regions. To see how close you are to the concurrency limit, view these Metrics using the Max statistics.
| Metric | Description |
|---|---|
ConcurrentExecutions |
The number of function instances processing events. If this number reaches the region's concurrency execution quota or the reserved concurrency limit you configure on the function, Lambda will throttle additional invocation requests. |
ProvisionedConcurrentExecutions |
The number of function instances processing events using provisioned concurrency. For each invocation of an alias or version with provisioned concurrency, Lambda emits the current count. |
ProvisionedConcurrencyUtilization |
For a version or alias, the value of ProvisionedConcurrentExecutions divided by the total allocated provisioned concurrency. For example, .5 indicates that 50% of the allocated provisioned concurrency is in use. |
UnreservedConcurrentExecutions |
For a region, the number of events processed by functions that do not have reserved concurrency. |
Asynchronous Invocation Metrics
Asynchronous invocation Metrics provide detailed information about asynchronous invocations from event sources and direct invocations. You can set thresholds and alarms to notify you of certain changes. For example, when the number of events queued for processing increases unexpectedly (AsyncEventsReceived). Or, when an event has been waiting a long time to complete processing (AsyncEventAge).
| Metric | Description |
|---|---|
AsyncEventsReceived |
The number of events Lambda successfully queues for processing. This metric gives you insight into the number of events your Lambda function receives. Monitor this metric and set threshold alarms to check for issues. For example, detect the number of bad events sent to Lambda and quickly diagnose issues caused by incorrect trigger or function configuration. A mismatch between AsyncEventsReceived and Invocations may indicate discrepancies in processing, events being dropped, or potential queue backlogs. |
AsyncEventAge |
The amount of time between when Lambda successfully queues an event and when it invokes the function. This metric's value increases when events are retried due to invocation failures or throttling. Monitor this metric and set threshold alarms for different statistics when queue buildup occurs. To resolve increases in this metric, review the Errors metric to identify function errors and the Throttles metric to determine concurrency issues. |
AsyncEventsDropped |
The number of events dropped without successfully executing the function. If you configure a dead letter queue (DLQ) or OnFailure destination, events are sent there before being dropped. Events are dropped for various reasons. For example, an event may exceed the maximum event age or exhaust the maximum number of retries, or reserved concurrency may be set to 0. To resolve issues with this metric being dropped, review the Errors metric to identify function errors and the Throttles metric to determine concurrency issues. |
Lambda Fetching S3 Data
Fetch and report AWS S3 data to Guance through AWS Lambda
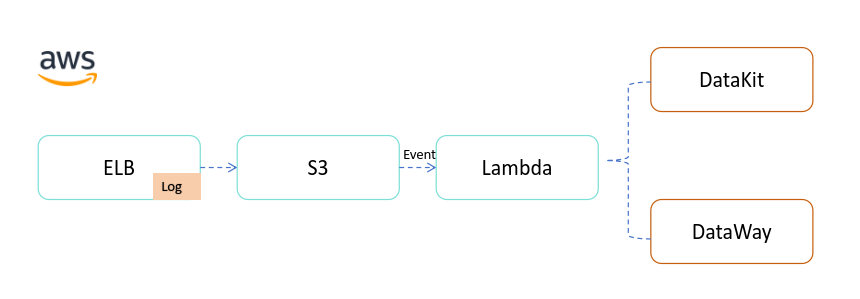
For ELB log enabling method, refer to AWS ELB Log Collection
1. Create Lambda Function Using Console
-
Open the Lambda console function page.
-
Select "Create function"
-
Choose "Author from scratch"
-
Enter function name
-
Set
Runtimeoption toPython 3.10 -
In Execution Role, select "Create a new role with basic Lambda permissions" (see appendix for specific permission list; if already exists, you can directly use a minimal permission role). Lambda creates an execution role that grants the function permission to upload logs to Amazon CloudWatchlogs. When you invoke the function, the Lambda function assumes the execution role and uses it to create credentials for the Amazon software development kit and read data from event sources.
-
Click "Create function"
-
Pull synchronized code from GitHub to the code source below, and copy the content of
lambda-forward.pytolambda-function.py -
In the same directory as
lambda-function.py, create new filessetting.py,datakit.py, anddataway.py, and copy the corresponding file code from GitHub into them. -
Add environment variables
DATAKIT_IP: IP address where datakit is deployed, required when data source is datakitDATAKIT_PORT: datakit service port, optional when data source is datakit, default:9529DATAWAY_URL: dataway URL (Eg: https://xx-openway.xxx.com), required when data source isdatawayWORKSPACE_TOKEN: platform workspaceToken, required when data source isdataway
Note: Either datakit or dataway must be selected as the data source. When choosing datakit, please configure
DATAKIT_IP; when choosing dataway, please configureDATAWAY_URLandWORKSPACE_TOKEN -
If the datakit port is not the default
9529, you can add the environment variableDATAKIT_PORTand fill in the correct port address (this variable is optional) -
Click
Deployto publish
2. Configure Lambda Trigger
-
Click
Add trigger -
Set
Select a sourcetoS3 -
Select the
bucketto monitor -
Select event types that trigger the Lambda function
-
Agree "I acknowledge that using the same S3 bucket for input and output is not recommended, and this configuration may cause recursive calls, increase Lambda usage, and increase costs"
-
Click "Add"
Access ELB to Generate Logs
Access applications on ELB, ELB will upload generated logs to S3, and Lambda function will fetch and report them to Guance
Object
The collected AWS Lambda object data structure can be seen in 「Infrastructure - Custom」.
{
  "measurement": "aws_lambda",
  "tags": {
    "account_name"      :"AWS_Lambda",
    "class"             :"aws_lambda",
    "cloud_provider"    :"aws",
    "FunctionName"      :"dataflux-alb",
    "name"              :"dataflux-alb",
    "PackageType"       :"Zip",
    "RegionId"          :"cn-northwest-1",
    "RevisionId"        :"5e52ff51-615a-4ecb-96b7-40083a7b4b62",
    "Role"              :"arn:aws-cn:iam::294654068288:role/service-role/s3--xxxx-role-3w34zo42",
    "Runtime"           :"python3.7",
    "Version"           :"$LATEST"
  },
  "fields": {
    "CreatedTime"         : "2022-03-09T06:13:31Z",
    "ListenerDescriptions": "{JSON data}",
    "AvailabilityZones"   : "{Availability Zone JSON data}",
    "message"             : "{Instance JSON data}"
  }
}
Note: The fields in
tags,fieldsmay change with subsequent updatesTip 1: The value of
tags.account_nameis the instance ID, used as a unique identifier.