Exception Events and PagerDuty Linkage
When our application or system encounters exceptions, it usually needs to be dealt with promptly to ensure the normal operation of the system. To better manage and track exception events, we can send these events to PagerDuty to create events, so that we can track, analyze, and solve these problems in PagerDuty. By quickly sending exception events to PagerDuty to create events, it provides us with better capabilities to manage and track exception events, thereby better ensuring the normal operation of the system. At the same time, this method can also help us better analyze and solve problems, improving the stability and reliability of the system.
Configuration
Preparation
- Deploy a Dataflux Func Observation Cloud Special Edition to generate authorization links
- Create a webhook custom notification object (the webhook address is the Func authorization link address)
- Correctly configure the monitor
- Create a Service in PagerDuty with Integrations as Events API V2
Deployment process
Create Webhook Custom Notification Object
Create a new notification object in the Observation Cloud studio in [Monitoring/Notification Object Management], select webhook custom, and fill in the authorization link address of our deployed Dataflux Func in the webhook address.
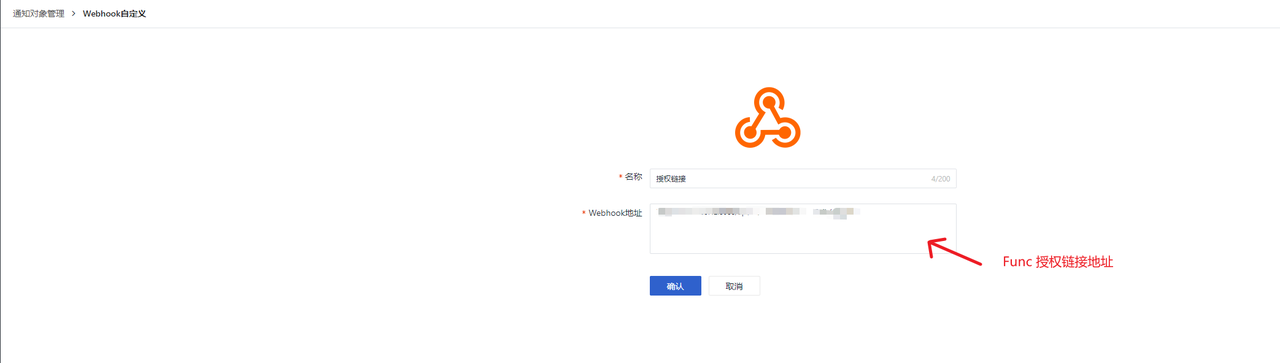
Note: Please select the authorization link without parameters in Func
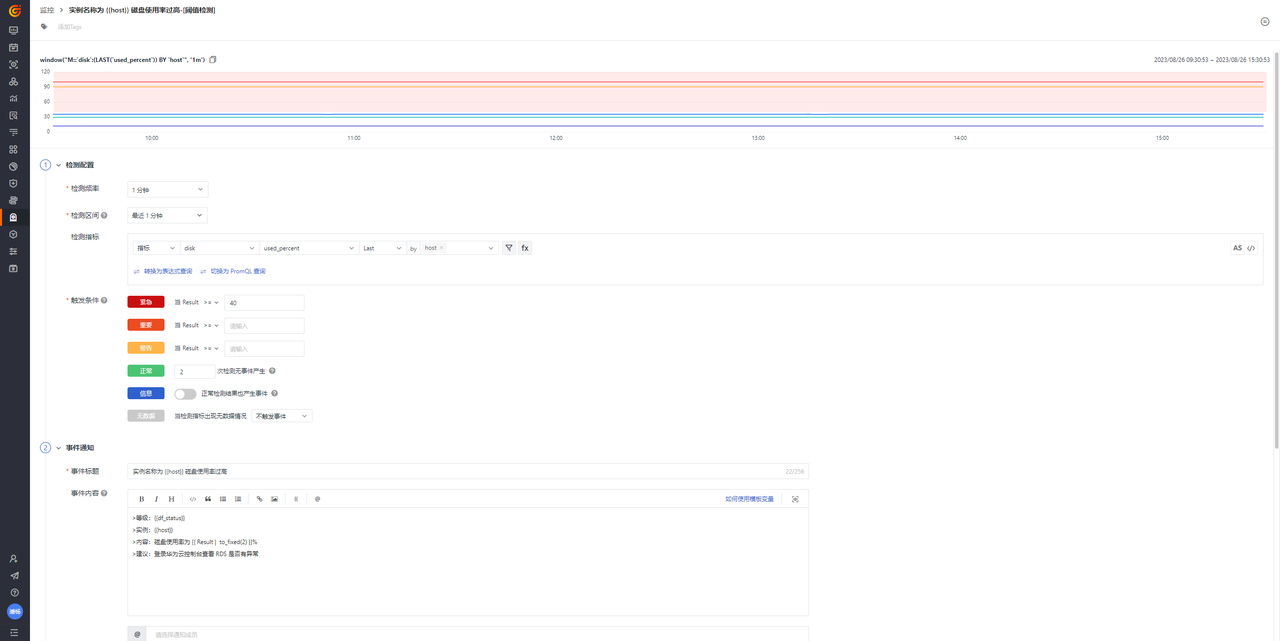
Create Monitor
Create a new monitor in the Observation Cloud studio in [Monitoring/Monitors], select the metrics to be observed, configure the notification content of the event, and then specify the alarm notification object in the alarm strategy as the name of the webhook custom notification object we just created.
Write Listening Script
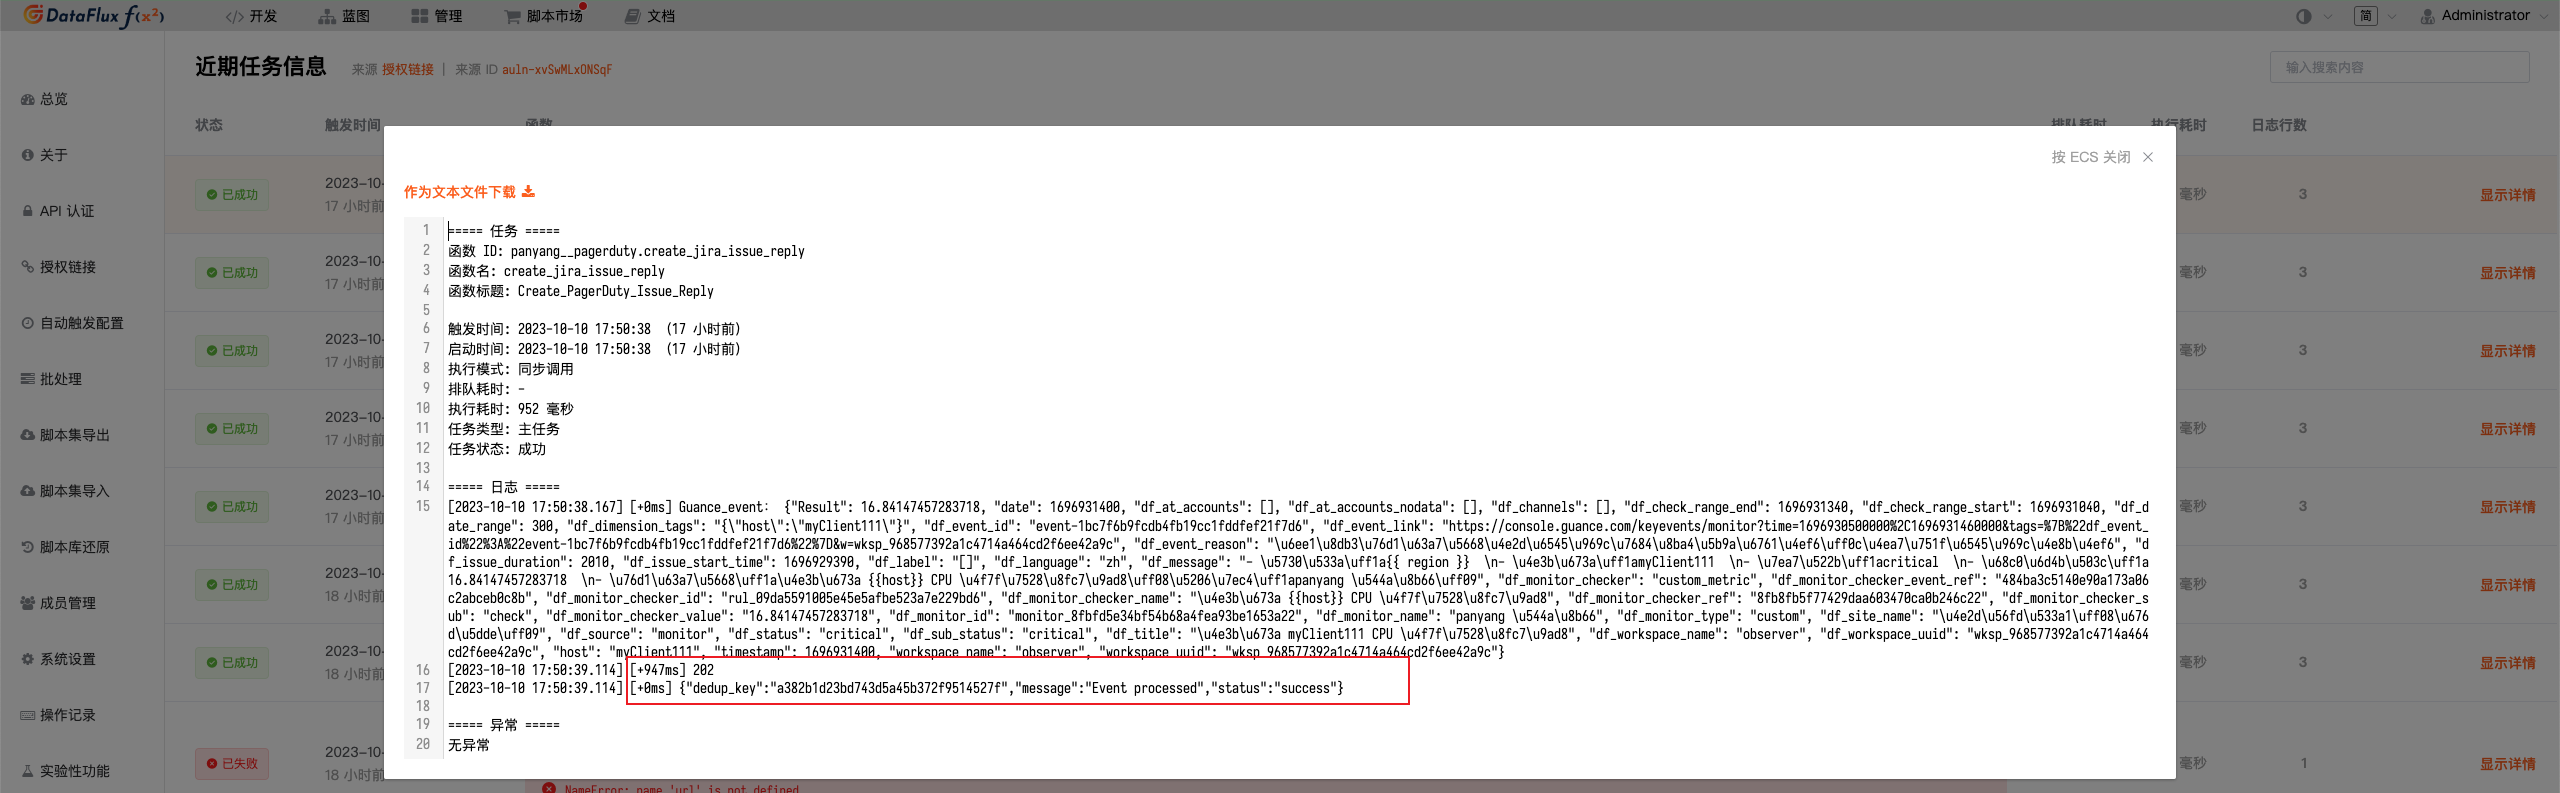
After configuring the detection rules of the monitor, we need to write a script in the already installed and configured Dataflux Func to get new messages and send them to PagerDuty to generate events.
First, we need to introduce some constants, such as events_url, routing_key, etc.
import requests
import json

events_url = "https://events.pagerduty.com/v2/enqueue"
routing_key = "xxxxxxxxxx"
After introducing the constants we need, we need to know the data structure of the monitoring event, so as to parse and create the event to be sent to PagerDuty.
{
    "Result":100,
    "date":1693034940,
    "df_at_accounts":[

    ],
    "df_at_accounts_nodata":[

    ],
    "df_channels":[
        "chan_968577392a1c4714a464cd2f6ee42a9c"
    ],
    "df_check_range_end":1693034880,
    "df_check_range_start":1693034820,
    "df_date_range":60,
    "df_dimension_tags":"{\"host\":\"share\"}",
    "df_event_id":"event-f20a38aa58b54c6c8d4c9a84e655db1a",
    "df_event_link":"https://console.guance.com/keyevents/monitor?time=1693034040000%2C1693035000000&tags=%7B%22df_event_id%22%3A%22event-f20a38aa58b54c6c8d4c9a84e655db1a%22%7D&w=wksp_968577392a1c4714a464cd2f6ee42a9c",
    "df_event_reason":"\u6ee1\u8db3\u76d1\u63a7\u5668\u4e2d\u6545\u969c\u7684\u8ba4\u5b9a\u6761\u4ef6\uff0c\u4ea7\u751f\u6545\u969c\u4e8b\u4ef6",
    "df_exec_mode":"crontab",
    "df_issue_duration":3840,
    "df_issue_start_time":1693031100,
    "df_label":"[]",
    "df_language":"zh",
    "df_message":">\u7b49\u7ea7\uff1acritical    \n>\u5b9e\u4f8b\uff1ashare    \n>\u5185\u5bb9\uff1a\u78c1\u76d8\u4f7f\u7528\u7387\u4e3a 100.00%    \n>\u5efa\u8bae\uff1a\u767b\u5f55\u534e\u4e3a\u4e91\u63a7\u5236\u53f0\u67e5\u770b RDS \u662f\u5426\u6709\u5f02\u5e38",
    "df_monitor_checker":"custom_metric",
    "df_monitor_checker_event_ref":"13713ac25e993a37d2ca5899e2a7bba6",
    "df_monitor_checker_id":"rul_c439124e218f4c0c9cb114b5d04eeab4",
    "df_monitor_checker_name":"\u5b9e\u4f8b\u540d\u79f0\u4e3a {{host}} \u78c1\u76d8\u4f7f\u7528\u7387\u8fc7\u9ad8",
    "df_monitor_checker_ref":"aad7deb63b2e58b301f823517fea944d",
    "df_monitor_checker_sub":"check",
    "df_monitor_checker_value":"100",
    "df_monitor_id":"monitor_6774968876c14586bc5afc6d7144f52f",
    "df_monitor_name":"\u9ed8\u8ba4",
    "df_monitor_type":"custom",
    "df_site_name":"\u4e2d\u56fd\u533a1\uff08\u676d\u5dde\uff09",
    "df_source":"monitor",
    "df_status":"critical",
    "df_sub_status":"critical",
    "df_title":"\u5b9e\u4f8b\u540d\u79f0\u4e3a share \u78c1\u76d8\u4f7f\u7528\u7387\u8fc7\u9ad8",
    "df_workspace_name":"observer",
    "df_workspace_uuid":"wksp_968577392a1c4714a464cd2f6ee42a9c",
    "host":"share",
    "timestamp":1693034940,
    "workspace_name":"observer",
    "workspace_uuid":"wksp_968577392a1c4714a464cd2f6ee42a9c"
}
This Json contains the event title df_title, event details df_message, and event status df_status information we need. Of course, this Json also contains other related information such as event production time, abnormal value, workspace ID, etc. If we need, we can also fill it into the events we need to generate.
After clarifying the input data structure, we can write a function to create PagerDuty events.
@DFF.API('Create_PagerDuty_Issue_Reply')
def create_pagerduty_issue_reply(**kwargs):
    # Get Guance event data
    event = json.dumps(kwargs)
    print("Guance_event:", event)
    summary  = kwargs["df_title"]
    description = kwargs["df_message"]
    serverity = kwargs["df_status"]
    df_event_link = kwargs["df_event_link"]
    workspace_name = kwargs["workspace_name"]
    result = kwargs["Result"]
    date = kwargs["date"]
    # Build request data
    headers = {
        "Content-Type": "application/json",
        "Accept": "application/vnd.pagerduty+json;version=2",
    }

    payload = {
        "routing_key": routing_key,
        "event_action": "trigger",
        "payload": {
            "summary": summary,
            "source": "monitoringtool:cloudvendor:central-region-dc-01:852559987:cluster/api-stats-prod-003",
            "severity": serverity,
            "custom_details": {
                "result": result,
                "date": date,
                "description": description
            }
        },
        "client": "Guance" + workspace_name,
        "client_url": df_event_link
    }
    # Create event
    response = requests.post(events_url, headers=headers, data=json.dumps(payload))
    # Print new event
    print(response.status_code)
    print(response.text)
We create a PagerDuty instance by getting the event details in the Observation Cloud and create it into an event dictionary, which is then sent to PagerDuty. After successful sending, the log will be generated containing dedup_key and status information.
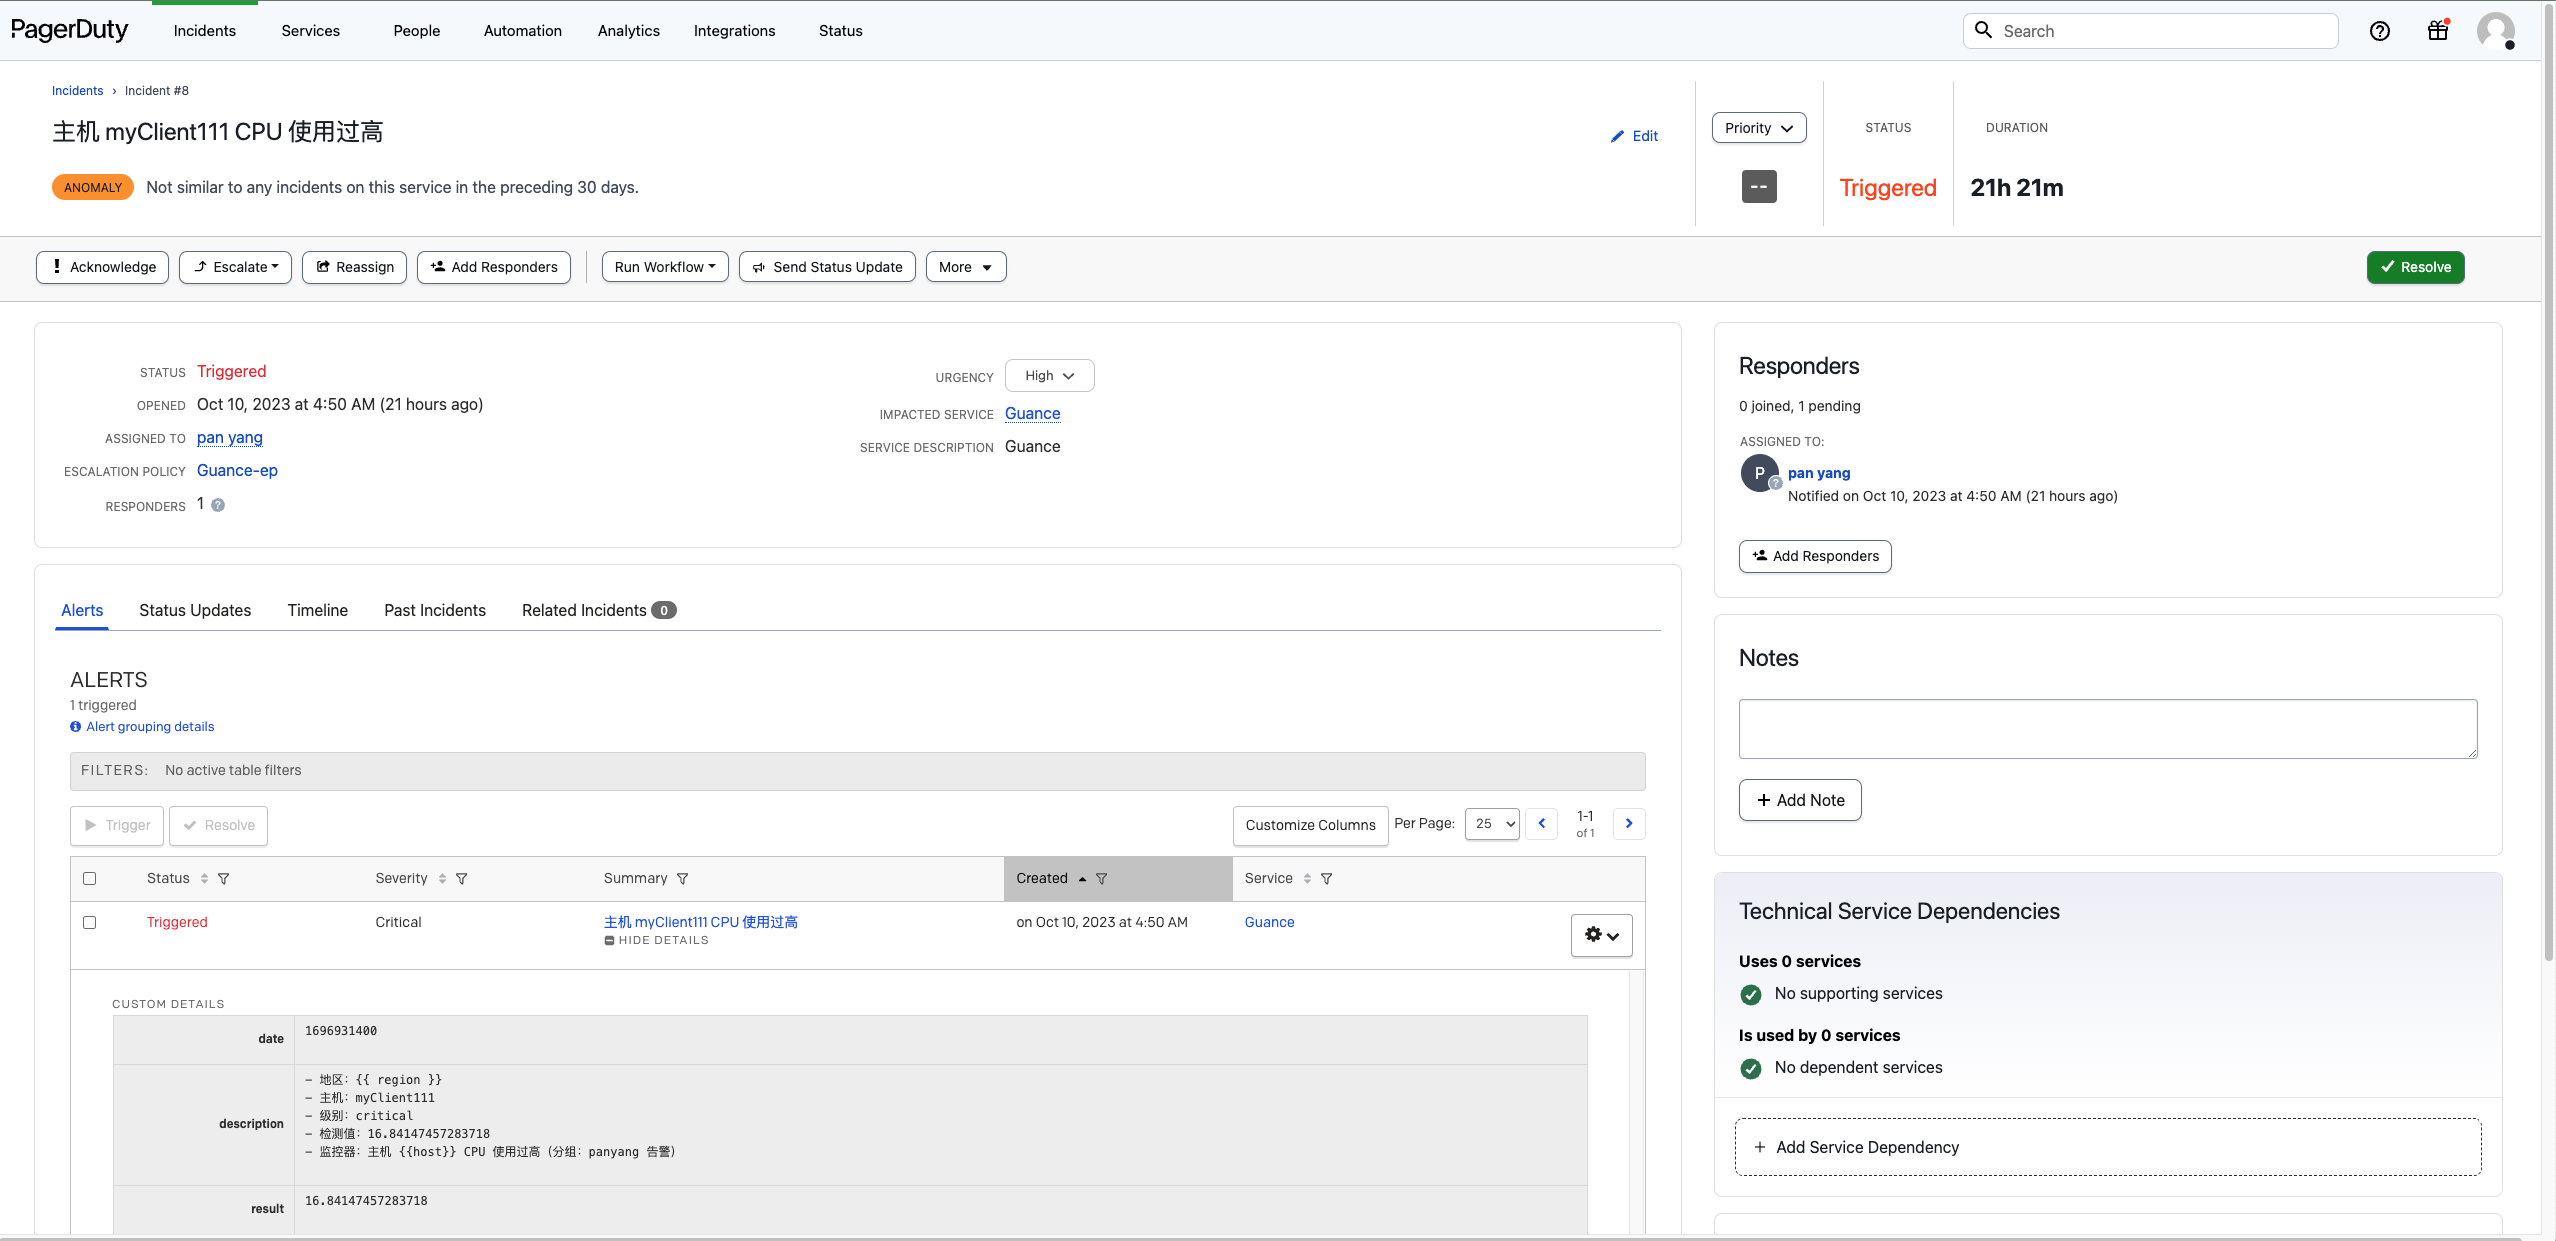
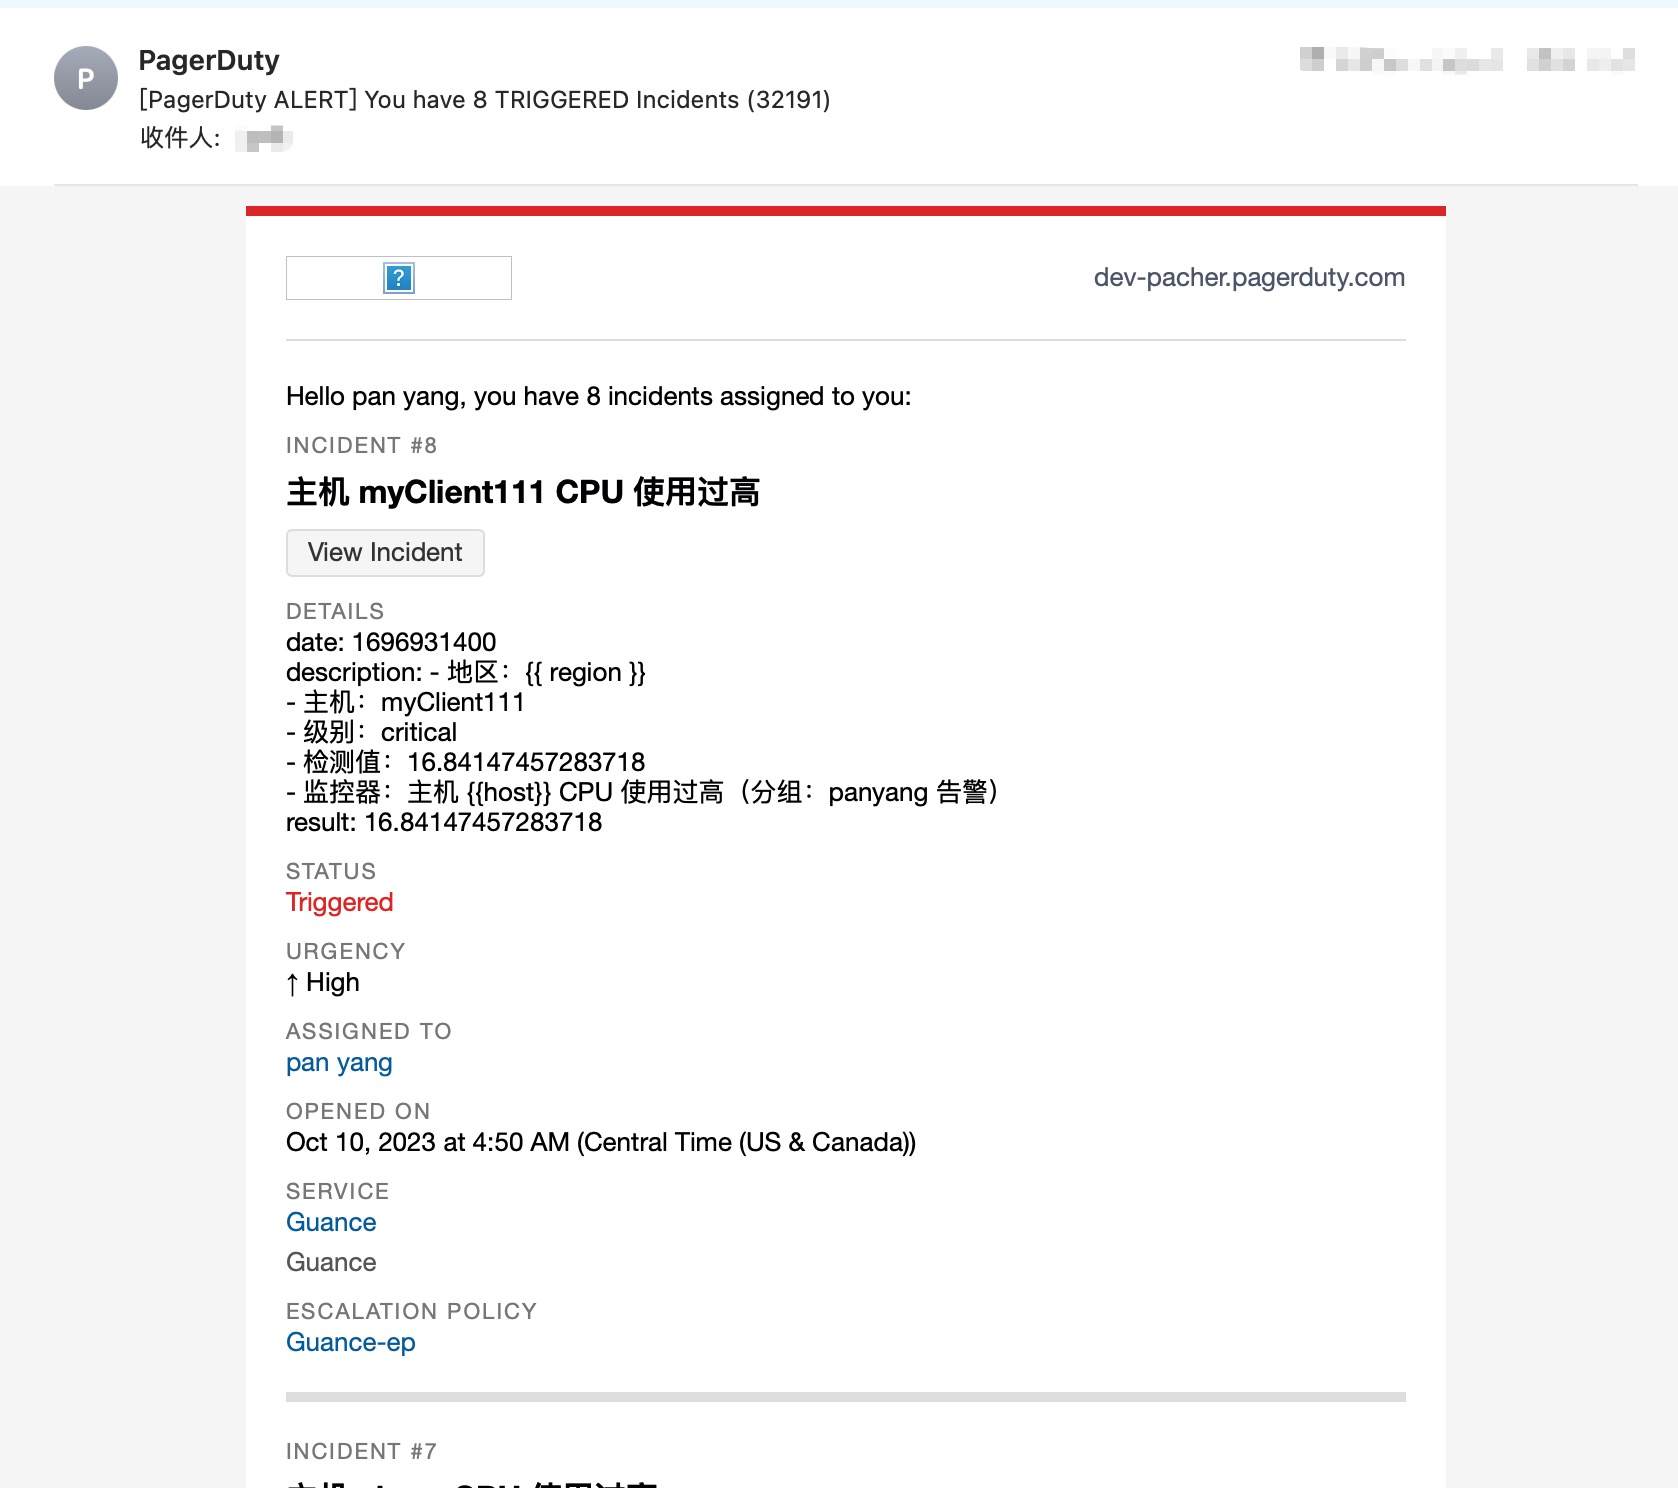
Then we can view the corresponding alarm information in PagerDuty and the email.
You can also receive alarm information through the email configured by PagerDuty.
After writing the script, we can click Publish.