Top List
An objective reflection of the relative strength of related entities of the same category, concisely displaying the ascending or descending order ranking of the Top N or Bottom N.
Use Cases
It can be used to display the ascending or descending order ranking of specific metric data, allowing you to view the ranking of grouped data.
Chart Query
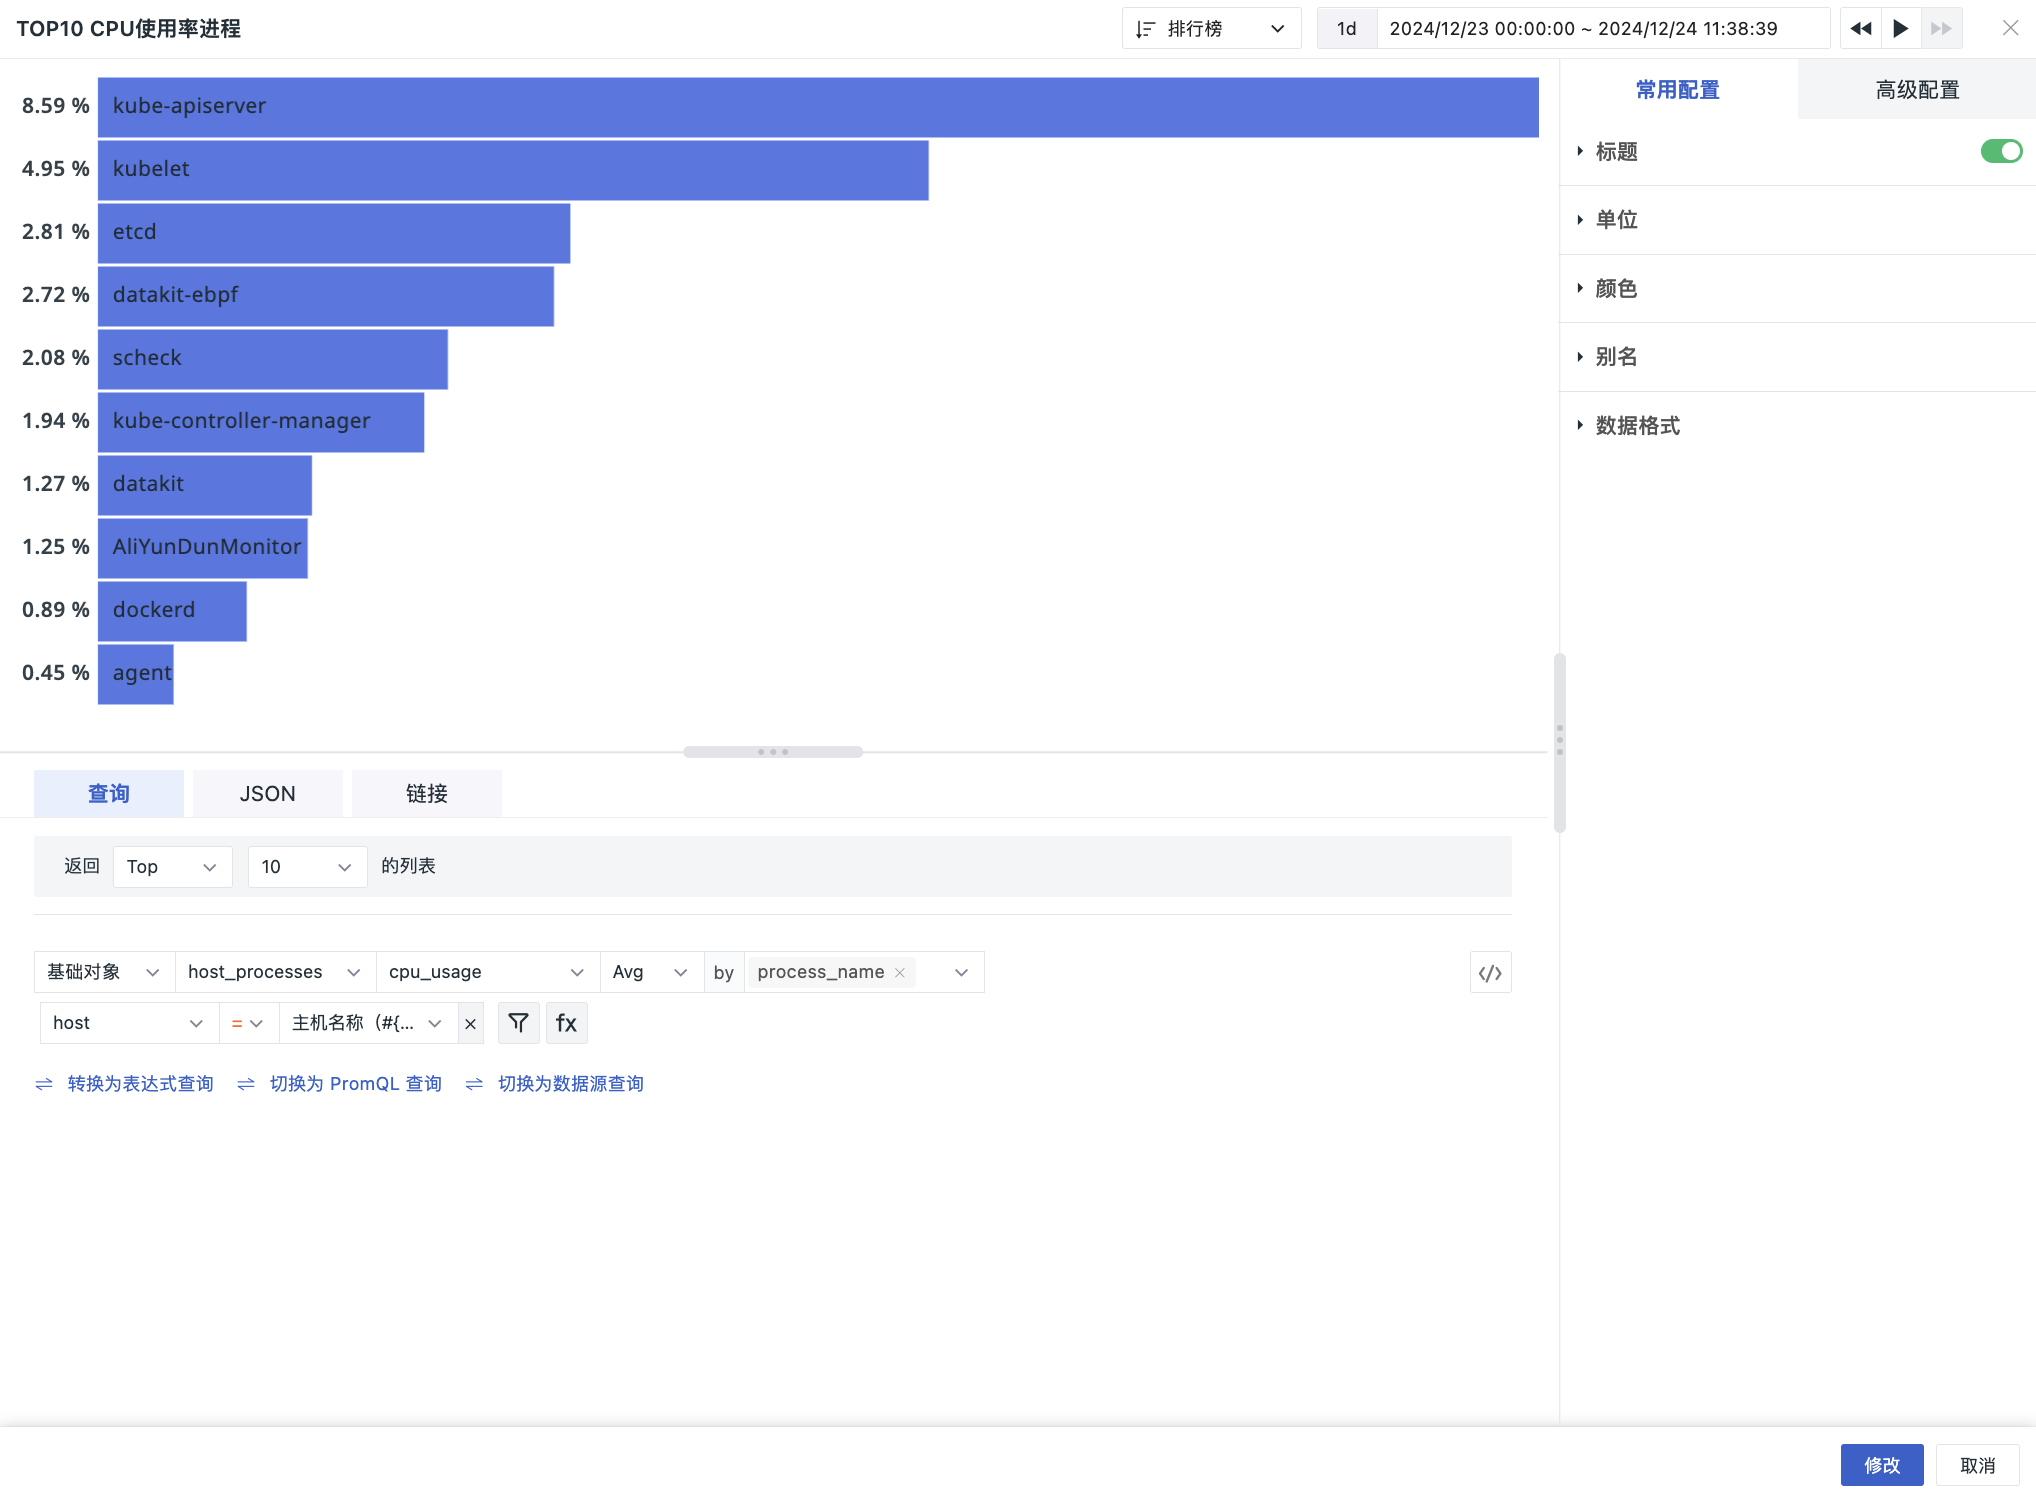
Supports four query methods:
- Simple Query
- Expression Query
- DQL Query
- Promql Query
The query has the Top/Bottom function built-in by default, with four preset ranking quantities: 5, 10, 20, 100. You can also manually enter the number of items, with a maximum of 100 data points, and sort them in ascending or descending order based on the selected metric.
Note
If a transformation function not supported by the Expression Query is used in the Simple Query, it will not be carried over when switching to Expression Query.
For more detailed explanations of chart query conditions, please refer to Chart Query.
Chart Configuration
For more details, please refer to Chart Configuration.