Log Explorer
After log data is collected into the system, you can view all log data reported within the current workspace in Log > Explorer.
Note
If the role of the currently logged-in account has set the "Only show rules related to me" rule in Log > Data Access, the queried log content will be affected accordingly.
View Modes
To meet the viewing and analysis needs of different scenarios, the Explorer supports multiple display modes:
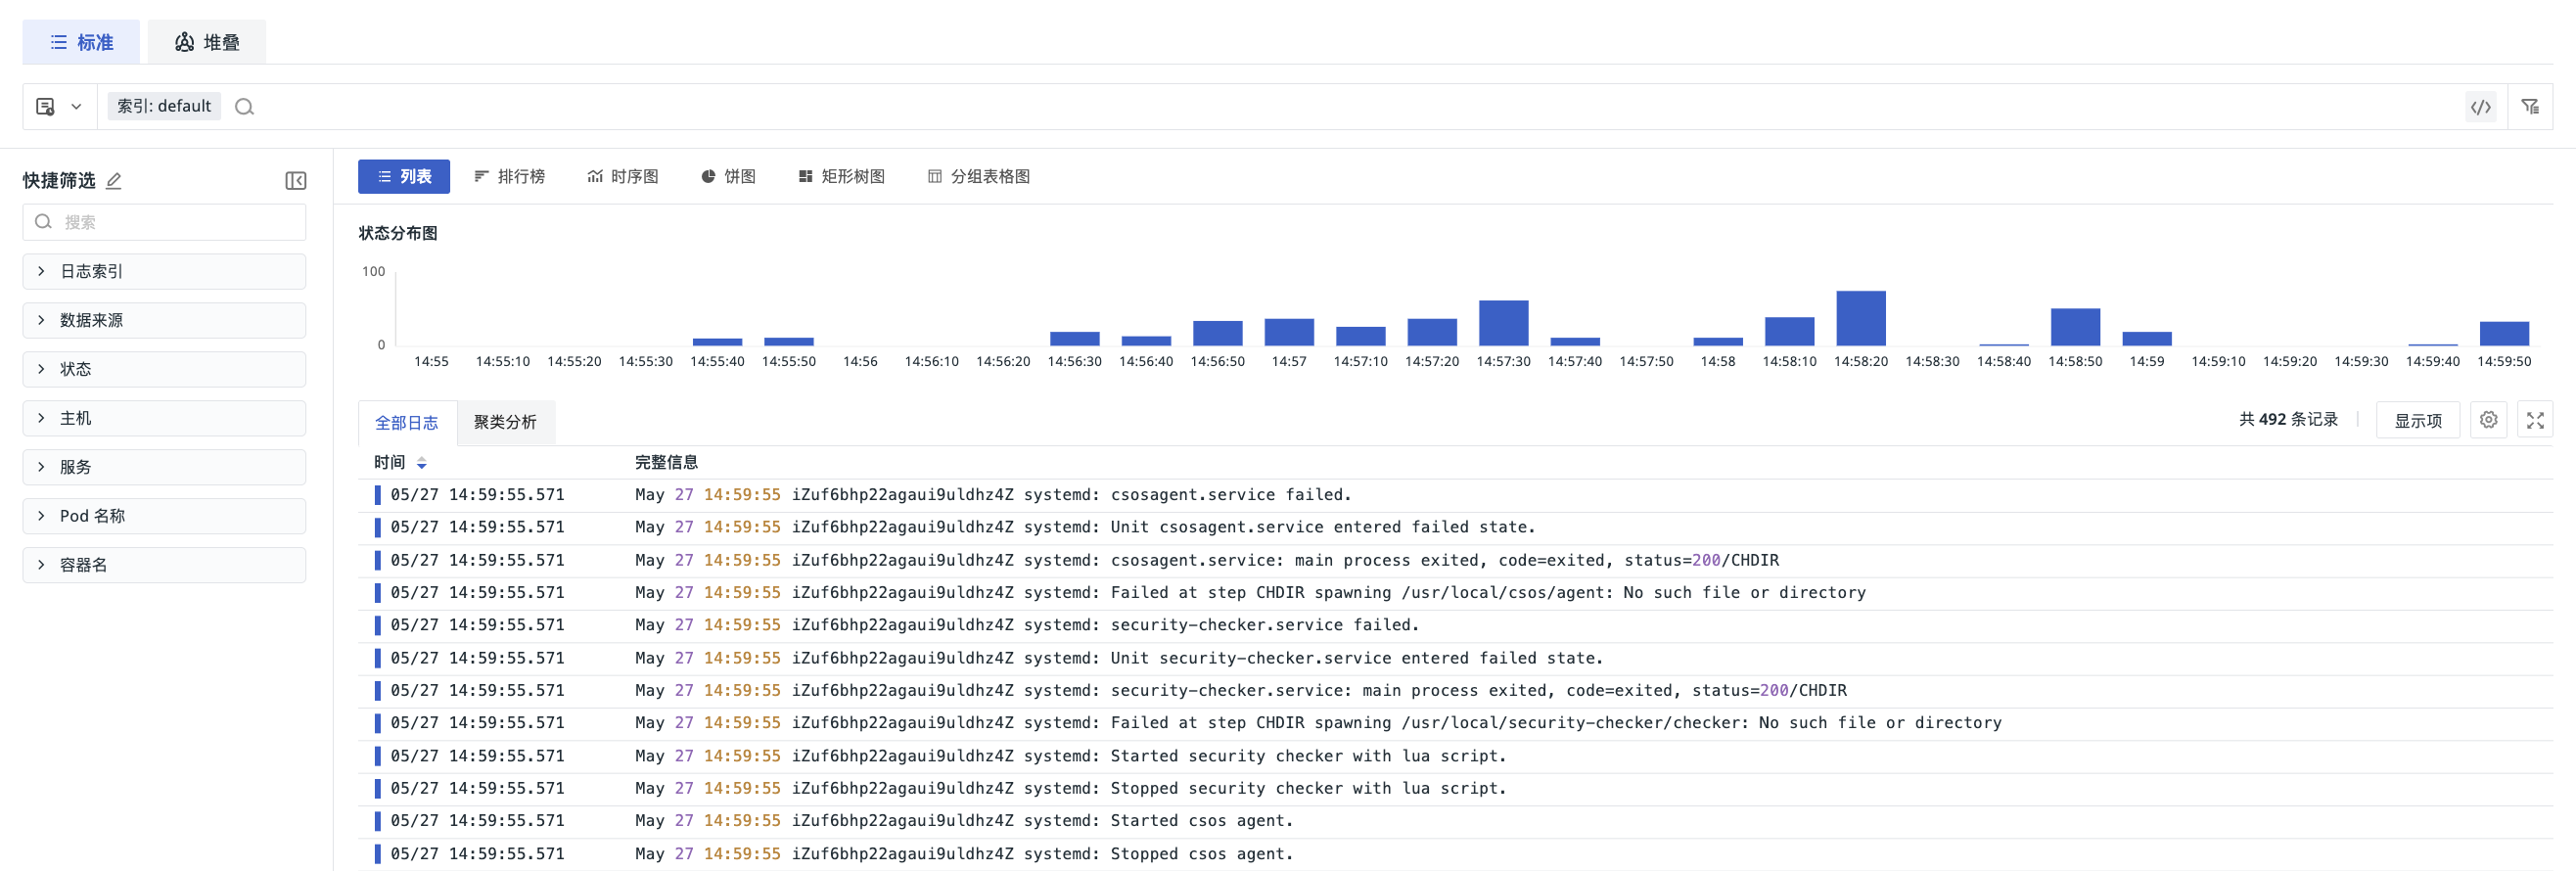
List
Each field of the log occupies a separate column, displaying the complete content of all fields, allowing for an intuitive view of the detailed information of each log entry.
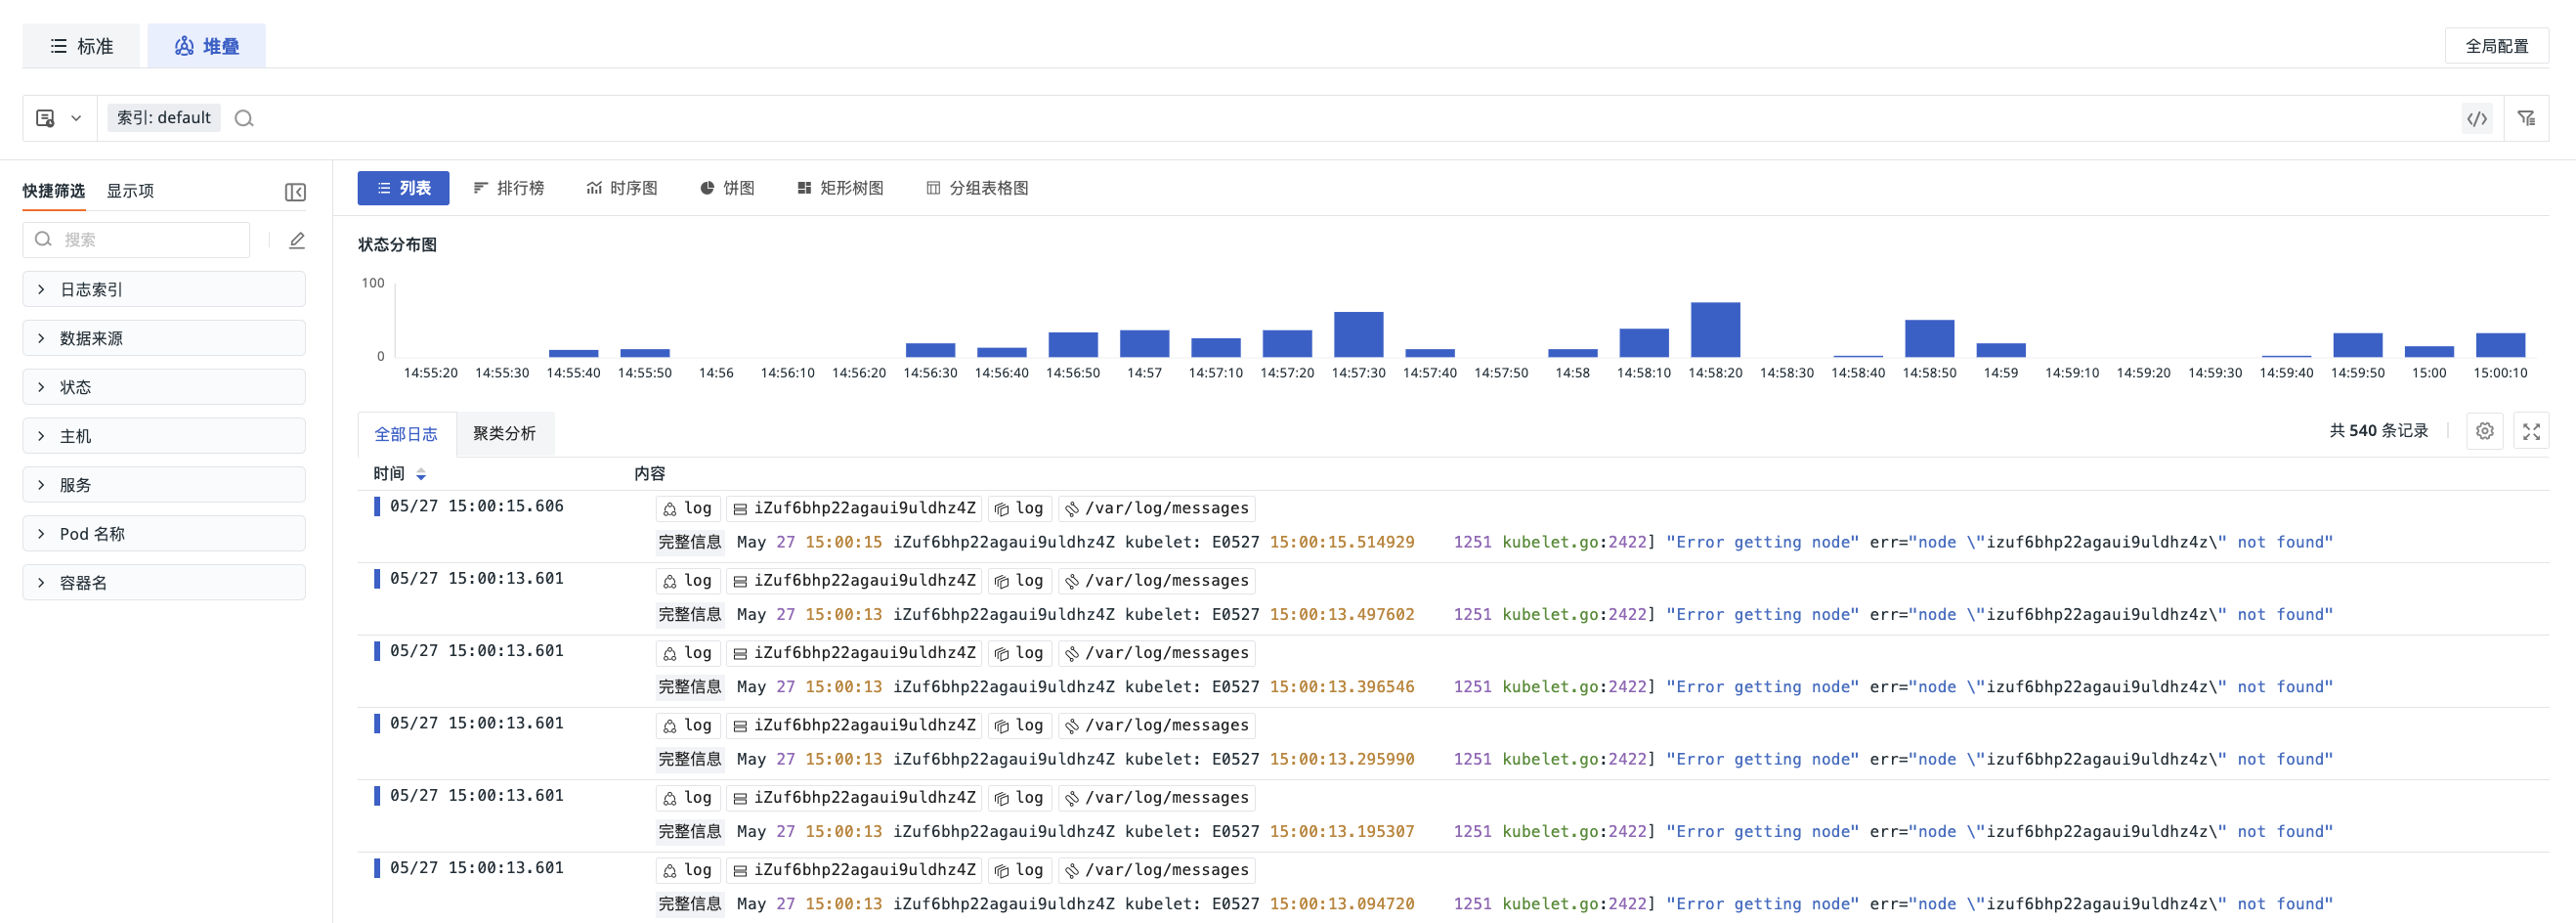
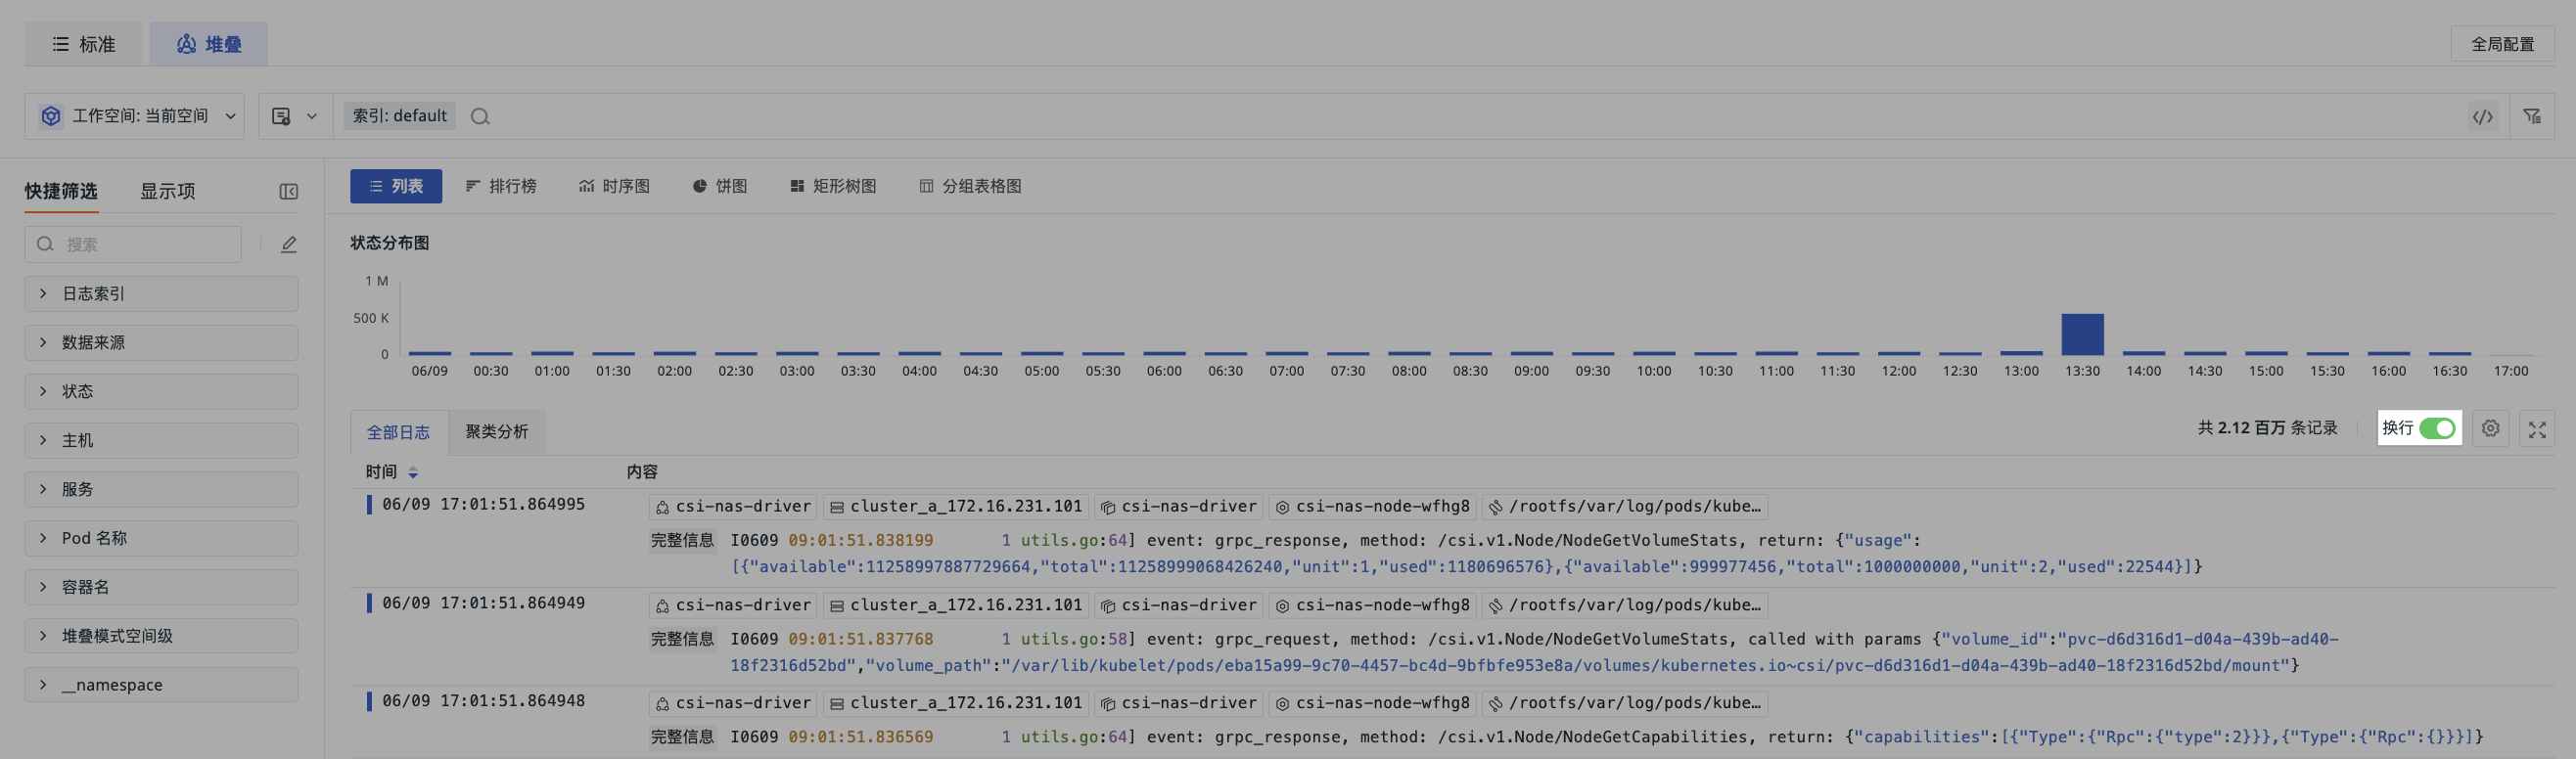
Stacked List
Except for the time field (time), all other fields are merged into a single column and displayed across multiple lines within the cell:
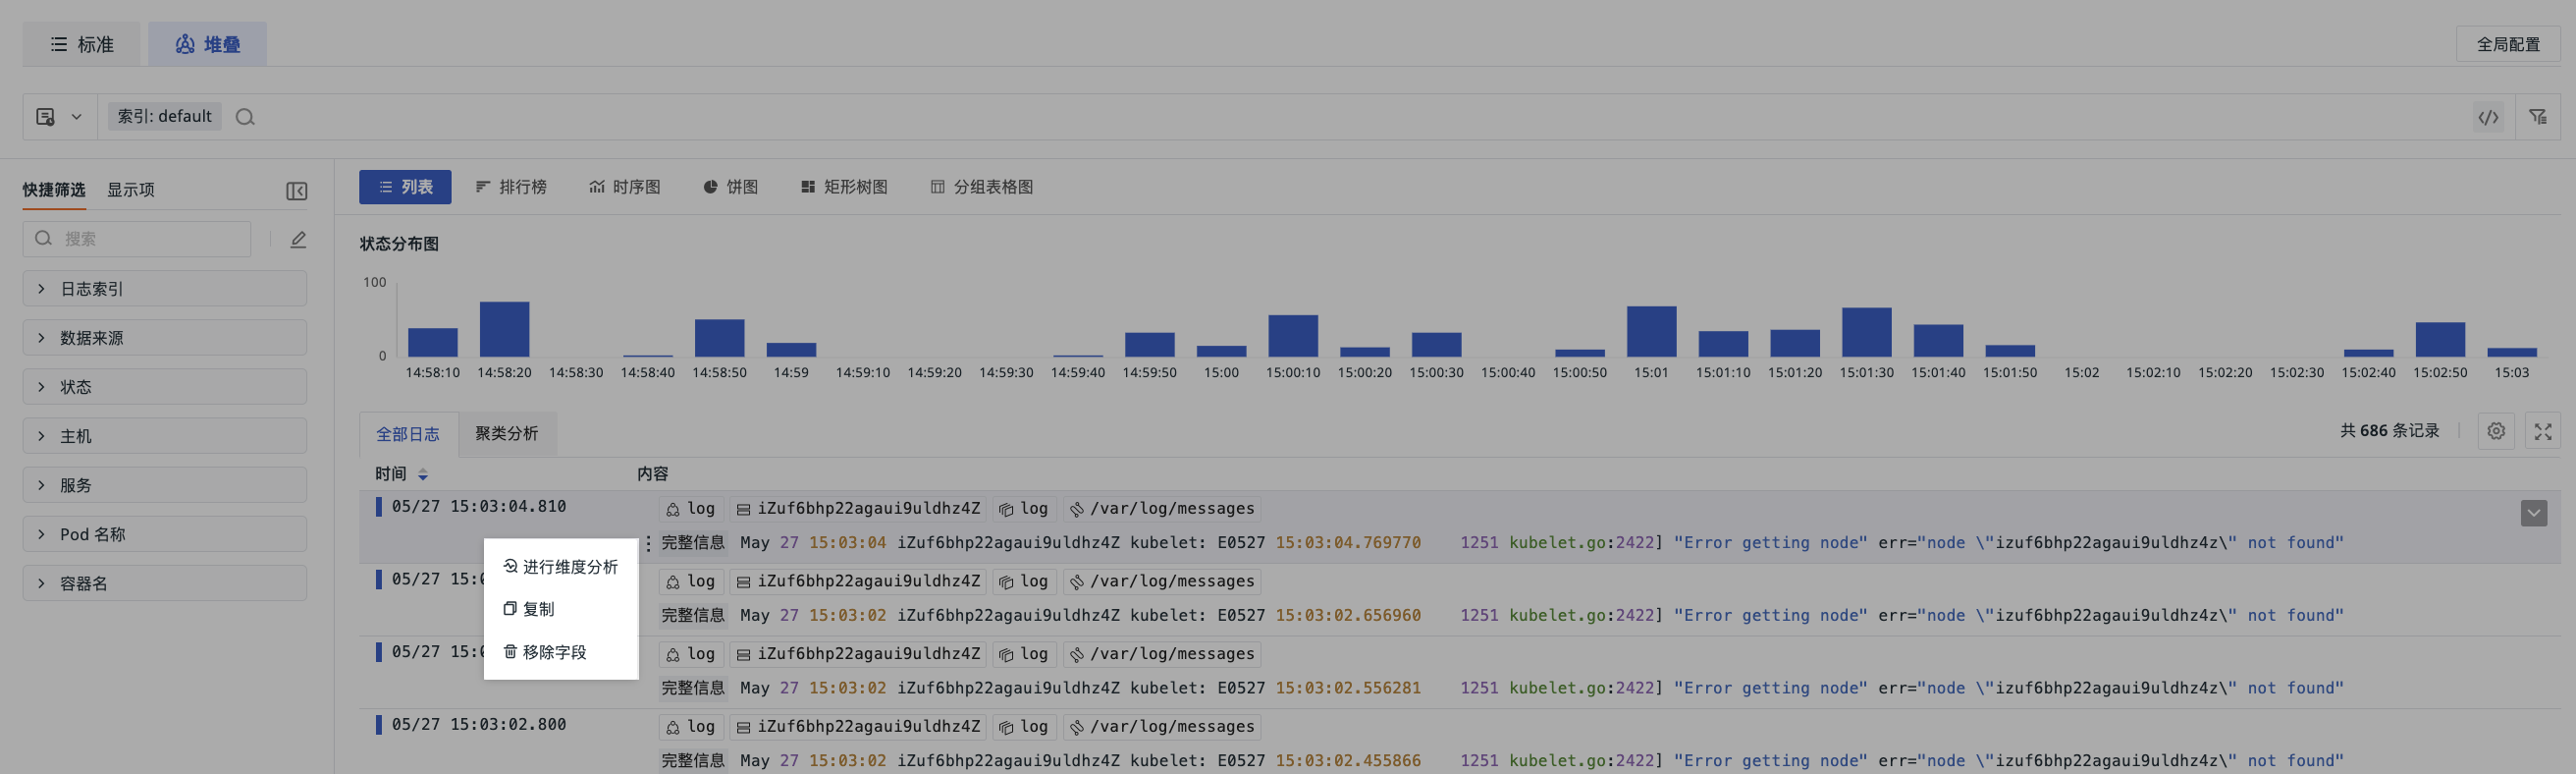
In Stacked mode, you can perform visual operations on specific fields:
If the field content is in JSON structure, the Stacked List supports hierarchical expansion for viewing. You can configure the default expansion method for JSON fields in Preferences, including not expanding or fully expanding, to quickly locate fields within multi-level structures.
Chart
Based on the count, last, first, count_distinct operation modes, filter data under the by condition:
-
Top List
-
Time Series
-
Pie Chart
-
Treemap
-
Grouped Table Chart
Data Display
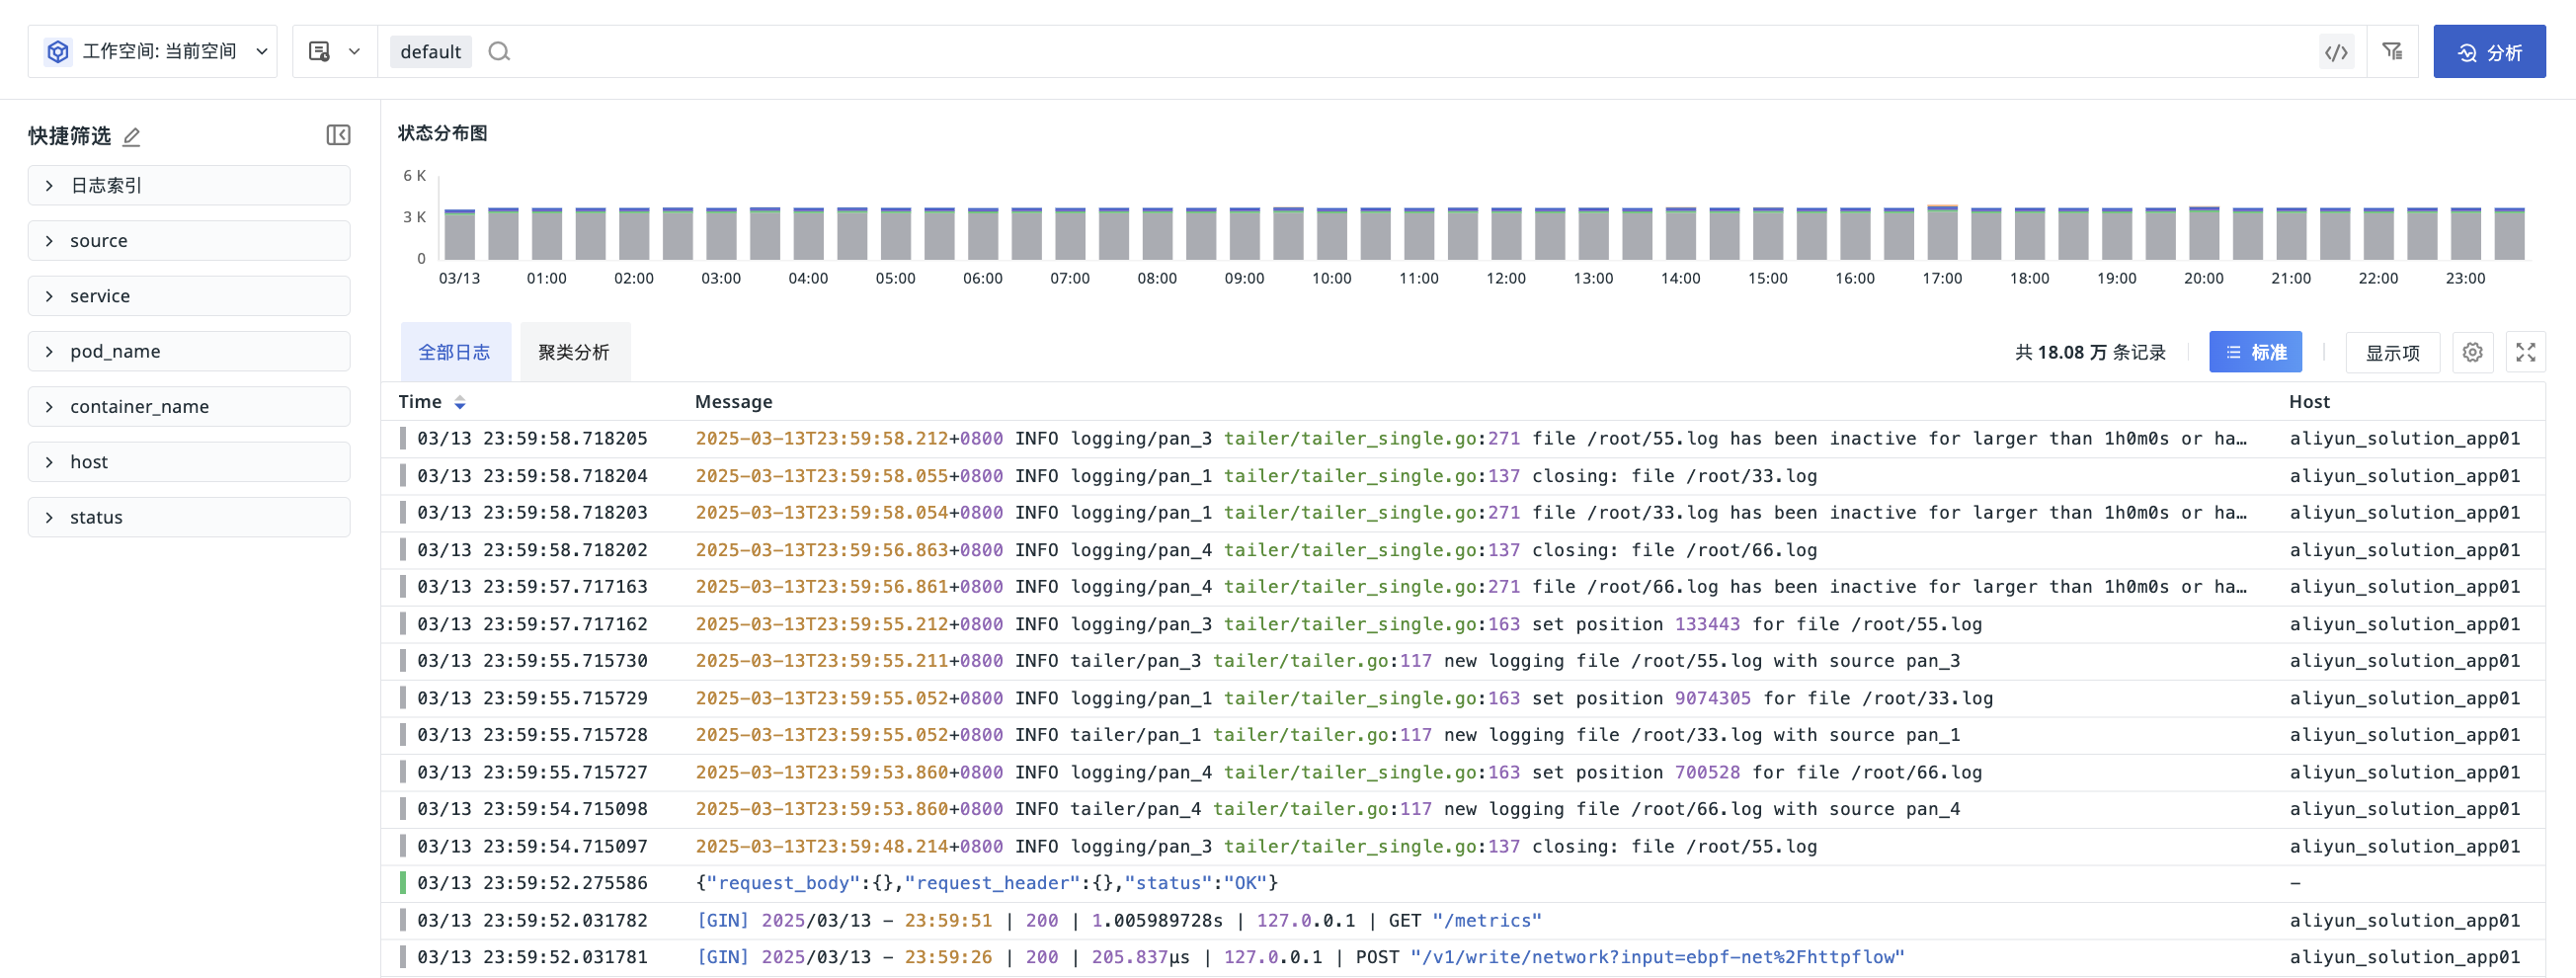
All Logs
Displays the collected raw log data.
Line Break
In Stacked List mode, if a single log entry contains many data information elements, clicking the "Line Break" button allows the message part of the log to be displayed independently.
Pattern
The Log Explorer provides efficient clustering functionality, which can perform similarity analysis on logs based on the message field and automatically display the most recent 50 logs. You can also customize the clustering field. After selecting a time range in the Time Widget, the system analyzes 10,000 logs within that period, aggregating similar entries.
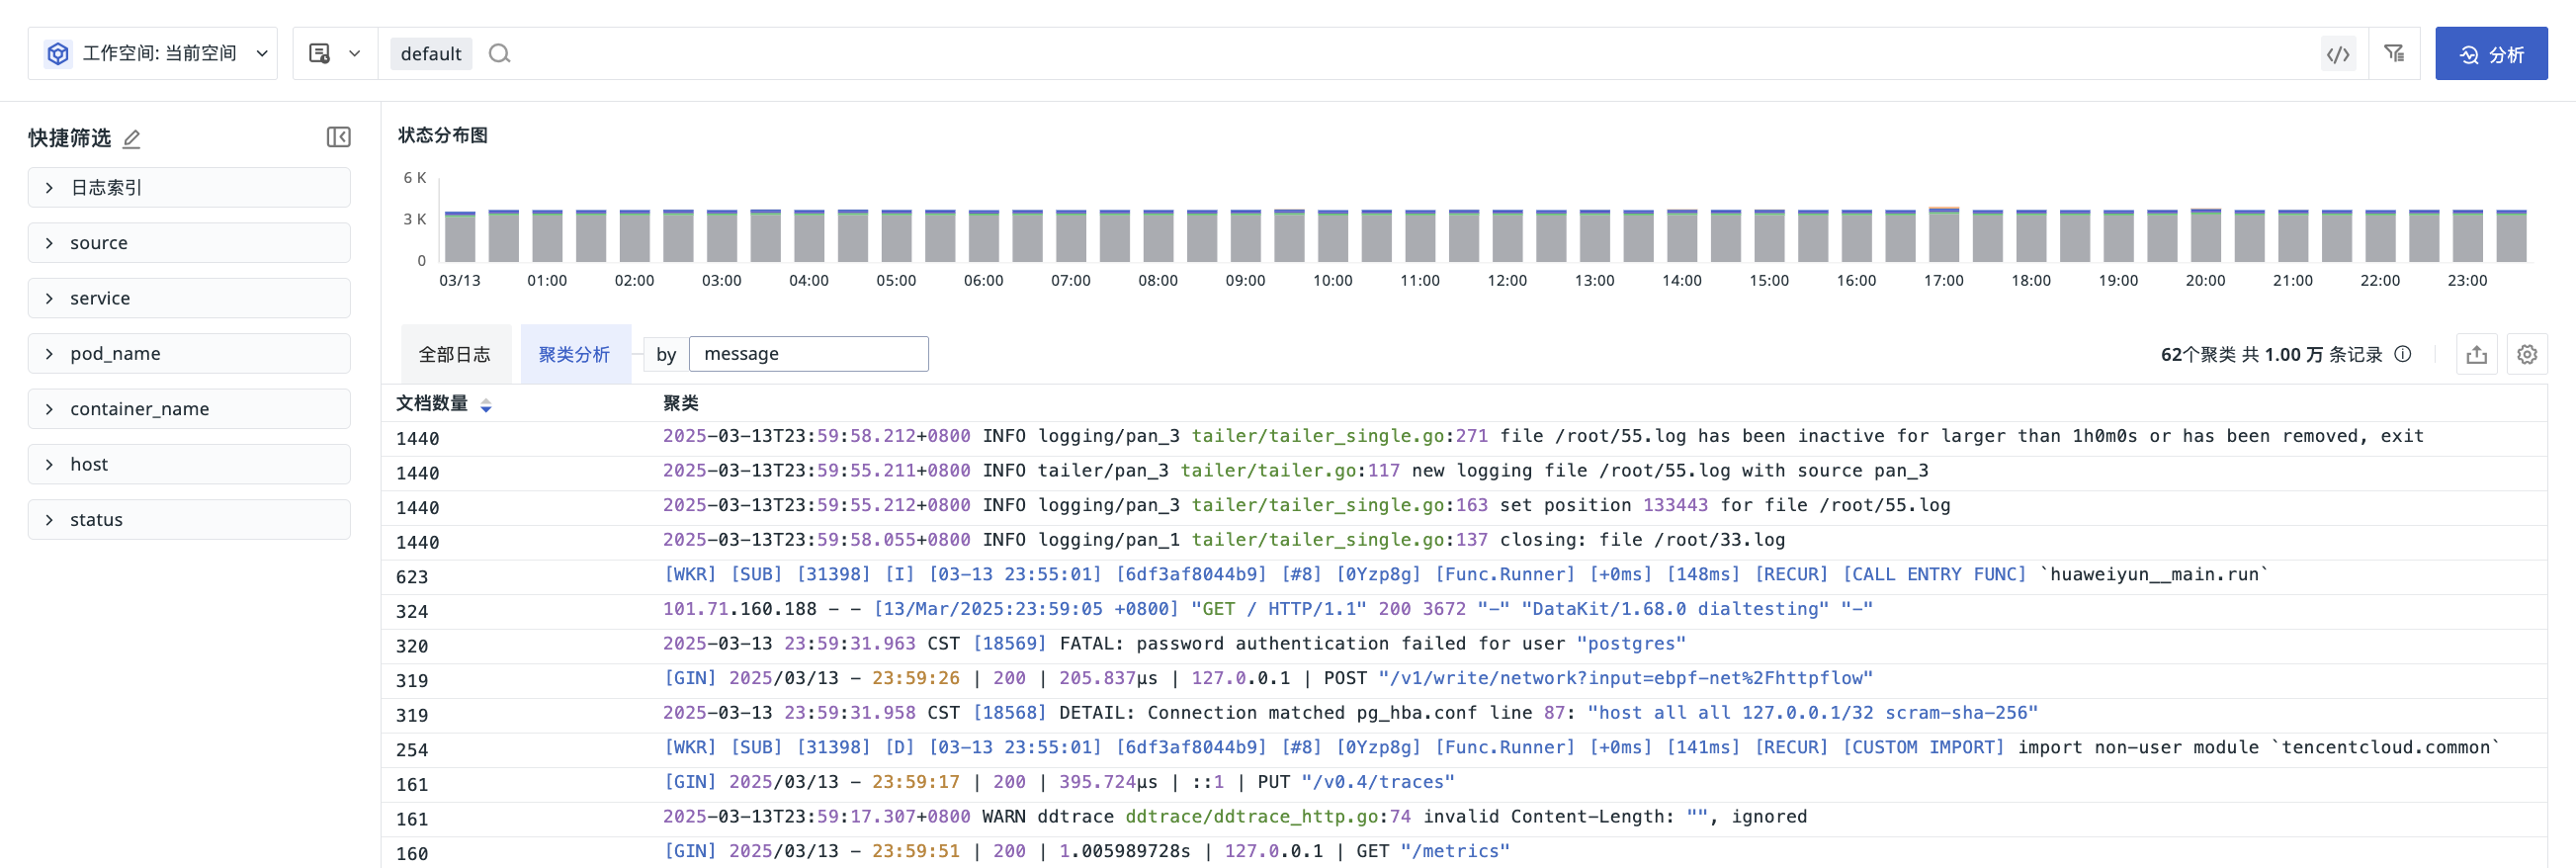
In the Pattern list, you can manage the data through the following operations:
-
Click & to sort by document count (default is descending order);
-
Click to choose to display 1 line, 3 lines, 10 lines, or all content;
-
Click to export all clustered log data.