Tracing
For business organizations deploying services in distributed systems, serverless computing, and containerized environments, Guance's Application Performance Monitoring (APM) helps teams gain real-time insight into performance-impacting issues, such as application outages or unresponsive services. It also provides end-to-end visibility to ensure comprehensive understanding of performance problems. However, improper management of tracing costs can lead to data gaps, prolonged issue resolution times, and even amplify minor issues, significantly impacting business operations.
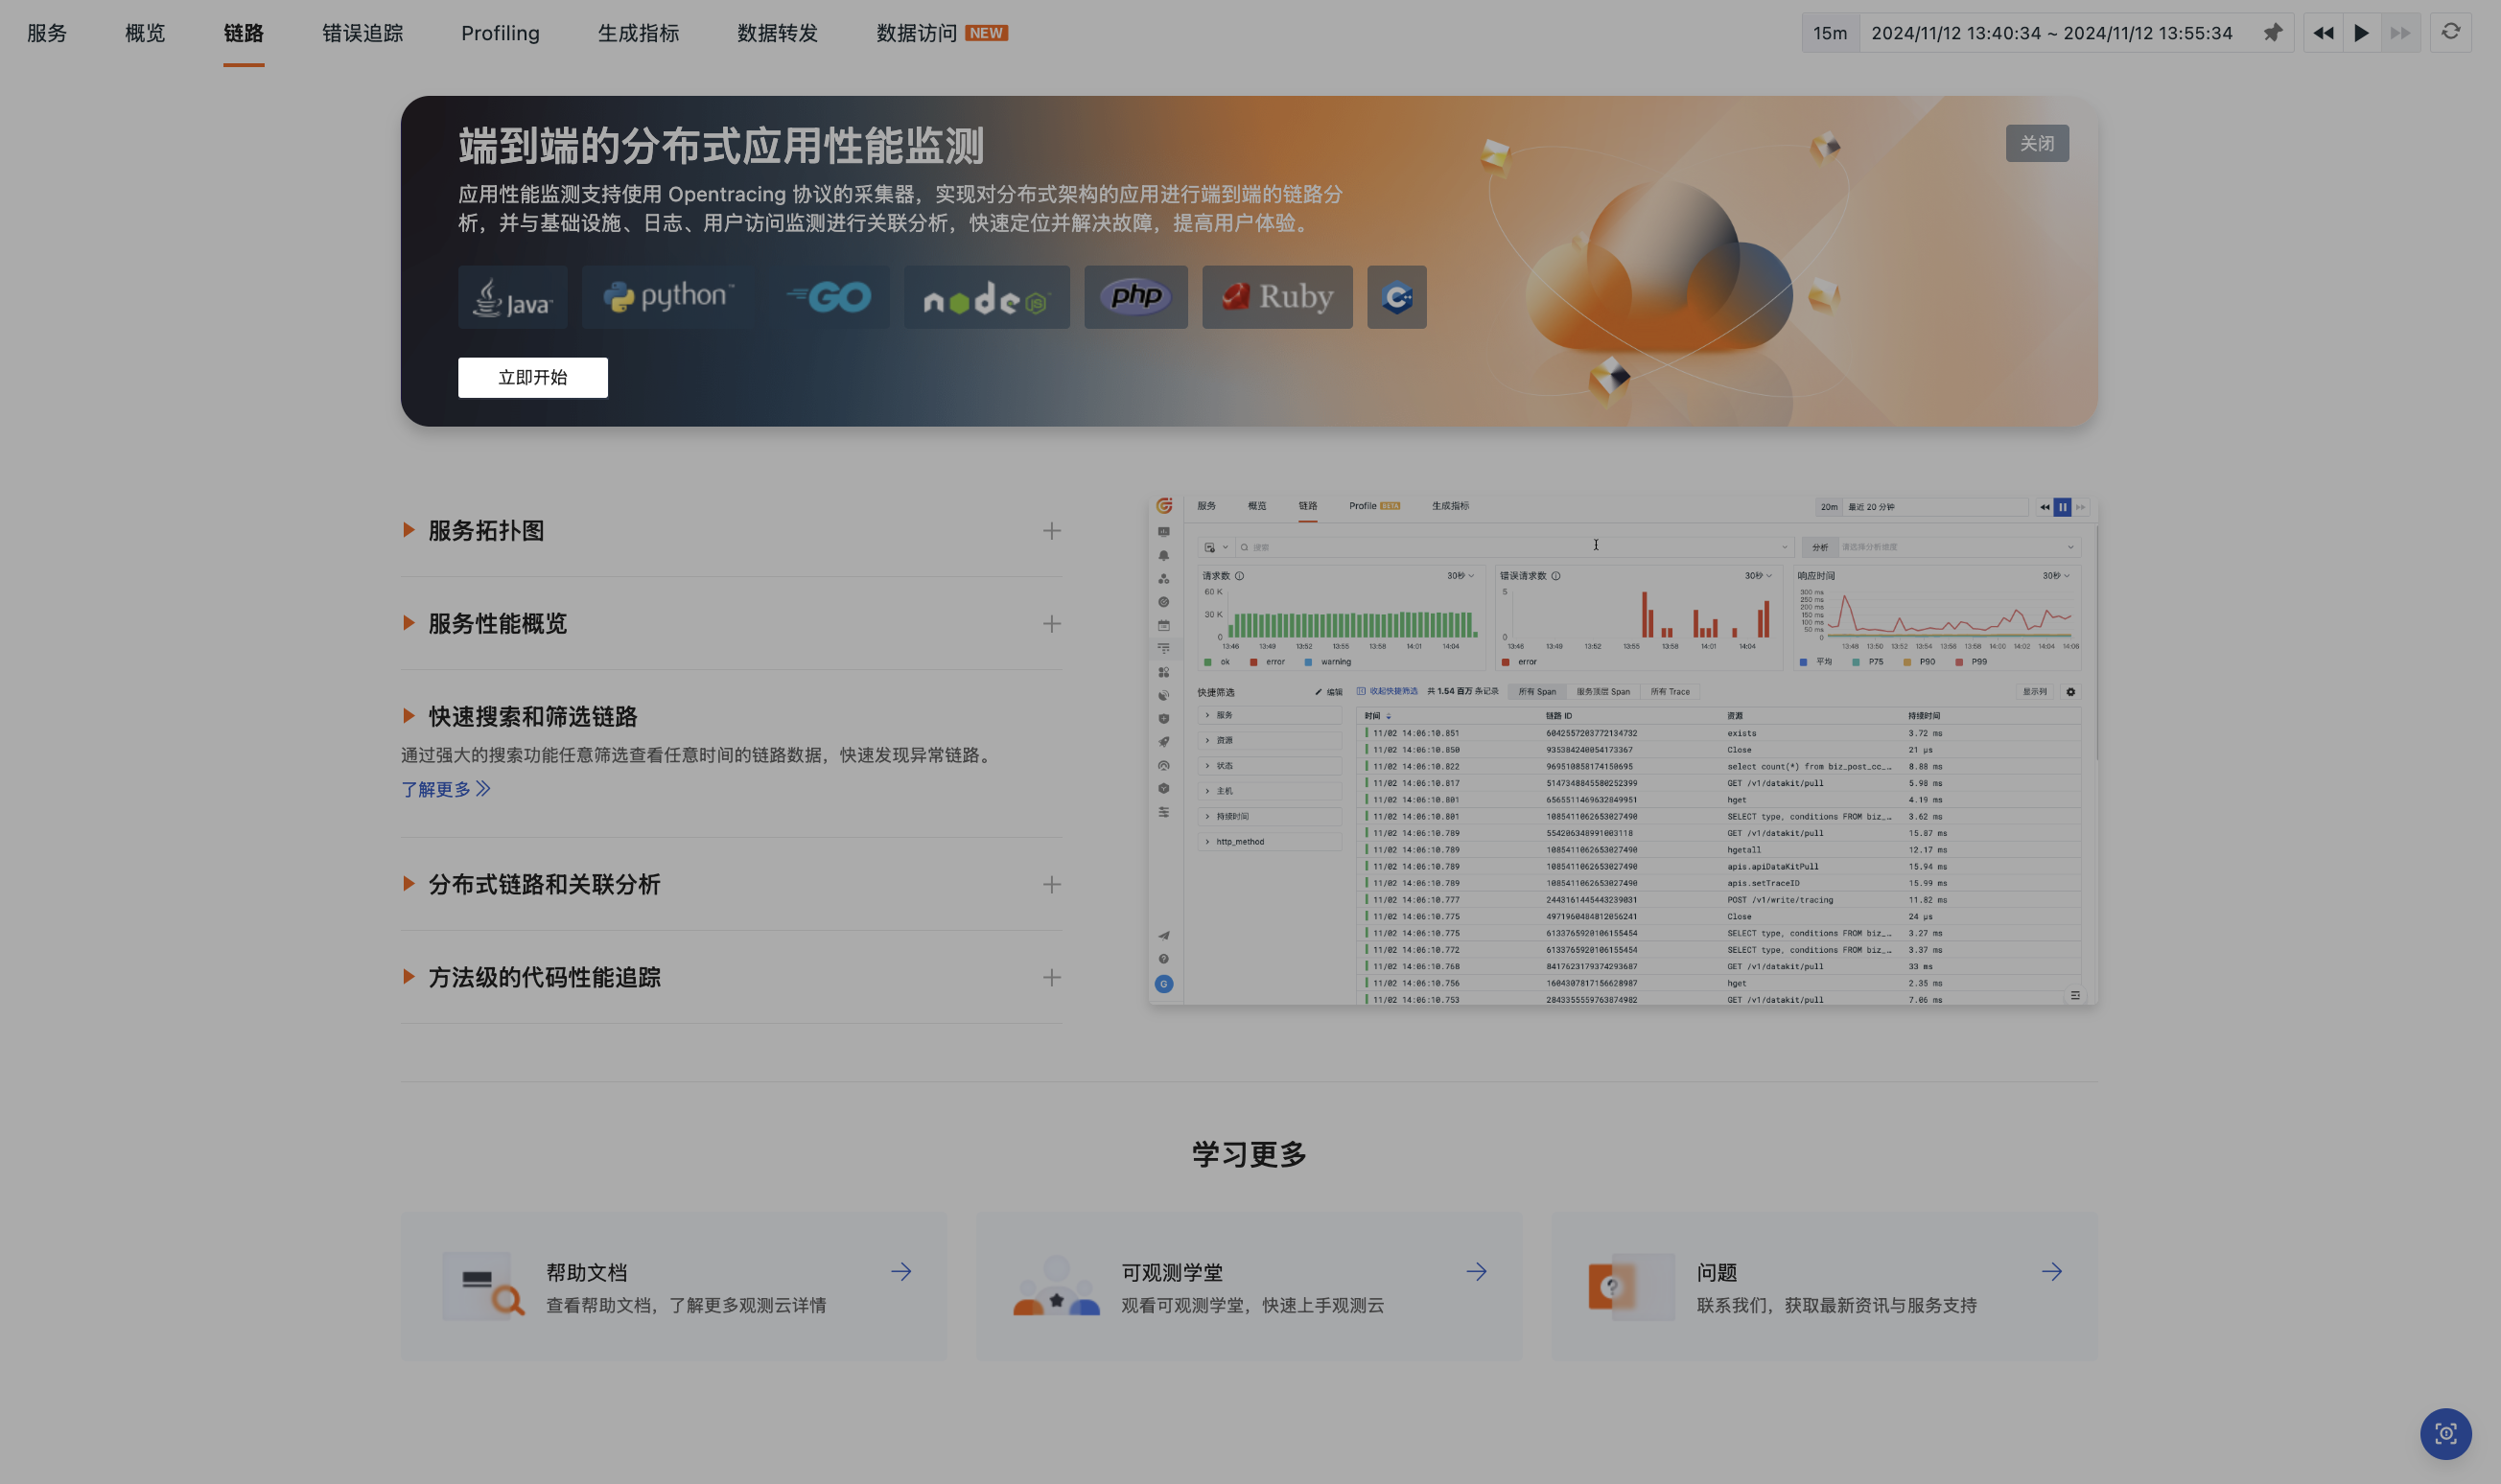
Guance's Application Performance Monitoring supports the Opentracing protocol, enabling end-to-end trace analysis for distributed architecture applications. It can also perform correlation analysis with infrastructure, logs, and Real User Monitoring (RUM). In APM > Tracing, you can search, filter, and export trace data, view trace details, and conduct comprehensive performance analysis using tools such as Flame Graphs, Span Lists, and Waterfall Charts. Whether dealing with synchronous or asynchronous calls, Guance clearly tracks every detail of trace performance data, ensuring you have complete and effective control over your trace data.
Before querying and analyzing data in the Tracing Explorer, please configure collection first.
Configure Collection
Enter the Tracing section, and you can start configuration using any of the following methods.
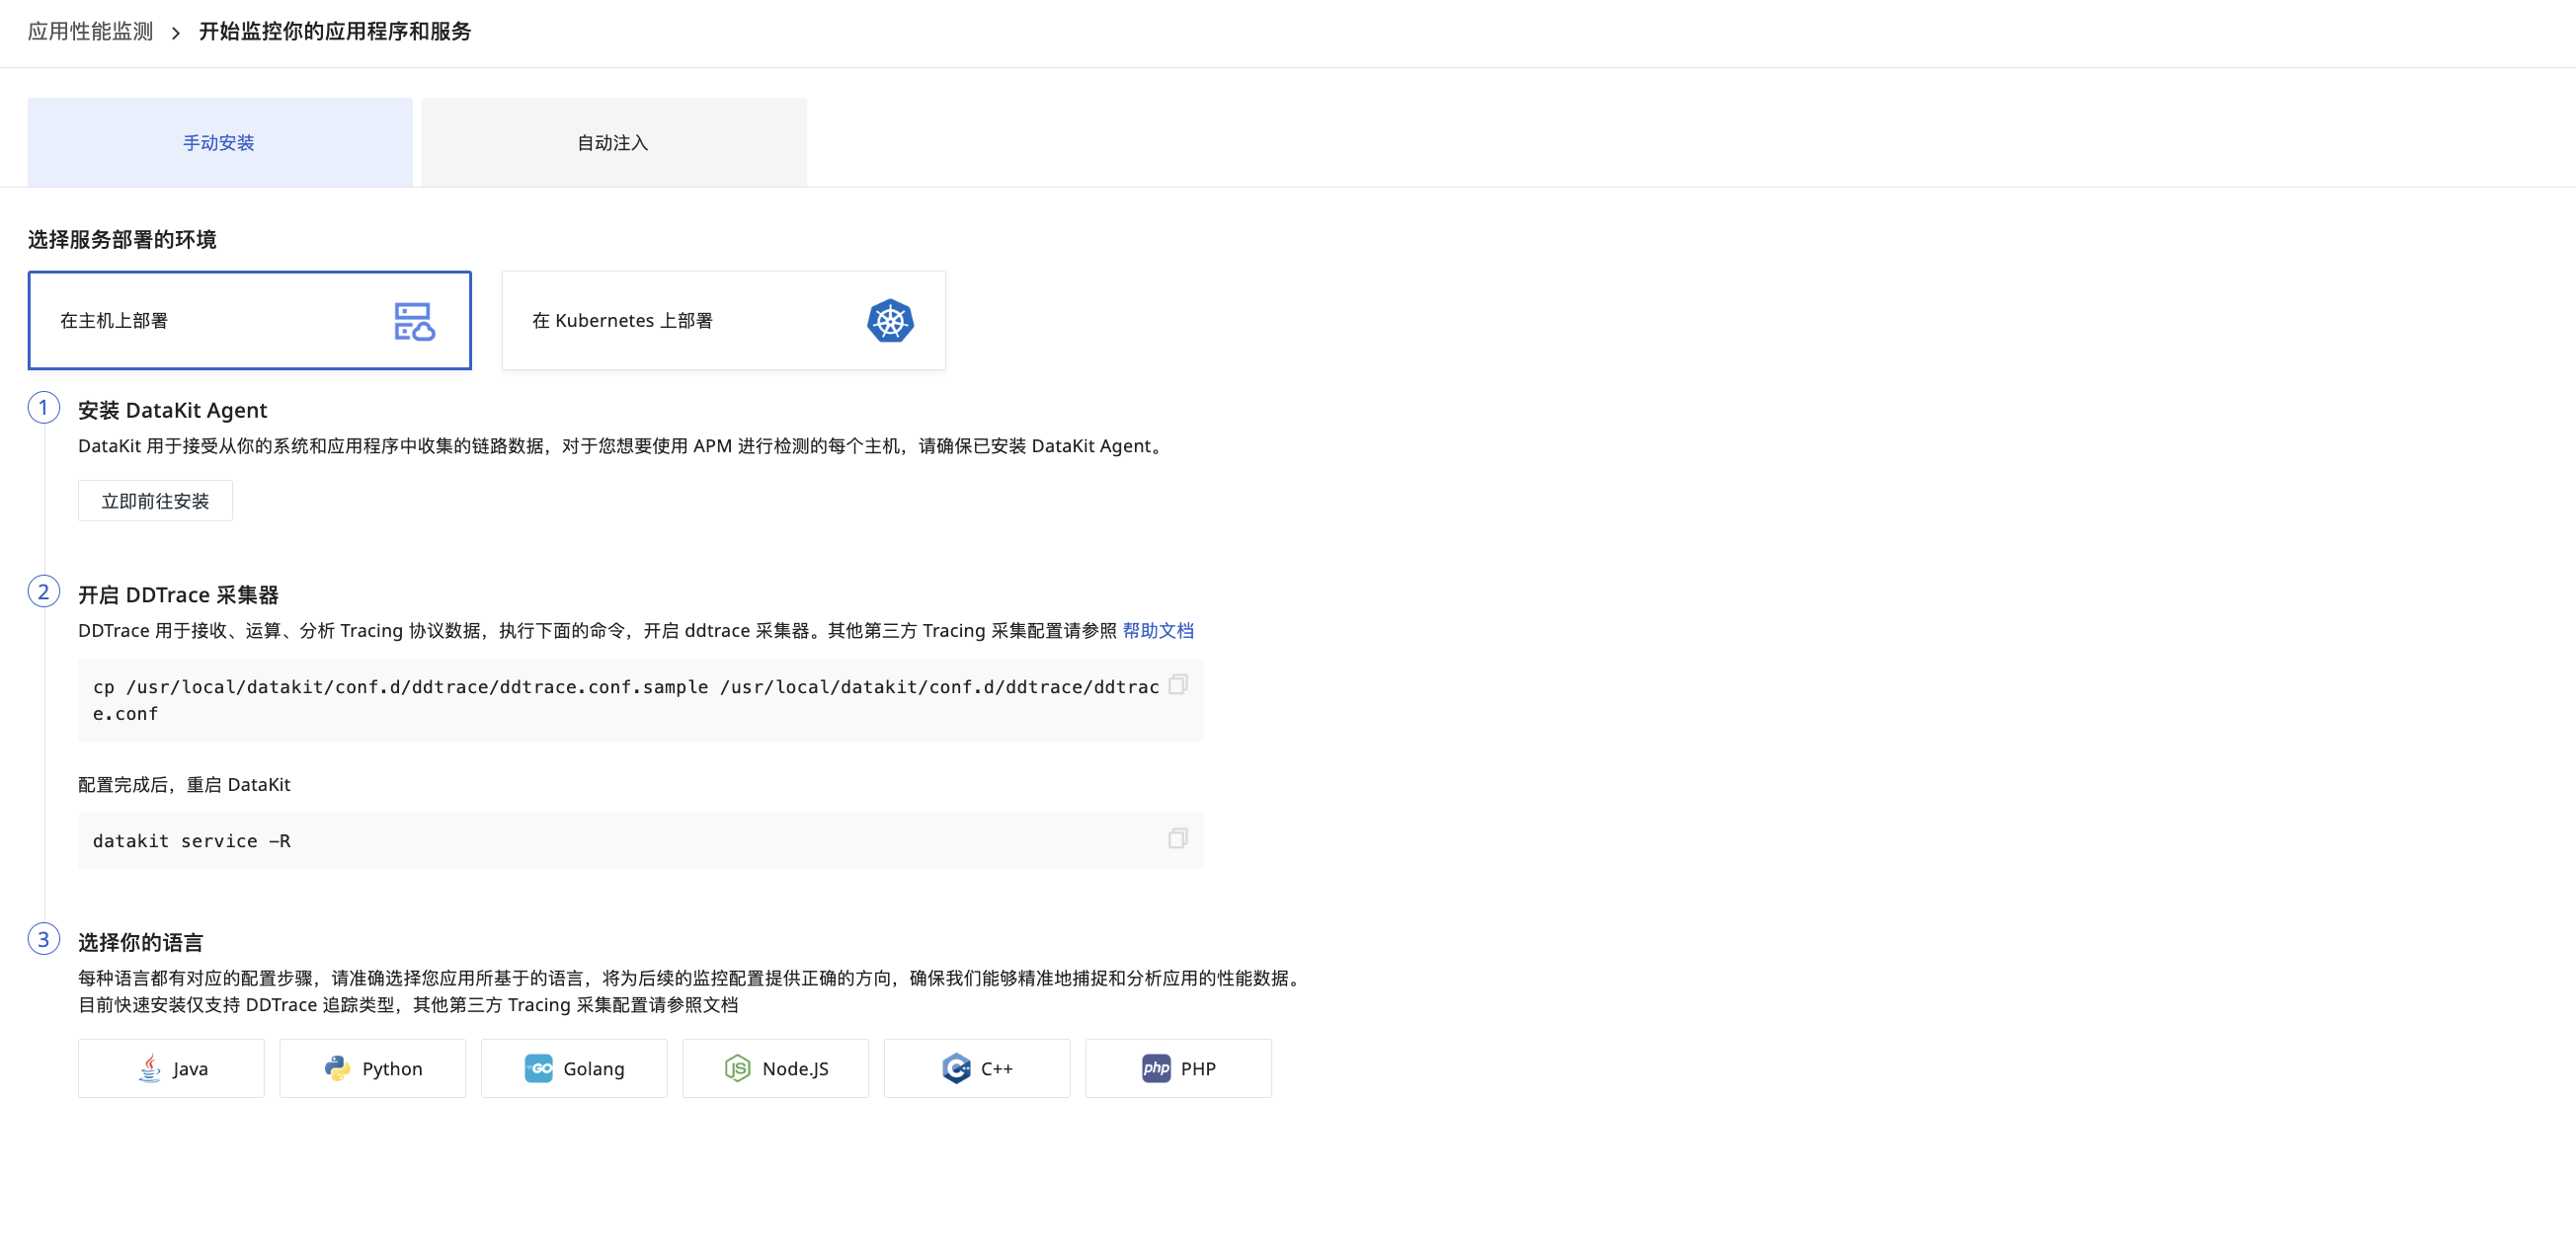
Manual Installation
Auto-injection
Datakit Operator is a collaborative project for Datakit's orchestration in Kubernetes. It assists Datakit in more convenient deployment, enabling automatic injection of DDTrace SDK (Java, Python, Node.js), Profiler, and more.
Analyze Collected Data
Once data collection is successful, you can directly analyze all related data in the Tracing Explorer.