How to Configure APM Sampling
The APM feature of Guance supports the analysis and management of trace data collected by collectors compliant with the Opentracing protocol. By default, APM data is collected in full, meaning every call generates data. Without restrictions, the volume of collected data can be substantial, consuming excessive storage. You can configure sampling to collect APM data, thereby saving storage space and reducing costs.
The following uses the DDtrace collector as an example to illustrate how to configure a 5% sampling rate for APM data.
Prerequisites
Sampling Configuration
Before starting to collect APM data, you need to configure DDtrace according to the specific programming language.
The following uses a common Flask webserver application in Python as an example to demonstrate how to sample APM data. In this example, SERVICE_A provides an HTTP service and calls the SERVICE_B HTTP service.
1. Install the DDtrace Runtime Environment
2. Install the Flask Package
3. Configure Sampling
Sampling Configuration Instructions
Create SERVICE_A and SERVICE_B. Configure a 5% sampling rate for SERVICE_A, while SERVICE_B collects data at the default rate.
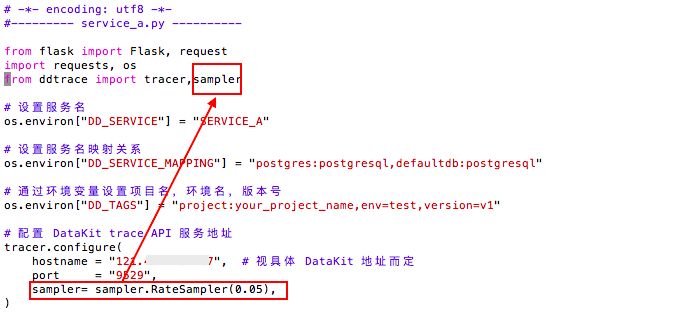
During creation, you need to import DDtrace, set the service name, configure service name mapping, set the project name, environment, and version via environment variables, and configure the DataKit trace API service address (the specific address depends on the DataKit address, and the port is 9529).
Refer to the Python Flask Complete Example.
1. SERVICE_A
# -*- encoding: utf8 -*-
#--------- service_a.py ----------

from flask import Flask, request
import requests, os
from ddtrace import tracer,sampler

# Set service name
os.environ["DD_SERVICE"] = "SERVICE_A"

# Set service name mapping
os.environ["DD_SERVICE_MAPPING"] = "postgres:postgresql,defaultdb:postgresql"

# Set project name, environment, version via environment variables
os.environ["DD_TAGS"] = "project:your_project_name,env=test,version=v1"

# Configure DataKit trace API service address
tracer.configure(
    hostname = "localhost",  # Depends on the specific DataKit address
    port     = "9529",
    sampler  = sampler.RateSampler(0.05),
)

app = Flask(__name__)

def shutdown_server():
    func = request.environ.get('werkzeug.server.shutdown')
    if func is None:
        raise RuntimeError('Not running with the Werkzeug Server')
    func()

@app.route('/a',  methods=['GET'])
def index():
    requests.get('http://127.0.0.1:54322/b')
    return 'OK', 200

@app.route('/stop',  methods=['GET'])
def stop():
    shutdown_server()
    return 'Server shutting down...\n'

# Start service A: HTTP service starts on port 54321
if __name__ == '__main__':
    app.run(host="0.0.0.0", port=54321, debug=True)
Example:
2. SERVICE_B
# -*- encoding: utf8 -*-

#--------- service_b.py ----------

from flask import Flask, request
import os, time, requests
from ddtrace import tracer

# Set service name
os.environ["DD_SERVICE"] = "SERVICE_B"

# Set service name mapping
os.environ["DD_SERVICE_MAPPING"] = "postgres:postgresql,defaultdb:postgresql"

# Set project name, environment, version via environment variables
os.environ["DD_TAGS"] = "project:your_project_name,env=test,version=v1"

tracer.configure(
    hostname = "localhost",  # Depends on the specific DataKit address
    port="9529",
)

app = Flask(__name__)

def shutdown_server():
    func = request.environ.get('werkzeug.server.shutdown')
    if func is None:
        raise RuntimeError('Not running with the Werkzeug Server')
    func()

@app.route('/b',  methods=['GET'])
def index():
    time.sleep(1)
    return 'OK', 200

@app.route('/stop',  methods=['GET'])
def stop():
    shutdown_server()
    return 'Server shutting down...\n'

# Start service B: HTTP service starts on port 54322
if __name__ == '__main__':
    app.run(host="0.0.0.0", port=54322, debug=True)
4. Start and Call SERVICE_A and SERVICE_B
# Start both services in the background:
(ddtrace-run python3 service_a.py &> a.log &)
(ddtrace-run python3 service_b.py &> b.log &)

# Call service A, prompting it to call service B, thus generating corresponding trace data (you can execute this multiple times to trigger)
curl http://localhost:54321/a

# Stop both services
curl http://localhost:54321/stop
curl http://localhost:54322/stop
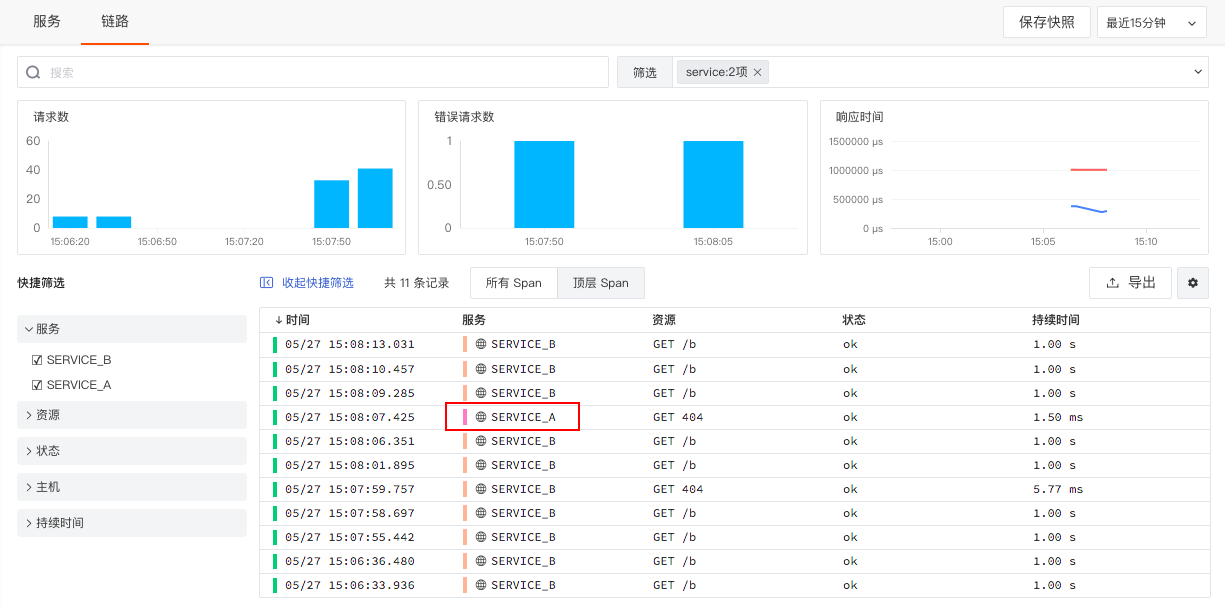
5. View the Effect in the Guance Workspace
Log in to your Guance workspace to view the collected trace data for SERVICE_A and SERVICE_B.
Warning
APM sampling is based on traces. If there are 100 traces and the sampling rate is set to 5%, it will randomly collect 5% of them, meaning 5 traces and all their underlying Spans are randomly reported to the Guance workspace.
In this example, SERVICE_A provides an HTTP service and calls the SERVICE_B HTTP service, meaning a call from Service A to Service B constitutes one trace. Assuming there are 100 such traces, 5 of them are randomly reported.
Further Reading
- The above method configures the APM sampling rate on the client side. Alternatively, you can configure the sampling rate directly through DataKit by enabling the sampling option in the APM collector configuration.
  ## Sampler config uses to set global sampling strategy.
  ## sampling_rate used to set global sampling rate.
  [inputs.tracer.sampler]
    sampling_rate = 1.0
- After configuring APM sampling, important traces might be missed. You can configure filters to ensure critical traces are reported. For example, configuring
keep_rare_resource = truewill directly report traces judged to be rare to Guance.