CI Explorer
Guance supports visualization of the process and results of CI built into Gitlab/Jenkins. You can directly view CI results from Gitlab/Jenkins through Guance's CI visualization feature, gaining real-time insights into your CI performance, execution time trends, and failure reasons. Through the CI flame graph, you can view the health status of the entire Pipeline chain during the CI process in real-time, helping to ensure code update reliability.
Data Query and Analysis
After CI process and result data is reported to the Guance Workspace, you can query and analyze Pipeline and Job success rates, failure reasons, specific failure points, etc., in the CI Explorer by selecting time ranges, searching for keywords, and applying filters.
Time Widget
The CI Explorer displays data from the last 15 minutes by default. Using the "Time Widget" in the upper right corner, you can select the time range for data display. For more details, refer to the document Time Widget Description.
Search and Filter
In the CI Explorer search bar, various search methods are supported, including keyword search, wildcard search, associative search, JSON search, etc. Filtering by tag/attribute values is also supported, including positive filtering, negative filtering, fuzzy matching, negative fuzzy matching, Exist and Not exist, among others. For more on search and filtering, refer to the document Explorer Search and Filter.
Analysis Mode
In the CI Explorer analysis bar, multi-dimensional analysis and statistics based on 1-3 tags are supported to reflect the distribution characteristics and trends of data across different dimensions over time. Guance supports various data chart analysis methods, including Time Series, Top List, Pie Chart, and Treemap. For more details, refer to the document Explorer Analysis Mode.
Quick Filter
In the CI Explorer Quick Filter, you can edit the "Quick Filter" and add new filter fields. After adding, you can select their field values for quick filtering.
Note:
- The default minimum and maximum values of the "Duration" progress bar in the Quick Filter are the smallest and largest durations in the trace data list.
- Dragging the progress bar to adjust the max/min values is supported; the values in the input boxes change synchronously.
- Manually entering max/min values is supported; press "Enter" or "click outside the input box" to perform the filter search.
- The input box turns red for incorrect formats, and the search is not performed. Correct format: pure "number" or "number + ns/μs/ms/s/min".
- If no unit is entered for the search, "s" is appended to the input number by default, and the filter search is performed.
- If a unit is manually entered, the search is performed directly.
For more on Quick Filter, refer to the document Quick Filter.
Custom Display Columns
In the Explorer list, you can customize adding, editing, deleting, and dragging display columns via "Display Columns". When hovering over an Explorer display column, click the "Settings" button to perform operations on the display column, such as ascending order, descending order, move column left, move column right, add column left, add column right, replace column, add to quick filter, add to group, remove column, etc. For more on custom display columns, refer to the document Display Columns Description.
Data Export
In the Explorer list, you can first filter the desired data and then export it for viewing and analysis. Click the "Settings" icon to export to CSV file, Dashboard, and Note.
Gitlab
Pipeline Explorer
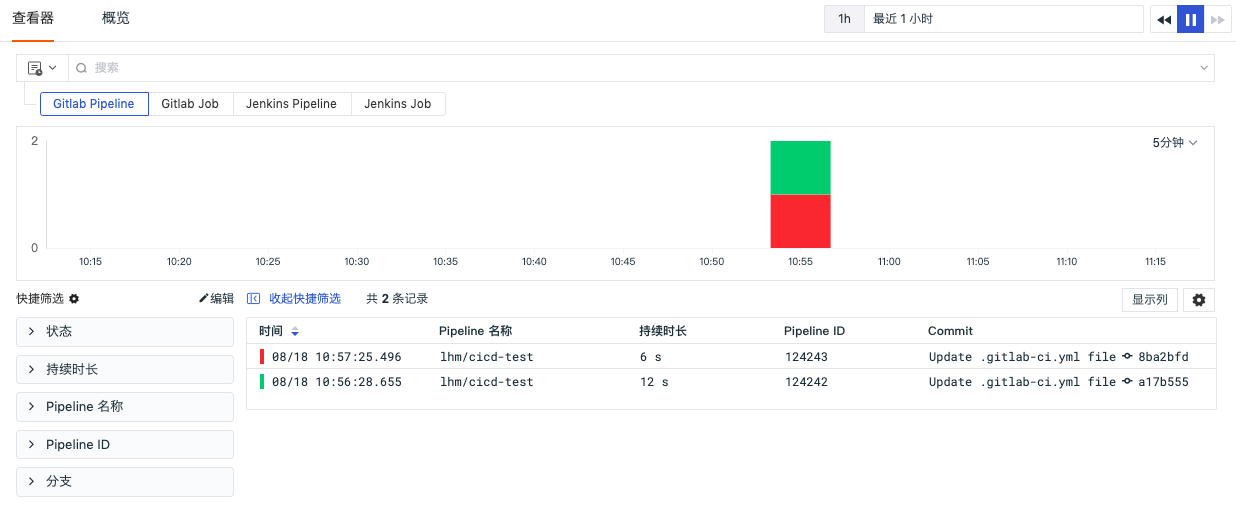
In the upper left corner of the Explorer, you can switch to the "Gitlab Pipeline" Explorer to query and analyze the CI Pipeline process, including Pipeline ID, name, duration, commit content, commit time, etc.
Pipeline Details Page
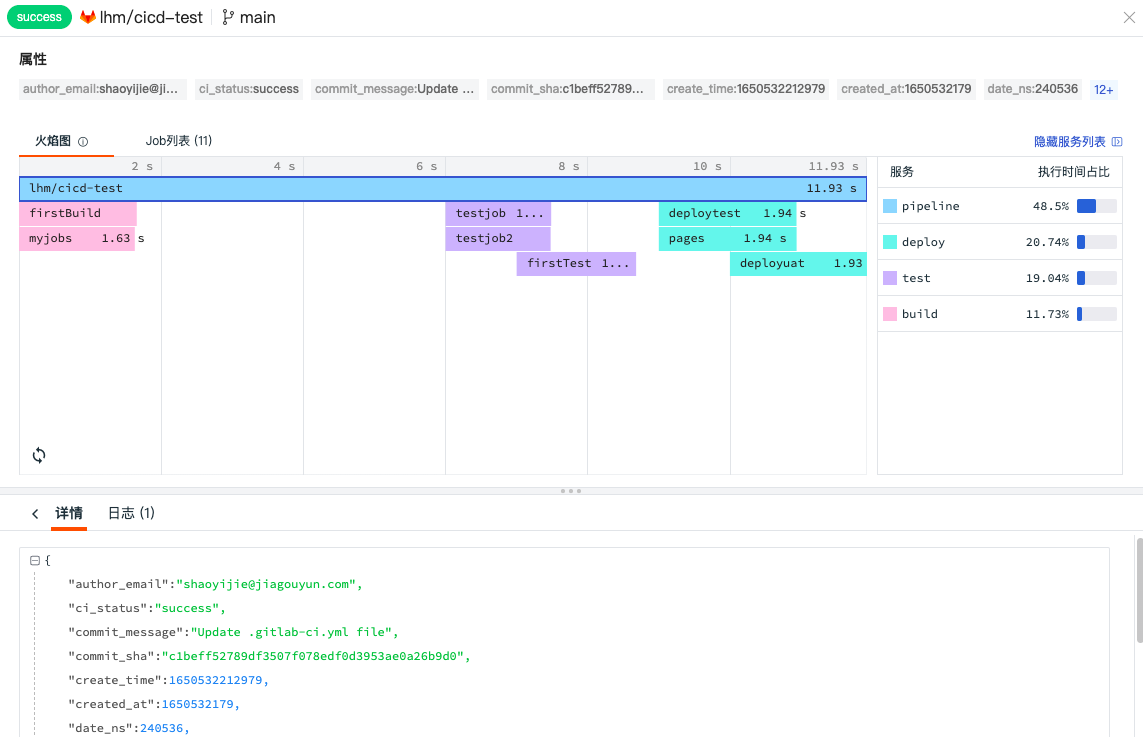
Click on the data you need to view in the Pipeline list. A details panel slides out displaying Pipeline and Job details, including attributes, flame graph, Job list, content details, and associated logs.
When clicking on an attribute field, options for "Filter field value", "Exclude field value", "Add to display columns", and "Copy" are supported for quick filtering and viewing.
- "Filter field value": Adds this field to the Explorer to view all data related to this field.
- "Exclude field value": Adds this field to the Explorer to view all data except that related to this field.
- "Add to display columns": Adds this field to the Explorer list for viewing.
- "Copy": Copies this field to the clipboard.
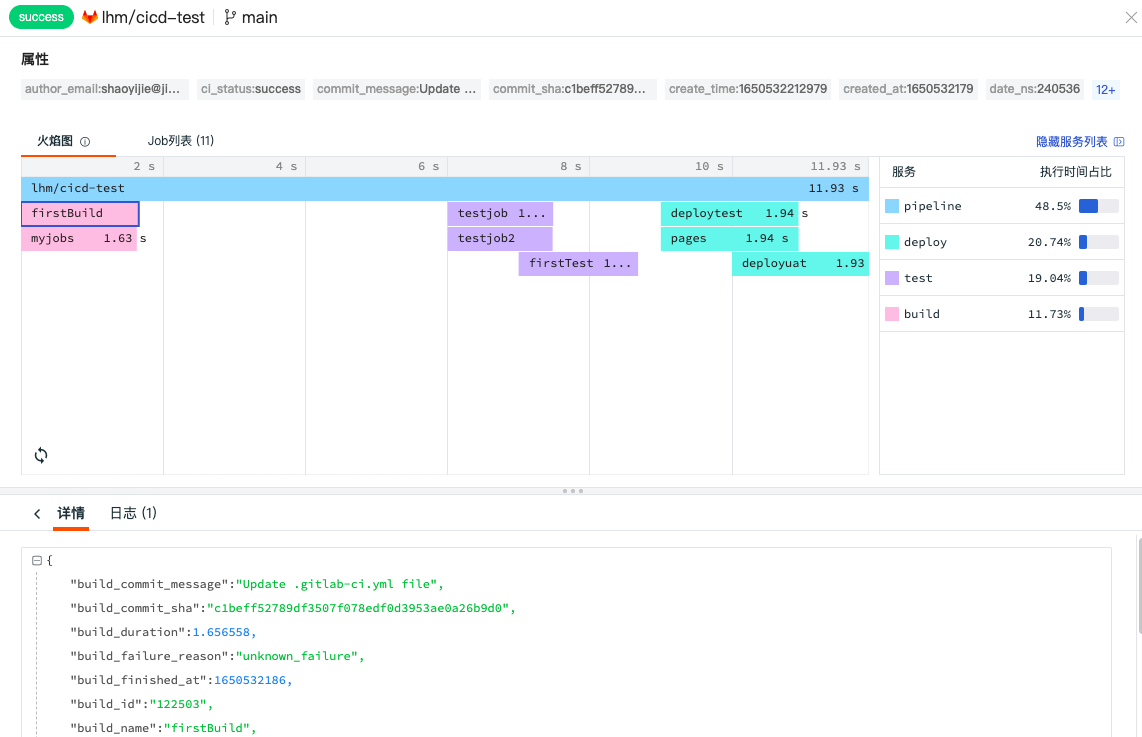
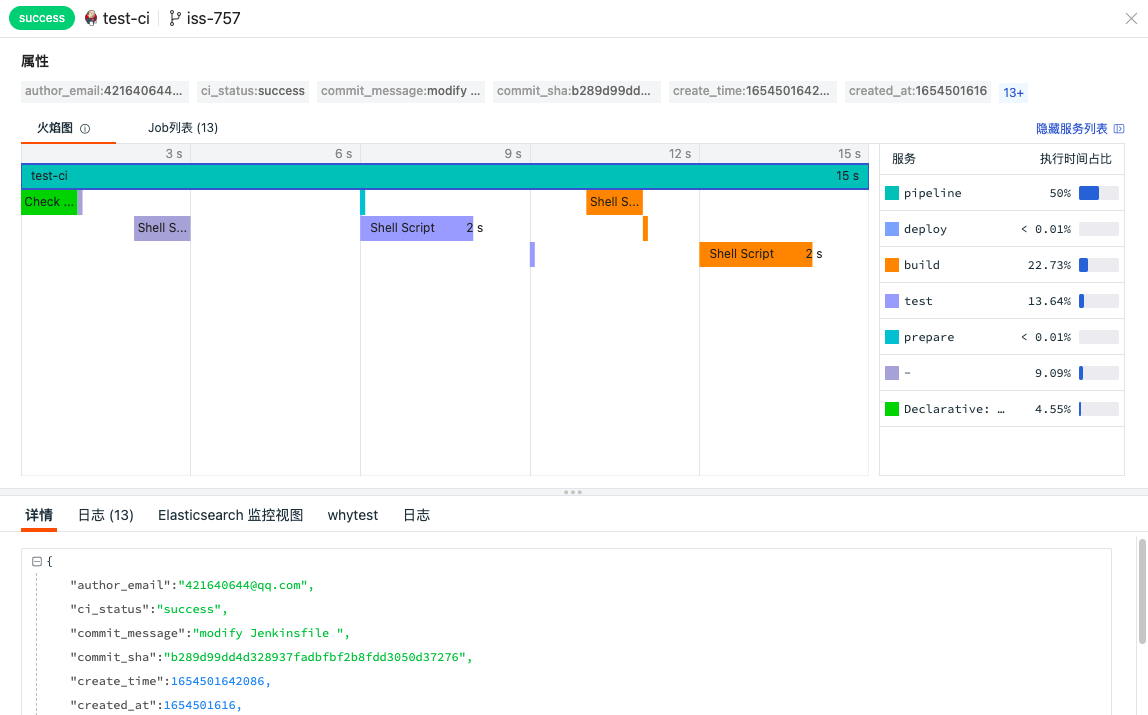
Flame Graph
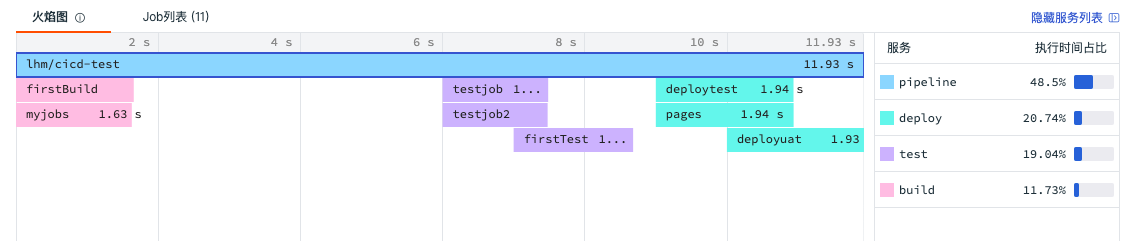
The flame graph clearly displays the flow and execution time of each Job in the entire Pipeline chain during the CI process. You can view the corresponding service list and execution time percentage on the right side of the flame graph. Click on a pipeline or job in the flame graph to view the corresponding Json content in the "Details" section.
Flame Graph Description
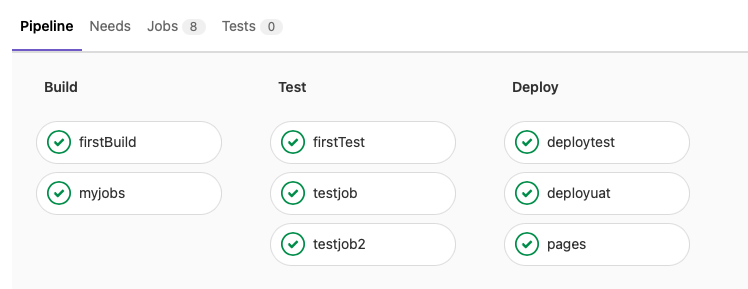
CI visualization primarily collects data from the Pipeline and Job processes during CI. The entire Pipeline process is divided into Build, Test, and Deploy stages. Each stage has different Jobs.
- When all Jobs in each stage are completed normally, the Pipeline is successfully executed. The flame graph lists the total execution time of the Pipeline and the execution time of each Job.
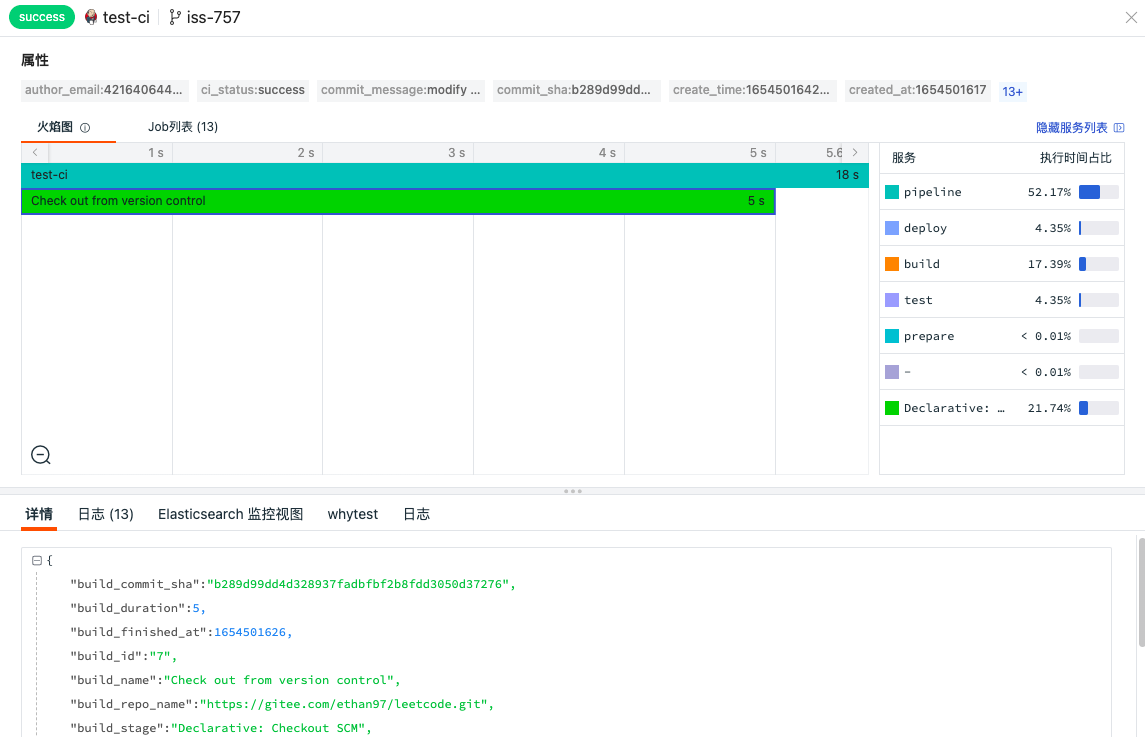
- If a Job in the first stage (Build) encounters an error, a task failure and the error reason will be prompted.
For easier understanding, the following diagram is an example of a Gitlab CI Pipeline process. Comparing it with the flame graph above, we can clearly see the execution time of each Job and the total execution time of the entire Pipeline.
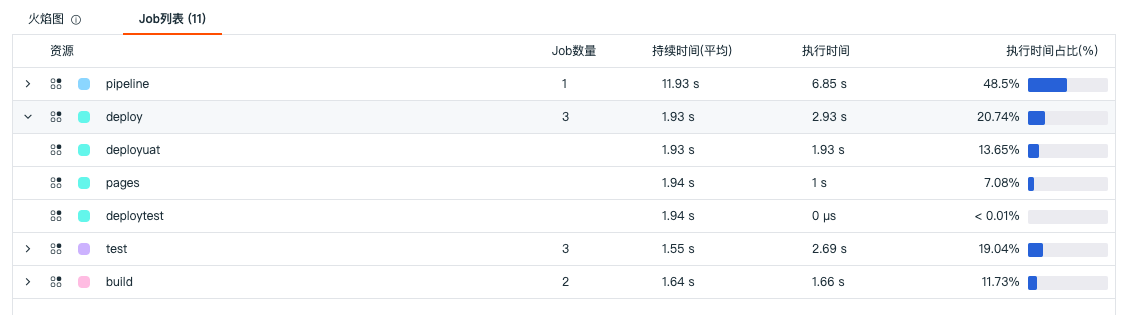
Job List
Displays all stages in the entire Pipeline chain and their Job counts, including "Resource Name", "Job Count", "Execution Time", and "Execution Time Percentage". Click on any Job to view the corresponding Json content in the "Details" section. If there is an error, an error prompt is displayed before the Job.
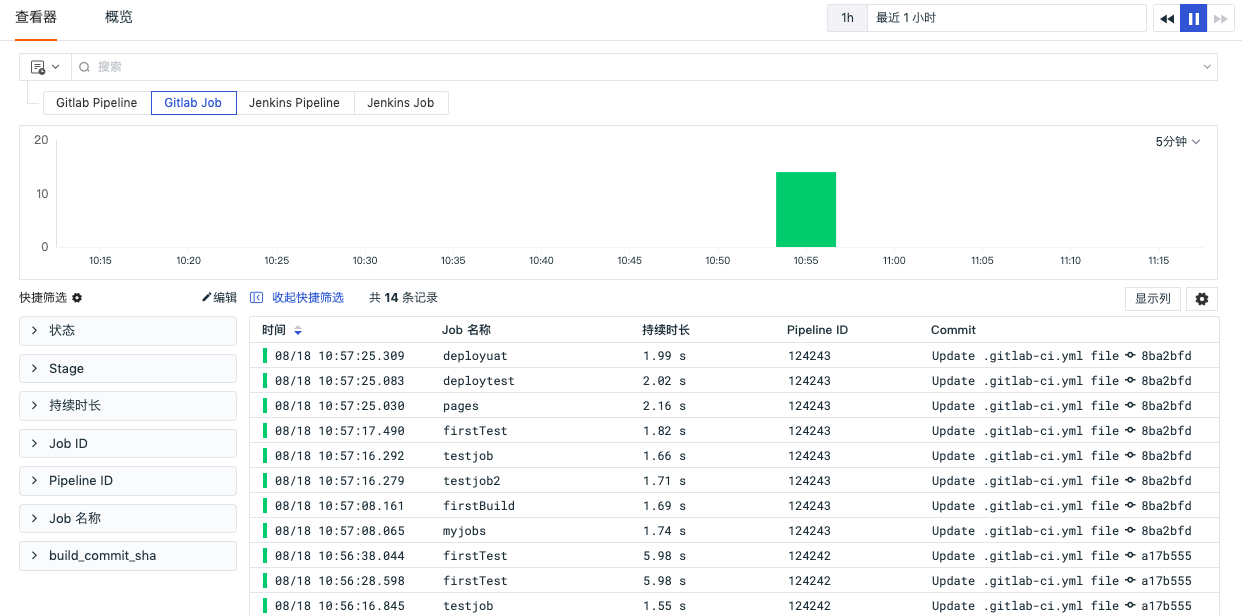
Job Explorer
In the upper left corner of the Explorer, you can switch to the "Gitlab Job" Explorer to query and analyze the Job process of the CI Pipeline, including Pipeline ID, Job name, duration, commit content, commit time, etc.
Job Details Page
Click on the data you need to view in the Job list. A details panel slides out displaying Pipeline and Job details, including attributes, flame graph, Job list, content details, and associated logs.
Jenkins
Pipeline Explorer
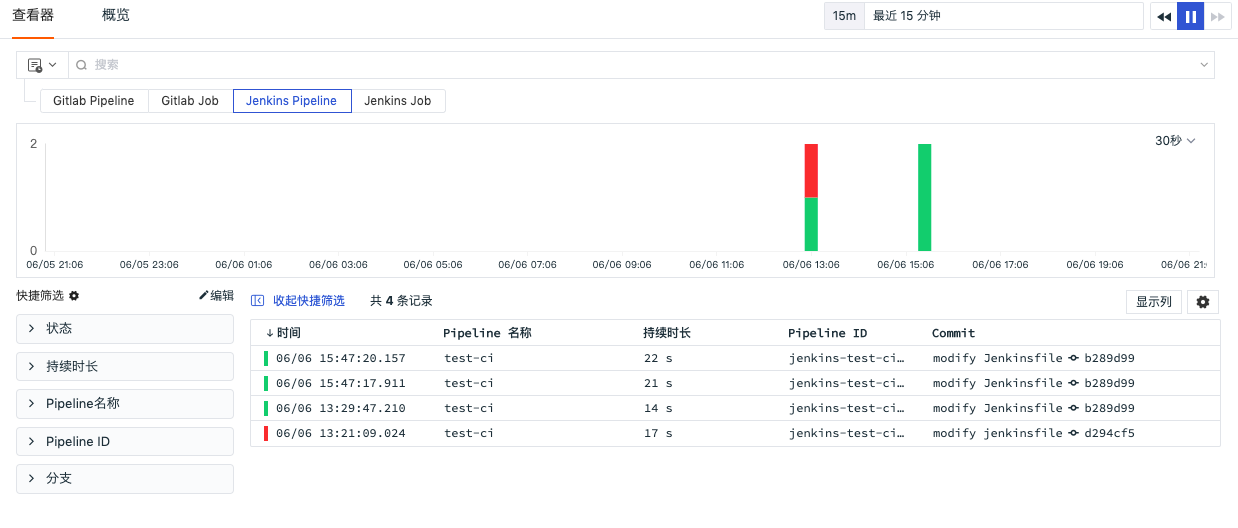
In the upper left corner of the Explorer, you can switch to the "Jenkins Pipeline" Explorer to query and analyze the CI Pipeline process, including Pipeline ID, name, duration, commit content, commit time, etc.
Pipeline Details Page
Click on the data you need to view in the Pipeline list. A details panel slides out displaying Pipeline and Job details, including attributes, flame graph, Job list, content details, and associated logs.
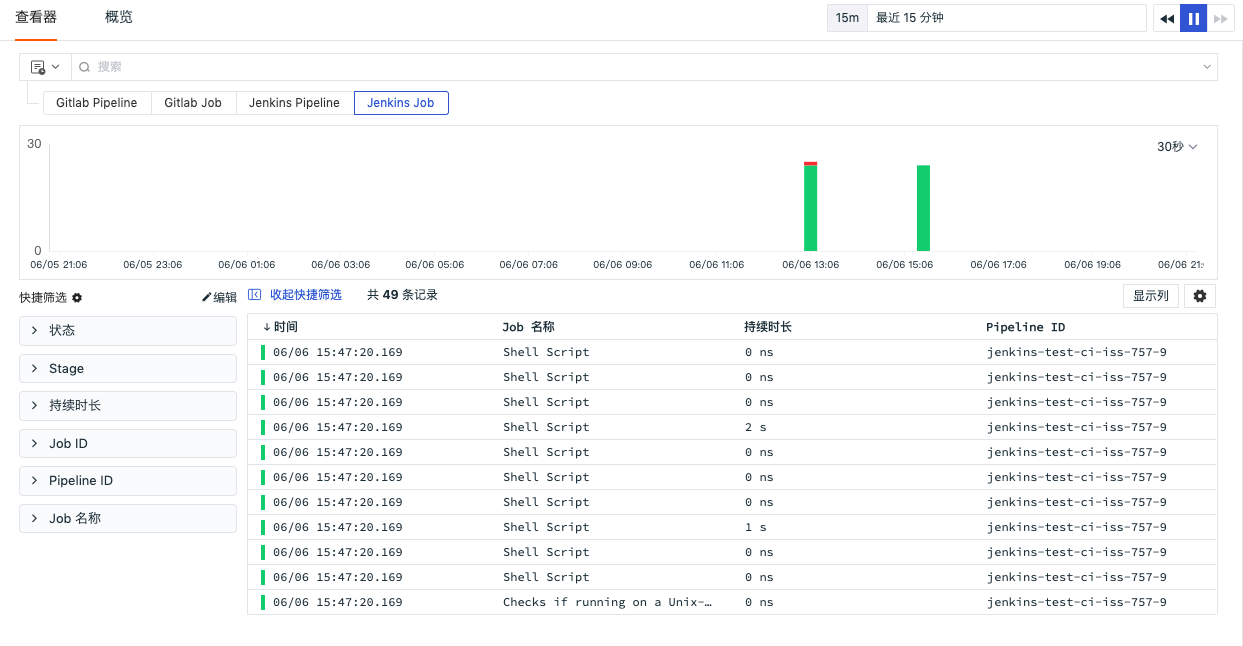
Job Explorer
Through the data type filter bar in the upper left corner, you can switch to the "jenkins_job" Explorer to query and analyze the Job process of the CI Pipeline, including Pipeline ID, Job name, duration, commit content, commit time, etc.
Job Details Page
Click on the data you need to view in the Job list. A details panel slides out displaying Pipeline and Job details, including attributes, flame graph, Job list, content details, and associated logs.