Service Management
Release Note
November 16, 2023: Pod Page Offline.
September 7, 2023: APM > Service entry integrates with this part.
Service Management as a centralized management portal, accesses and views key information under all services in the current workspace from a global perspective; at the same time, it connects business attributes with business data, and through associated warehouses and documents, quickly identify code locations and problem solutions for urgent problems.
In Scenes > Service Management, you can add service lists as needed. After adding, you can view the service lists, performance lists, and service topology diagrams from the following dimensions: Service List, Performance List, and Service Map. On the corresponding list page, you can quickly locate the target service list using global filtering, quick filtering, search, time controls, and other methods to reduce query time. You can also save snapshots to record query conditions at any time. Multiple settings and operations meet the demands of service data query.
Add Service List

- Service Name: Required field. This is the service name.
- Service Type: Required field. The type selection range includes:
app,framework,cache,message_queue,custom,db,web. - Color: Not required, that is the color of the current service; by default, it is generated randomly, but can also be selected from a dropdown menu.
-
Team Information
- Team: The team to which the current service belongs.
-
Contact Information: In case of any service disruption, we will contact you immediately. You can reach us through email, phone, or Slack. If you need to select multiple options, please separate them with commas, semicolons, or spaces.
Note: Once the current service list is successfully created, the new team created here will be synchronized in the Management > Member Management > Team Management list.
-
Related: Not required
- Application: The application information associated with the current service; the same user access monitoring application ID.
- Tag: Used to associate other configuration information within the current workspace, linking the information within the workspace through global tags, supporting operations such as jumping, contacting, viewing and analyzing.
-
Help Links
-
Repository Config: Fill in the display name, provider name, and repository code URL in order.
- Help Document: Fill in the display name, provider name, and URL of other related documents in order.
- View: You can bind the required inner views to the current service. After selecting, you can view the bound inner views under the Analysis Dashboard for the current service's linked data.
After entering the relevant information, Click Confirm to create successfully.
View Services
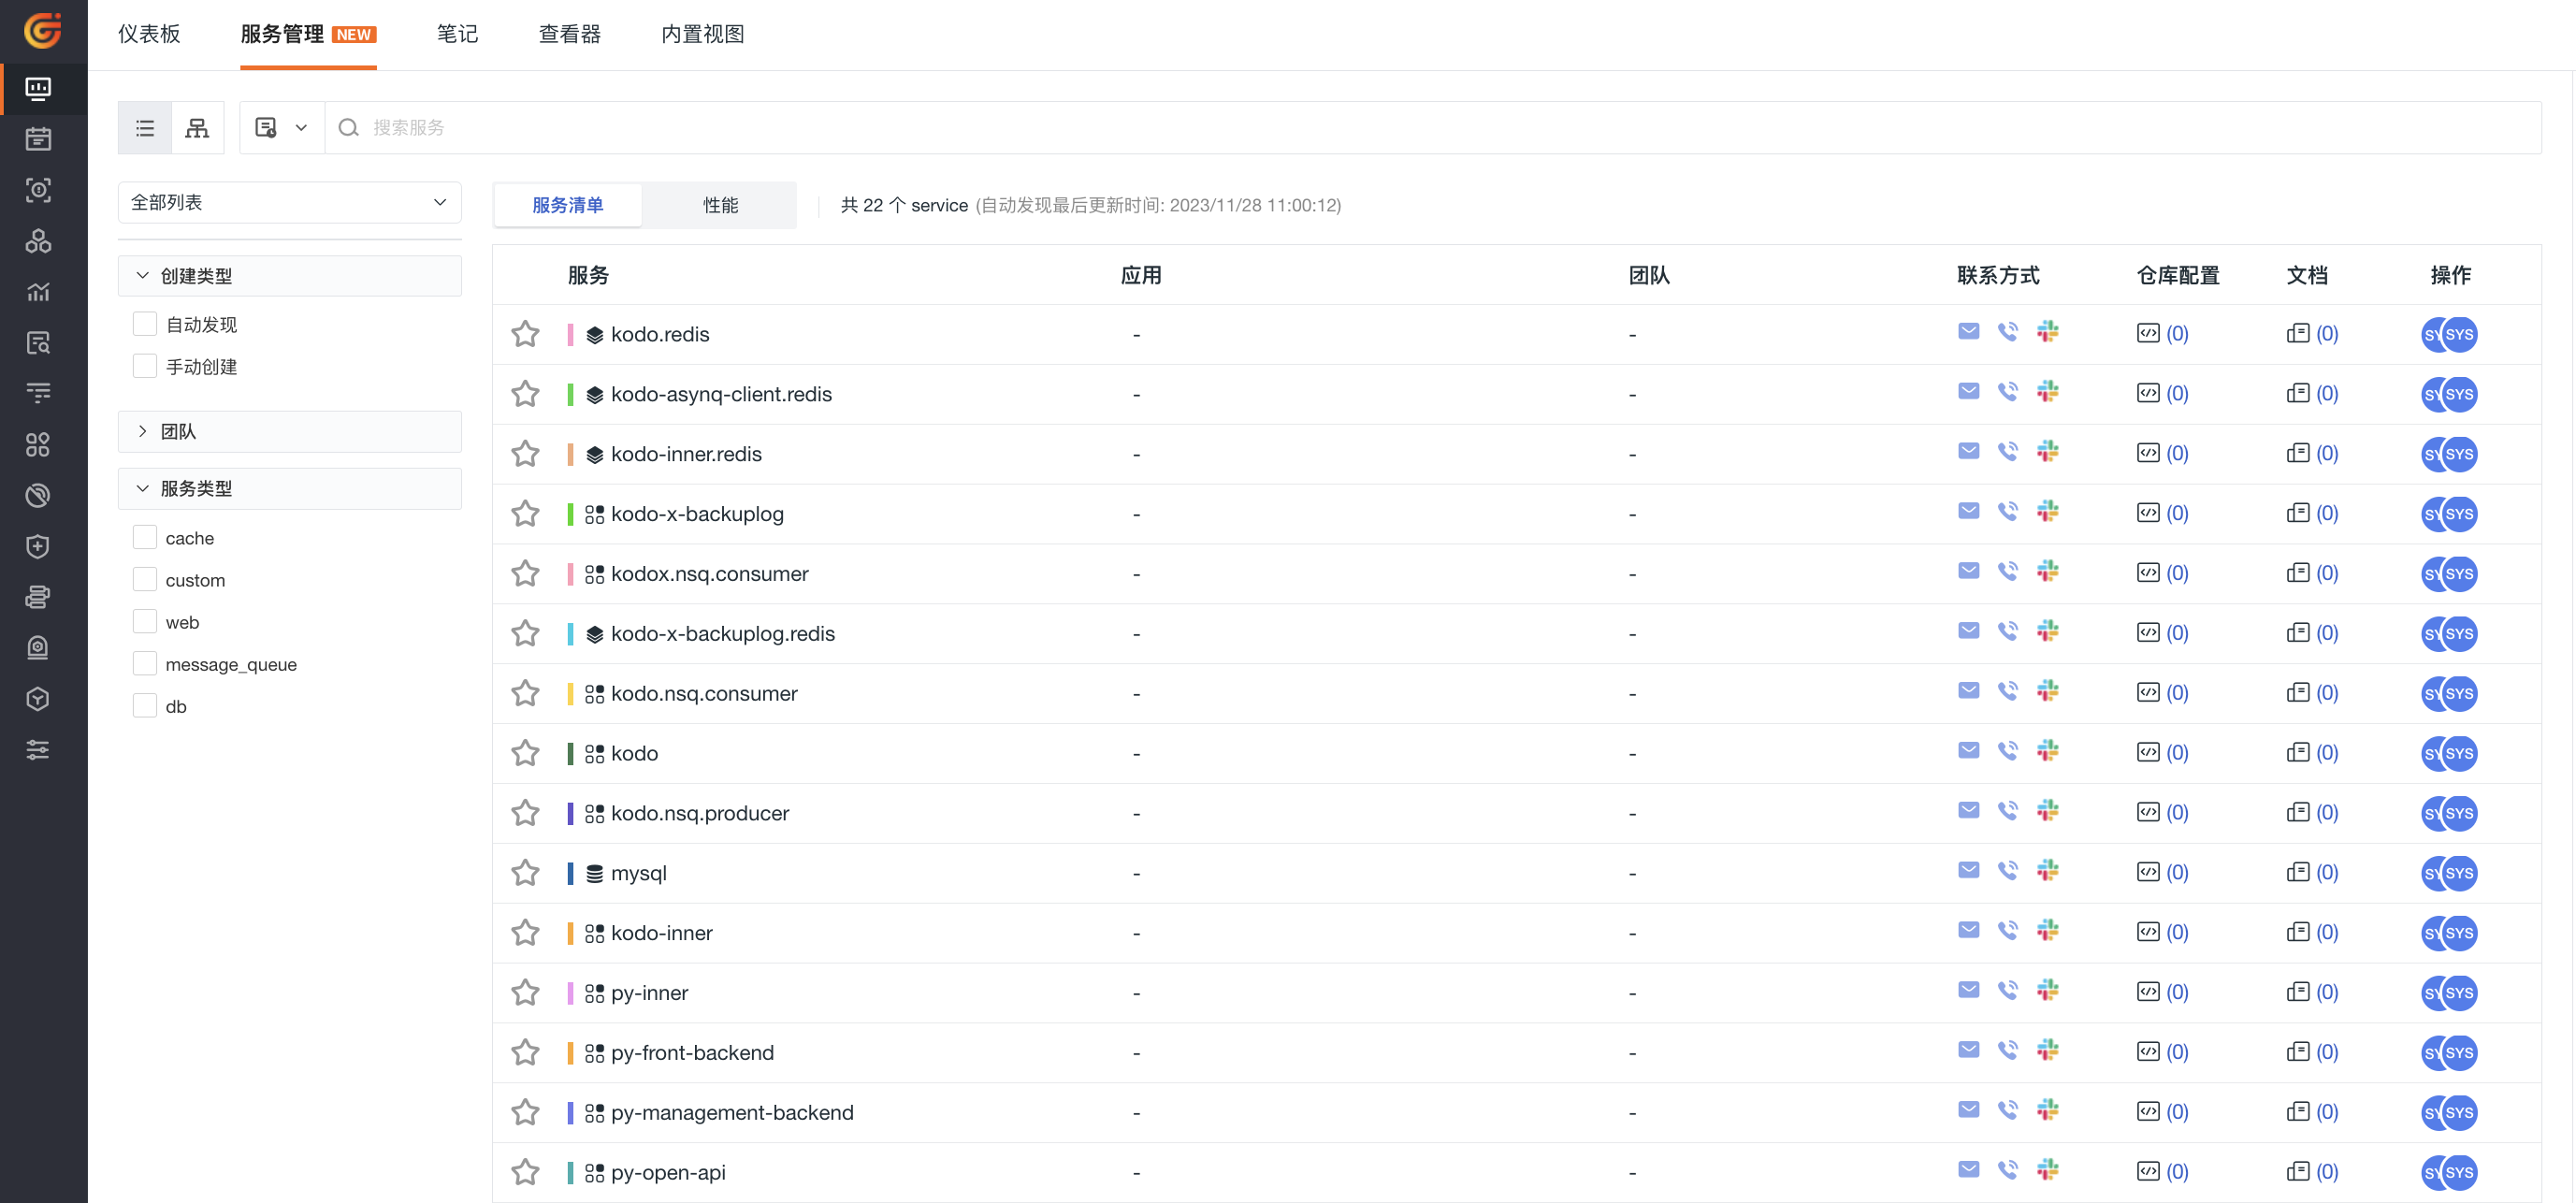
After creation, you can view all services in the inventory list:
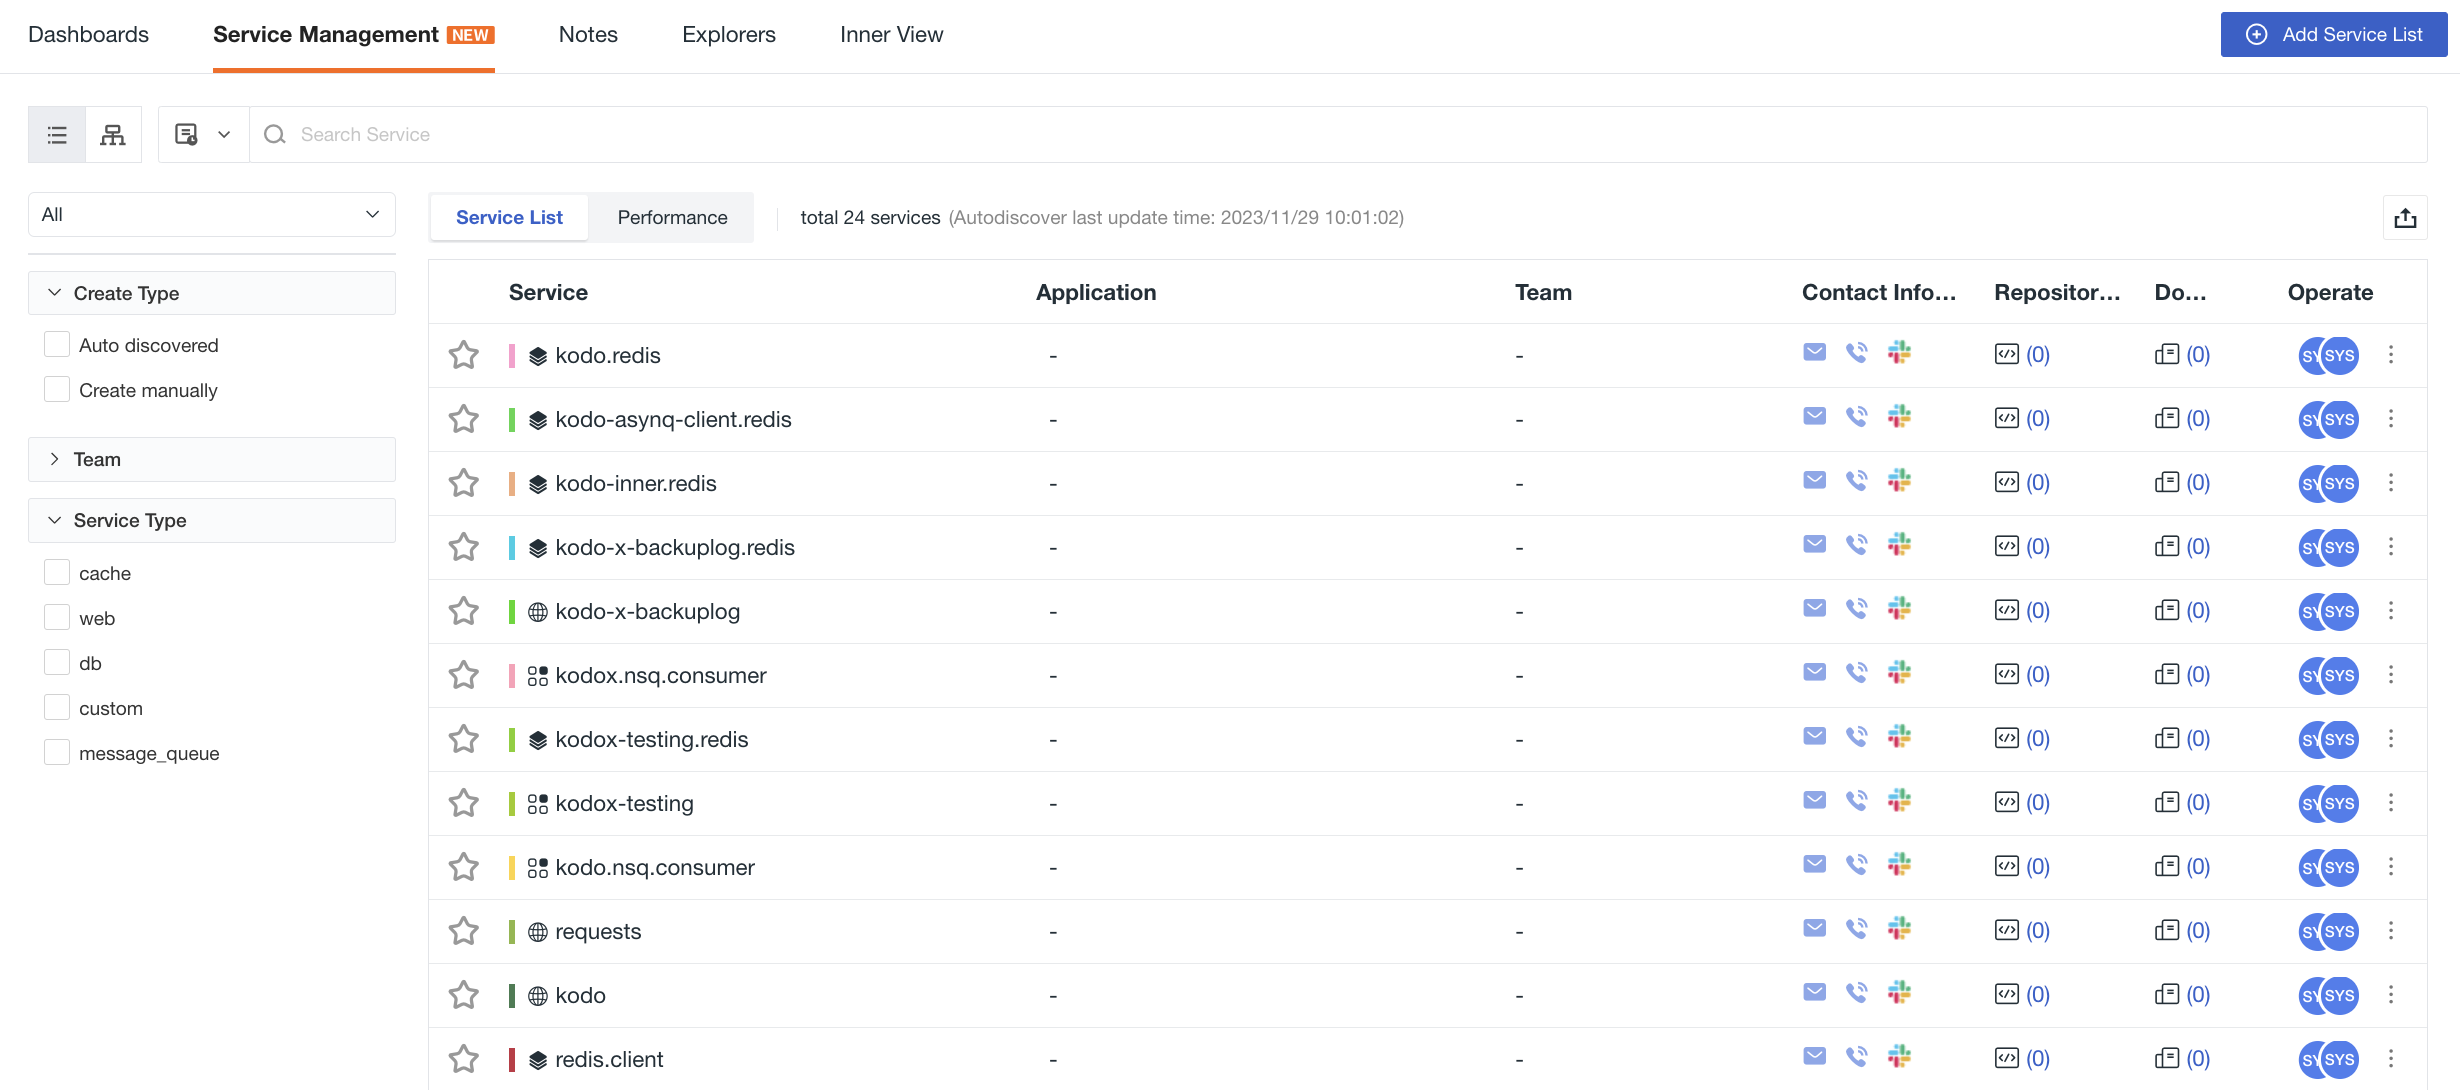
Service List
You can manage the service inventory list by following these actions:
- Search: In the search bar, you can enter keywords to search for service names.
-
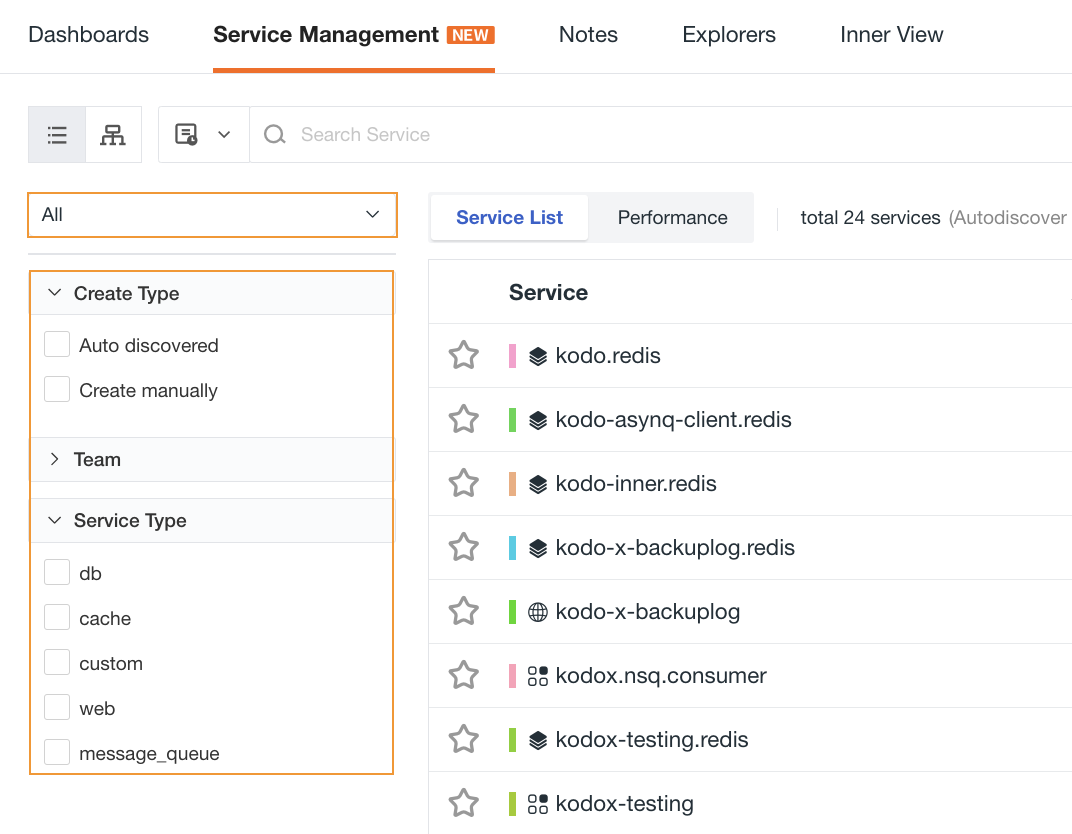
Filter:
-
Quickly filter and find the corresponding services by frequently browsed, my favorites and my creations;
-
On the left side of the list, you can filter according to creation type, team and service type.
-
-
On the list page:
-
Application: If the application is filled in and consistent with the RUM application ID, it supports hover-click to open a new page and jump to the Session Explorer.
-
Team: Support hover-click to open a new page and view team information.
-
Contact Information: Support hover to view detailed information such as email, phone and Slack, which supports jumping.
-
Repository Configuration & Documentation: Hover over the corresponding icon, and clicking will automatically redirect to the associated repository or documentation.
-
-
In Options:
-
Hover over the avatar icon to view the creator, creation time, updater, and update time of the service.
-
Click the button to edit or delete the current service.
-
Click the button to bookmark the current service.
-
Click the button to export the current page as a JSON file.
-
You can save the current page data as a snapshot.
Note: Due to the merging of Application Performance Monitoring > Services and Scenes > Services, the historical list snapshot of services is not listed here. If you need to view it, please go to the snapshot section of the shortcut entrance. Only newly created snapshot information is displayed here.
For more details, see Snapshot.
-
Performance
In terms of performance, you can:
-
Filter service performance quickly based on service type, environment, version and project.
-
Use the time widget to select a time range and view corresponding performance data.
-
Hover over a specific service and click on to navigate to the link details page.
-
View the average number of requests, average response time, P75 response time, P99 response time and error count of the service.
-
View monitors under the same tag and click to navigate to the corresponding monitor configuration page.
-
View event status and click to open a new page and navigate to the event explorer page.
Note:
-
The status of a service includes OK, Critical, Warning and No Data. It is based on the status of the last unrecovered event within the past 60 days. If there is no event, it will be displayed as "OK".
-
This only includes services that have reported link data.
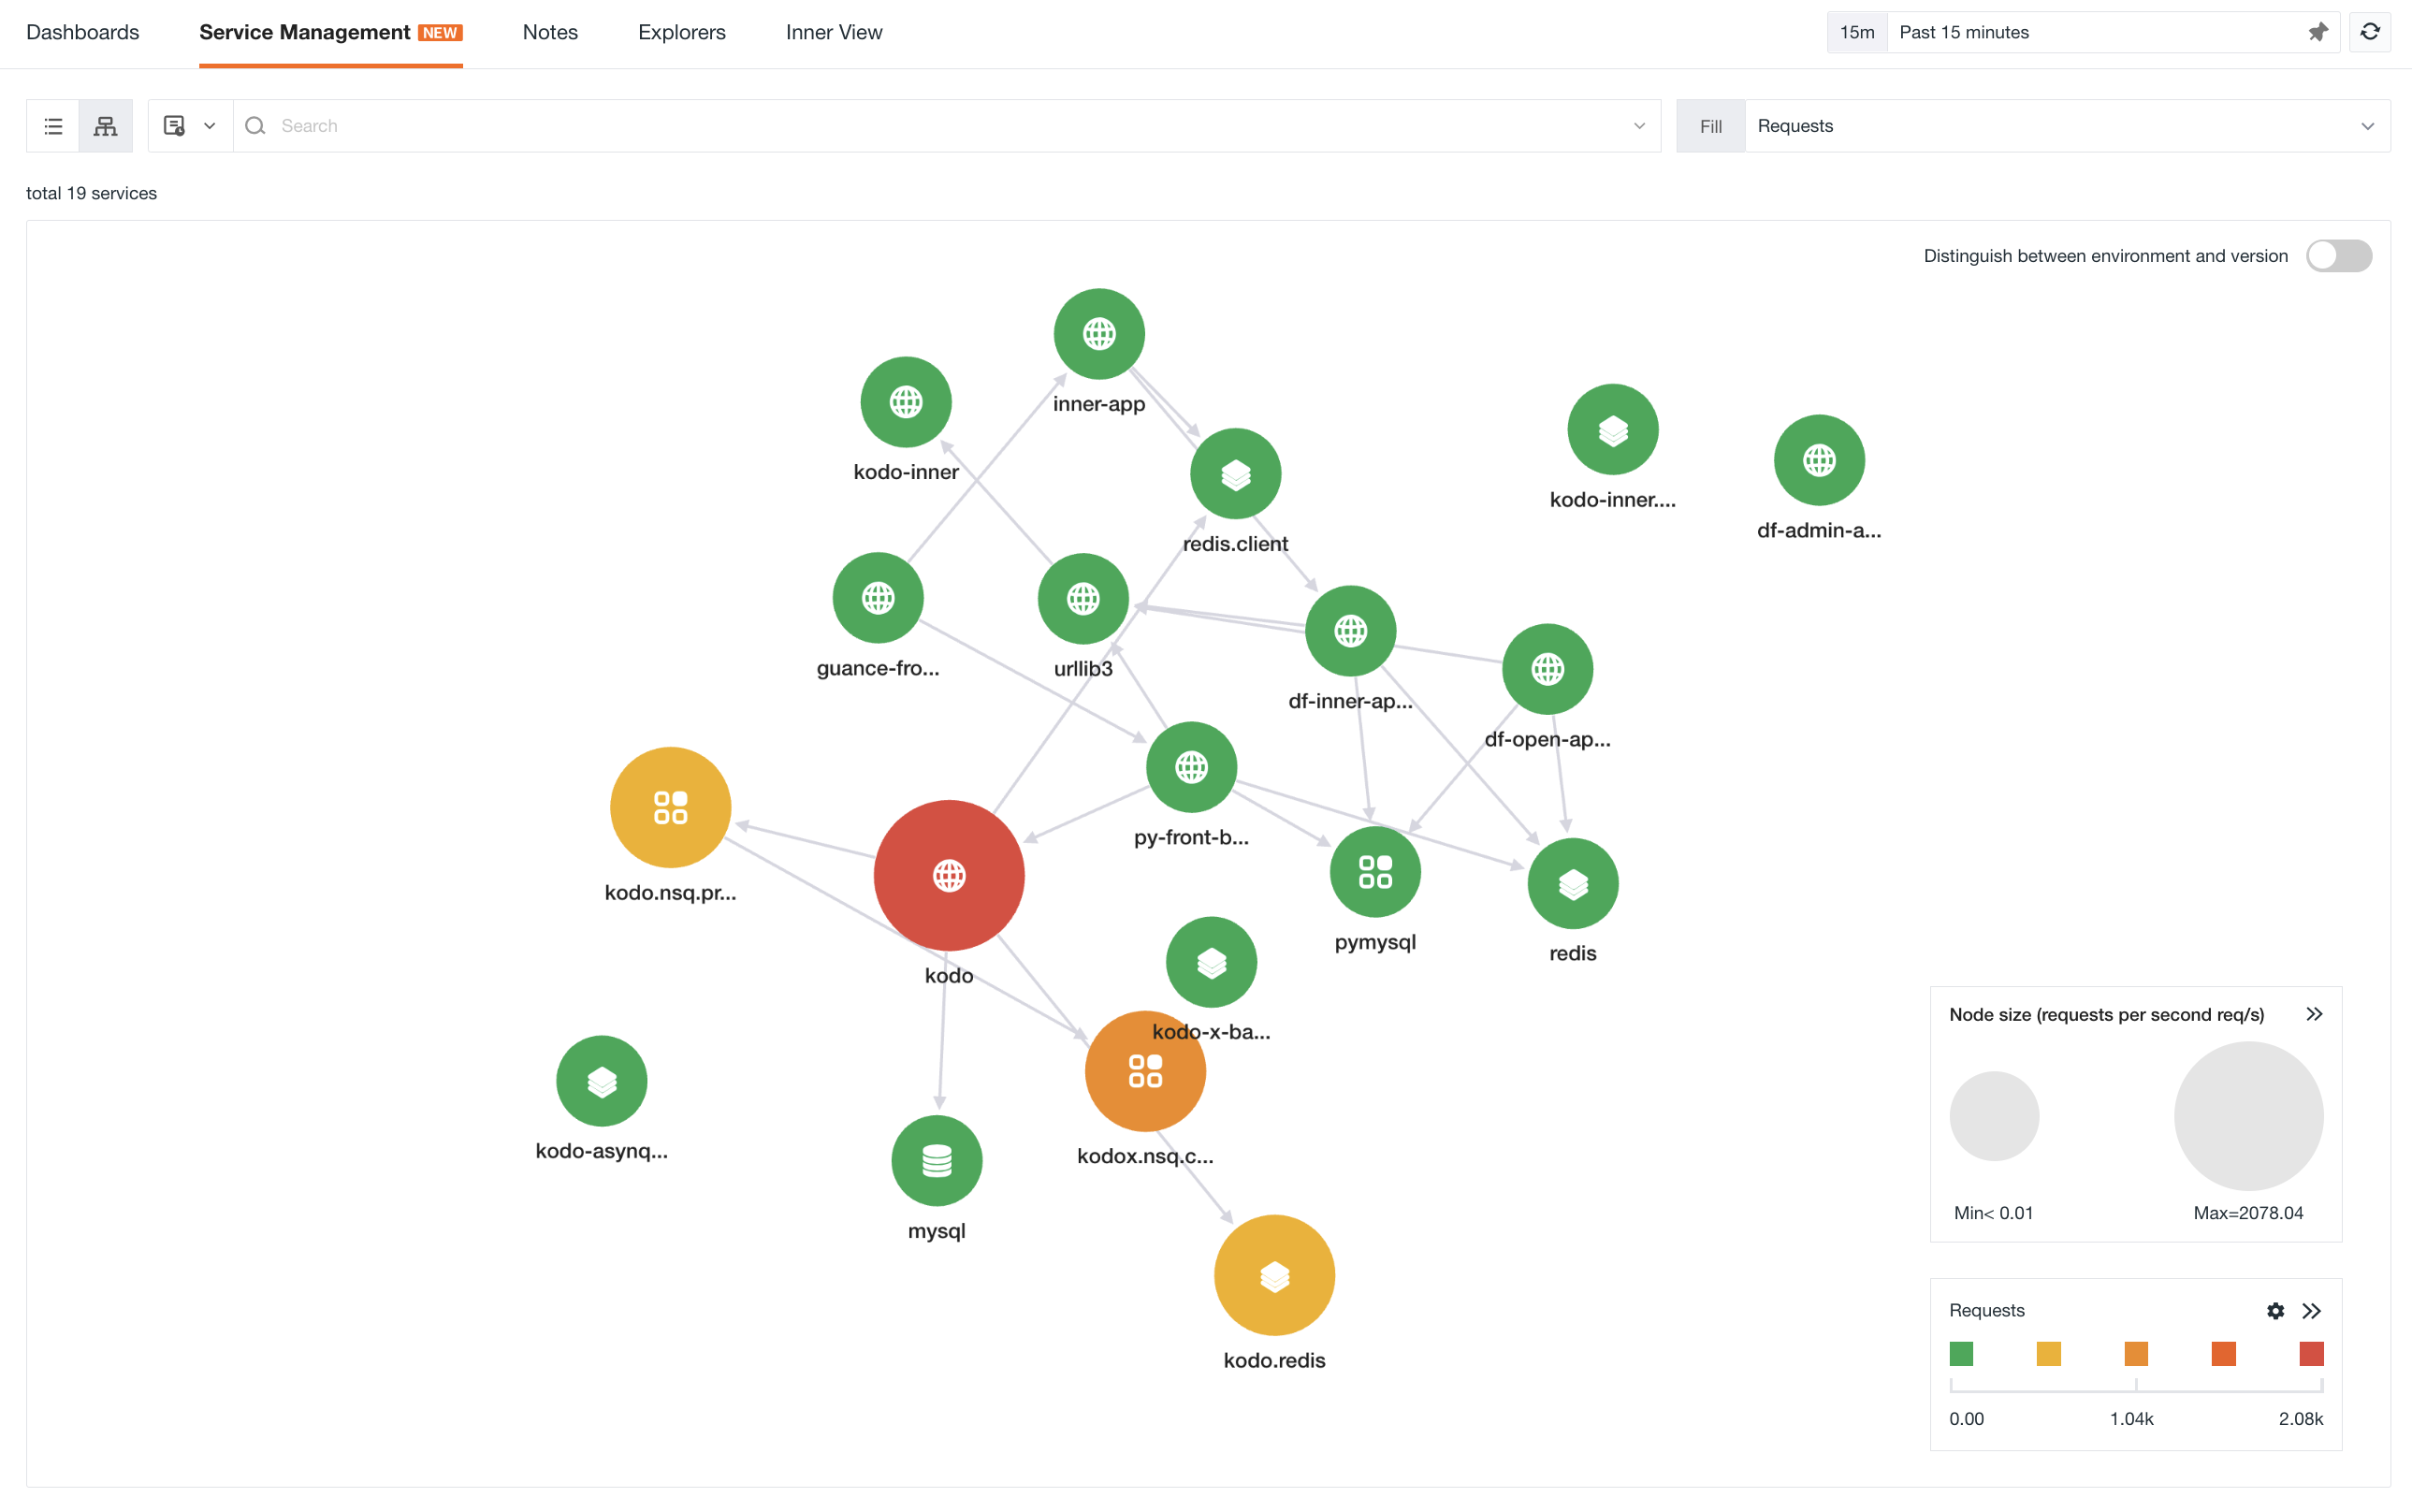
Service Map
You can switch to the Service Map mode to view the invocation relationships between various services.
Map
-
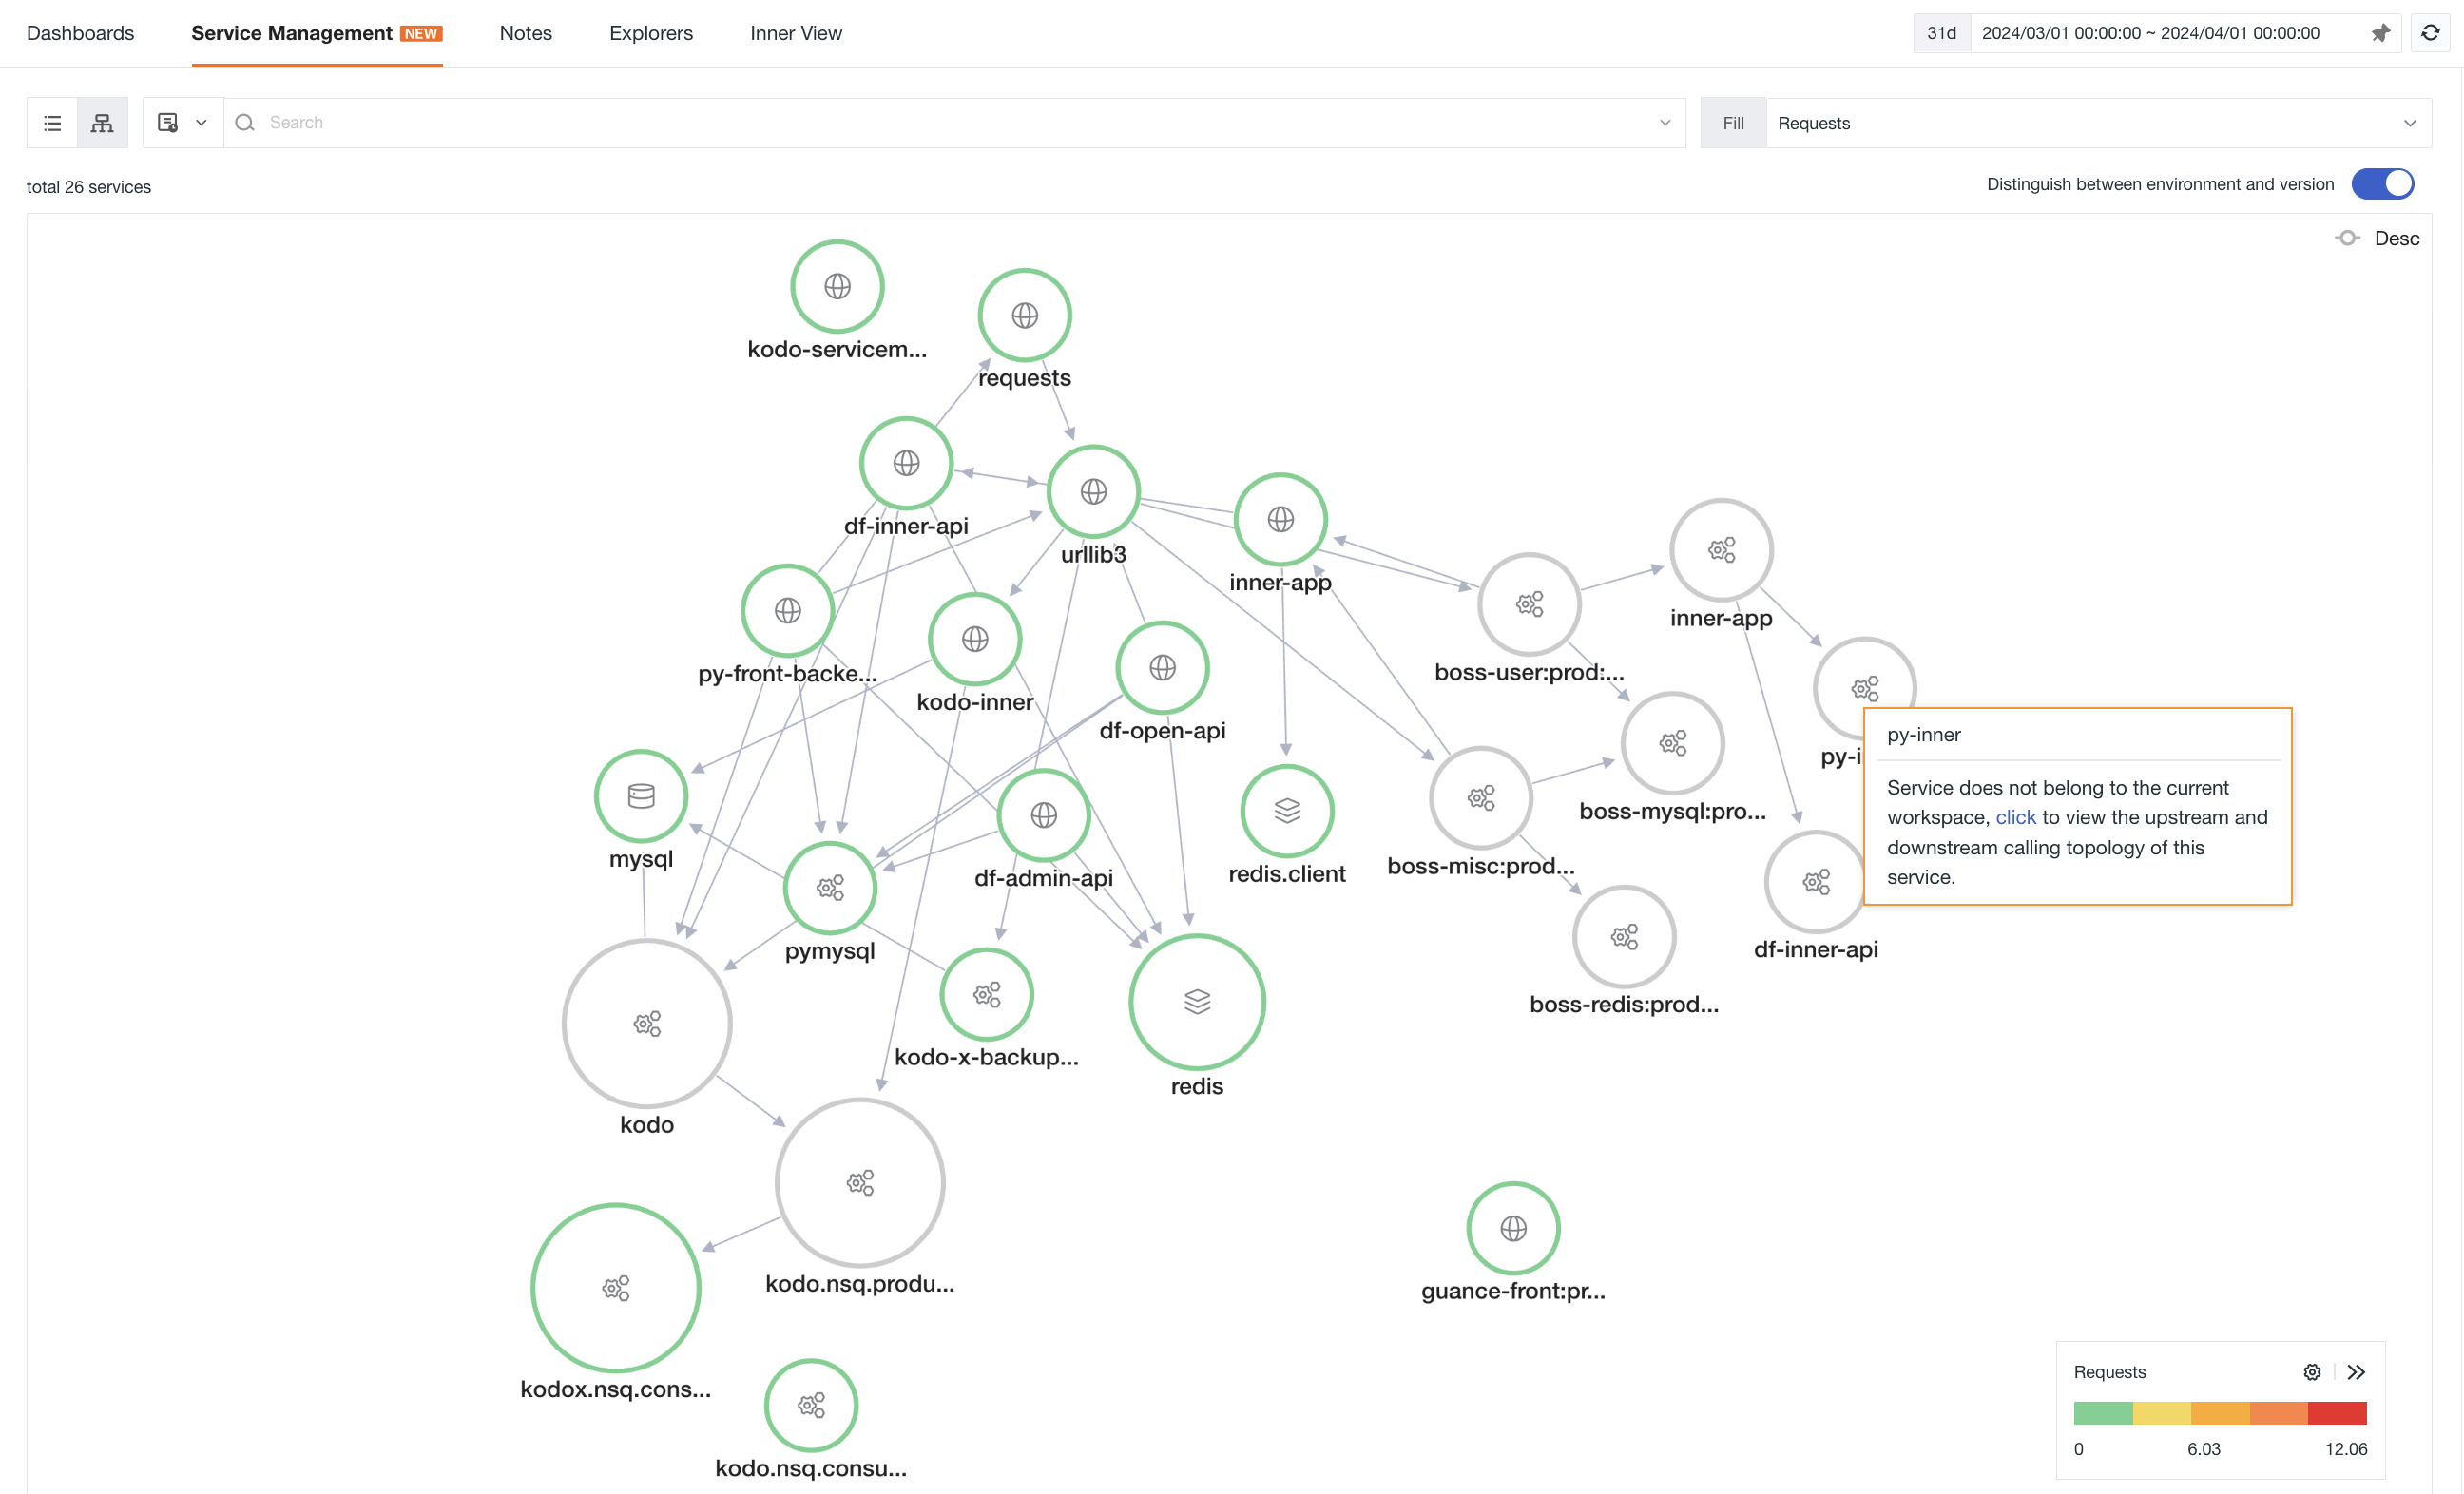
Distinguish between environment and version: Support drawing the link map based on two dimensions: service and service environment version (service+env+version). When distinguishing between environment and version, the service map will be drawn according to different environment versions. For example, with the canary release, by enabling environment and version, you can view the service invocation status under different environment versions.
-
Fill: Support selecting different performance indicators such as request count, P50 response time, P75 response time, P99 response time and error count to view the color of service nodes.
-
Custom range: Customize the color range of service nodes for the selected filling indicator. The color of the nodes is divided into five intervals based on the maximum and minimum values, and each interval corresponds to five different colors automatically.
-
Node size: There are three sizes for node size. The maximum value (Max) and minimum value (Min) of service requests per second are divided into three intervals, corresponding to three different graphic sizes.
Note: If the requests per second < 0.01, it will be directly displayed as < 0.01. However, the actual size of the ⚪ should be based on the real data. This is only for display purposes (For example: if the maximum value obtained is 0.009 and the minimum value is 0.0003, both are less than 0.01, it will be displayed as Min < 0.01, Max < 0.01, but the actual size should still be calculated based on 0.009 and 0.0003).
In the map, you can perform the following operations:
When hovering over a service node, the corresponding service will be highlighted, and other unrelated services and connecting lines will become gray. You can view the metric data of the service, such as request count, error rate, average response time and P99 response time.
Enable custom range to customize the color range of service nodes for the selected filling indicator. You can view the color of service nodes by selecting different performance indicators such as request count, P50 response time, P75 response time, P99 response time and error count through filling.
Zoom in on the map and view the small thumbnail in the lower left corner.
Click on a service icon, click view upstream and downstream, to view the upstream and downstream service associations of the current service. Click back to overview in the upper left corner to return to the original service map. You can search or filter in the search box to filter the associated upstream and downstream services. The matching associated upstream and downstream services will be displayed based on the search or filter results.
Click on a service icon to view the details of the service overview.
Click on a service icon to view related logs and related links.
Service Map Query
Prerequisite: All Commercial Plan workspaces belong to the same organization ID, that is, organization is the same.
If the same Trace data has a shunt situation, the data will belong to different workspaces, and it is impossible to view the complete link data in the same workspace. However, the cross-workspace Service Map query can ensure the continuity of data queries. You can view the upstream and downstream call topology of the current service by clicking the button directly in the current workspace.
List Details
In each service inventory list, click on a service to access its details page. Click on the tabs at the top of the page to access the analytics dashboard, resource call, logs, traces, error tracking, and event explorer, to query all relevant information for the associated service.
If you need to switch to the details of another service, simply click on the current service icon. In the opened window, you can directly enter keywords to search:
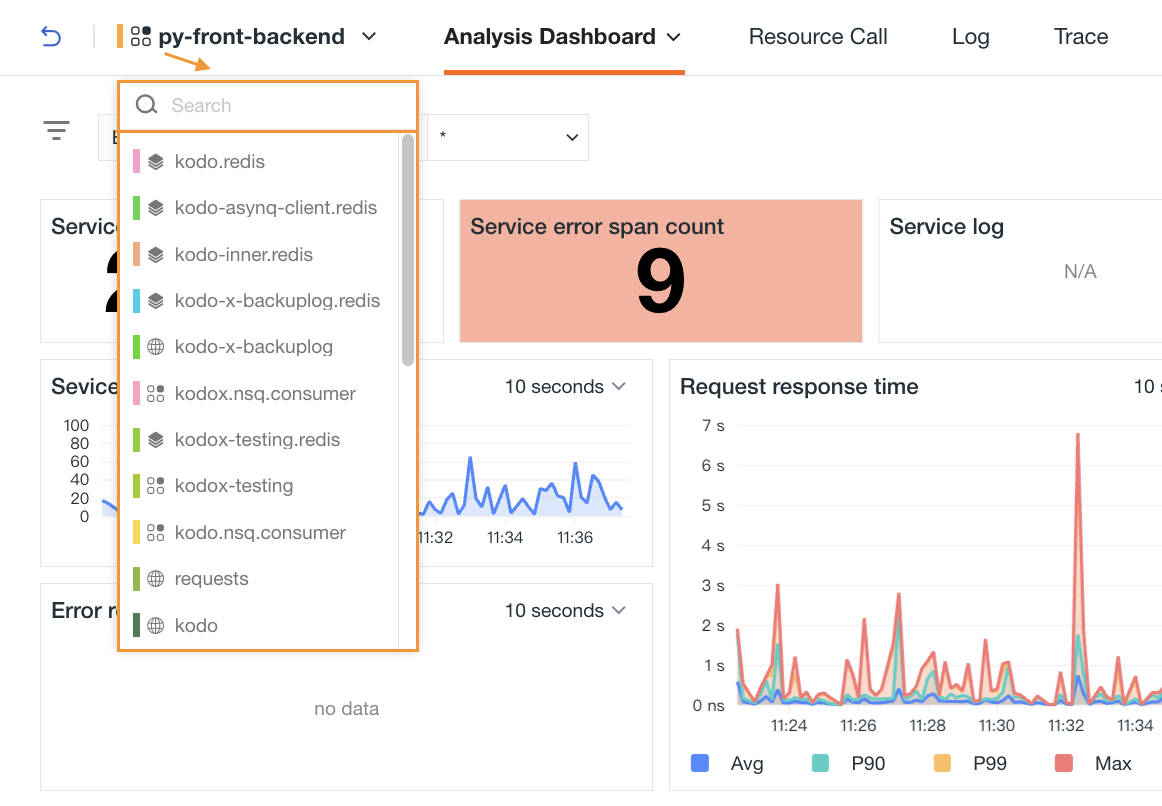
Analysis Dashboard
By default, the overview page of the analysis dashboard is opened. If you have associated an inner view while creating or editing a service, you can switch to view it:
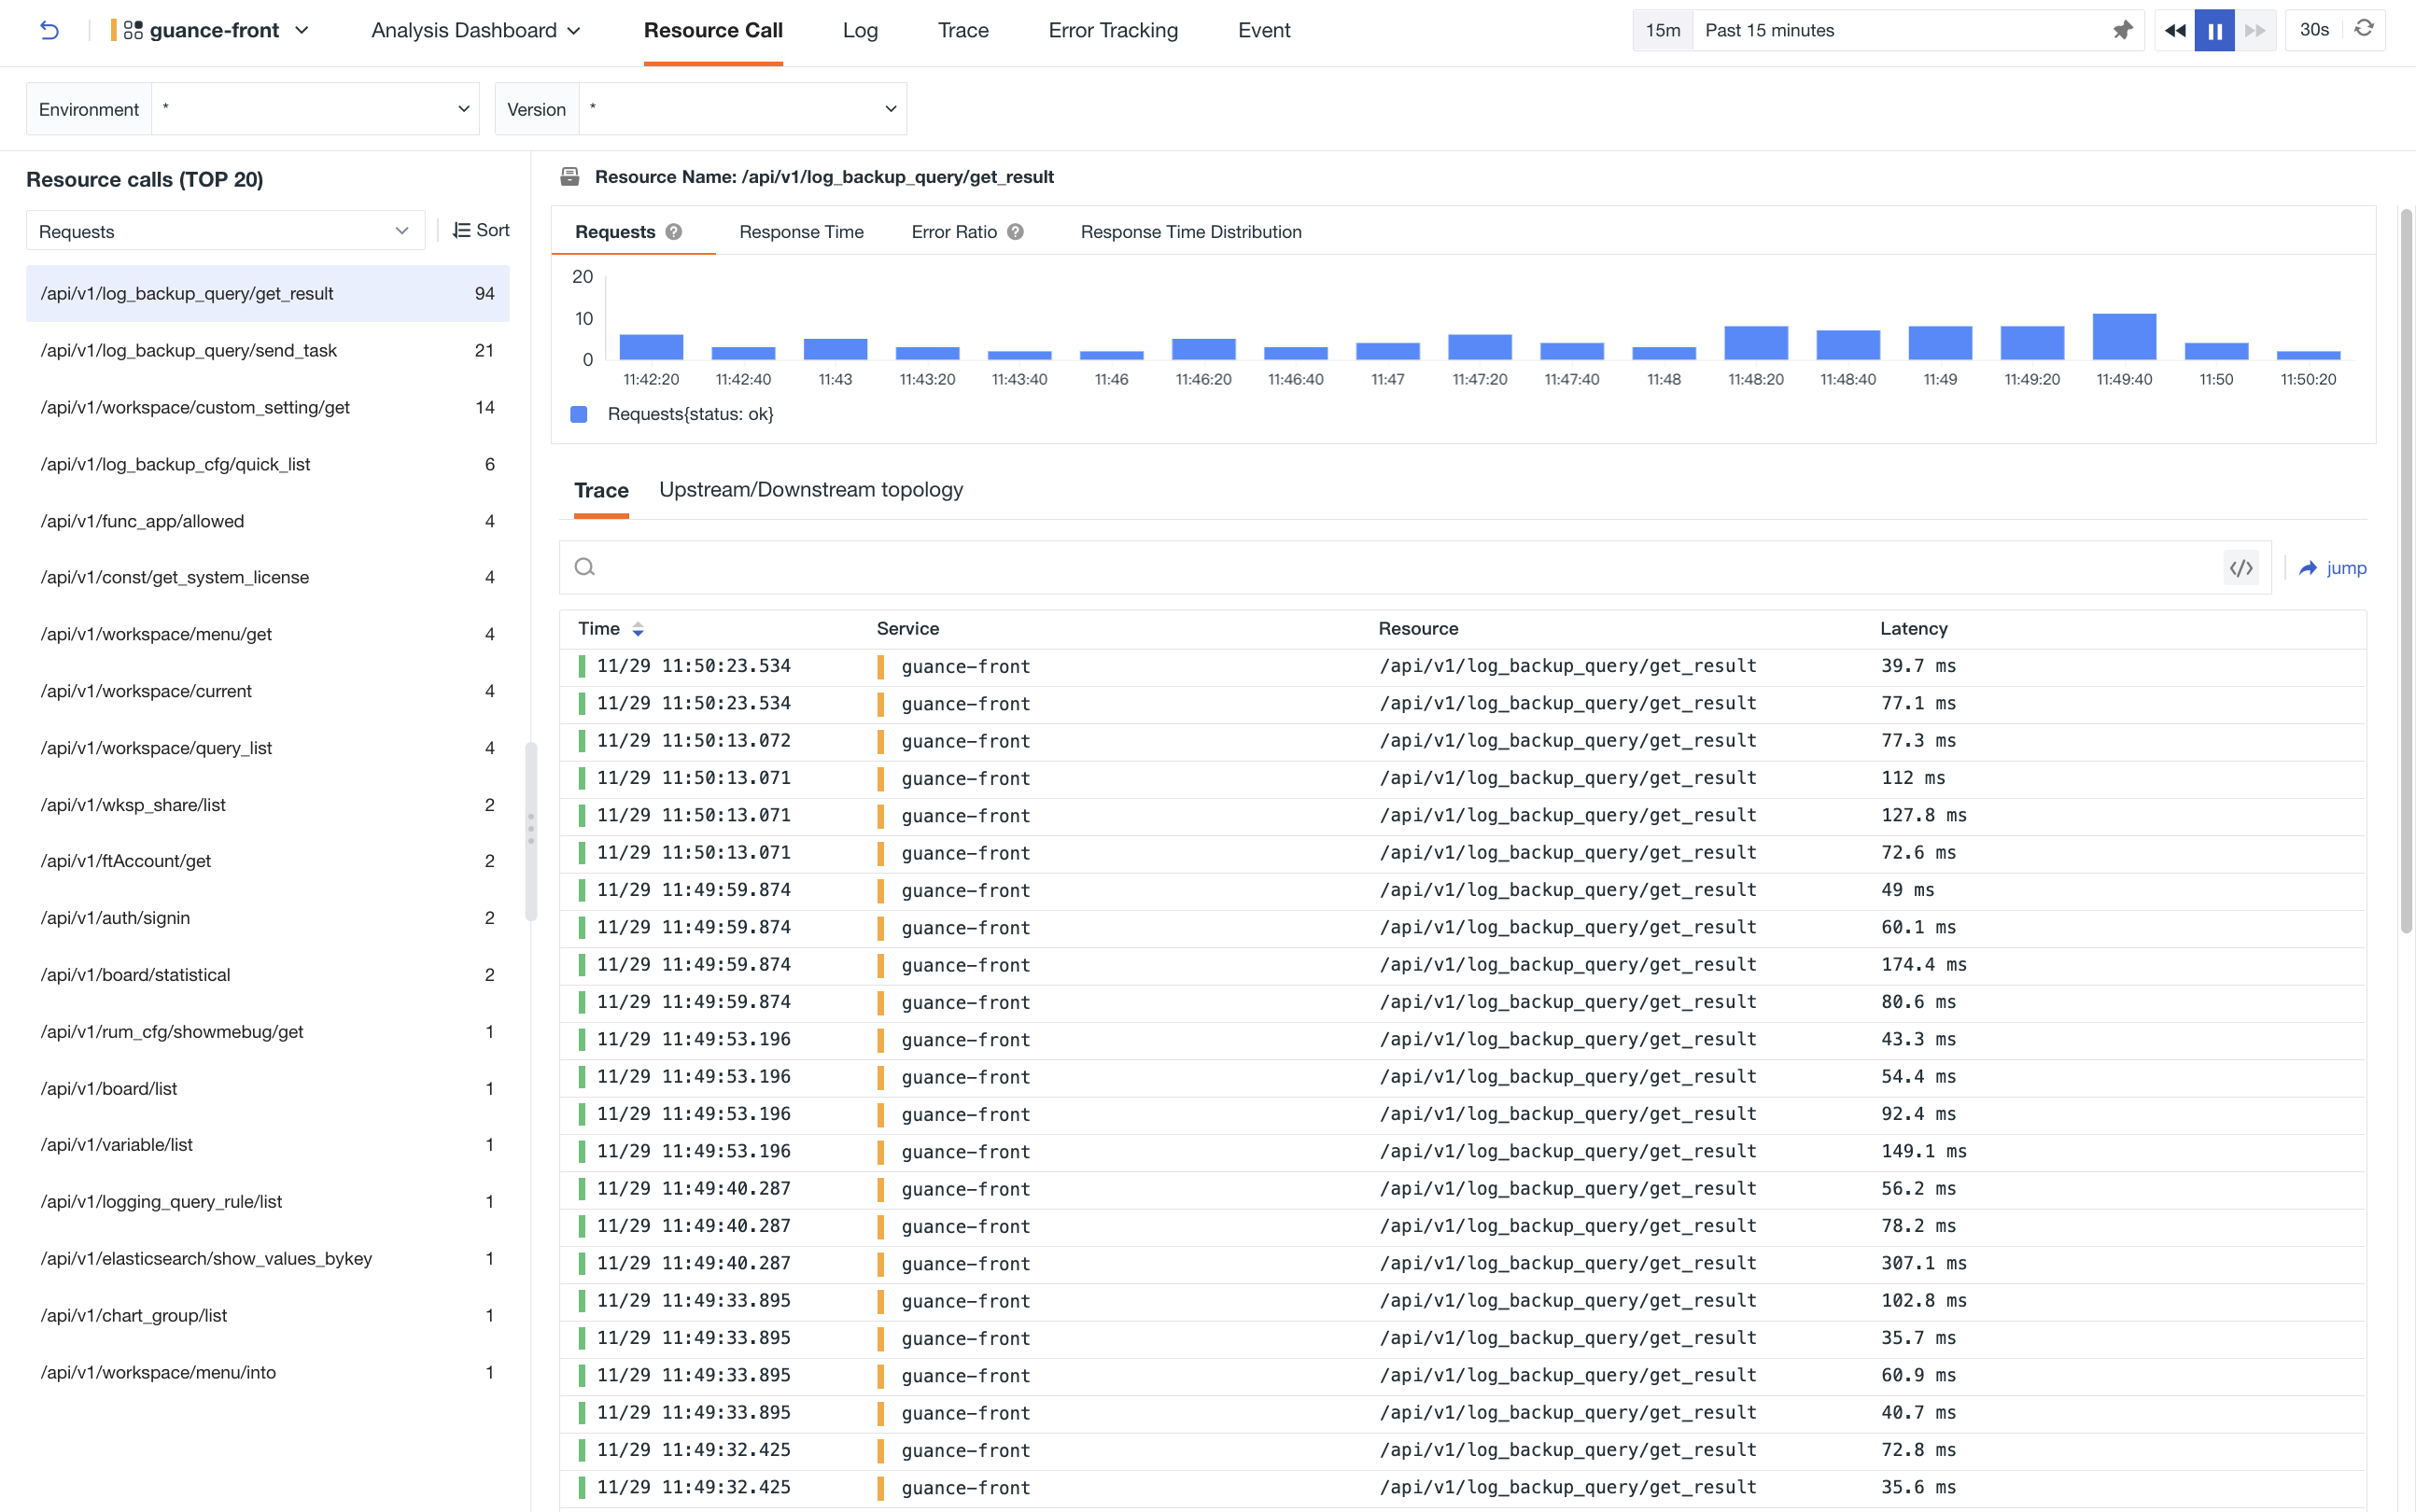
Resource Call
In Resource Call, Guance displays the ranking of resource calls. By default, it shows the information of the top-ranked resource on the right side of the page, including the number of requests, error rate, response time, response time distribution and its link data. You can also filter globally based on environment and version. If there is no resource information available, Guance will display the relevant data for that service on the right side of the page.
-
The Resource Invocation Ranking (TOP 20) list supports querying and analyzing based on the number of requests (default), error requests, requests per second, P75 response time, and P99 response time. You can sort the corresponding list by quantity, with the default order being from largest to smallest.
-
Hover over a specific resource and click the button on the right side to copy the complete name of the current resource.
-
In the details page on the right side of the resource, you can view the number of requests, error rate, response time, and response time distribution.
-
You can query related link information and support searching. Click to go to the Service Management > Trace page.
Upstream and Downstream Topology
On the details page of the resource on the right side, in addition to the associated link data, you can also view the upstream and downstream topology of the current resource.
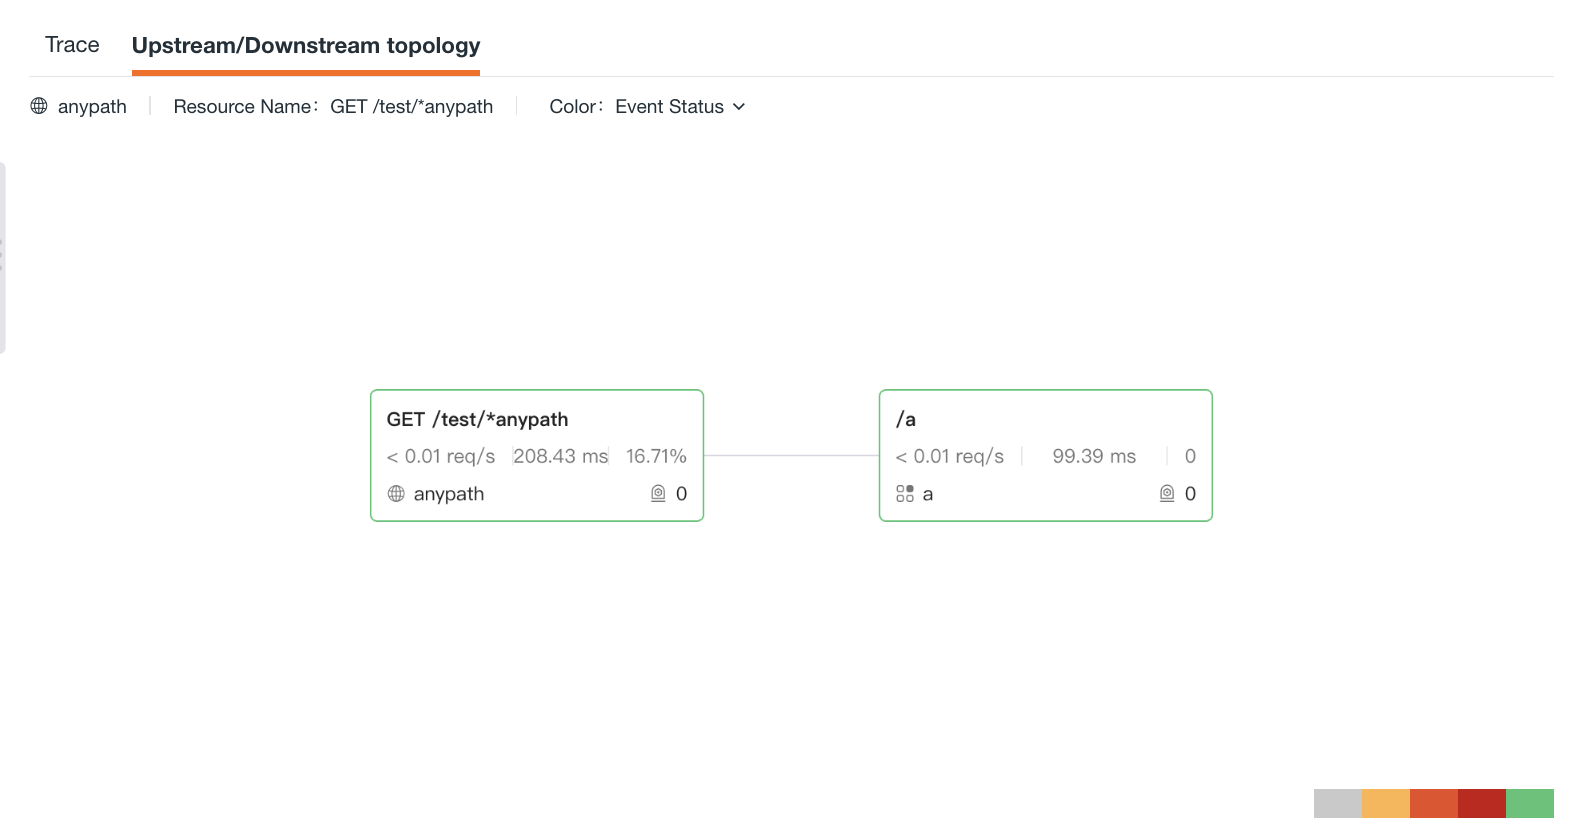
On the Upstream and Downstream Topology tab, you can:
- Event Status Legend: From left to right, each color block represents: No Data, Warning, Error, Critical, Normal.
- On the card, you can view the average request rate, P99 response time, error request rate (number of requests), and associated monitors for each resource.
- Click on the card to view related logs, user access, and events; if the resource is associated with a monitor, you can navigate to the corresponding monitor to view the monitor configuration and related events.
Related Explorers
| Form more information about Explorer, click here: | |
|---|---|
| Log Explorer | Trace Explorer |
| Error Tracking Explorer | Event Explorer |