SLO
In the cloud era, all major service providers have issued relevant Service-Level Agreements (SLAs) to ensure the quality of the services they provide and clarify responsibilities. Guance SLO monitoring revolves around various DevOps Metrics, testing whether the system's service availability meets target needs. It can not only help users monitor the quality of services provided by service providers but also protect service providers from the impact of SLA violations.
Concepts
| Term | Description |
|---|---|
| SLA | Short for Service-Level Agreement, it refers to the service commitment made by the system service provider (Provider) to the customer (Customer). You can rate the service provider's service quality SLA and monitor the service's compliance rate in real-time. |
| SLI | Short for Service Level Indicator, a measurement Metric that refers to the indicators chosen to measure system stability. Guance SLI supports setting one or more Measurement Metrics based on monitors. |
| SLO | Short for Service Level Objective, Guance performs SLA rating processing with this as the smallest unit. It is the goal of the cumulative successful instances of SLI within a time window. We often convert SLOs into error budgets, used to calculate tolerable errors, where the duration of abnormal events appearing in each detection cycle will be deducted from the allowable fault tolerance time (as shown in the figure below: assuming an SLO detection cycle of 5 minutes, according to the stacking, the abnormal event coverage time is 3 minutes, deducting 3 minutes). |
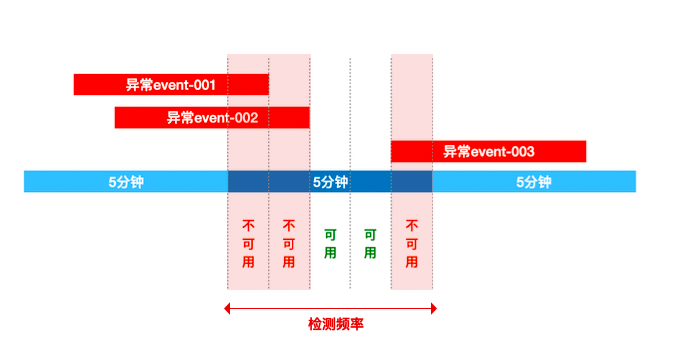
As shown in the figure above, the system detects abnormalities every 5 minutes. The coverage time of each abnormal event is calculated precisely based on its actual start and end points (the start time is based on the detection time window, and the end time consists of the event's start time + duration). The chargeable amount is the total coverage time of all merged abnormal events (overlapping periods are counted only once).
Create SLO
Navigate to Monitors > SLO, and customize the creation of SLO tasks.

- Name: The name of the SLO task. Up to 64 characters can be entered.
- Detection Frequency: The frequency of SLO detection, i.e., a certain time range as a cycle, monitoring whether any abnormal events occur in the monitored Monitors within the SLO task. Currently supports 5 minutes, 10 minutes.
- SLI: The normal operation time of the Monitors will serve as the Metric for measuring system stability. Thus, you can customize adding one or more Monitors as Measurement Metrics.
- Compliance Rate: The SLO target percentage (0-100%), using a 7-day time reference dimension.
- Target: When Minimum Target Percentage >= Compliance Rate < Target Percentage, it is considered that the SLA is unhealthy, generating a Warning event;
- Minimum Target: When Compliance Rate < Minimum Target Percentage, it is considered that the SLA is non-compliant, generating an Urgent event.
- Alert Strategies: After selecting associated Alert Strategies, once an anomaly is detected, corresponding alert notifications can be sent.
- Description: Descriptive information, supporting up to 256 characters.
Note
Once the SLO configuration is saved, the SLO name, target, and detection cycle cannot be changed.
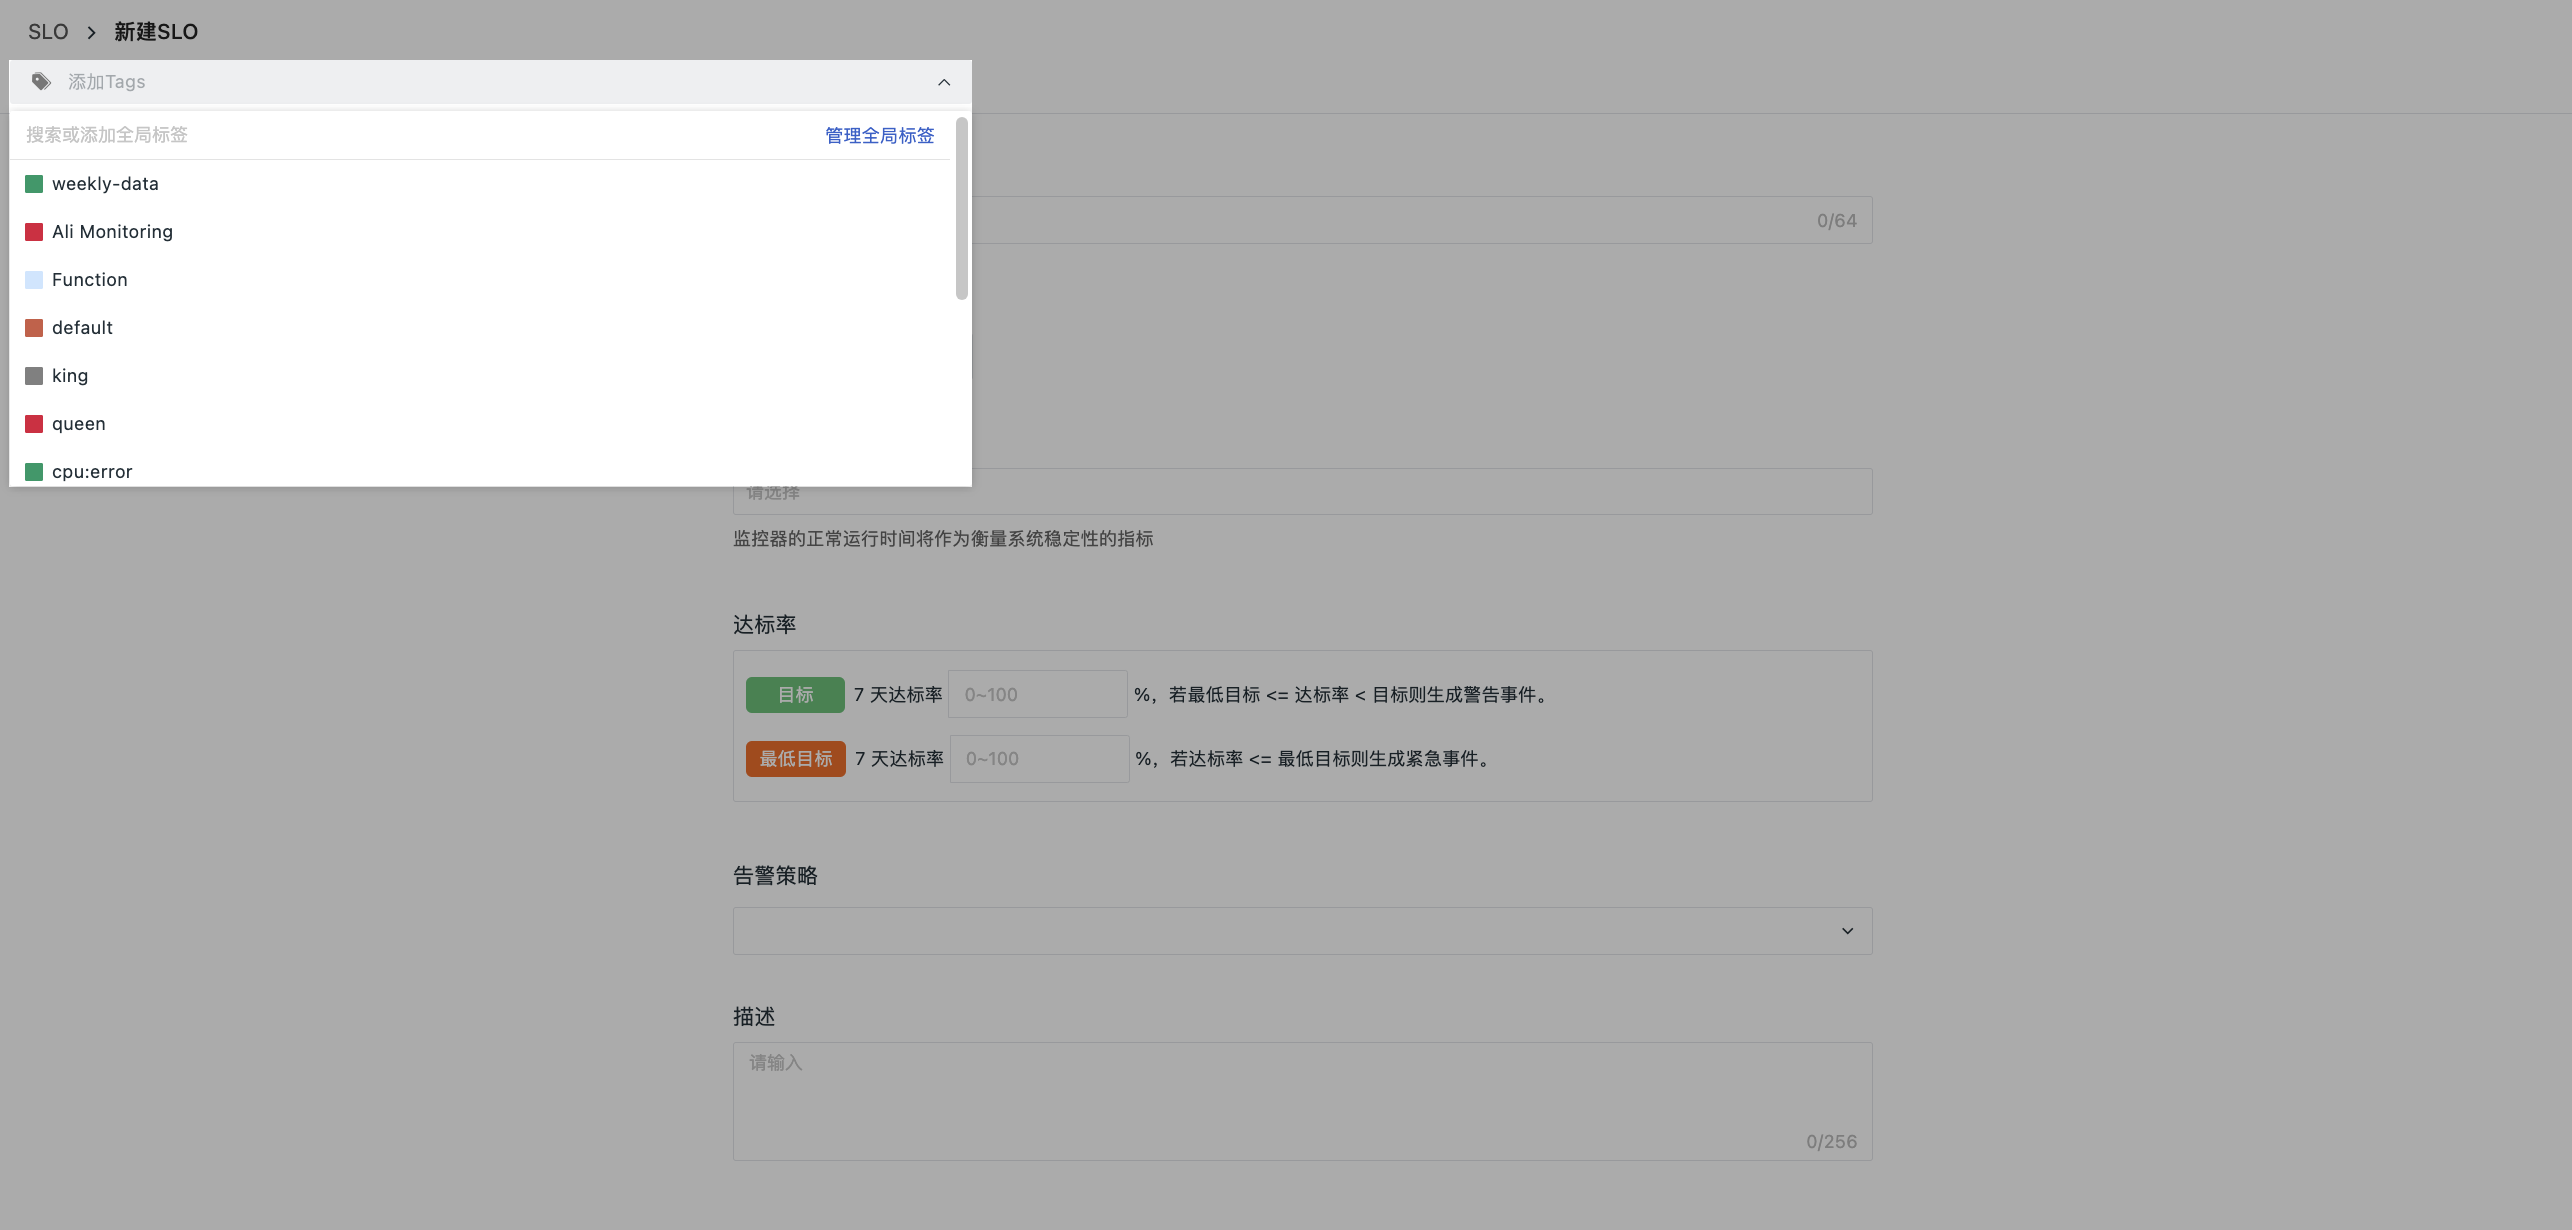
When creating or editing an SLO task, you can also add Labels in the top-left corner for the current task, achieving data linkage across the current workspace through global labels.
SLO List
In the workspace’s Monitors > SLO, you can view various metric data of all SLO monitoring tasks under the current workspace, including associated Monitors, targets, downtime, compliance rates, error budgets, etc., and perform operations such as enabling, disabling, editing, viewing related events, exporting dashboards, etc.

List Fields
Field |
Description |
|---|---|
| Monitors | The number of Monitors associated with the SLI, which are Metrics for measuring service performance. |
| Target | The target percentage of service availability set when creating the SLO task. |
| Compliance Rate (7 Days) | The percentage of time without system anomalies during the given evaluation period (Compliance Rate = System Anomaly-Free Time / Evaluation Period * 100%): |
| Downtime (7 Days) | The time of Monitor anomalies / used budget. |
| Error Budget (7 Days) | The remaining allowable fault tolerance time for the current SLO (assuming the target SLO is set to 95%, meaning there is a 5% fault tolerance rate, defaulting to the last 7 days as a cycle, i.e., default: Error Budget = 7 days * 5% = 21 minutes), displayed as: |
Operation Instructions
- Search Bar: In the SLO list, you can search based on the SLO name for positioning.
- Batch Operations: You can batch Enable, Disable, Delete specific SLOs.
- Enable/Disable: Newly created SLOs are enabled by default; you can choose to disable the SLO or re-enable a disabled SLO.
-
Edit: Supports re-editing existing SLO tasks; however, does not support modifying the SLO name, target, and detection frequency.
-
Delete: Supports deleting existing SLO tasks.
- Note: Deleting an SLO task may cause the associated dashboard SLO data to become invalid.
-
View Related Events: Alert events triggered by the SLO task will be uniformly stored under the corresponding task. Clicking can directly jump to all unrecovered events triggered by the SLO task.
-
Export to Dashboard: Supports exporting the SLO monitoring task as a View to the Dashboard for synchronized SLO monitoring on the dashboard.
- Note: The time range of the SLO View in the Dashboard defaults to being consistent with the Dashboard, while the SLO list defaults to calculating the SLO compliance rate for the last 7 days.
SLO Details
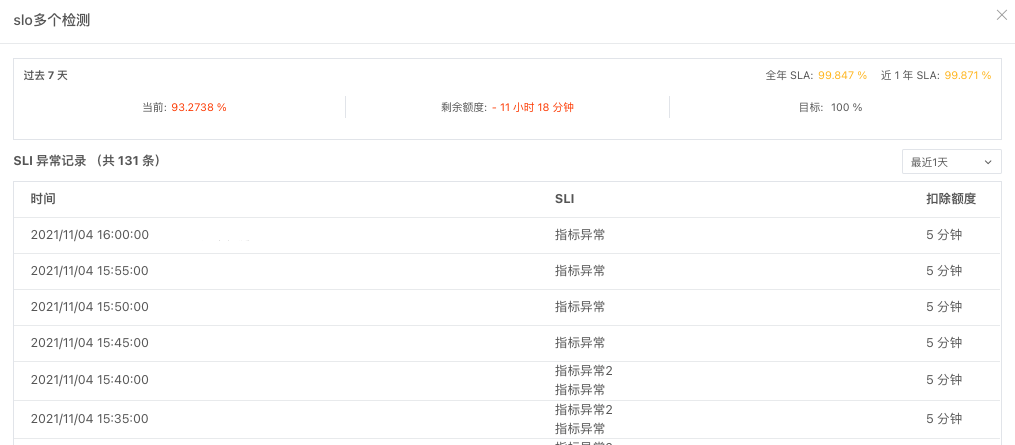
Guance supports viewing SLO details by clicking on the SLO task, including the SLO compliance rate and SLI anomaly records.
| Field | Description |
|---|---|
| Last 7 Days SLA | Based on the current access time, get the compliance rate for the past 7 days. |
| Annual SLA | Based on the current access time, get the compliance rate for this year (calendar year). |
| Past Year SLA | Based on the current access time, get the compliance rate for the past 1 year (calendar year). |
| SLI Anomaly Records | Abnormal events triggered by the Monitors under the current SLO task. |
Obtain SLO via DQL Expressions
Refer to the following query for abnormal times:
df_slo_cost represents deducted minutes, summing up the values gives the abnormal time, replace df_slo_id accordingly:
If querying the SLO value for 7 days, the DQL expression would be as follows:
eval((10080-A)/10080 *100, A="E::`slo`:(sum(`df_slo_cost`)) { `df_slo_id` = 'monitor_c36bb56f274b4242866fe7259f1859c0'}")
Example:
In the figure below, the SLO value for the past 7 days of the SLO task is 80.496%.

Navigate to Shortcut > Query Tool, select DQL Query, input the query statement for the SLO value over 7 days, and the query result matches the value in the figure above.

 When applying Query Tool > DQL Query, ensure the time range in the upper-right corner matches the time range for obtaining the SLO value;
 slo_id can be viewed in the Event > Event Detail Page:
