Topology Map
To enhance the visualization of dashboards, Guance has componentized based on existing service topologies and resource invocation maps. It can be used to display relationships and relative positions between different entities.
Chart Query
Service Relationship Map
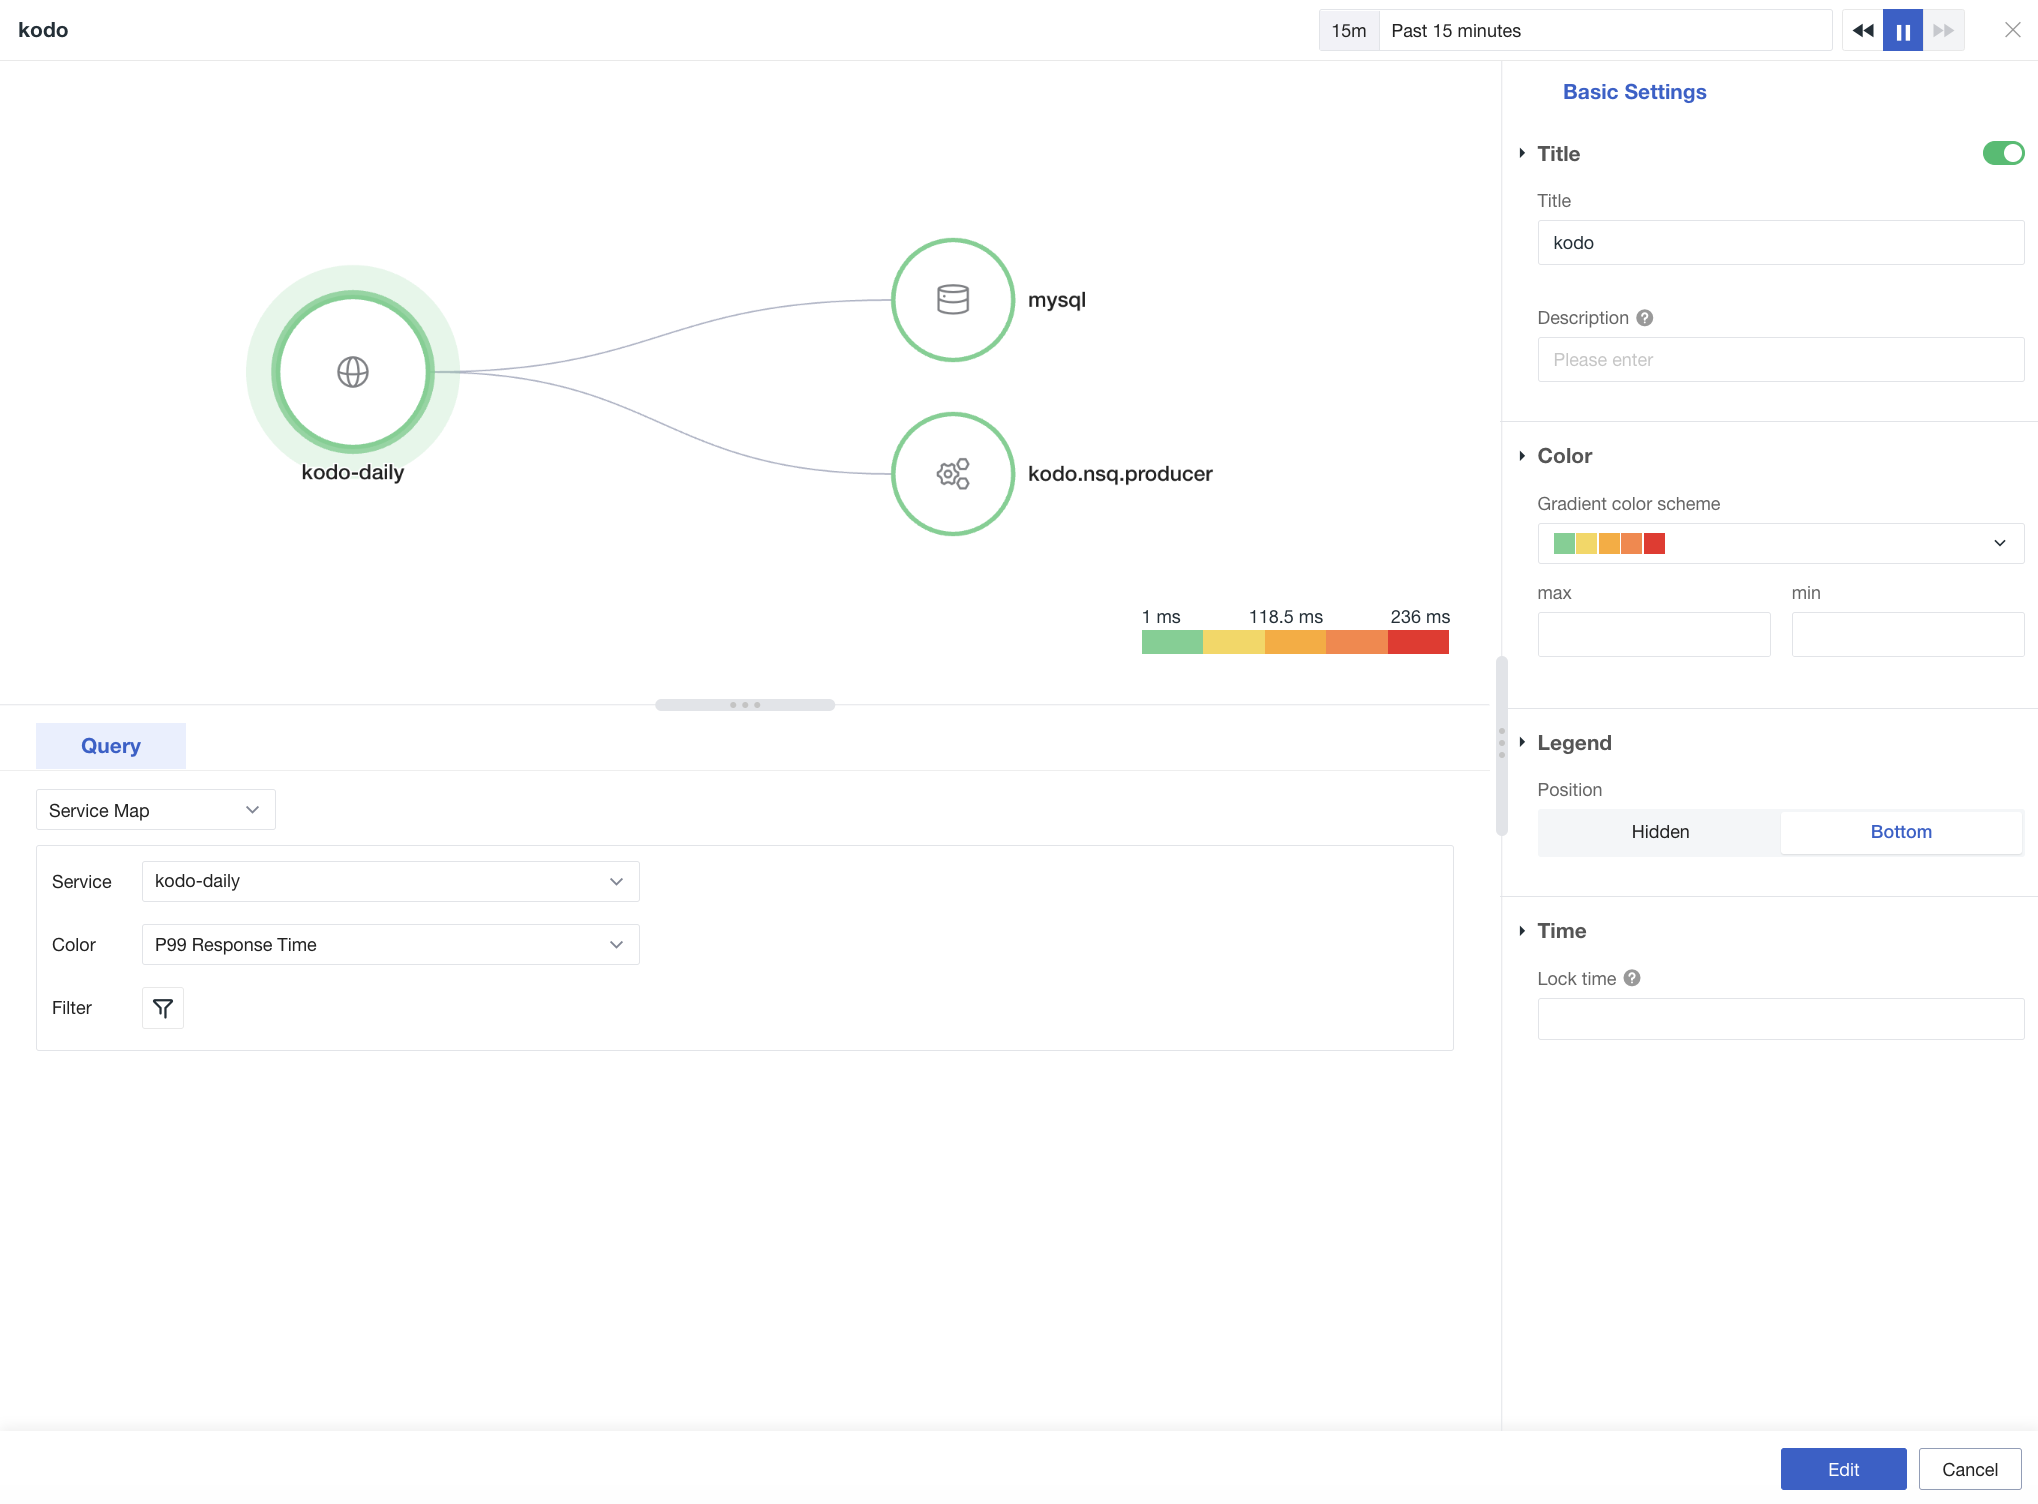
- Service Name: You can choose all relevant view variables or specific values.
- Color Fill: Includes request count, P50 response time, P75 response time, P99 response time, and error rate.
- Filter: Optional fields include
env,version,project, andsource_type.
Click on a service icon to view its upstream and downstream associations, service overview, logs, and other information.
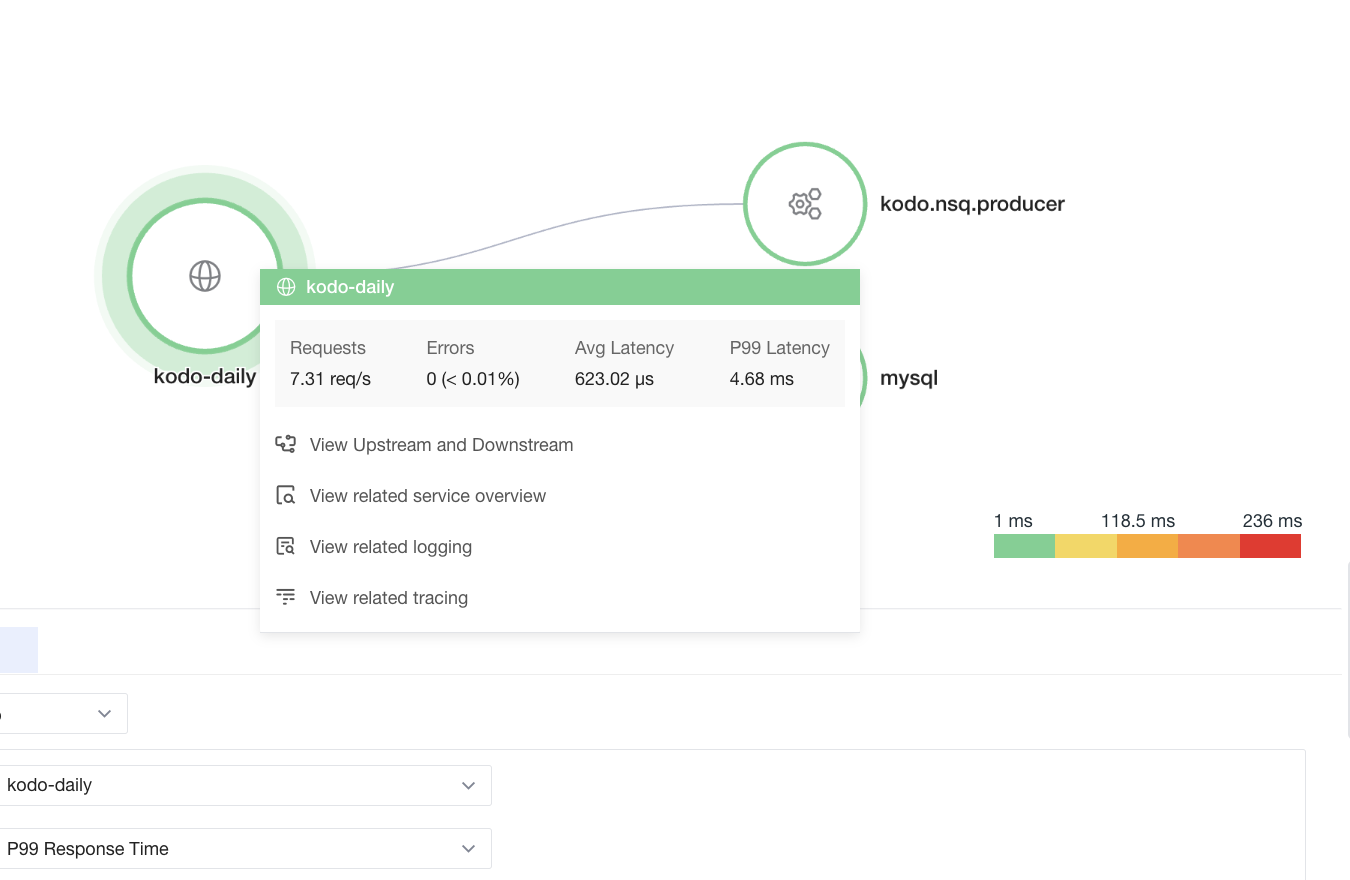
This also supports Service Map cross-workspace queries.
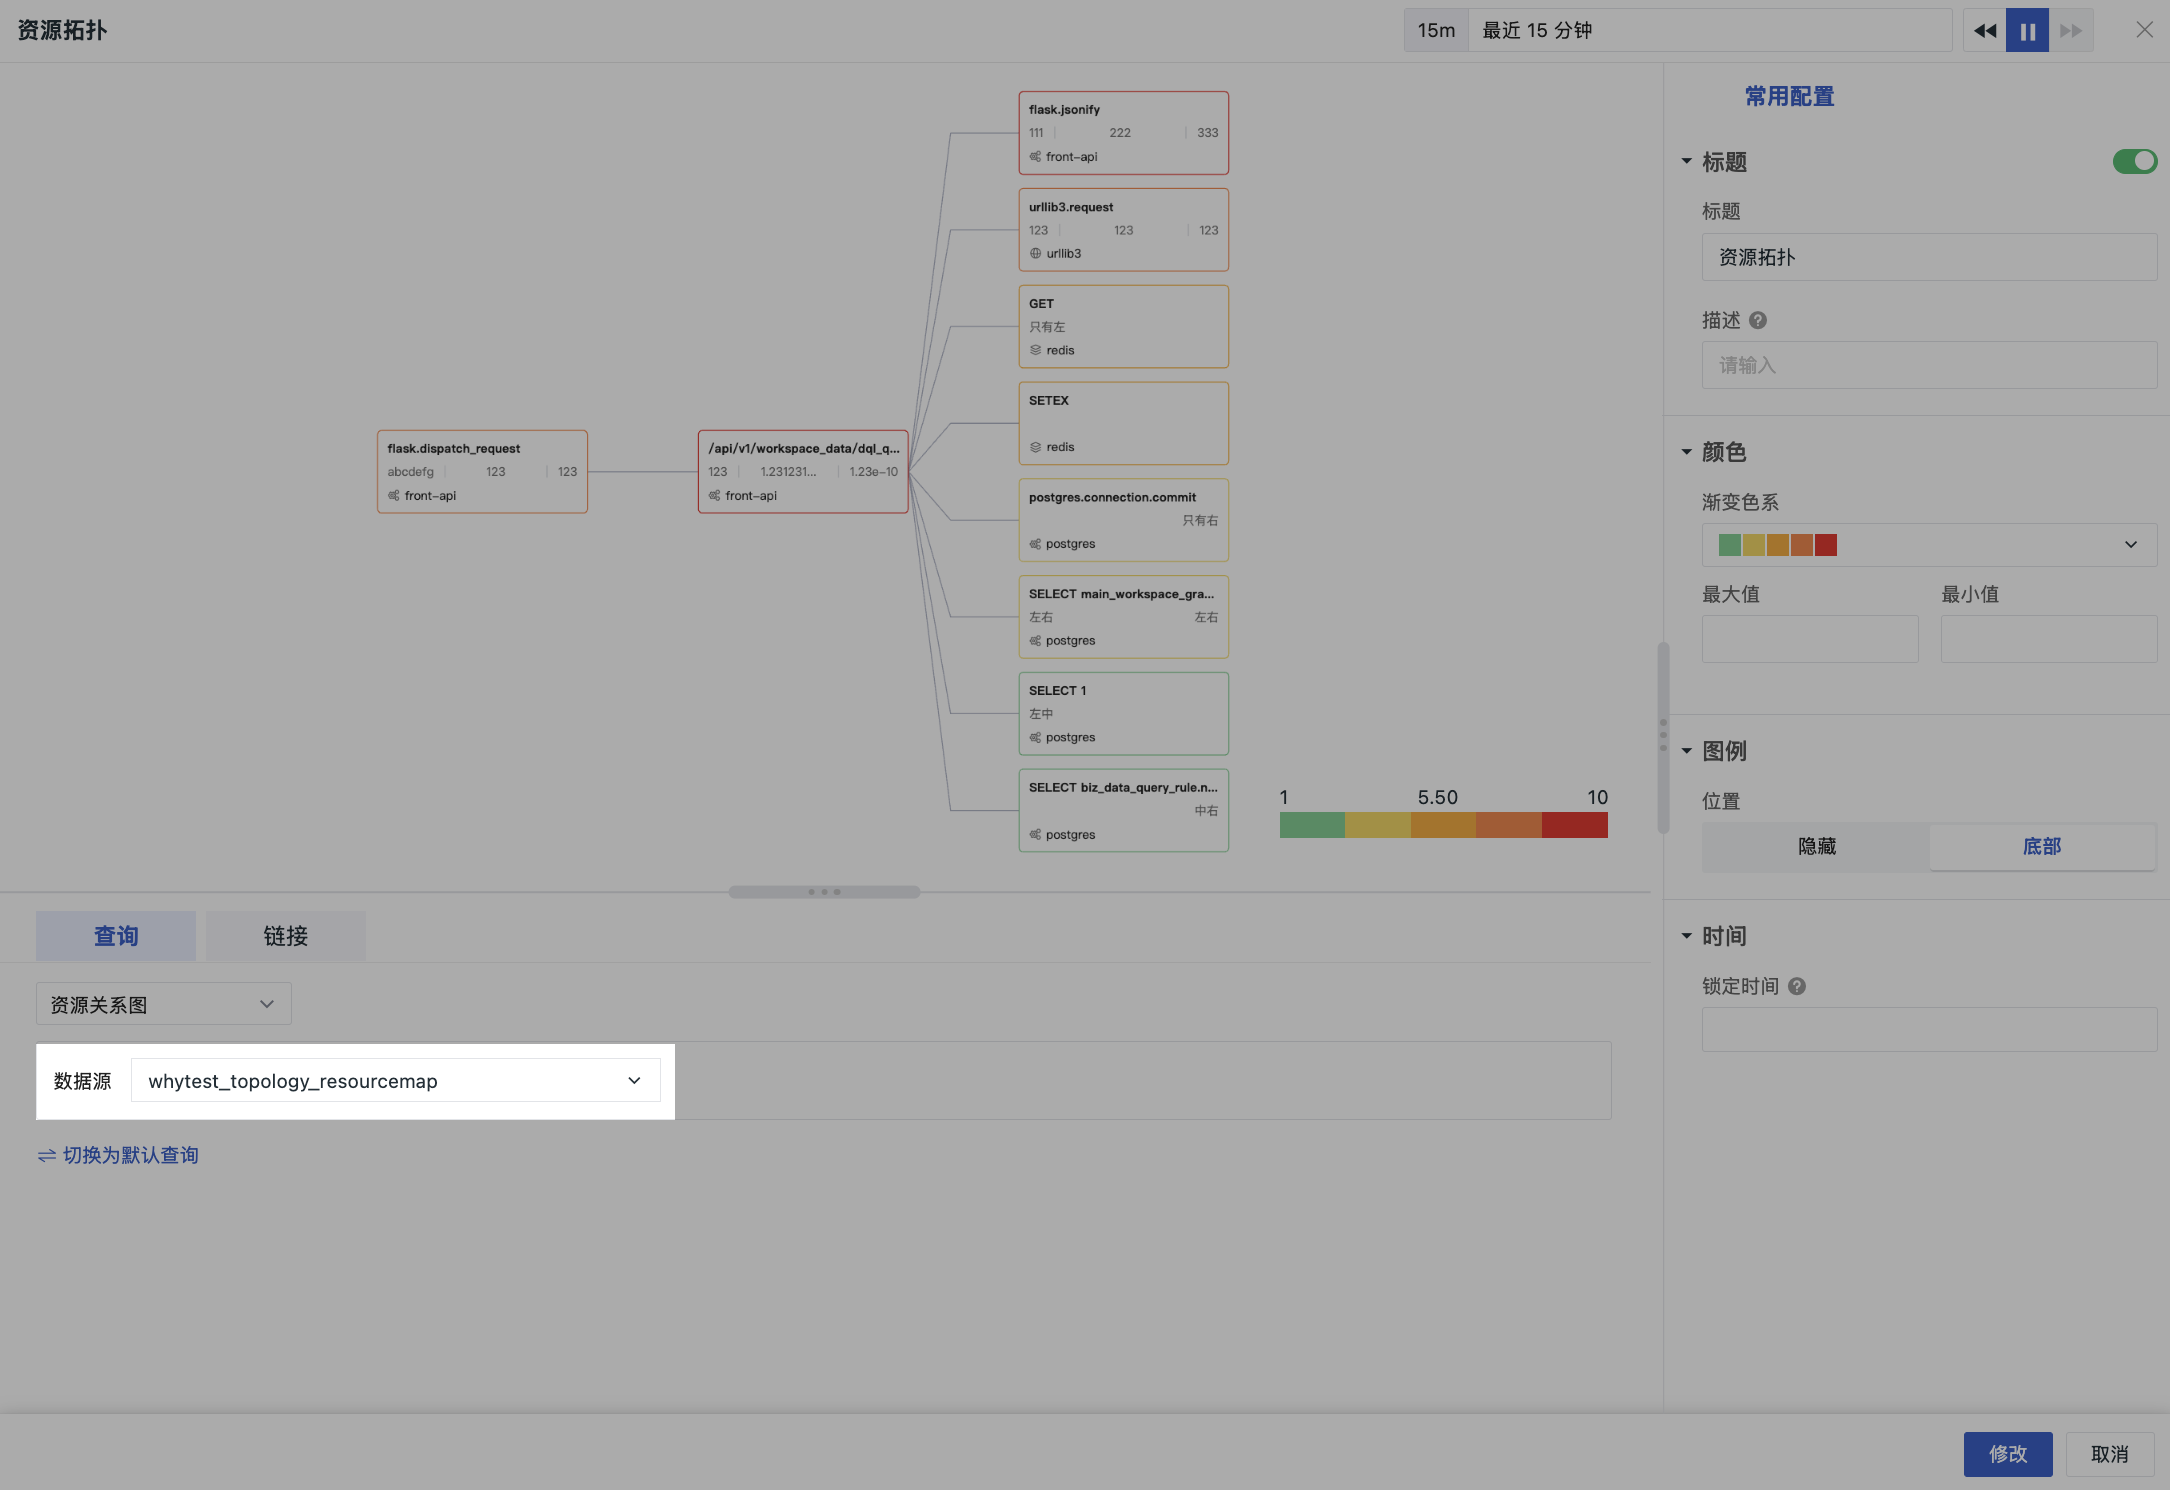
Resource Relationship Map
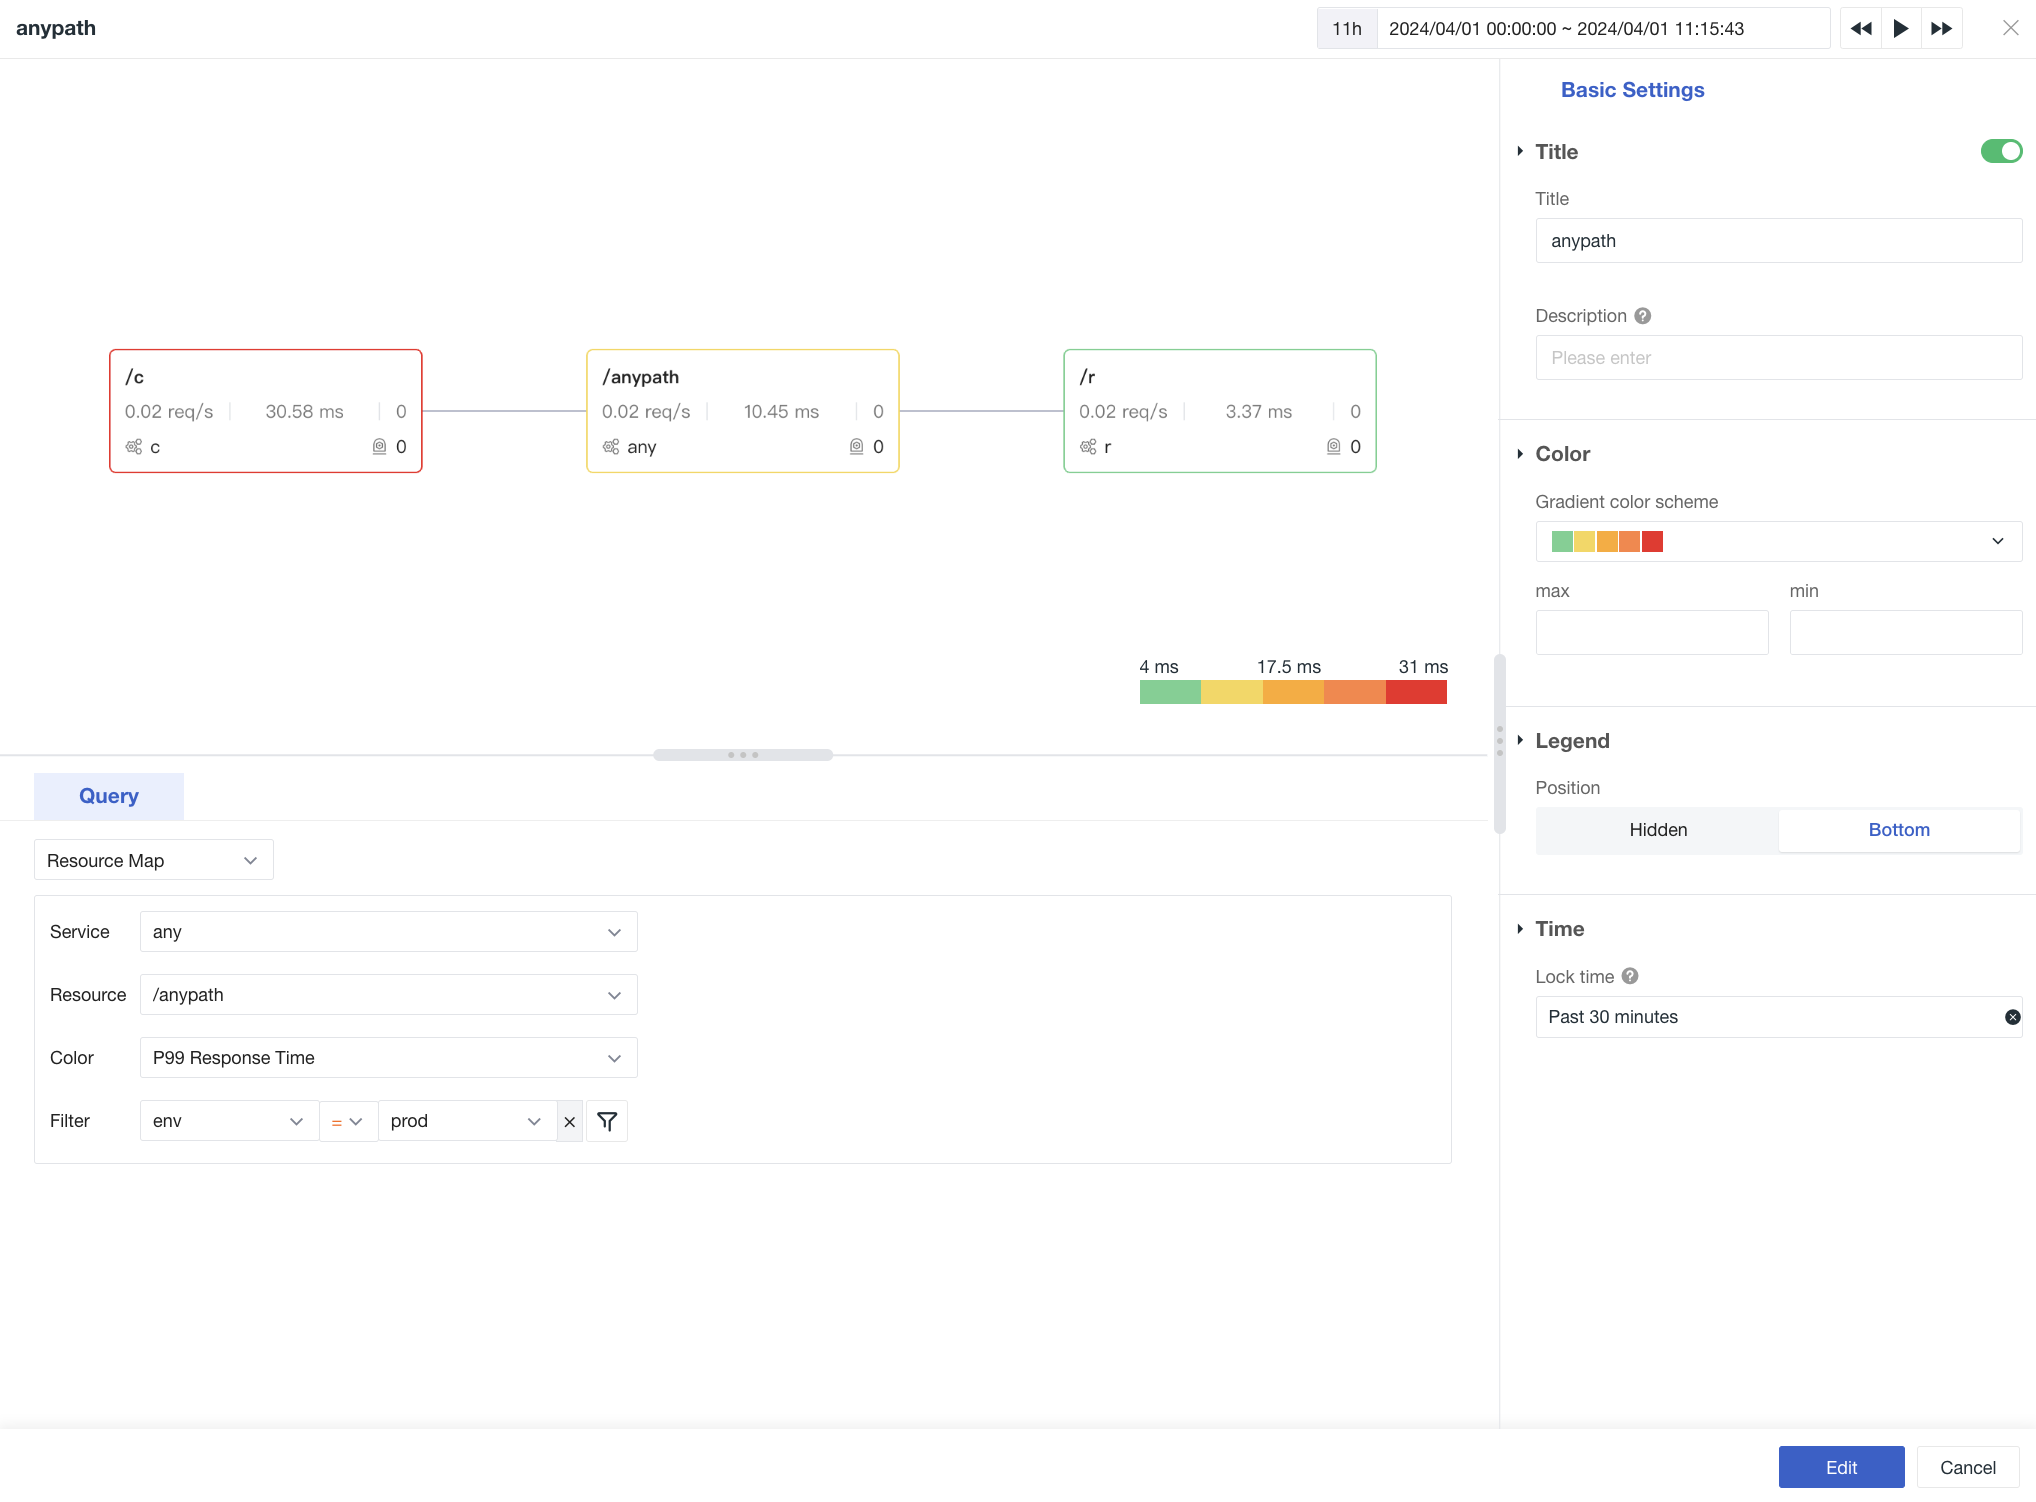
- Service Name: You can choose all relevant view variables or specific values.
- Resource Name: You can choose all relevant view variables or specific values.
- Color Fill: Includes P99 response time, request error rate, and event status.
- Filter: Optional fields include
envandversion.
Note
The Resource Relationship Map only supports drawing for a single resource. Therefore, when Resource Name is set to a single value, the Service Name must also be a single value. If the Service Name is set to a view variable that contains multiple values, the chart will report an error.
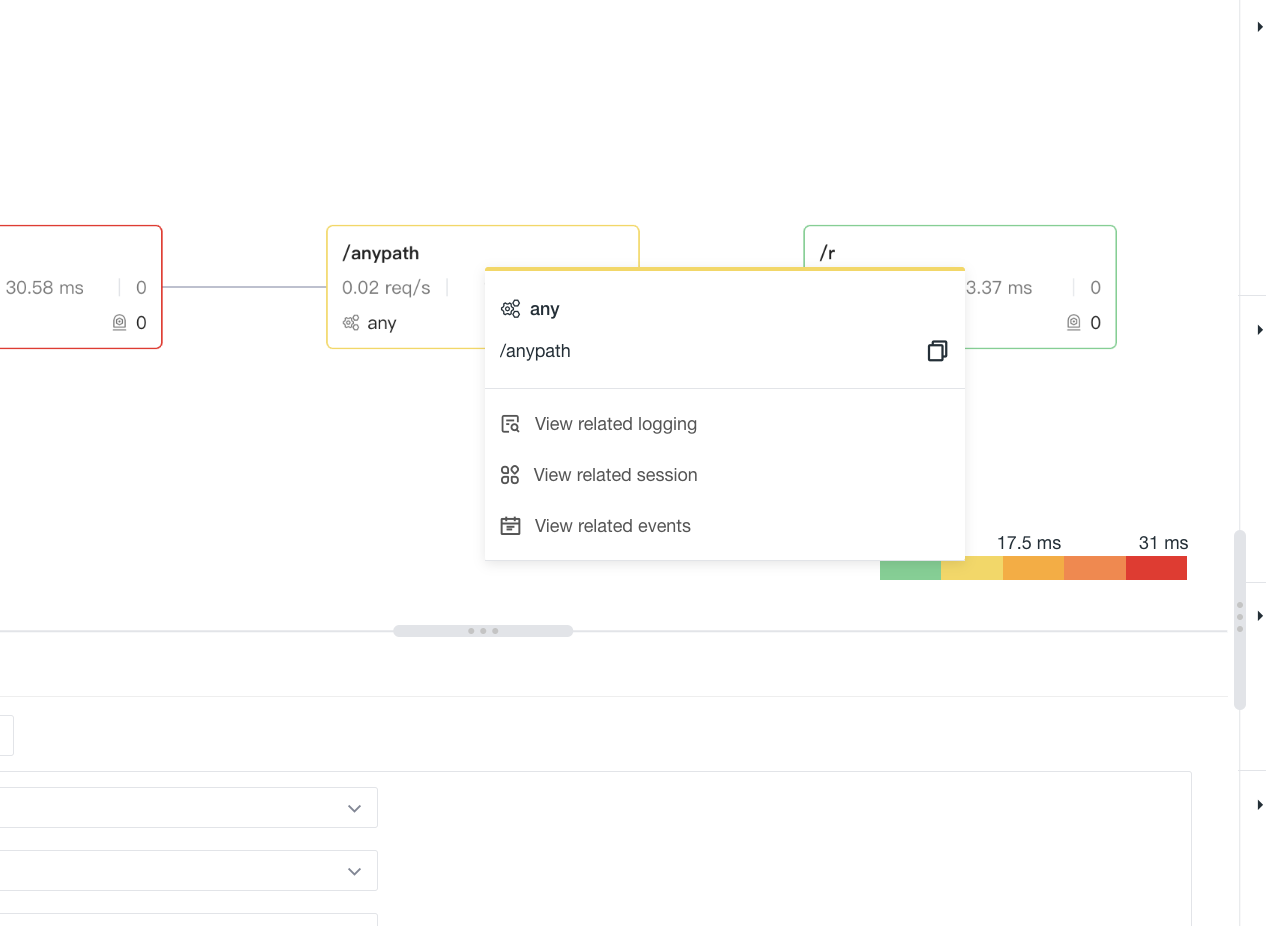
Click on a resource icon to view related logs, user access, events, and other information.
External Data Query
Through external data queries, you only need to report data according to the system-defined data structure. You can use any data to draw topology maps and achieve final chart generation and display through local Function functions.
For details on the topology map data structure required for data integration, refer to Related Interface Response Data Description.
Chart Configuration
For more details, refer to Chart Configuration.