Chart Links
Introduction
Guance supports built-in association links and custom association links for charts, which can help you jump from the current chart to the target page and transfer data information through the corresponding variable values in the links by modifying template variables to complete data linkage.
Note: Chart links support relative path addresses.
Variable Description
The Guance supports 3 types of template variables, namely, time variables, label variables and view variables.
| Variable Type | Variable | Description |
|---|---|---|
| Time variable | #{TR} | The time range of the current chart query, e.g. time=#{TR} |
| The label variable | #{T} | All grouping labels of current chart query is to use all grouping labels of current chart query as query criteria. Suppose the current chart query is: M::datakit:(LAST(cpu_usage)) {vserion= '1.0.0-rc1' } BYhost,vserion,os`<br />Template Variables:&tags=#{T} Same as&tags={“host","os","linux"}` |
| #{T.name} | name is the name of the group label corresponding to the current chart query automatically recognized by the system. Suppose the current chart query has grouping labels“host": - Template Variables #{T.host}- tags={"host":"{T.host}"} |
|
| View Variables | #{V} | The current set of values of all view variables in the dashboard is the set of all view variables of the current dashboard as query criteria. Assuming that the view variable for the current dashboard is: "version"="V1.7.0" and"region":"cn-hangzhou" template variable &tags=#{V} same as &tags={"version": "V1.7.0", "region": "cn-hangzhou"} |
| #{V.name} | name is the name of the view variable that the system automatically recognizes as existing in the current dashboard. Assuming that the view variable "version" exists in the current dashboard - Template variable #{V.version}- tags={"version":"{V.version}"} |
There are several common uses of view variables in links.
1)&tags=#{V} ,Conditions for passing all view variables in a link
2)&tags={"version":"{V.version}"}, the condition that only the view variable version is passed in the link
3)&tags={"host": "#{V.host}"}, the condition to pass the tag host in the link, the host value is the selected value of the current view variable host
Built-in links
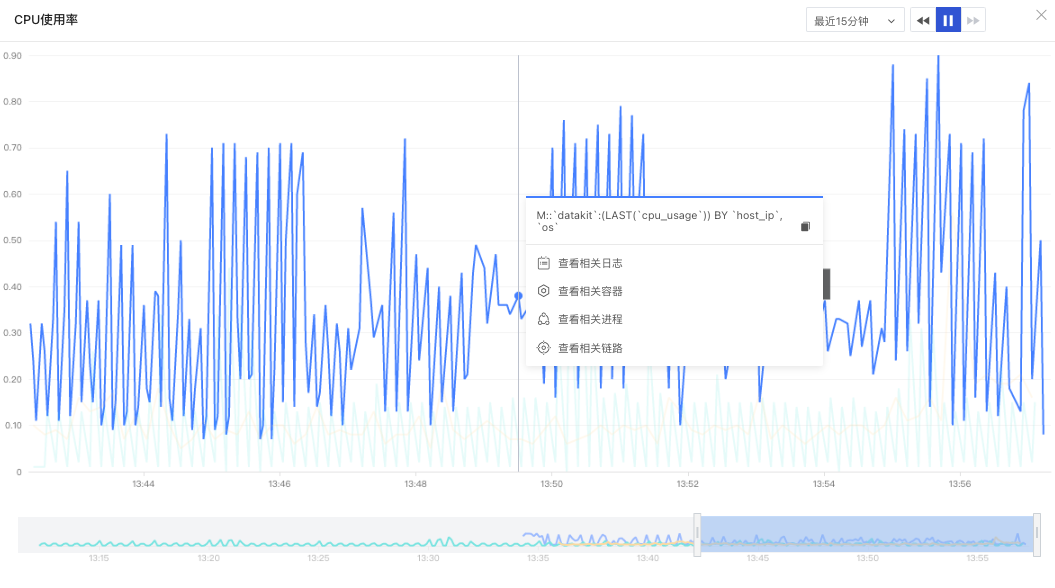
Built-in links are the default associated links provided by Guance for charts, mainly based on the time range and grouping labels of the current query, to help you view the corresponding logs, processes, containers, links, Built-in links are turned off by default, and can be turned on to display when editing charts.
- View related logs: query related logs based on the grouping tags of the current query, i.e. add the current grouping tags as filtering criteria, support jumping to the log explorer to view details
- View Related Containers: Based on the grouping tags of the current query, query related containers, i.e. add the current grouping tags as filtering criteria, support jumping to the container explorer to view details
- View related processes: Based on the grouping label of the current query, query related processes, that is, add the current grouping label as a filter, support jump to the process explorer to view details
- View related links: based on the current query grouping label associated query related links, that is, add the current grouping label as a filter condition, support jump to the application performance monitoring explorer view details
Caution:
- Built-in links** do not support queries where filter conditions exist**. When your chart query has filters, you can customize the links via 「Links」.
- The built-in links** do not support queries with view variables**. When your chart query has filters, you can customize the link via 「Link」.
Custom Links
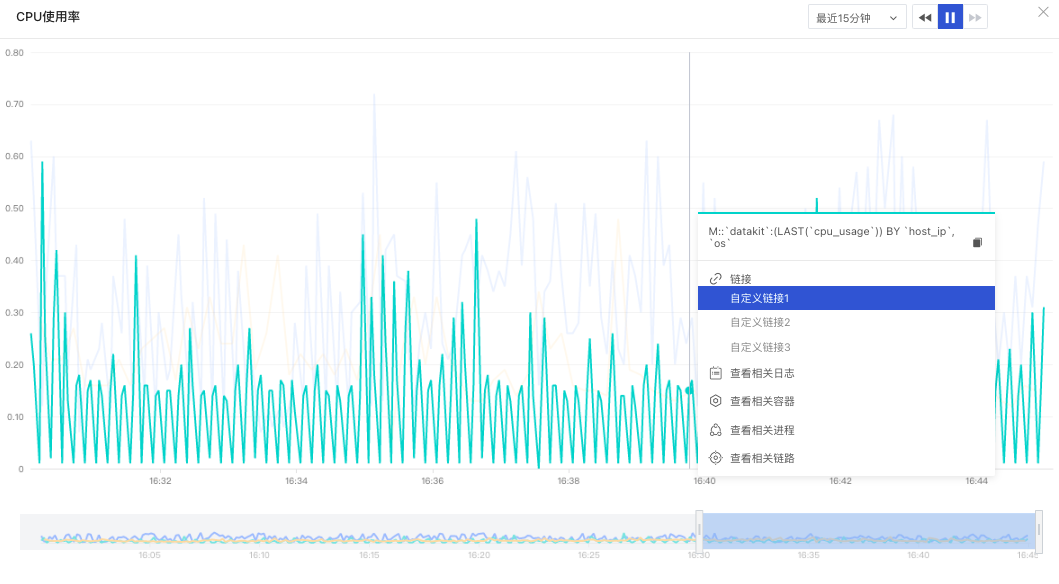
Guance supports adding custom links to charts, which can help you jump from the current chart to the target page and transfer the data information through the template variables by modifying the corresponding variable values in the links. After the custom link is added, the default display is on, and the link can be displayed directly in the chart preview.
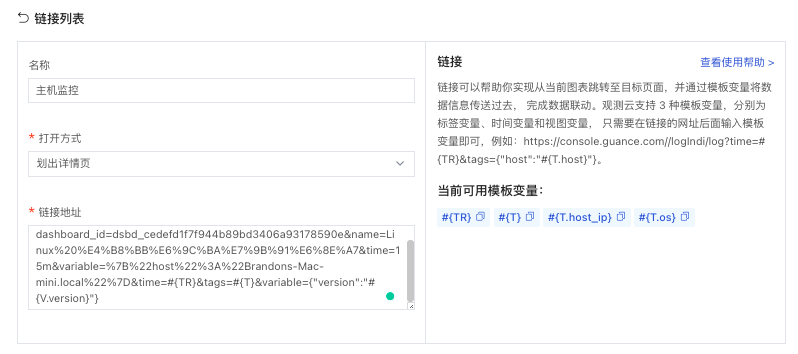
In 「Dashboard」 edit mode, select 「Chart」 - 「Link」 to view the available template variables.
1) Enter the variable template after the URL link, such ashttps://console.guance.cn/logndi/log?time=#{TR}&tags={"version":"#{V.version}"}
https://console.guance.com/logIndi/log/?for URL linkstime=#{TR}&tags={"version"="#{V.version}"}为The content of the template variable.
2) Modify the variable template in the URL link, such as
- Before using the template variables.
https://console.guance.com/logIndi/log/?
- After using the time variable.
https://console.guance.cn/logndi/log?time=#{TR}
- After using the tag variable.
https://console.guance.cn/logndi/log?time=#{TR}&tags=#{T}
- After using the view variable.
https://console.guance.cn/logndi/log?time=#{TR}&tags={"version"="#{V.version}"}
Note:
- Variables are supported to be entered after the URL link. If the URL link itself already has a time variable, tag variable or view variable, you need to modify it on the variable you have now, otherwise it will cause a conflict.
- If a variable has more than one parameter separated by
,, multiple variables are linked with&.
Link way
Guance supports three link opening methods, which are 【New Page】 【Current Page】 and 【Cross out Details Page】.
- New page: open the link in a new page
- Current page: Open the link in the current page
- Scheduled details page: Slide out the window on the side of the current page to open the link
Operation
Guance supports 「Edit」, 「Delete」 and 「Restore」 operations on chart links
- Edit: Support to modify the added links
- Delete: Delete the current link. Make sure the deleted links cannot be restored.
- Restore: Support to restore the modified links to their initial default state
Example
Prerequisite: You have already created the chart under the "Guance" dashboard and now you need to add a link to the chart.
Link to other views
Step 1: Get the URL you need to link to
Open the host monitoring view that needs to be linked in the chart and copy the URL in your browser.
Step 2: Fill in the chart link
In the chart link, paste the copied link address.
Step 3: Modify the links according to the chart link template variables
Modify the variable values in the link according to the template variable rules of the link, including time variable, label variable and view variable. Open the link by selecting the "Scratch out details page" and fill in the alias "Host monitoring view".
Step 4: Open the link in the chart preview
In the chart preview, click on the chart to bring up the custom link dialog.
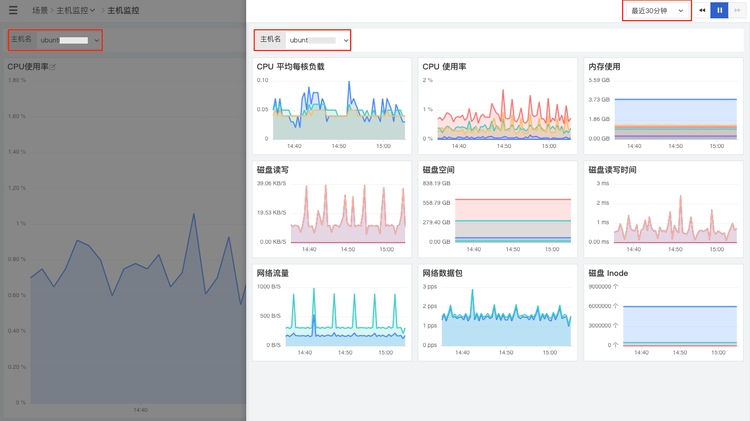
Clicking on the configured "Host Monitoring View" link opens the linked view side-by-side. As you can see, the view variables and time range are consistent with the chart.
Link to the infrastructure
Step 1: Get the URL to be linked
Copy the link URL in the "Guance" infrastructure host.
Step 2: Fill in the chart link
In the chart link, paste the copied link address.
Step 3: Modify the links according to the chart link template variables
Modify the variable values in the link according to the template variable rules of the link, including time variables and view variables (you can also use the tag variable #{T.host} here). Open the link by selecting the "Scratch out details page" and fill in the alias "Host infrastructure".
Step 4: Open the link in the chart preview
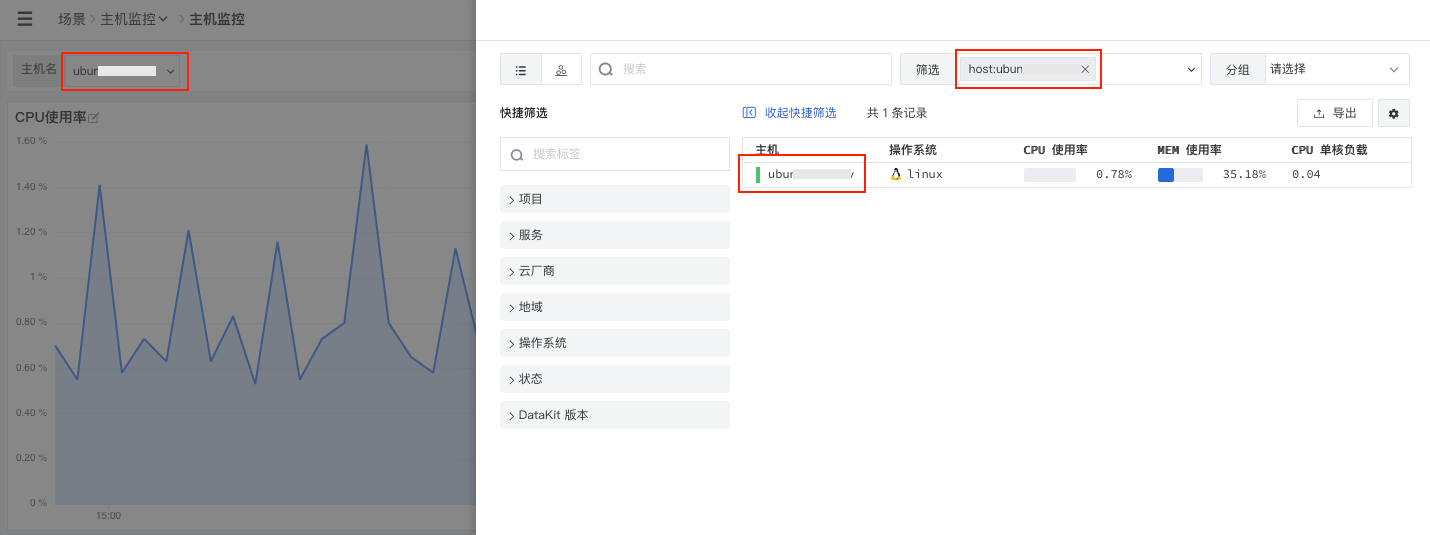
In the chart preview, click on the chart to bring up the custom link dialog. Click on the configured "Host Infrastructure" link and you can slide the link sideways to open the content. As you can see, the variable values for hosts remain consistent.
Link to external help files
Step 1: Get the URL you need to link to
Copy the link in the "Guances" help manual for timing charts.
Step 2: Fill in the chart link
In the chart link, paste the copied link address. Open the link by selecting the "Cross out details page" option and leave the alias blank.
Step 3: Open the link in the chart preview
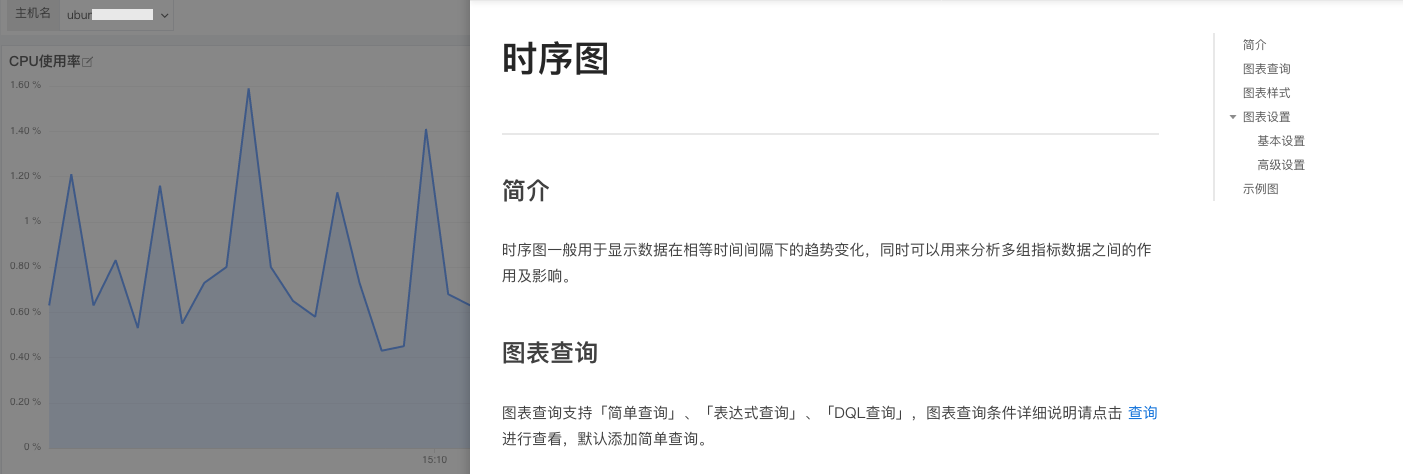
In the chart preview, click on the chart to bring up the custom links dialog. Click on the configured external link to slide sideways to open the link content. The chart can be set up according to the linked chronological chart help documentation instructions.

