Changelog (2023)
This document records the update content descriptions for each release of Guance, including DataKit, Guance Best Practices, Guance Integration Documentation, and Guance.
December 28, 2023
Guance Updates
- Monitoring:
- Added User Access Intelligent Detection: Supports performance anomalies and error analysis for websites/APPs, related detection metrics include LCP, FID, CLS, etc.
- Infrastructure Liveness Detection V2: Added Infrastructure Liveness V2 version, optimized detection logic, and resolved several triggering issues related to V1 and process detection.
- Real User Monitoring (RUM):
- Added support for receiving RUM data via Public DataWay, no collector installation required; Web-type applications support directly uploading SourceMap files in the console, allowing multiple files to be uploaded based on different versions and environments.
- Error Explorer > Error Details: Added a Formatted error information page, displaying error information parsed from Sourcemap files, supporting switching between viewing formatted and original format error information. If the Sourcemap file is not configured or no match is found after upload, only the original format error information is displayed.
- Application Performance Monitoring (APM):
- Optimized Service Topology Map: Adjusted the display styles for viewing upstream/downstream, nodes, service names, etc.
- Optimized Service Details: Bound performance view dashboards display current service performance metrics, also support custom user views with the same name for overlay updates, and support drill-down analysis.
- Optimized Trace Details flame graph and waterfall chart display: Flame graph added execution time and execution percentage display; Waterfall chart supports switching between relative time and absolute time display.
- Chart Optimization:
- Time Series Table Chart added Display Columns configuration: Supports users setting query data display columns, also supports custom manual input of column names; Supports manual adjustment of column width in edit mode, saved column width is used for list information display; Supports drag-and-drop adjustment of display column order.
- Chart links added Value Variables for link redirection.
- Dashboards:
- Dashboards added Homepage Dashboard: Supports workspace configuration of a homepage dashboard.
- Infrastructure:
- Host Explorer added Only Show Online Hosts switch filter: Logic for obtaining online host list optimized, supports choosing whether to only list hosts that have reported data in the last 10 minutes.
Guance Deployment Edition Updates
- Support embedding Guance pages into external platforms, using URL parameters to hide the left and top menu bars, and support hiding floating operations.
- Support embedding Guance dashboard or explorer pages into external platforms via iframe.
New Integrations
- Added integration Kubecost
December 14, 2023
Guance Updates
- Monitoring:
- Added Intelligent Monitoring:
- Host Intelligent Detection: Supports detection of CPU sudden increase/sudden decrease/range increase, memory sudden increase/sudden decrease/range increase.
- Log Intelligent Detection: Supports detection of log count sudden increase/sudden decrease, error log sudden increase.
- Application Intelligent Detection: Supports detection of request count sudden increase/sudden decrease, error request count sudden increase, request latency sudden increase/sudden decrease/range increase.
- Sudden Change Detection: Added trigger rule precondition, performing sudden change detection rules only when the detected value meets this condition, improving monitoring accuracy.
- Added Intelligent Monitoring:
- Billing:
- Added Data Forwarding Usage Analysis list: View the forwarding volume of all data forwarding rules in the current workspace. If the forwarding rule is to the Guance backup log module, the corresponding retention policy will be displayed. Also supports time widget filtering for the required data forwarding situation list, facilitating quick viewing of historical log backup overall status.
- Events:
- Added Intelligent Monitoring Event Explorer: Can view all event information generated by intelligent monitoring.
- Logs:
- Data Access added [Only show rules related to me] configuration: When enabled, only displays access rules that affect the current account's data query.
- Logs > Explorer: Added data access rule restriction prompts.
- Infrastructure > Containers > Kubernetes:
- Added Kubernetes analysis dashboard: Container object analysis dashboard, helping you understand the status of various infrastructures in Kubernetes from different dimensions.
- Containers > Explorer: Page UI optimized.
- Metrics:
- Metrics > Explorer:
- Table chart added [Query Tool] mode: Return results are consistent with Shortcut > Query Tool; If multiple queries are added, the first query result is returned by default; This mode supports exporting up to 1000 query records.
- Added query condition [Copy] function, optimizing page experience.
- Query component optimization: Simple query's [by grouping] supports free drag-and-drop adjustment of order.
- Metrics > Explorer:
- Explorers:
- Adjusted all explorers, trend chart is hidden in analysis mode.
- SSO:
- Optimized SSO user workspace listing logic, fixed issue of automatic logout due to lack of access permissions.
Guance Deployment Edition Updates
- Added Independent Alert Notification Sending configuration: When this configuration is enabled and the alert policy selects the [Do not aggregate alerts] option, each event will send an alert notification, helping you manage alert notifications efficiently.
- Added Event Link Login-Free Viewing configuration: When this configuration is enabled, all event-related links built into alert notifications sent from the workspace can be accessed without login. If this configuration is turned off, all historical login-free links will become invalid, ensuring data security.
- Optimized [Scheduled Reports]: Supports custom configuration of query range, upper limit adjusted from 30 days to 360 days, meeting your extended needs for scheduled reports.
New/Updated Integrations
- Added APISIX
- Updated Alibaba Cloud KafKa
- Updated Dameng
November 30, 2023
Guance Updates
- Monitoring:
- Create Monitor > Event Content > Insert Link: Supports automatically generating jump links based on detection metrics, allowing adjustment of filter conditions and time range after inserting the link; Supports custom jump links.
- Alert Strategy Management: Added [Intelligent Aggregation] mode, allowing you to cluster and group events generated within a cycle based on "title" or "content", each group will generate one alert notification.
- Management:
- Overall style optimization of the module menu pages.
- Added [Attribute Claims]: Helps quickly identify and perform linked queries globally through fixed fields
organization,business. - Added [Regular Expressions]: Can switch to view [Custom] and [Template Library] lists; Supports users customizing regular expression templates and applying them to [Snapshot Sharing] and [Data Access Rules].
- Ticket Management:
- Tickets changed from "account level" to "workspace level", all members can view all tickets within the workspace.
- Added [All Tickets] list, [Submitter], and [My Tickets] list.
- Workspace Management: Added risk confirmation prompt for解散 workspace operation.
- Workspace [Description] function offline.
- Data Forwarding: Query and statistics adjustment and optimization
- Query side: Adjusted content display data range, by default displays data content other than
time. - Made some robustness optimizations for the data forwarding function.
- Query side: Adjusted content display data range, by default displays data content other than
- Logs:
- Data Access:
- Added data desensitization rules, supports configuring multiple fields and applying multiple regular expressions.
- Supports configuring all [Indexes] and [Roles].
- Added desensitization preview to judge if the rule meets requirements.
- Data Access:
- Snapshots > Share Snapshot:
- Share link validity period added 1, 3, 7 days, default selected is 1 day.
- Data Desensitization: Supports configuring multiple fields and applying multiple regular expressions.
- Supports previewing snapshots, you can preview the page effects of all configured items in advance.
- RUM: [Create Application] page layout adjusted, optimized user experience.
- Pattern Analysis:
- RUM > Error Explorer & APM > Incident: Pattern analysis mode adjusted to
drain()algorithm clustering logic; Added input box to modify clustering fields, default iserror_message, up to 3 fields can be entered, custom clustering fields can also be added as needed.
- RUM > Error Explorer & APM > Incident: Pattern analysis mode adjusted to
Guance Deployment Edition Updates
- Added support for customizing email header/footer and Logo display text.
- Guance will cancel the setting of Banner information and will no longer provide support for maintaining Banner information.
New Integrations
- Added logstash
New Best Practices
- Best Practices for Bidirectional Linkage Between Incident and JIRA
November 21, 2023
Guance Updates
- Management: [Settings] page added MFA Security Authentication switch. Once enabled by an administrator/owner, all users (regular members / SSO members) must complete MFA authentication before entering the space.
Guance Deployment Edition Updates
- Added MFA Security Authentication switch, supports identity authentication via system default or custom methods.
November 16, 2023
Guance Updates
- Monitors:
- [Alert Mute] function restored, still allows defining the time interval for repeated alert notifications through alert mute configuration.
- Removed the restriction that "Urgent", "Important", "Warning" trigger conditions must be configured with at least one; now supports arbitrarily configuring one of the trigger conditions: Urgent, Important, Warning, Data Gap, Info.
- Infrastructure Liveness Monitoring: Supports configuring infrastructure liveness detection via metrics, allowing definition of liveness detection configurations with higher frequency through this mode.
- Scenarios
- Charts:
- Advanced Settings: [Original Interval] parameter configuration offline, default configuration adjusted to [Auto Align], supports custom selection of the chart's default data time interval.
- Time Series Chart: [Display Density] adjusted to [Max Return Points], default value is 720, supports defining any integer between 2-1000.
- Fixed the issue where alias function failed after PromQL linked view variables.
- Service Management:
- Added built-in switch dropdown, allowing direct service switching here without returning to the list.
- POD page removed from the details page.
- [Resource Invocation] performance charts changed to composite chart display, optimizing page display experience.
- Charts:
- Management
- SSO Management:
- During SSO login, workspaces support listing all authorized workspaces under the current [Identity Provider ID]; supports directly locating the target workspace through the [Search] function.
- [User SSO] added [Import/Export] function for quickly configuring single sign-on for multiple workspaces.
- Workspace Language:
- Console default display language logic adjusted, defaults to following browser language settings.
- When modifying the workspace language version, event, alert, SMS and other notification templates will also use the modified language template.
- SSO Management:
- Event associated Incident added linkage identifier:
- Unrecovered event list can identify if the current event is associated with an Incident via an icon.
- Incident: If there is event information created and associated by a monitor, the number of associated events can be quickly understood via an icon.
- Infrastructure > Hosts: Optimized the issue of inaccurate metric data sorting in the Host Explorer.
- Several optimizations to the Pipeline user experience:
- Data source selection column added prompt text for already configured Pipeline scripts.
- Log data acquisition test sample added "Index" selection, solving the issue of not getting sample data due to not using the default index.
Guance Deployment Edition Updates
- Single Sign-On: Supports dynamically appending phone number information based on returned user information when user accounts log in via OIDC.
New Integrations
- Added argocd, fluentd, redis-sentinel
November 9, 2023
Guance Updates
- Monitors > Alert Strategy Management:
- Notification configuration: Logic changed to configure single or multiple notification targets for a single severity level.
- Recovery notification logic changed: When a historically sent abnormal alert event recovers, Guance will send a recovery notification to the corresponding notification target.
- Added [Alert Aggregation]: Supports alert notification aggregation based on rule configuration, with two aggregation methods:
- Do not aggregate: In this mode, notifications are merged into one alert notification and sent to the corresponding notification object every 20 seconds.
- Rule aggregation: Four aggregation rules can be selected and alert notifications are sent based on the aggregation cycle.
- Added [Aggregation Cycle]: In rule aggregation mode, new events within 1-30 minutes will be aggregated into a notification for sending; new events exceeding the aggregation cycle will be aggregated into a new alert notification.
November 2, 2023
Guance Updates
- Management:
- SSO Management: Supports single sign-on configuration using OIDC / Oauth2.0 protocol.
- Data Permission Management: Added [Role] when adding authorization. After configuring a role, when the authorized workspace performs data viewing, data query access restrictions and desensitization restrictions will be judged based on the selected role scope.
- Data Forwarding:
- Navigation position adjusted to the [Management] module, can still be accessed via the secondary menu in the original [Logs], [Real User Monitoring], [Application Performance Monitoring] navigation bars.
- AWS S3 and Alibaba Cloud OSS support "cross-account authorization" configuration, enabling mutual authorization of data permissions between two accounts, simplifying the configuration process.
- Billing:
- Supports data forwarding to Guance internal storage, statistics on the data capacity size saved to Guance storage objects when daily billing is calculated.
- Events > Unrecovered Events:
- Currently, the unrecovered events list saves event data from the last 24 hours.
- Added display preference: Default displays [Standard] mode, supports selecting [Extended] mode to open the historical trend of event detection result values.
- Supports exporting the current event list to CSV.
- Event details page added Extended Fields Tab page; Basic Attributes Tab page optimized.
- Infrastructure > Network:
- Optimized [Overview] template, added quick filters, users can filter and view network paths. Added 5 statistical charts, supporting analysis of sent/received bytes, TCP retransmission and other network metric information.
- Added [Network Flow] explorer, can view all L4(netflow), L7(httpflow) network flow data on the timeline.
- Other explorer detail pages have added a [Topology] mode display, allowing you to directly view the current object's upstream and downstream network relationships as well as some key network metrics.
- Scenarios:
- View Variables: Supports adding PromQL method query.
- Charts:
- Added [Data Sampling] for workspaces using Doris data storage.
- Time auto-alignment function optimized: For all metric data and Doris data chart queries, when the time auto-alignment function is enabled, the time points of returned data will be aligned to "whole seconds/whole minutes/whole hours".
- Top List, Summary Chart, Table Chart: Added [Rule Mapping], allowing configuration of corresponding font color/background color for data within mapped value ranges.
- Explorers: Analysis mode optimized, supports free aggregation queries based on data and display in chart form for analysis.
- Service Management > Resource Invocation: Resource Top List added [Requests Per Second] option.
- Synthetic Tests > Tasks: Support import, export.
- Doris log data engine temporarily does not support
with_labelslinkage query.
Guance Deployment Edition Updates
- Supports custom configuration of account session expiration time, uniformly setting Login Session Keep-Alive Time for foreground users.
October 19, 2023
Guance Updates
- Billing: Billing item [Data Forwarding] statistics logic changed to "by data forwarding rule" to count forwarded data size.
- Management
- SSO Management: Supports creating multiple SSO IDP configurations, and supports enabling, disabling operations, and enabling SAML mapping for a single IDP configuration.
- Data Permission Management > Sensitive Data Desensitization: Supports configuring sensitive data masking rules at the role level. Regular expressions can be used for desensitization during configuration, supports configuring desensitization rules for fields under a certain data type, and accordingly adds desensitization rule preview testing.
- Monitors: Added External Event Detection, generating Guance event data by sending abnormal events or records from third-party systems to the HTTP server via a specified URL address using a POST request.
- Scenarios
- Service Management > Resource Invocation: Added quantity sorting for the corresponding list, default from large to small.
- Chart Links: Added passing the start time and end time of the currently selected data point as parameters, the variables are
#{timestamp.start},#{timestamp.end}. - Chart Aliases: Configured based on the legend series.
- Table Chart: Added [Time Series Table Chart].
- Metrics > Metric Analysis: Table chart added [Time Series Mode].
Guance Deployment Edition Updates
- Added custom mapping rule configuration: Enabling this configuration allows the corresponding workspace to define custom mapping rules. The custom mapping rules of the workspace have higher priority than the mapping rules in the management backend.
- Added query quantity upper limit: Customized limits on the number of queries for different user workspaces to avoid low cluster query performance due to excessive query data volume, affecting product experience.
- Local accounts added password change.
Integration Updates
- Abnormal Event Linkage with PagerDuty: When our applications or systems encounter abnormalities, they usually need to be handled promptly to ensure normal system operation. To better manage and track abnormal events, we can send these events to PagerDuty to create events, allowing us to track, analyze, and resolve these issues within PagerDuty. By quickly sending abnormal events to PagerDuty to create events, we provide better ability to manage and track abnormal events, thereby better ensuring normal system operation. At the same time, this method can also help us better analyze and solve problems, improving system stability and reliability.
September 26, 2023
Guance Updates
- Scenarios > Service Management: Resource Invocation added [Upstream/Downstream Topology] component, users can view the upstream and downstream resource invocation relationships of the current resource.
- Logs > Data Forwarding: Data forwarding rule query supports RUM, APM data.
September 21, 2023
Guance Updates
- Logs:
- Data Forwarding: Added external storage forwarding rule data query; Supports enabling/disabling forwarding rules.
- Bind Index: LogEasy added tag binding, enabling finer-grained data scope query authorization capabilities.
- Infrastructure > Custom:
- The concept of [Default Attributes] changed to [Required Attributes]: Reported data must contain this attribute field, otherwise the report will fail.
- Supports adding the resource catalog to the secondary menu for easy viewing.
- Custom explorer added quick filters.
- Scenarios:
- Scheduled Reports: Added three notification methods: [DingTalk], [WeCom], [Lark].
- Charts: [Time Series Chart, Pie Chart, Bar Chart, Histogram, Scatter Plot, Bubble Chart, Table Chart, Treemap, Funnel Chart, Top List, Map, Hexbin Chart] added data format, can define [Decimal Places] and [Thousand Separator].
- Monitoring > Notification Targets Management: Mail group type offline, already created ones are unaffected.
- Snapshots: Share Snapshot: Added IP whitelist access restriction.
- Incident: [Level] supports custom creation; Supports enabling/disabling default levels.
- Integrations > Extensions: DataFlux Func (Automata) and RUM Headless now support international sites: Oregon, Frankfurt, Singapore.
Integration Updates
Huawei Cloud:
-
Huawei CCE: Guance supports monitoring the running status and service capabilities of various resources in CCE, including Containers, Pods, Services, Deployments, Clusters, Nodes, Replica Sets, Jobs, Cron Jobs, etc. You can install
DataKitin Kubernetes via DaemonSet method to complete data collection for Kubernetes resources. Finally, monitor the running status of various Kubernetes resources in real time in Guance. -
Huawei CSS(Elasticsearch): The core performance metrics of Huawei Cloud Search Service CSS for Elasticsearch include query latency, indexing speed, search speed, disk usage, and CPU usage, which are key indicators for evaluating and optimizing Elasticsearch performance.
-
Huawei SYS.AS: The core performance metrics of Huawei SYS.AS include CPU utilization, memory usage, disk I/O, network throughput, and system load, which are key indicators for evaluating and optimizing the performance of the auto-scaling system.
-
Huawei ASM: Output the link tracing data of Huawei Cloud's ASM to Guance for viewing and analysis.
AWS:
-
AWS CloudFront: The core performance metrics of AWS CloudFront include total requests, data transfer volume, HTTP error rate, cache hit rate, and latency, which can help users evaluate and optimize the performance of the content delivery network.
-
AWS MediaConvert: AWS MediaConvert includes data transfer, video errors, job count, padding, etc.
-
AWS Aurora Serverless V2: AWS Aurora Serverless V2, including connections, IOPS, queues, read/write latency, network throughput, etc.
-
AWS Redshift: The core performance metrics of AWS Redshift include query performance, disk space usage, CPU utilization, database connections, and disk I/O operations, which are key indicators for evaluating and optimizing data warehouse performance.
-
AWS Simple Queue Service: The display metrics of AWS Simple Queue Service include the approximate age of the oldest undeleted message in the queue, the number of messages that are delayed and cannot be read immediately, the number of messages in flight, the number of messages that can be retrieved from the queue, etc.
-
AWS Timestream: The display metrics of AWS Timestream include the number of system errors (internal service errors), the sum of invalid requests for the current AWS region and current AWS account, the time elapsed for successful requests and the number of samples, the amount of data stored in memory, and the amount of data stored in magnetic storage, etc.
-
AWS Neptune Cluster: The display metrics of AWS Neptune Cluster include cold start time, execution time, number of concurrent executions, and memory usage. These metrics reflect the response speed, scalability, and resource utilization of the Neptune Cluster function.
September 7, 2023
Guance Updates
- Scenarios > Dashboard/Explorer: Added global Cross-Workspace Query configuration.
- Scenarios > Chart Query: Time widget range less than or equal to [Last 15 minutes], auto-align time interval added "1 second" display.
- Scenarios > Service Management:
- Service List added binding multiple built-in views to analysis dashboards; Added association, team information.
- Added Resource Invocation analysis dashboard.
- Supports saving snapshots.
- Logs > Backup Logs:
- Officially renamed to Data Forwarding.
- Added Trace, User Access data sources.
- The original backup logs billing item name changed to data forwarding billing item.
- Logs > Explorer: Added new monitor creation entry; Supports saving snapshots for explorer detail pages.
- Management:
- Global Tags: Added global tag function for unified tag management.
- Field Management: Added alias, set display column.
- Workspace Management: Function integration and page optimization.
- Member Management: The original member group definition officially changed to team.
- Sensitive Data Scanning: Added scan rule count statistics; Added jump links.
- Monitoring:
- Synthetic Testing Anomaly Detection: Added task metrics, can perform detection based on [Metric] dimension.
- Sudden Change, Outlier, Range Detection: Supports selecting all data sources.
Integration Updates
Alibaba Cloud:
- aliyun_analyticdb_postgresql: Alibaba Cloud AnalyticDB PostgreSQL metric display, including CPU, memory, disk, coordinator node, instance query, etc.
- aliyun_clickhouse_community: Alibaba Cloud ClickHouse metric display, including service status, log traffic, operation count, overall QPS, etc.
- aliyun_kafka: Alibaba Cloud
KafKaincludes message throughput, latency, concurrent connections, and reliability. These metrics reflect Kafka's performance and reliability guarantees when handling large-scale message delivery and real-time data streams. - aliyun_lindorm: Includes high-throughput, low-latency data read/write capabilities, supports high-concurrency transaction processing, and provides strongly consistent and highly reliable data storage and query services.
- aliyun_polardb_1.0: Alibaba Cloud PolarDB Distributed 1.0 display metrics include CPU utilization, memory utilization, network bandwidth, and disk IOPS.
- aliyun_polardb_2.0: Alibaba Cloud PolarDB Distributed 2.0 displays metrics for the compute layer and storage nodes, including CPU utilization, connection usage, disk usage, disk usage rate, memory utilization, network bandwidth, etc.
- aliyun_rds_postgresql: Alibaba Cloud RDS PostgreSQL metric display, including CPU usage, memory usage, etc.
- aliyun_rocketmq5: Alibaba Cloud RocketMQ 5.0 display metrics include message throughput, latency, reliability, and horizontal scalability, etc.
AWS:
- aws_dynamodb_DAX: AWS DynamoDB DAX display metrics include CPU usage of nodes or clusters, bytes received or sent on all network interfaces, number of packets, etc. These metrics reflect the operating status of DynamoDB DAX.
- aws_memorydb: The core performance metrics of AWS MemoryDB include low-latency memory read/write capabilities, high-concurrency transaction processing capabilities, and linearly scalable storage capacity and throughput.
Huawei Cloud:
- huawei_functiongraph: HUAWEI FunctionGraph display metrics include invocation count, error count, rejected count, concurrency count, reserved instance count, running time (including max running time, min running time, average running time), etc. These metrics reflect the running status of FunctionGraph functions.
- huawei_kafka: Includes message throughput, latency, concurrent connections, and reliability. These metrics reflect Kafka's performance and reliability guarantees when handling large-scale message delivery and real-time data streams.
- huaweiyun_SYS_DDMS: Huawei Cloud SYS.DDMS monitoring view display metrics include message throughput, latency, concurrent connections, and reliability. These metrics reflect DDMS's performance and reliability guarantees when handling large-scale message delivery and real-time data streams.
Tencent Cloud:
- tencent_keewidb: Tencent Cloud KeeWiDB metric display, including connections, requests, cache, key, slow queries, etc.
- tencent_mariadb: Includes high-performance read/write capabilities, low-latency query response time, and supports high-concurrency transaction processing and scalability.
- tencent_memcached: Includes high-speed memory read/write capabilities, low-latency data access time, and high-concurrency access processing capabilities.
- tencent_tdsql_c_mysql: Includes high-throughput read/write capabilities, low-latency query response time, and supports high-concurrency transaction processing and scalable performance.
Others:
- openai: OpenAI display metrics include total requests, response time, request count, request error count, and consumed tokens.
- monitor_jira: When our applications or systems encounter abnormalities, they usually need to be handled promptly to ensure normal system operation. To better manage and track abnormal events, we can send these events to Jira to create events, allowing us to track, analyze, and resolve these issues within Jira. By quickly sending abnormal events to Jira to create events, we provide better ability to manage and track abnormal events, thereby better ensuring normal system operation. At the same time, this method can also help us better analyze and solve problems, improving system stability and reliability.
August 29, 2023
Guance Updates
- Scenarios > SLO Charts: Added downtime display.
- Deployment Edition: Management backend Mapping Rules added option to apply adaptation rules only to newly joined members. When the user enables this option, mapping rule adaptation only takes effect for members joining for the first time.
August 24, 2023
Guance Updates
- Billing Items:
- Backup Logs: Added four archive type billing items: OSS, OBS, AWS S3, Kafka. Summarizes forwarded traffic size based on the user-selected corresponding archive type, and bills accordingly.
- Application Performance Trace, User Access PV added 30-day/60-day data storage policies.
- Monitoring:
- Mute Rules: Supports configuring alert silence based on different dimensions.
- Monitors: Supports adding tags to monitors, filtering lists based on tags; Monitor list added quick filter column, and some optimizations were made to the list.
- SLO: Added Downtime display column.
- Logs > Backup Logs: Added Kafka Message Queue external storage.
- Explorers/Dashboards: Added Auto Refresh function.
- Explorer Detail Page: Added Bind Built-in View entry.
Integration Updates
- Alibaba Cloud RDS MariaDB: Alibaba Cloud RDS MariaDB display metrics include response time, concurrent connections, QPS, and TPS, etc.
- Alibaba Cloud RocketMQ4: Alibaba Cloud RocketMQ 4.0 display metrics include message throughput, latency, reliability, and horizontal scalability, etc.
- Alibaba Cloud Tair Community Edition: Alibaba Cloud Tair Community Edition metric display includes CPU usage, memory usage, proxy total QPS, network traffic, hit rate, etc.
- AWS DynamoDB: AWS DynamoDB display metrics include throughput capacity units (Capacity Units), latency, concurrent connections, and read/write throughput. These metrics reflect DynamoDB's performance and scalability when handling large-scale data storage and access.
- AWS EventBridge: AWS EventBridge display metrics include event delivery latency, throughput, event size, and scalability. These metrics reflect EventBridge's performance and reliability when handling large-scale event streams and real-time data delivery.
- AWS Lambda: AWS Lambda display metrics include cold start time, execution time, number of concurrent executions, and memory usage. These metrics reflect the response speed, scalability, and resource utilization of Lambda functions.
- HUAWEI SYS.AS: HUAWEI SYS.AS display metrics include response time, concurrent connections, throughput, and reliability. These metrics reflect SYS.AS's performance and stability when handling application requests and data interactions.
- HUAWEI SYS.CBR: HUAWEI SYS.CBR display metrics include bandwidth utilization, latency, packet loss rate, and network throughput. These metrics reflect CBR's performance and quality assurance in network transmission and bandwidth management.
- Huawei Cloud GaussDB-Cassandra: Huawei Cloud GaussDB-Cassandra display metrics include read/write throughput, latency, data consistency, and scalability. These metrics reflect GaussDB-Cassandra's performance and reliability when handling large-scale distributed data storage and access.
- Huawei Cloud GaussDB for MySQL: Huawei Cloud GaussDB for MySQL display metrics include response time, concurrent connections, read/write throughput, and scalability. These metrics reflect GaussDB for MySQL's performance and reliability when handling large-scale relational database operations.
- Huawei Cloud GaussDB-Influx: Huawei Cloud GaussDB-Influx display metrics include write throughput, query latency, data retention policy, and scalability. These metrics reflect GaussDB-Influx's performance and reliability when handling large-scale time-series data storage and query.
- Huawei Cloud GaussDB-Redis: Huawei Cloud GaussDB-Redis display metrics include read/write throughput, response time, concurrent connections, and data persistence. These metrics reflect GaussDB-Redis's performance and reliability when handling high-concurrency data storage and caching.
- Huawei Cloud GaussDB SYS.GAUSSDBV5: Huawei Cloud GaussDB
SYS.GAUSSDBV5, providing data such as CPU, memory, disk, deadlock,SQLresponse time metrics, etc. - Huawei Cloud MongoDB: Huawei Cloud MongoDB display metrics include read/write throughput, latency, concurrent connections, and data reliability. These metrics reflect MongoDB's performance and scalability when handling large-scale document storage and query.
- Huawei Cloud RDS PostgreSQL: Huawei Cloud RDS PostgreSQL display metrics include query performance, transaction throughput, concurrent connections, and data reliability. These metrics reflect RDS PostgreSQL's performance and reliability when handling large-scale relational data storage and transaction processing.
- Tencent Cloud CKafka: Tencent Cloud CKafka display metrics include message throughput, latency, concurrent connections, and reliability. These metrics reflect CKafka's performance and reliability guarantees when handling large-scale message delivery and real-time data streams.
- Zadigx: Zadigx display includes overview, automated build, automated deployment, automated testing, etc. Lark and Incident Linkage: To more conveniently obtain new Issues in Error Tracking, you can create a bot in an internal group on Lark, DingTalk, or WeCom to receive reminders for new Issues or new replies in Incident, helping to handle Issues promptly; you can also quickly reply to Issues by @mentioning the bot, improving our exception handling efficiency.
August 17, 2023
Guance Updates
- Management: Added Sensitive Data Scanning function: Achieves information masking by creating desensitization rules for data.
- New billing item: Sensitive Data Scanning Traffic: Bills based on the original traffic size of sensitive data scanned by the scan rules (per GB / day).
- Billing: The consumption analysis section is temporarily offline due to optimization and redevelopment.
August 10, 2023
Guance Updates
- New billing item:
- Scheduled Reports: Bills based on the number of times scheduled reports are sent per day within the workspace.
- Scenarios:
- Added Service Management: Service Management is a centralized entry point for accessing all key information about services. Users can view the performance and business data of different services within the current workspace, along with all associated analysis information, to quickly locate and resolve service-related issues.
- Charts all support PromQL queries and expression queries.
- Logs: Supports directly viewing context logs on the log details page; Context search range can be selected.
- Explorers: When opening a specific data detail page, supports one-click export of the current data as a JSON file.
- Application Performance Monitoring > Services > Invocation Topology: Added upstream and downstream invocation relationship tables for the current service, displaying request count, average response time, and error count for unidirectional relationships.
- Monitors > Threshold Detection: Detection metrics added Convert to PromQL Query.
- Infrastructure > Containers: Pods, Services, Deployments, Nodes, Replica Sets, Cron Jobs, Daemonset detail pages added Kubernetes Events component.
July 27, 2023
Guance Updates
- Scenarios > Dashboards: Added Scheduled Report function, allowing users to create reports based on a specific dashboard and configure scheduled email sending.
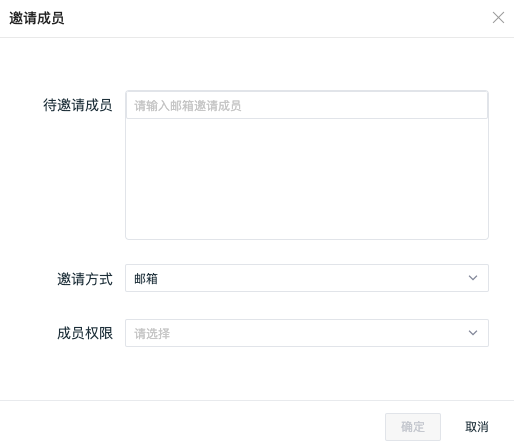
- Navigation bar added Invite Members entry, allowing quick member invitation through this entry. On the management page, added Invitation Approval button. When this button is enabled, after sending an invitation to a member, the member's join application must be moved to the invitation record for approval management.
- Logs > Backup Logs have the following adjustments:
- Guance default archive type offline:
- The [Guance] default option will no longer be supported in newly created backup rules.
- Historically created backup rules remain effective.
- Added support for backing up to external storage Alibaba Cloud OSS.
- Guance default archive type offline:
- Monitoring > Create: Supports saving monitors as Custom Template Library for users to quickly create similar type monitor detections later.
- Monitoring > Create Monitor > Custom Create: Besides [Sudden Change Detection], [Range Detection], [Outlier Detection], the detection frequency for all detection rules added [Last 12 hours], [Last 24 hours] options.
- Incident: Create Issue page added Delivery Channel configuration entry, supports multiple selection; Level added Unknown option, selected by default.
- To meet user data compliance requirements, Snapshots support desensitizing certain content for fields via regular expression syntax.
- Scenarios > Log Stream Chart added Copy as cURL, export as CSV file functions.
- Real User Monitoring > Explorer > Error: Added the Pattern Analysis function to easily view errors that occur with high frequency.
- Added data limit notification: When log, trace, and other data volumes reach today's limit, data reception will stop. Please contact your customer manager for adjustments.
July 11, 2023
Guance Updates
- Integrations upgrade: Click on any integration solution to understand the full-link usage process from configuration access and data collection to data application on the same page.
- Monitors > Templates function optimization: Supports creating based on a single detection rule or batch creation; Supports filtering based on the detection library.
- Application Performance Monitoring > Traces: Span List page added Waterfall Chart mode, helping users analyze Span data information from a more intuitive perspective; Service Invocation Relationships changed from service level to service resource (service / resource) level, drilling down to the interface level to better analyze corresponding performance and invocation issues, thus helping users discover problem points faster through interface-level invocation.
- Charts > Summary Chart: Added thousand separator; Unit > Value, "default" changed to "ten-thousand base"; Value Mapping added null value mapping.
- Charts > Treemap: Added a display value option. Selecting it allows you to directly display the query result values in the chart.
- Charts > Add Link: Added
queryparameter, removedtags,searchtwo parameters. - Application Performance Monitoring > Services list supports export.
Intelligent Inspection Updates
Function optimization:
- Application Performance Inspection: Added default detection threshold change entry, now when enabling inspection, the trigger value for the service that needs detection can be modified simultaneously.
- RUM Performance Inspection: Optimized the root cause display logic in the page details module. After optimization, root cause identification is more accurate.
- Workspace Asset Inspection: Added default configuration (7 days), now enabling inspection can run without parameters.
Added scripts:
- Cloud Message Queue RocketMQ4.0
- Huawei Cloud-CSS
- Huawei Cloud-RocketMQ
- Huawei Cloud-RabbitMQ
- Huawei Cloud-WAF-Event List
- Huawei Cloud-WAF-Event Overview
June 29, 2023
Guance Updates
This update simplifies the registration process:
- International Site Guance Product Service officially launched, users can purchase it on the AWS overseas cloud marketplace.
-
International Site Guance product adopts a pricing system in US dollars. Workspace data originally registered on the China site Oregon site will be billed according to the adjusted prices.
-
The concept of GuanceEnterprise Account is officially changed to Billing Center account.
Other updates:
- Snapshot Permissions: Read-only members support creating and deleting snapshots visible only to themselves.
June 20, 2023
Guance Updates
- RUM (Real User Monitoring) collector is used to collect user access monitoring data reported by web or mobile clients. Now provides RUM Headless one-click activation service, achieving automated installation and deployment on Guance cloud hosts, automatically completing DataKit installation, RUM collector deployment. Only manual application access is required.
- Explorers: Optimized the interaction conversion of filtering, searching and other logics, allowing users to truly achieve WYSIWYG, and freely switch between UI and handwritten modes. Also: The DQL handwritten mode supported by the log explorer will be taken offline after the new version is launched.
- Logs > Backup Logs: Added external storage type selection, supports writing to S3(AWS) object storage, supports Huawei Cloud OBS data writing.
- Logs > Indexes: Added LogEasy data binding configuration entry.
- Dashboards/Built-in views support root cause analysis and drill-down analysis.
- Management > Role Management: Supports cloning existing user roles to reduce operational steps, quickly add/remove permissions and create roles.
- Infrastructure > Containers: Added Daemonset object data display, objects can be dragged to change classification display order.
- Infrastructure > Containers: Deployments, Pods support directly associating kubernetes event logs, specific log information can be viewed directly on the details page.
- Added Incident OpenAPI interface.
- Management > Member Management list, Monitoring > Notification Targets Management > Mail Groups, Incident > View members, all places for selecting notification objects support searching by member nickname.
- When ticket status is updated or there is a new reply, the customer is reminded to pay attention via the interface or email.
- Text input box input of illegal characters or length limit prompts optimized.
Intelligent Inspection Updates
-
Added Inspection
- AWS Cloudtrail Abnormal Event Inspection: AWS CloudTrail is a service for tracking, logging, and monitoring AWS account activities. It records operations performed in the AWS account, including management console access, API calls, resource changes, etc. We can monitor CloudTrail error events to promptly discover potential security issues. For example, unauthorized API calls, access to denied resources, abnormal authentication attempts, etc. This helps protect your AWS account and resources from unauthorized access and malicious activities; it also allows you to understand the types, frequency, and impact scope of failures occurring in the system. This helps you quickly identify problems and take appropriate corrective measures to reduce service interruption time and business impact.
-
Added Scripts
- Guance Integration (Alibaba Cloud-RDS Error Log): Collects Alibaba Cloud RDS error logs for RDS error information diagnosis.
- filebeats data collector: Collects FileBeats performance data for observing FileBeats performance, latency, etc.
- logstash data collector: Collects Logstash performance data for observing Logstash performance, latency, etc.
June 6, 2023
Guance Updates
- To further meet user data viewing needs, the Commercial Edition Billing added Set High Consumption Alert function, added consumption analysis list, supports viewing various types of expenditure consumption statistics.
- When creating a workspace, added Menu Style Selection, supports choosing different workspace style attributes.
- Optimized log data access permission-related rule adaptation, further clarifying the correspondence between multi-role data query permissions and permission control.
- Detection Dimension under the basic attributes on the event details page has added an associated query, supporting viewing and filtering of associated data for all field values under the current detection dimension.
- Alert Strategy Management supports different severity levels alerting to different notification objects.
- Member Management added function to add nickname remarks, standardizing member usernames within the workspace, supports searching members by nickname remarks.
- Dashboard, explorer, monitoring, member management, sharing management page lists added batch operation functions.
- Application Performance Monitoring services support modifying colors, supports table header sorting adjustment.
- Logs, Application Performance Monitoring > Incident explorer pattern analysis supports sorting by document count, default descending order.
- Supports saving login selected language version to browser local storage, automatically displaying the last login selected language version upon next login.
- Generate metric frequency options adjusted, supports selecting 1 minute, 5 minutes, 15 minutes.
Guance Deployment Edition Updates
- Management backend added Password Security Policy: Added 8-character password length limit and password expiration function.
Intelligent Inspection Updates
-
Added Inspection
- Workspace Asset Inspection: For service inspection, it should ensure the normal operation of services, promptly discover faults or anomalies, and reduce business losses. Secondly, inspection helps improve service availability and stability, discovering and resolving potential problems. Inspection can also improve operational efficiency, accelerate problem diagnosis and resolution, and optimize resource allocation, ensuring business security. Through regular inspection of services such as hosts, K8s, and containers, operations personnel can ensure that these services can efficiently and stably support the business, providing a continuous and reliable operating environment for the enterprise.
-
Added Scripts
- Gitlab R&D Efficiency Analysis: Displays team R&D efficiency based on Gitlab's code submission frequency and each code volume, by team, individual, and time dimension.
June 1, 2023
Guance Updates
DataFlux Func is Guance's extended programming platform that can be used for syncing cloud platform data, function development, management, and execution. Now supports DataFlux Func (Automata) one-click activation service at all domestic sites. After activation, Func can be automatically deployed in cloud hosts, and you can quickly log in to the corresponding Func platform in the workspace's Integrations.
May 22, 2023
Guance Updates
- RUM application configuration added custom type and associated view viewing analysis
- DQL functions support regular expression aggregation for data statistics display and return. Added string regular expression parsing functions to extract fields based on regular expressions and determine whether substrings in the field match the regular expression.
- Added PromQL syntax query entry, supporting querying time series data via PromQL query.
- show_tag_value() function supports querying associated tags for corresponding metric fields.
- Mini Program SDK supports collecting startup parameter-related information; Added custom Error addition.
- Status Page supports subscribing to failure notifications.
- Added field management function. In locations such as monitors, chart queries, and explorers, if relevant fields are selected, the corresponding description and unit information are displayed.
- Metric Analysis added table function, supports download
- Ticket Status adjustment
- Added Incident guide page, channels added time range filter
- Backup logs optimization:
- Added Backup rule entry moved to Backup Logs > Backup Management.
- Added full backup logic: Not adding filters means saving all log data
Guance Deployment Edition Updates
- Management backend added Audit Event records
Intelligent Inspection Updates
-
Added Inspections
-
Cloud Idle Resource Inspection: Cloud computing, as a brand-new IT service model, is developing rapidly, providing convenient, fast, and elastic IT infrastructure and application services for enterprises and individuals, bringing extremely high efficiency and economy. However, as cloud resources gradually become the main component of enterprise data centers, the huge waste problem of cloud resources becomes more significant. Especially within enterprises, due to demand fluctuations and isolation between departments, some cloud resources cannot be fully utilized, forming a large number of idle resources. This situation can cause enterprise cloud service costs to soar, resource efficiency to decline, and may also reduce security and performance levels. To better manage and optimize cloud idle resources, to improve the usage benefits and resource utilization of cloud computing, conducting cloud idle resource inspection is very necessary. Through inspection, unnecessary resources in the current cloud service can be discovered and handled promptly, avoiding cost overhead, data leakage, poor performance and other problems caused by long-term unnecessary resource usage.
-
Host Restart Inspection: Host abnormal restart monitoring is an important part of modern internet system operations. On one hand, the stability and reliability of computer systems are crucial for the smooth operation of business and user experience. When hosts experience problems such as abnormal restarts, it can lead to system crashes, service interruptions, and data loss risks, thereby affecting business operations and user satisfaction. On the other hand, in cloud computing and virtualization environments, the number and scale of hosts are continuously increasing, system complexity is also constantly rising, and the probability of problems occurring is also increasing. This requires system administrators to use relevant system monitoring tools for real-time monitoring, and promptly discover and resolve abnormal restart and other problems. Therefore, reasonably implementing host abnormal restart monitoring can help enterprises quickly diagnose problems, reduce business risks, improve operational efficiency, and user experience.
-
-
Function Optimization
- Idle Host Inspection: Added association of cloud host type with cost-related information.
More Intelligent Inspection updates can be referred to Intelligent Inspection Version History.
April 27, 2023
Guance Updates
- Summary chart supports displaying multiple period comparison dimensions simultaneously (day-over-day/week-over-week/month-over-month/...)
- Standard members added snapshot sharing function
- DQL query renamed to Query Tool, added execute button
- Host list display optimized, hosts under alert silence added mute prompt
- SLO alert notification content optimized, added workspace and site information
- Optimized workspace ID and Token display logic, hidden by default, supports viewing and copying
- Free Plan workspace added Session Replay, Profile usage limits
April 23, 2023
Guance Billing Updates:
-
Guance's self-developed time-series database is newly launched. Time-series data storage and billing will be adjusted as follows:
- Infrastructure (DataKit) billing item offline, the original "DataKit + Time Series" and "Only Time Series" two billing modes will use only the self-developed time-series database's time series as the billing logic.
- Self-developed time-series database time series: Bills based on the number of active time series on the day, price as low as ¥0.6 / per thousand time series.
-
Real User Monitoring "Session Replay" officially launched paid service, bills based on the actual number of sessions collecting session replay data, ¥10 / per thousand Sessions.
For more details, please refer to the document Billing Methods.
Guance Function Updates:
- Self-developed time-series database is newly launched
- Incident new function launched
- Cross-site workspace authorization function launched
- SLS added third-party authorization activation
- Bind index configuration page optimized, supports custom adding mapping field configuration
- Chart optimization
- Command Panel added local Func's custom function selection
- Time series chart added Advanced Functions, supports local Func secondary processing based on DQL query results and return display
- Workspace added timezone configuration, users can custom configure the timezone for current workspace query time
- Integrations > DataKit page guidance optimized
- Explorer bar distribution chart added statistical time interval display
- Navigation menu supports right-click to open in new page
- Blacklist duplicate import issue fixed
Guance Deployment Edition Updates
- Added Account Login Mapping Rule Configuration, dynamically assigning the workspace members join and corresponding roles based on different mapping rules.
DataKit Updates
New Features:
-
Added Pinpoint API access
-
Function Optimization:
- Optimized Windows installation script and upgrade script output method to make it easier to directly paste and copy in the terminal.
- Optimized Datakit's own document build process.
- Optimized OpenTelemetry field processing.
- Prom collector supports collecting
infotype labels and appending them to all associated metrics (enabled by default). - In the system collector, added CPU and memory usage percentage metrics.
- Datakit adds data point marking (
X-Points) in the sent data to facilitate the construction of related metrics at the center.- Also optimized Datakit HTTP's
User-Agentmarking, changed todatakit-<os>-<arch>/<version>form
- Also optimized Datakit HTTP's
- KafkaMQ:
- Supports processing Jaeger data
- Optimized SkyWalking data processing flow
- Added third-party RUM access function
- SkyWalking added HTTP access function
- Added the following integration tests:
- Apache
- JVM
- Memcached
- MongoDB
- RabbitMQ
- Statsd
- Tomcat
- etcd
More DataKit updates can be referred to DataKit Version History.
April 13, 2023
Intelligent Inspection Updates
-
Script Market Intelligent Inspection Script Sets:
- Optimized activation steps: no need to create new scripts or new schedules. Click "Install" from the official script market, and creation and scheduling are automatically completed. Configure parameters and activation is ready.
- Updated disk usage inspection: Optimized the trend judgment algorithm for disk usage inspection, providing users with more accurate problem identification.
-
Script Market Cloud Sync Script Sets:
- Optimized activation steps: no need to create new scripts or new schedules. Click "Install" from the official script market, and creation and scheduling are automatically completed. Configure parameters and activation is ready.
- Added multiple authentication methods for AWS sync.
- Added AWS CloudWatch Logs sync.
More Intelligent Inspection updates can be referred to in the Intelligent Inspection Version History.
April 11, 2023
Guance Updates
Added Huawei Cloud Cloud Store Activation Process
- Guance added Huawei Cloud Cloud Store one-click activation Guance process. After subscribing to the Guance product on the Huawei Cloud Cloud Store, you can directly activate and use Guance. For more details, please refer to the document Activate Guance Commercial Edition on Huawei Cloud Cloud Store.
April 6, 2023
Guance Updates
- Logs added 3-day data retention policy and pricing, for billing related please refer to document Billing Methods.
- Logs added Data Access permission control, supports granting view permissions for a certain range of log data to relevant roles
- Role Permission List added data query permissions for each functional module, supports custom role configuration of data query permission entries for corresponding modules
- Standard members added "Snapshot Management" permission, supports snapshot add/delete operations
- Share Snapshot supports search function. (Log DQL query mode does not support adjusting search range)
- Supports local Func creating custom notification objects via websocket protocol, achieving external notification channels receiving alert notifications
- Explorers added copy as cURL data query function
- Dashboard chart configuration interaction optimization
- Summary Chart added numerical unit option configuration, supports choosing Chinese scientific notation carry (default) and short scale system (short scale)
- Added whether View Variables are applied to chart effect display
- When charts have grouping conditions, supports reverse applying a grouping condition value to view variables to achieve linked filtering
- When charts have grouping conditions, selecting a grouping condition corresponding to a time series or data point supports linked highlighting for other charts with the same grouping
- Chart drag-and-drop effect optimized
- Account inactivity session expiration time default adjusted to 3 hours, this adjustment only applies to accounts that have not edited the inactivity session expiration time configuration, does not affect accounts that have already edited the inactivity session expiration time configuration.
- Filter History added search condition saving
- Real User Monitoring Application SDK Access guidance optimized
- Generate Metrics configuration optimized, supports configuring units and descriptions for newly generated metrics
- Host Explorer supports multi-line display, in multi-line mode labels will start on a new line for display
- Time Series Chart, Pie Chart added return display count configuration
DataKit Updates
New Features
- Added servo service for managing Datakit upgrades
- Added troubleshooting
Function Optimization
- Optimized upgrade function to avoid datakit.conf file corruption.
- Optimized cgroup configuration, removed CPU minimum limit.
- Optimized self collector, allowing users to choose whether to enable this collector, while also making some performance optimizations to its collection.
- Prom collector allows adding instance tags to keep consistency with the native Prometheus system.
- DCA added Kubernetes deployment method.
- Optimized log collection disk cache performance.
- Optimized Datakit's own indicator system, exposing more Prometheus indicators.
- Optimized /v1/write.
- Optimized token error prompt during installation.
- monitor supports automatically obtaining connection address from datakit.conf.
- Canceled eBPF's mandatory check for kernel version, trying to support as many kernel versions as possible.
- Kafka subscription collection supports multi-line json function
- Optimized IO module configuration, added upload worker count configuration field
Compatibility Adjustments
- This release removed most Sinker functions, only retaining the Sinker function on Dataway. Also, the sinker's host installation configuration and Kubernetes installation configuration were adjusted, the configuration methods therein are also different from before. Please pay attention to adjustments when upgrading.
- The old version's send failure disk cache was replaced due to performance issues. The new implementation's cached binary format is no longer compatible. If upgrading, old data will not be recognized. It is recommended to manually delete the old cache data first (old data may affect the new version's disk cache), then upgrade to the new version of Datakit. Nevertheless, the new version's disk cache is still an experimental feature, please use with caution.
- Datakit's own indicator system was updated, the indicators originally obtained by DCA will have some missing, but does not affect the operation of DCA itself.
More DataKit updates can be referred to DataKit Version History.
March 23, 2023
Guance Updates
-
Help documentation search function optimized
-
Backup Logs added extended field saving logic, by default only backs up message content to backup logs. If "Synchronously backup extended fields" is checked, the entire log data meeting the filter conditions will be backed up.
-
Explorers/Dashboards Time Widget added "Timezone Selection" and "Global Lock" functions

-
Monitor optimization
- Supports viewing last historical configuration, supports clicking to revert to Historical Configuration Version
- List and page added creation, change information display
- Sudden Change Detection added comparison dimension, supports selecting comparison logic with "yesterday" "previous hour" statistical metrics
-
Intelligent Inspection events added effect feedback entry
- Snapshots sharing supports adding "Creator" watermark display
- Registration activation process optimized, cloud market activation path added site selection
- Notes creation logic and content addition interaction adjusted
- Chart Query added label inverse selection logic
- Trace detail page Span list display logic adjusted, sorted by "Duration" descending order
- Member Management triggered review process role modification logic adjusted
- Explorer column width saving, log display multi-line and other logics adjusted
March 9, 2023
Guance Updates
Data Storage Policy Change Optimization
Canceled the logic that data storage policy can only be modified once per day, supports users adjusting data storage policy multiple times within the same day.
Note: Except for the first modification on the day which takes effect immediately, other modification operations will take effect the next day according to the last adjustment record. For how to change, please refer to the document Data Storage Policy.
Chart Link Configuration Optimization
Chart link configuration interaction upgraded, on top of text box input, supports freely combining to generate the final chart associated link URL through parameter configuration. For more details, please refer to the document Custom Links.
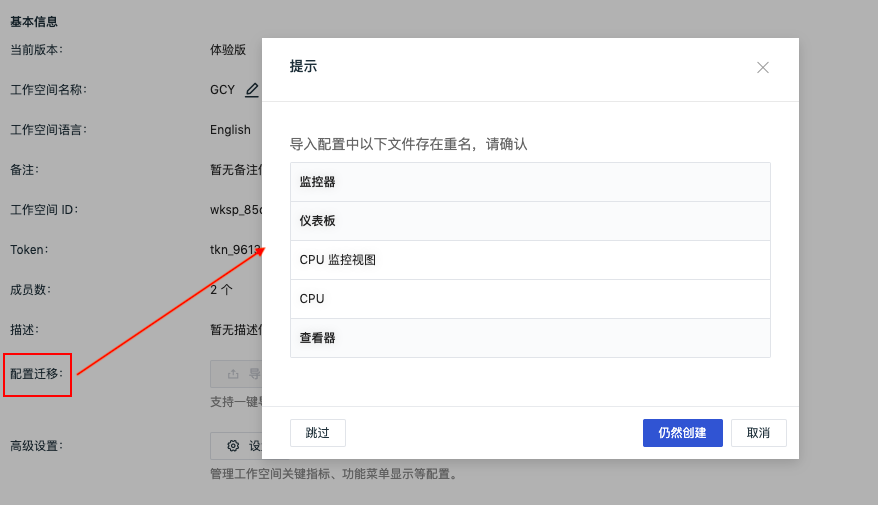
Added Support for Creating Dashboards, Notes, Custom Explorers with Duplicate Names
Optimized dashboard, note, custom explorer import function. If file name duplicates are found, supports custom choosing 'Skip', 'Create Anyway', 'Cancel' and other operations. Modules involved in import:
- Scenarios: Dashboards, Notes, Explorers
- Management: Settings - Configuration Migration
Note: If 'Cancel' is chosen after import, the selected files for that time will not be imported. For more details, please refer to the document Configuration Migration.
DQL Parameter Effect Priority Adjustment
If you use handwritten DQL mode to query data, the time parameter configuration in DQL will take priority over the time widget's input range. Functions involved:
- Dashboard: View variable default value query, chart query
- Metric Analysis
- DQL Query Tool
Log Message Data Display Optimization
Log explorer list supports choosing to display all message content. Functions involved:
- Log Explorer
- Associated log pages in various explorer detail pages
Monitor Configuration Page Optimization
When configuring monitor event notifications:
- Supports customizing "Data Gap" event notification template
- Event content supports adding jump links, besides the official provided default links, you can also customize jump links
For more details, please refer to the document Monitor Configuration.
SSO Related Optimization
- SSO users support modifying account information and session keep-alive time and other policies
- SAML account mapping rule configuration optimized, compatible with "Email" various case formats
- Single sign-on link acquisition logic optimized, for SSO users who have already joined workspaces, prioritize listing login links for workspaces you have already joined.
Other Function Optimization
- Commercial Edition activation process supports any choice of three methods: "Guance Direct Activation", "Alibaba Cloud Market Activation" and "Amazon Cloud Market Activation".
- Explorer left wildcard query function scope adjusted. Newly activated workspaces no longer support left wildcard queries by default. Please contact your customer manager if needed.
- SLIMIT limit adjusted. If a time series chart query has a
group byclause, it returns up to 20 data series by default. - Optimized the new user onboarding process for newly created workspaces.
DataKit Updates
New Features
- Pipeline supports key deletion
- Pipeline added new KV operations
- Pipeline added time functions
- netstat supports IPV6
- diskio supports io wait metrics
- Container collection allows Docker and Containerd coexistence
- Integrated Datakit Operator configuration documentation
Function Optimization
- Optimized Point Checker
- Optimized Pipeline replace performance
- Optimized Windows下 Datakit installation process
- Optimized confd configuration processing flow
- Added Filebeat integration testing capability
- Added Nginx integration testing capability
- Refactored OTEL Agent
- Refactored Datakit Monitor information
More DataKit updates can be referred to DataKit Version History.
February 28, 2023
Guance Updates
Added Session Replay Function
Session Replay is the replay of user experience on a website. By capturing clicks, mouse movements, page scrolls, and other actions, it generates video recordings to provide an in-depth understanding of the user's operational experience. For more details, please refer to the document Session Replay.
Optimized AWS Activation Process
Guance optimized the AWS Cloud Market one-click activation Guance process. After subscribing to the Guance product on the AWS Cloud Market, you can directly activate and use Guance. For more details, please refer to the document Activate Guance on AWS.
February 23, 2023
Guance Updates
Real User Monitoring Optimization
Added Real User Monitoring Automated Tracing
Real User Monitoring added automated tracing, implemented through "browser extension" method, using the browser to record user access behavior, creating code-less end-to-end tests. For more details, please refer to the document Automated Tracing.
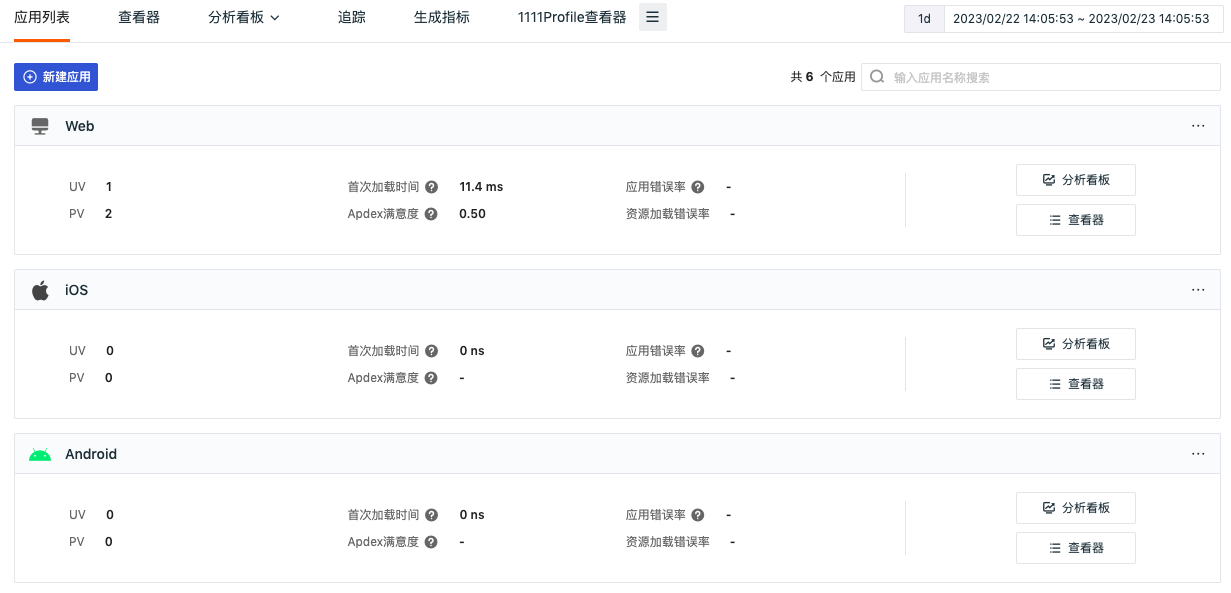
Real User Monitoring Application List, Explorer, Analysis Dashboard Layout Overall Adjustment
- Real User Monitoring application list display layout adjusted, supports jumping to view the current application's "Analysis Dashboard" and "Explorer" content details from the application list.
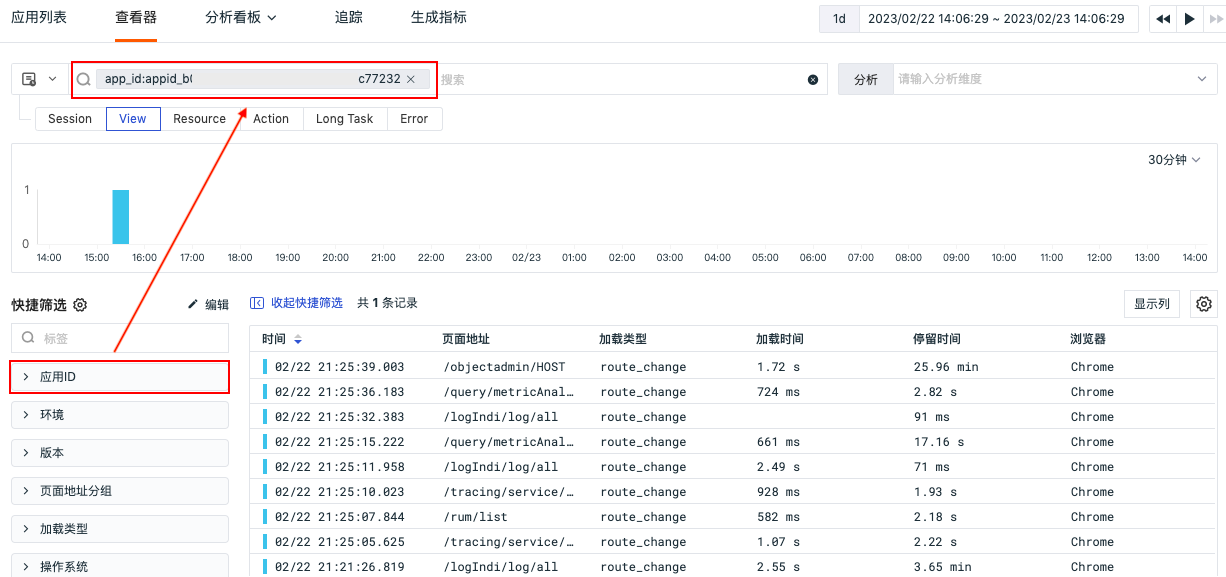
- Real User Monitoring "Explorer" supports viewing user access data for all applications. You can view and analyze data from different applications by filtering "Application ID".
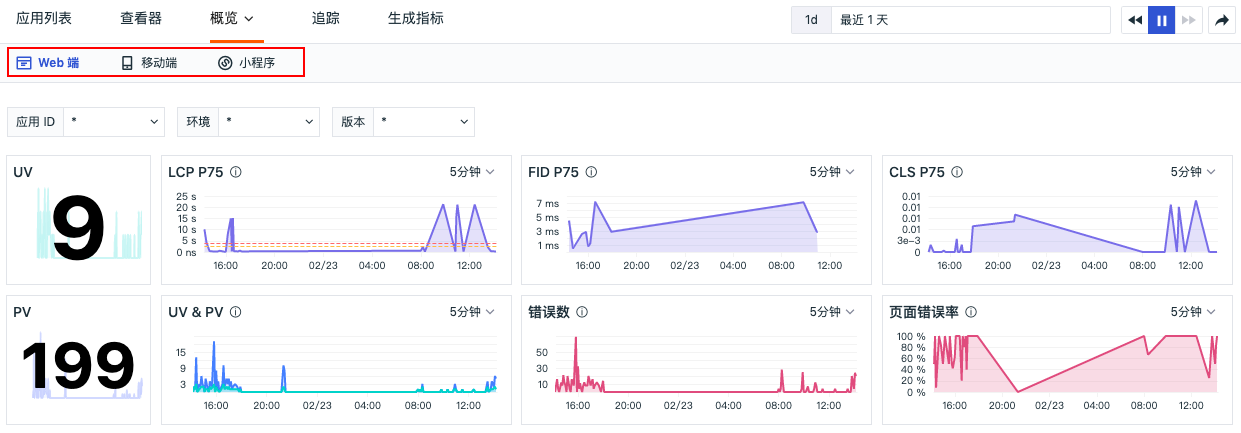
- Real User Monitoring "Analysis Dashboard" supports switching to view scenario analysis views for Web端, Mobile端, Mini Program.
Added CDN Quality Analysis
Real User Monitoring added CDN vendor information collection, performing quality analysis on different vendors' CDN through analysis charts. For more configuration, please refer to Real User Monitoring Collector Configuration.
Added UniAPP Application Access
Real User Monitoring added UniAPP application access. The current version supports Android and iOS platforms. For more details, please refer to UniApp Application Access.
Scenarios Optimization
Added Custom Explorer Navigation Menu
In the Scenarios explorer list, added support for adding the current explorer to Infrastructure, Metrics, Logs, Application Performance Monitoring, Real User Monitoring, Synthetic Tests, Security Check, CI Visualization navigation menus. For more details, please refer to Add Explorer Navigation Menu.
Enhanced Scenarios View Variable Cascading Function
When configuring cascading queries for scenario view variables, supports using =, != for exact variable value matching, supports using match (re), not match (re), wildcard, not wildcard for fuzzy variable value matching. For more details, please refer to the document View Variables.
Pie Chart Added Merge Configuration Option
Pie chart added merge configuration option, supports users merging redundant data points into "Other" for display, improving pie chart readability. For more details, please refer to the document Pie Chart.
Adjusted Chart Query Operator Translation Logic
Chart query match / not match operator translation logic adjusted. In log data, match removed the default added right * matching logic. If needed, can manually add it in the input box.
Other Function Optimization
- Guance Commercial Edition Registration process supports binding Guance Billing Center account.
- When configuring Monitors, 'Detection Dimension' supports being optional.
DataKit Updates
New Features
- Command line added parse line protocol function
- Datakit yaml and helm support resource limit configuration
- Datakit yaml and helm support CRD deployment
- Added SQL-Server integration test
- RUM supports resource CDN annotation
Function Optimization
- Optimized拨测 logic
- Optimized Windows installation prompt
- Optimized powershell installation script template
- Optimized k8s Pod, ReplicaSet, Deployment association method
- Refactored point data structure and functionality
- Datakit comes with eBPF collector binary installation
More DataKit updates can be referred to DataKit Version History.
February 16, 2023
Guance Updates
Optimized Workspace Permission Management
Added Member Roles and Permission List Management
Guance added role management function, supports setting different Guance functional access permissions for employees within the enterprise, to achieve permission isolation between different employees.
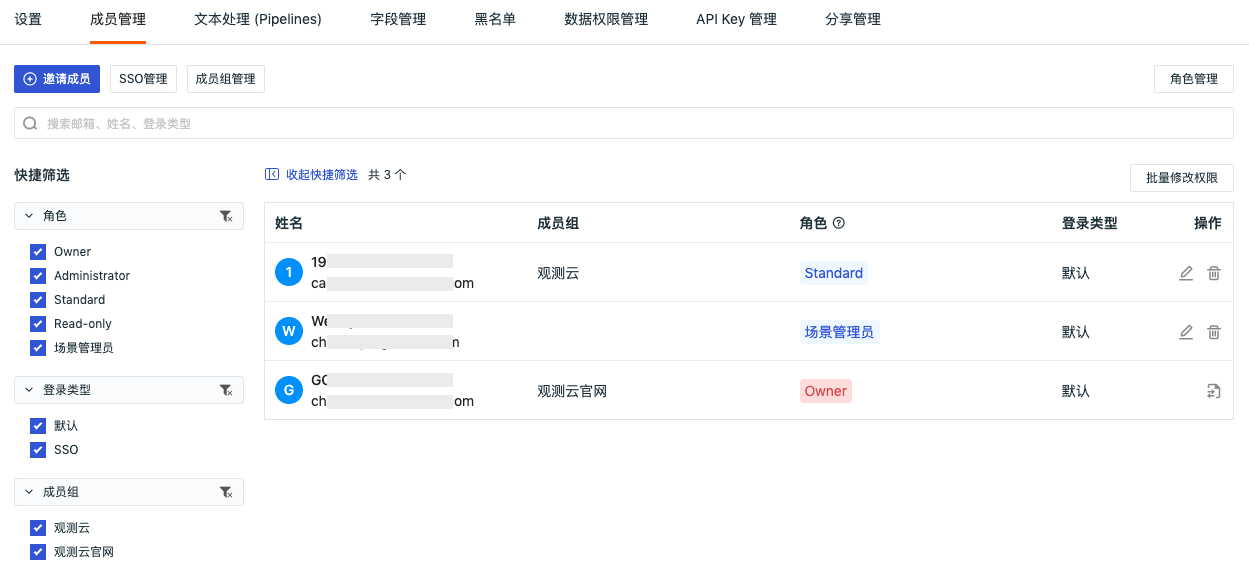
Guance provides four default member roles: "Owner", "Administrator", "Standard", and "Read-only". Besides the default roles, Guance supports creating new roles in role management, and assigning permission scopes to roles, meeting the permission needs of different users. For more details, please refer to the document Role Management.

Optimized Member Invitation, Added Selecting Member Permissions
Within the current space, invited new members have read-only permissions by default. Added support for selecting one or more roles to set the new member's permissions. For more details, please refer to the document Member Management.
Added Batch Modify Member Permissions
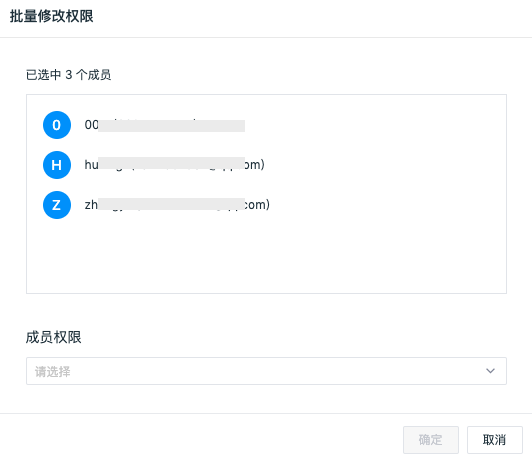
In member management, added batch modify permissions function. Click 'Batch Modify Permissions', select the members whose permissions need to be modified in bulk, click 'OK', then select the permissions for the members in the pop-up dialog and click 'OK'. For more details, please refer to the document Member Management.
Optimized SSO Management, Added SAML Mapping Function
Guance added SAML mapping relationship based on configuration, providing enterprises with finer-grained single sign-on solutions. After enabling SAML mapping, supports dynamically assigning access permissions to enterprise employees. Employees can access Guance based on the assigned role permissions.
In Guance workspace "Management" - "Member Management" - "SSO Management" - "SSO Login", enable "SAML Mapping", and configure the mapping relationship in "SAML Mapping".
Member Management Page Display Optimization
In member management, added custom role management function, adjusted search, quick filter and other layouts. For more details, please refer to the document Member Management.
Permission Change Review Optimization
Based on the added role permission management, adjusted the trigger conditions for Billing Center review. When a user role is granted Token viewing and operation permissions, it triggers the Guance Billing Center review. For more details, please refer to the document Permission Change Review.
Added Login Session Keep-Alive Time Setting
Guance supports setting session keep-alive time for accounts logged into the workspace, including SSO single sign-on accounts and workspace registered accounts. Supports setting "Inactivity Login Session Keep-Alive Time" and "Maximum Login Session Keep-Alive Time" for logged-in accounts. After setting, timed-out login sessions will become invalid.
- Inactivity Login Session Keep-Alive Time: Supports setting range 30 ~ 1440 minutes, default is 30 minutes.
- Maximum Login Session Keep-Alive Time: Supports setting range 0 ~ 7 days, where 0 means never timeout, default is 7 days.
Added Ticket Management
For problems encountered in Guance, users can consult and make suggestions by submitting tickets. Official will handle and provide feedback promptly. For example: encountering difficult problems during use, purchase and cost-related inquiries, making feature requests to Guance, etc.
The ticket system is based on personal account level. Users can view all tickets submitted by themselves in ticket management, regardless of workspace. Ticket management entry: bottom left "Account" - "Ticket Management". For more details, please refer to the document Ticket Management.
Other Function Optimization
-
When creating a workspace, added language selection. The language option affects event, alert, SMS and other templates within the workspace. If English is selected, the corresponding templates above will use English templates by default.
-
Optimized workspace locking function. If the Billing Center account is in arrears or the cloud marketplace subscription is abnormal, the workspace will be locked. After the workspace is locked, new data will stop being reported. Guance provides a 14-day buffer period. You can continue to view and analyze historical data during this period, and continue using Guance by unlocking the workspace. For more details, please refer to the document Workspace Locking.
Intelligent Inspection Updates
- RUM Performance Inspection: Supports navigating to view the problem session for affected user session IDs, providing more professional optimization methods in the inspection event report.
- Cloud Account Instance Dimension Billing Inspection: Added support for AWS account instance dimension billing inspection.
More Intelligent Inspection updates can be referred to Intelligent Inspection Changelog.
Best Practices Updates
- Cloud Platform Access
- Alibaba Cloud - Alibaba Cloud Event Bridge EventBridge Best Practices
More Best Practices updates can be referred to Best Practices Version History.
February 9, 2023
DataKit Updates
New Features
- Datakit host installation can customize default collector enabling
- Provides OTEL error tracing
- Provides RUM Session replay capability
Function Optimization
- Datakit pyroscope profiling multi-program language recognition
- Optimized CPU, Disk, EBPF, Net and other Chinese and English documentation
- Optimized elasticsearch, postgresql, dialtesting and other English documentation
- Optimized DCA, Profiling documentation
- Optimized log collection process
- iploc yaml configuration method documentation support
More DataKit updates can be referred to DataKit Version History.
Intelligent Inspection Updates
Added Inspections
-
RUM Performance Inspection: Real User Monitoring (RUM) is an application performance monitoring technology aimed at evaluating website performance by simulating real user behavior when browsing websites. The purpose of RUM is to understand website performance from the user's perspective, including website loading time, webpage rendering effects, page element loading status, and interaction responses. The usage scenarios of RUM performance inspection are primarily for client-side websites, such as e-commerce websites, financial websites, entertainment websites, etc. These websites need to provide users with a fast and smooth access experience. Through analysis of RUM performance results, it can quickly help developers understand the actual user experience in order to quickly improve website performance.
-
Kubernetes Health Inspection: Nowadays Kubernetes has swept across the entire container ecosystem. It acts as the brain of container distributed deployment, designed to manage service-oriented applications using containers distributed across host clusters. Kubernetes provides mechanisms for application deployment, scheduling, updating, service discovery, and scaling. But how to ensure the health of Kubernetes nodes? Through intelligent inspection, based on the retrieval and problem discovery of current node resource status, application performance management, service failure logs, and other information, it can accelerate event investigation, reduce the burden on engineers, reduce mean time to repair, and improve end-user experience.
More Intelligent Inspection updates can be referred to Intelligent Inspection Changelog.
January 17, 2023
Guance English Version Launched
January 12, 2023
Guance Updates
Added Guance Site Service Status Page
Guance provides Status Page, helping you view the service status of different Guance sites in real time. If you are already logged into Guance, you can view the service status of various Guance sites by clicking Help > Status Page at the bottom left. For more details, please refer to the document Status Page.
Added Binding Self-built Elasticsearch / OpenSearch Index
Guance added support for binding self-built Elasticsearch / OpenSearch indexes, helping you uniformly and quickly view and analyze your log data. For more details, please refer to the document Bind Index.
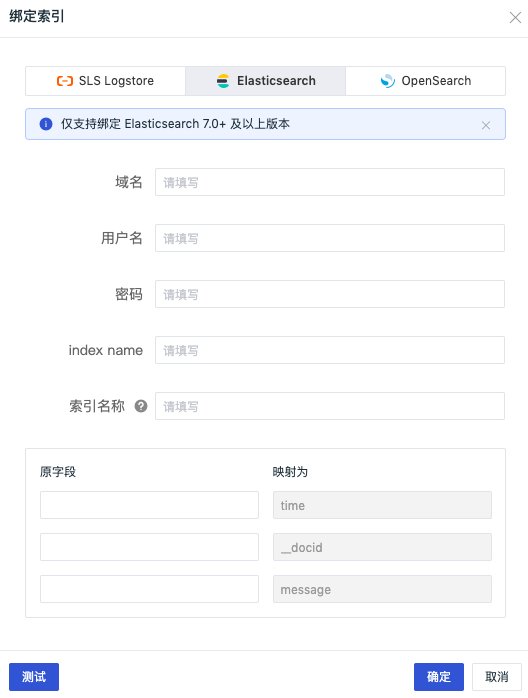
Added Network Explorer List Mode
In "Infrastructure" - "Network", select "Host / Pod / Deployment / Service", supports switching to the corresponding network list to view source IP/port and target IP/port之间的 TCP retransmission count, TCP connections, TCP close count, TCP latency, sent bytes, received bytes, status code, etc. For more details, please refer to the document Network.

Added Frontend Application Span Request Time Distribution Display
In the trace details page, if the current trace belongs to a Span generated by a frontend application call, you can view the request time distribution in the trace details, including Queueing, First Byte, Download request time consumption percentage, helping you intuitively view the process consumption percentage of a frontend Span.
Note: The Real User Monitoring SDK must be version 2.2.10 or above to see this data display. If cross-domain situations exist, header configuration needs adjustment. For more details, please refer to the document Web Application Access.
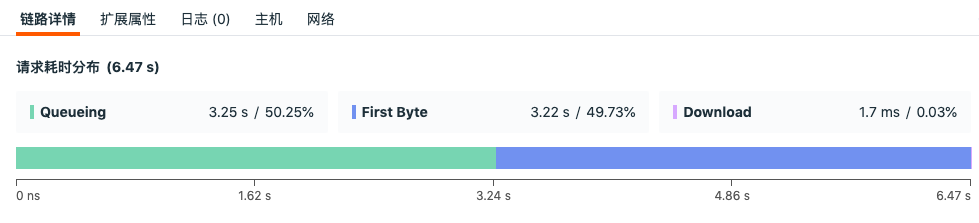
Optimized Real User Monitoring Session Interaction Logic
- Session explorer removed all record list.
- Session details page display optimization: Type Typedisplay optimization, supports switching to the absolute time when the session occurred, added service column, details page display optimization, error information optimization.
- Session update logic optimization: Session data update changed from append logic to overwrite logic based on session_id.
- If a trace contains Spans generated by frontend application calls, the service value of that Span will be populated with the service value from the current user access data. If the user access data does not contain service information, it will be filled with "browser" by default.
For more details, please refer to the document Session.
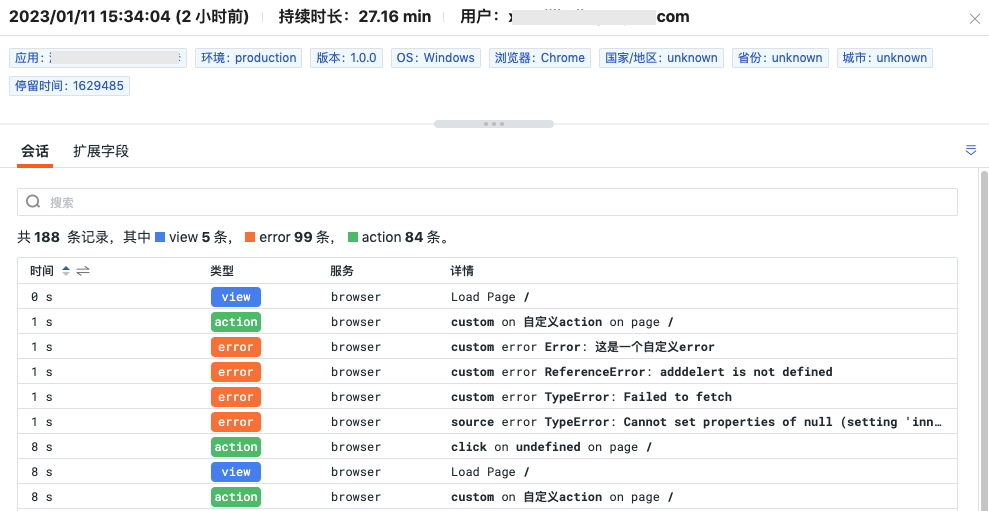
Pod Metric Data Collection Default Off
In the latest DataKit version, the Pod metric data configuration of the container collector is adjusted to default off enable_pod_metric = false. For more details, please refer to the document Container Data Collection.
Other Function Optimization
- Binding MFA authentication changed to email verification.
- Phone verification during registration changed to email verification.
- Security verification during login changed to slider verification.
- Creating a workspace added Guance Exclusive Edition guidance.
- Workspace added remark display function.
- Cloud account settlement users added viewing bill list in Guance Billing.
- Table chart supports setting aliases based on "by grouping".
- Optimized the time series chart in monitor configuration, only displayed after selecting dimensions.
- Optimized data gap alert configuration for log data.
- OpenAPI added create workspace interface.
DataKit Updates
- confd added Nacos backend.
- Log collector added LocalCache feature.
- Supports C/C++ Profiling data.
- RUM Session Replay file reporting.
- WEB DCA supports remote config updates.
- Optimized SQL data high resource usage issue.
- Optimized Datakit Monitor.
More DataKit updates can be referred to DataKit Version History.
Best Practices Updates
- Cloud Platform Access
- AWS - EKS Deploy DataKit.
- Monitoring
- Application Performance Monitoring (APM) - Tracing - Use datakit-operator to inject dd-java-agent.
More Best Practices updates can be referred to Best Practices Version History.