Application Intelligent Detection
By using intelligent detection algorithms, it can automatically identify sharp increases or decreases in application request volumes, surges in error request quantities, and sudden rises or drops in request delays. These anomaly patterns will be captured through abnormal Metrics of application services and automatically trigger the anomaly analysis process.
Use Cases
Used to monitor whether application services experience anomalies or interruptions, ensuring a smooth service operation.
Detection Configuration
-
Define the name of the monitor.
-
Select the detection scope: filter data for detection Metrics based on tags associated with Metrics, limiting the range of detected data. Supports adding one or multiple tag filters. If no filtering is added, all Metrics data will be detected.
View Events
The monitor will obtain Metric information about the application service objects from the last 10 minutes. When an anomaly is identified, corresponding events are generated, which can be viewed in the Events > Intelligent Monitoring list for corresponding anomaly events.
Event Details Page
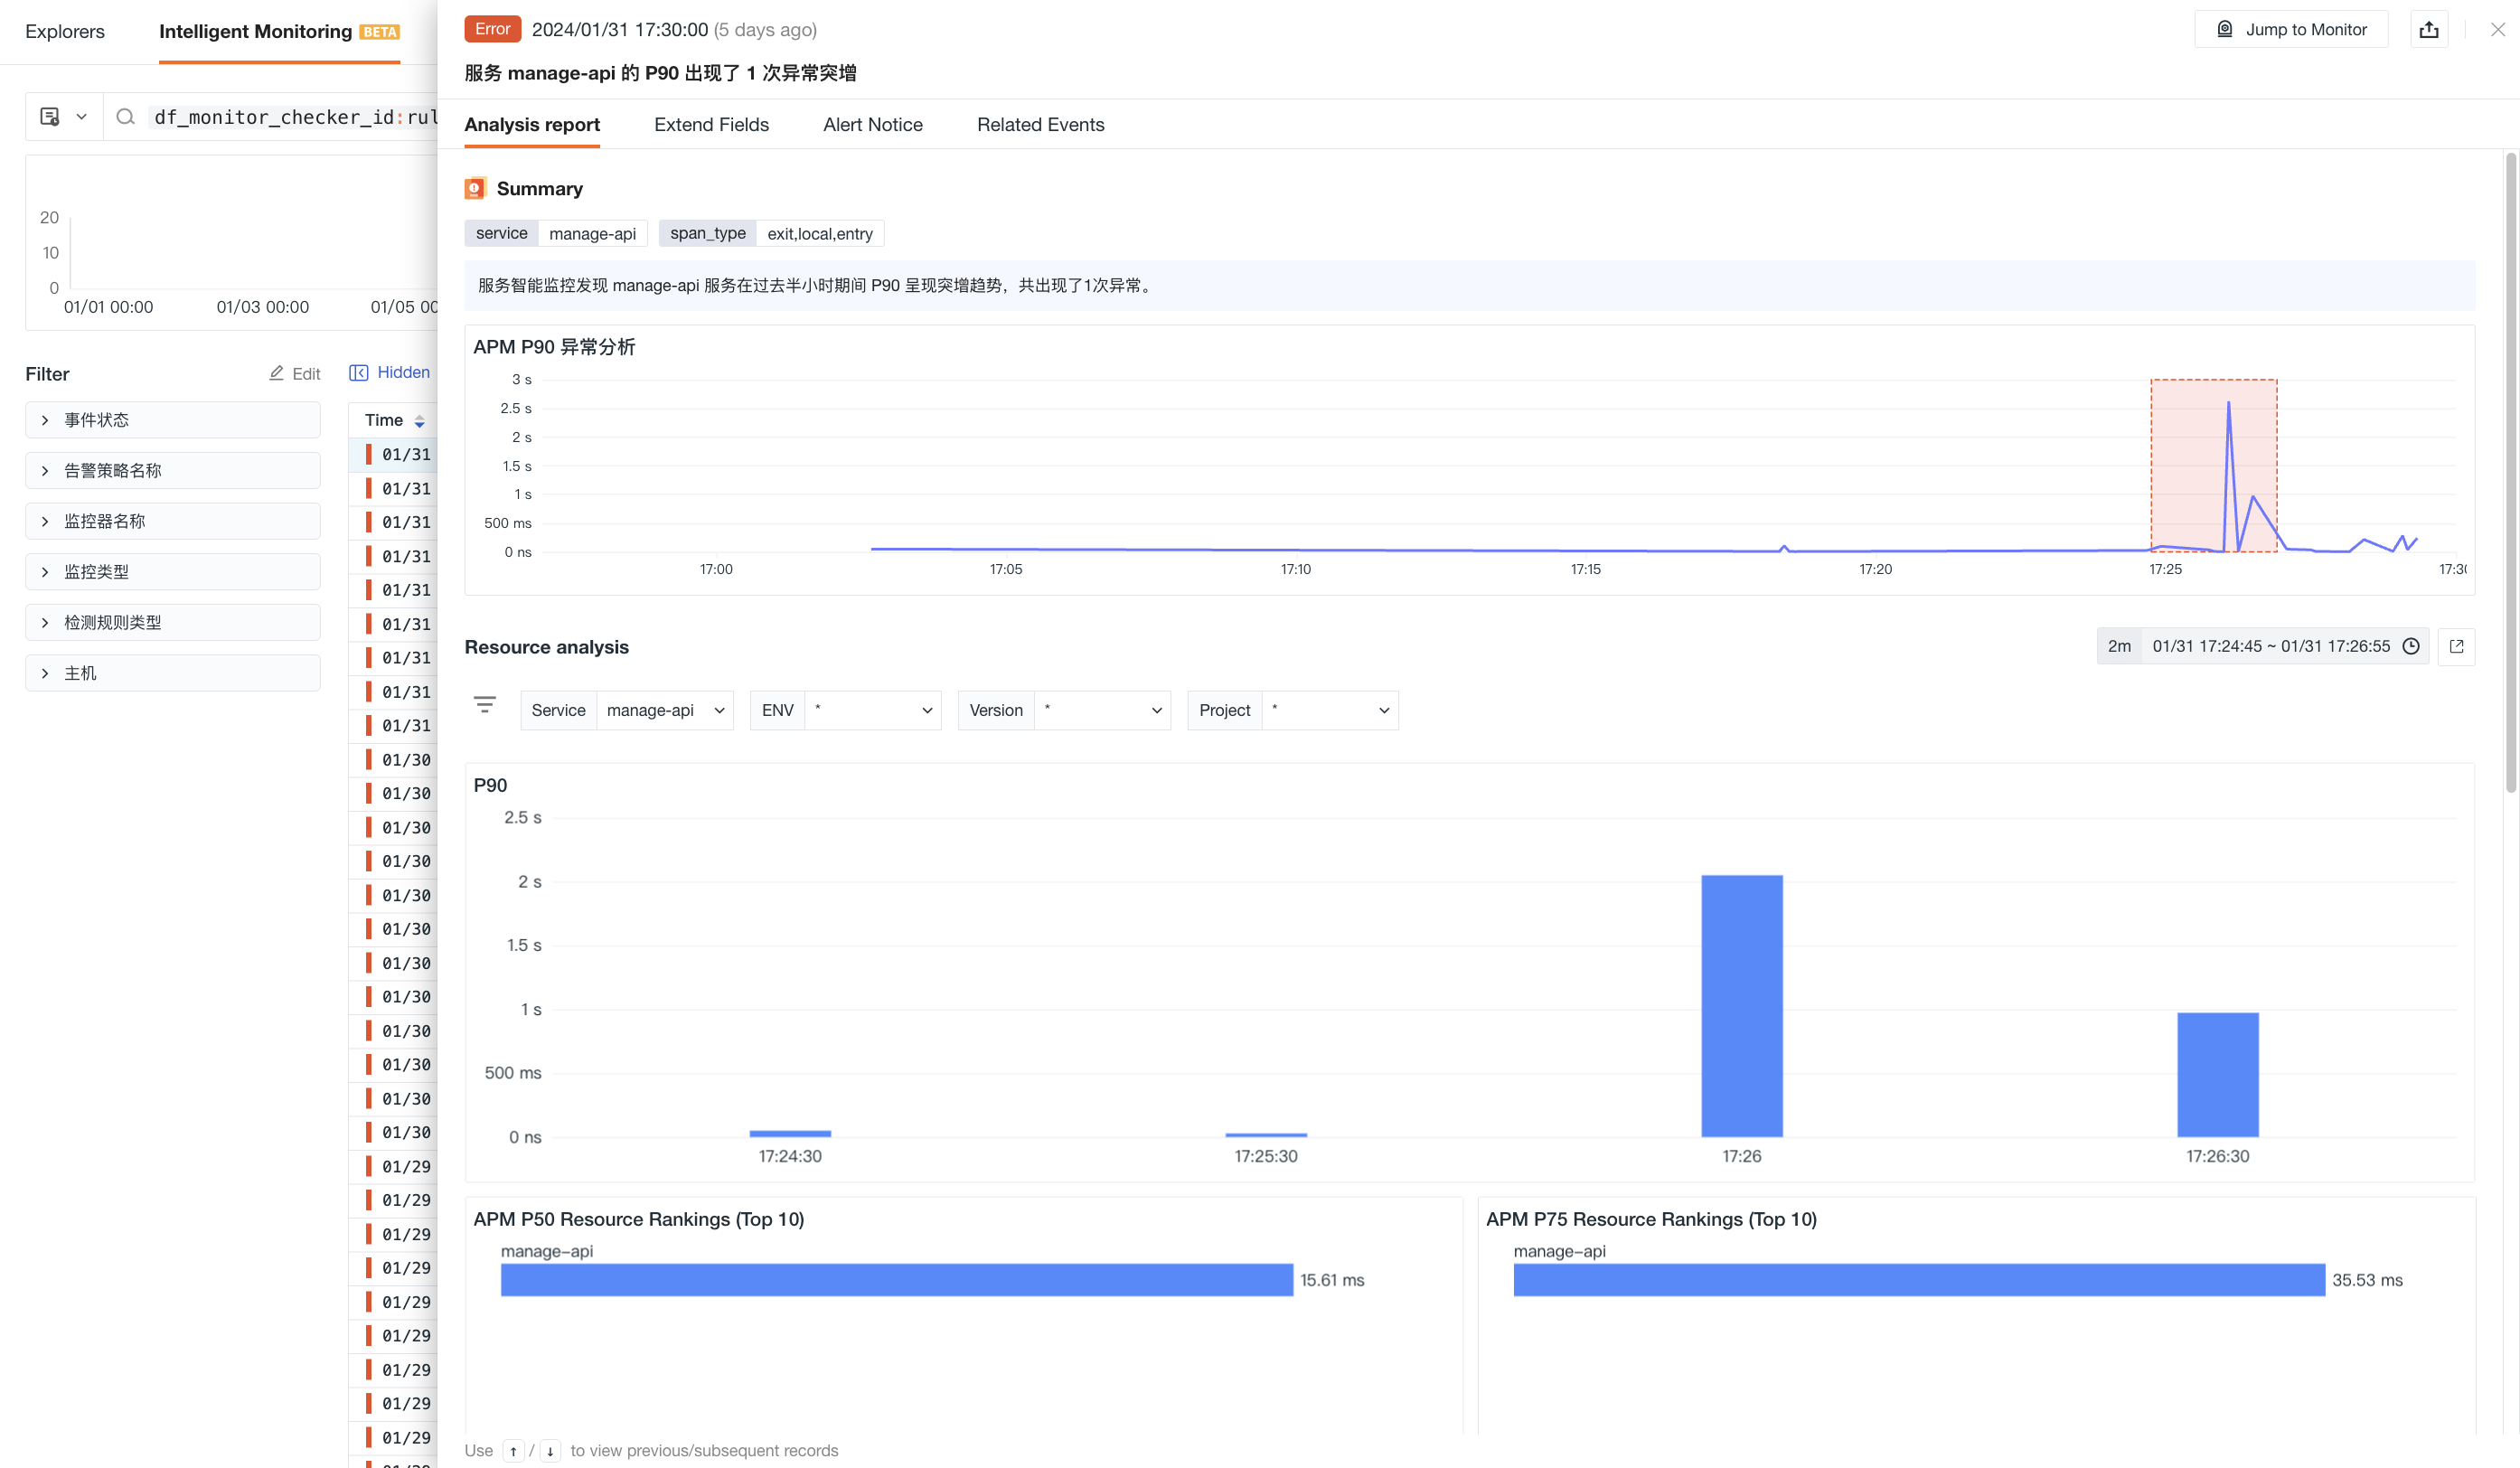
In the event Explorer, you can view the details page of intelligent monitoring events, including event status, time of anomaly occurrence, anomaly name, analysis report, alert notifications, history records, and related events.
-
Click the Jump to Monitor in the top-right corner to adjust intelligent monitor configurations;
-
Click the Export button in the top-right corner, supporting options to Export JSON File and Export PDF File, thereby obtaining all critical data corresponding to the current event.
Analysis Report
-
Anomaly Summary: Displays the labels of the currently anomalous application services, detailed anomaly analysis reports, and statistics on the distribution of anomaly values.
-
Resource Analysis: Monitors the number of requests and allows viewing of resource request rankings (TOP 10), resource error request rankings (TOP 10), and resource per-second request rankings (TOP 10).
Note: When there are multiple interval anomalies, the Anomaly Analysis dashboard defaults to displaying the anomaly situation of the first anomaly interval. You can switch by clicking the Anomaly Value Distribution Chart, and after switching, the anomaly analysis dashboard synchronizes interactively.

