Chart Queries
After selecting a chart, you can use various query methods to perform in-depth queries and analysis on different categories of data. This allows for the intuitive display of numerical information in charts and reveals important relationships between data.
Query Methods
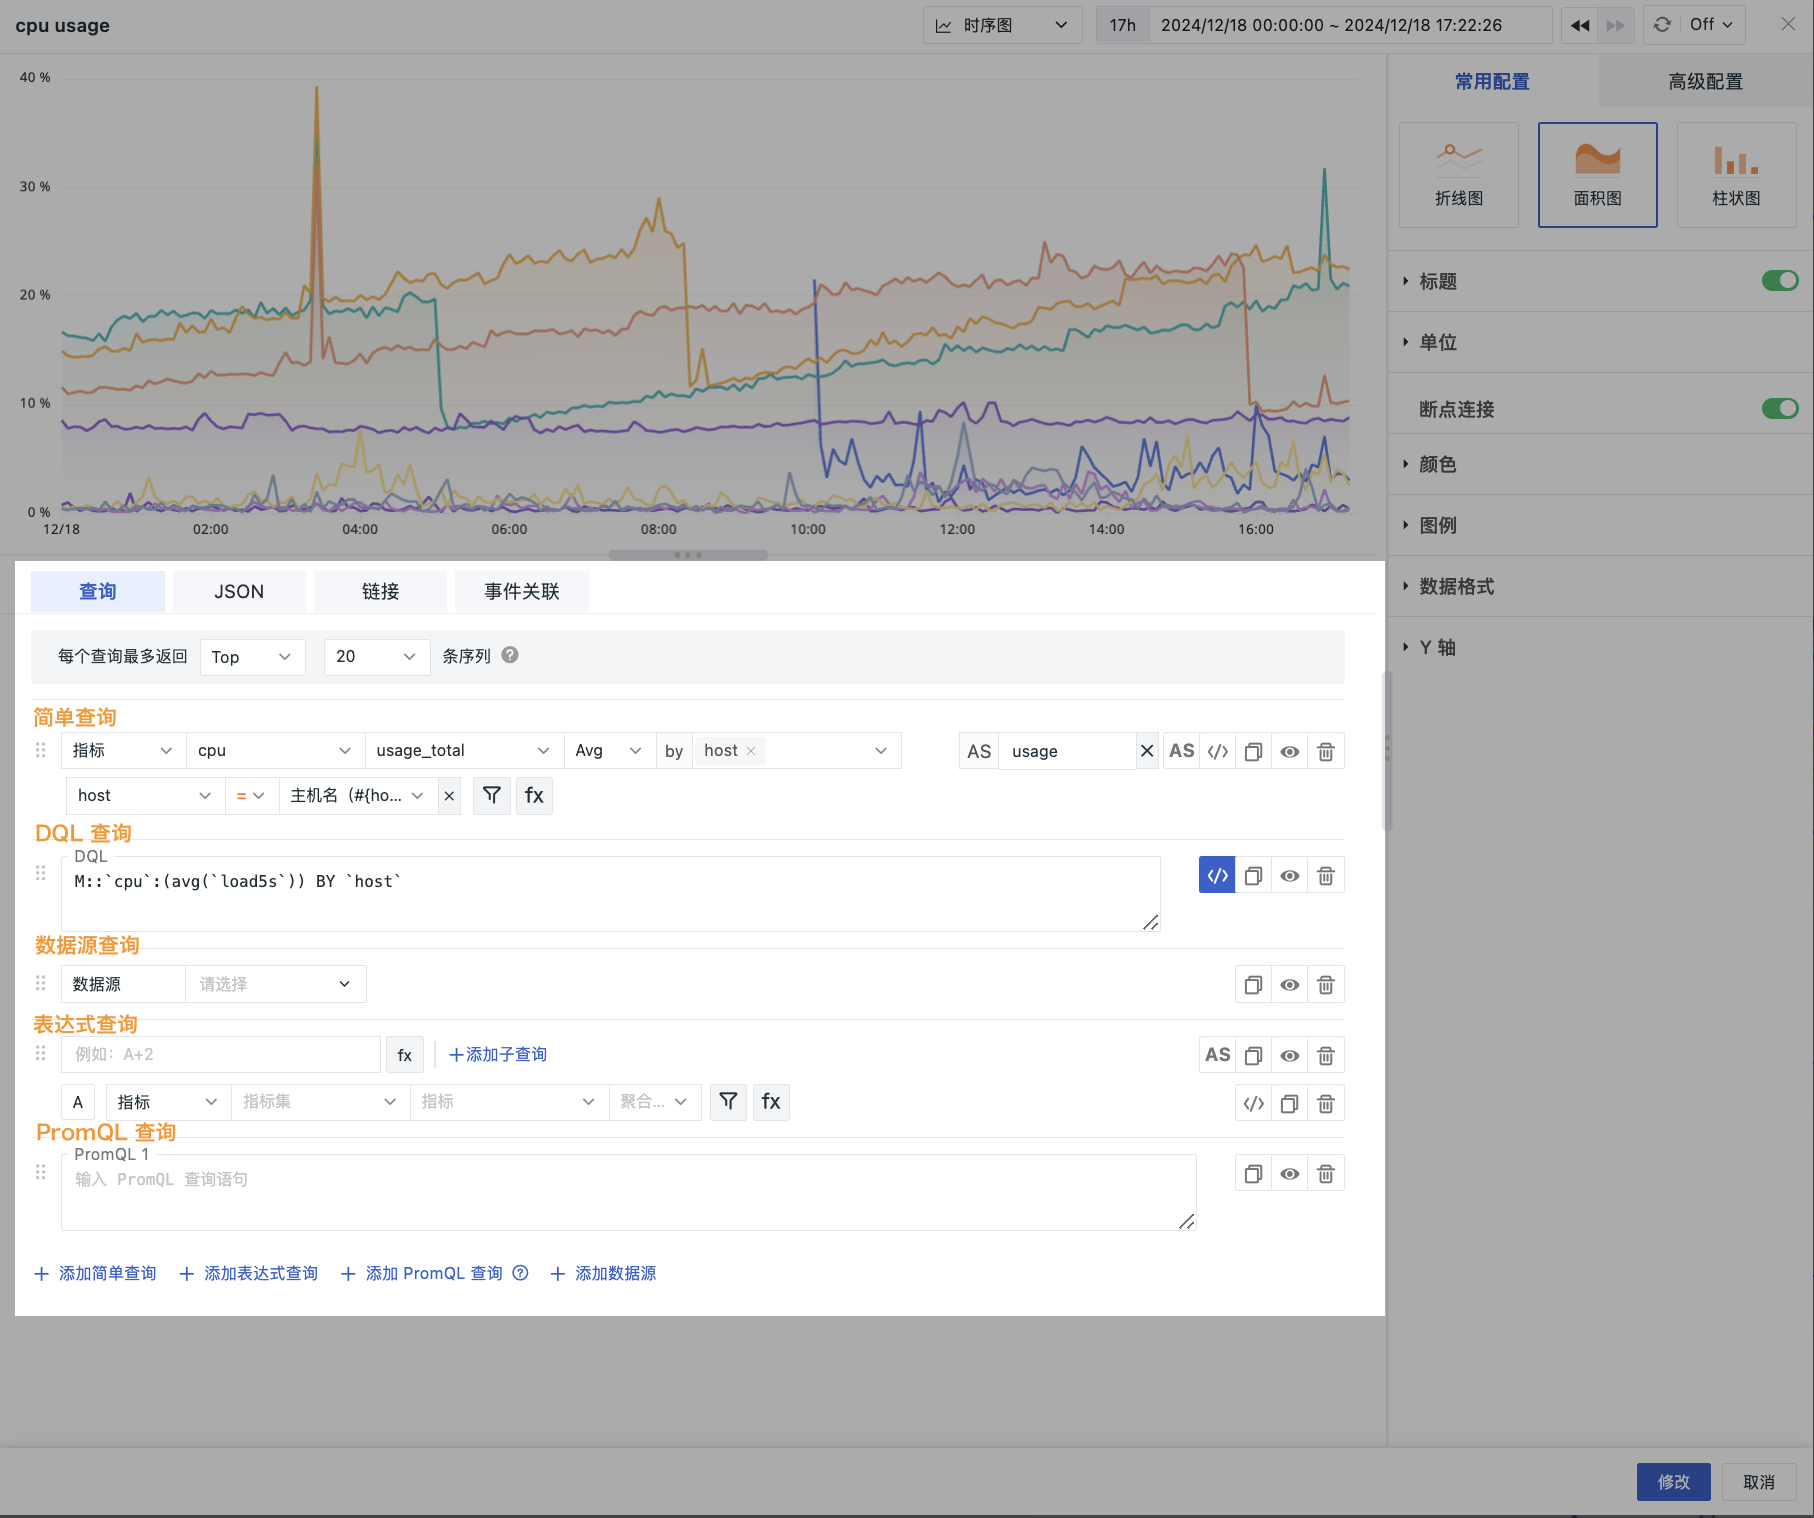
A single chart supports the following query methods:
Simple Query: Suitable for quick queries and basic data analysis;
Expression Query: Perform complex calculations by adding expressions;
DQL Query: Use the self-developed DataFlux Query Language for advanced queries;
PromQL Query: Queries specifically for Prometheus data sources;
Data Source: Directly connect to external data sources for querying.