Log Stream Chart
When displaying log data in the form of a time series table, you can customize the display range and column configuration of the logs. Additionally, the system supports searching and filtering log data related to hardware, software, system information, and events, presenting the results in a clear tabular format.
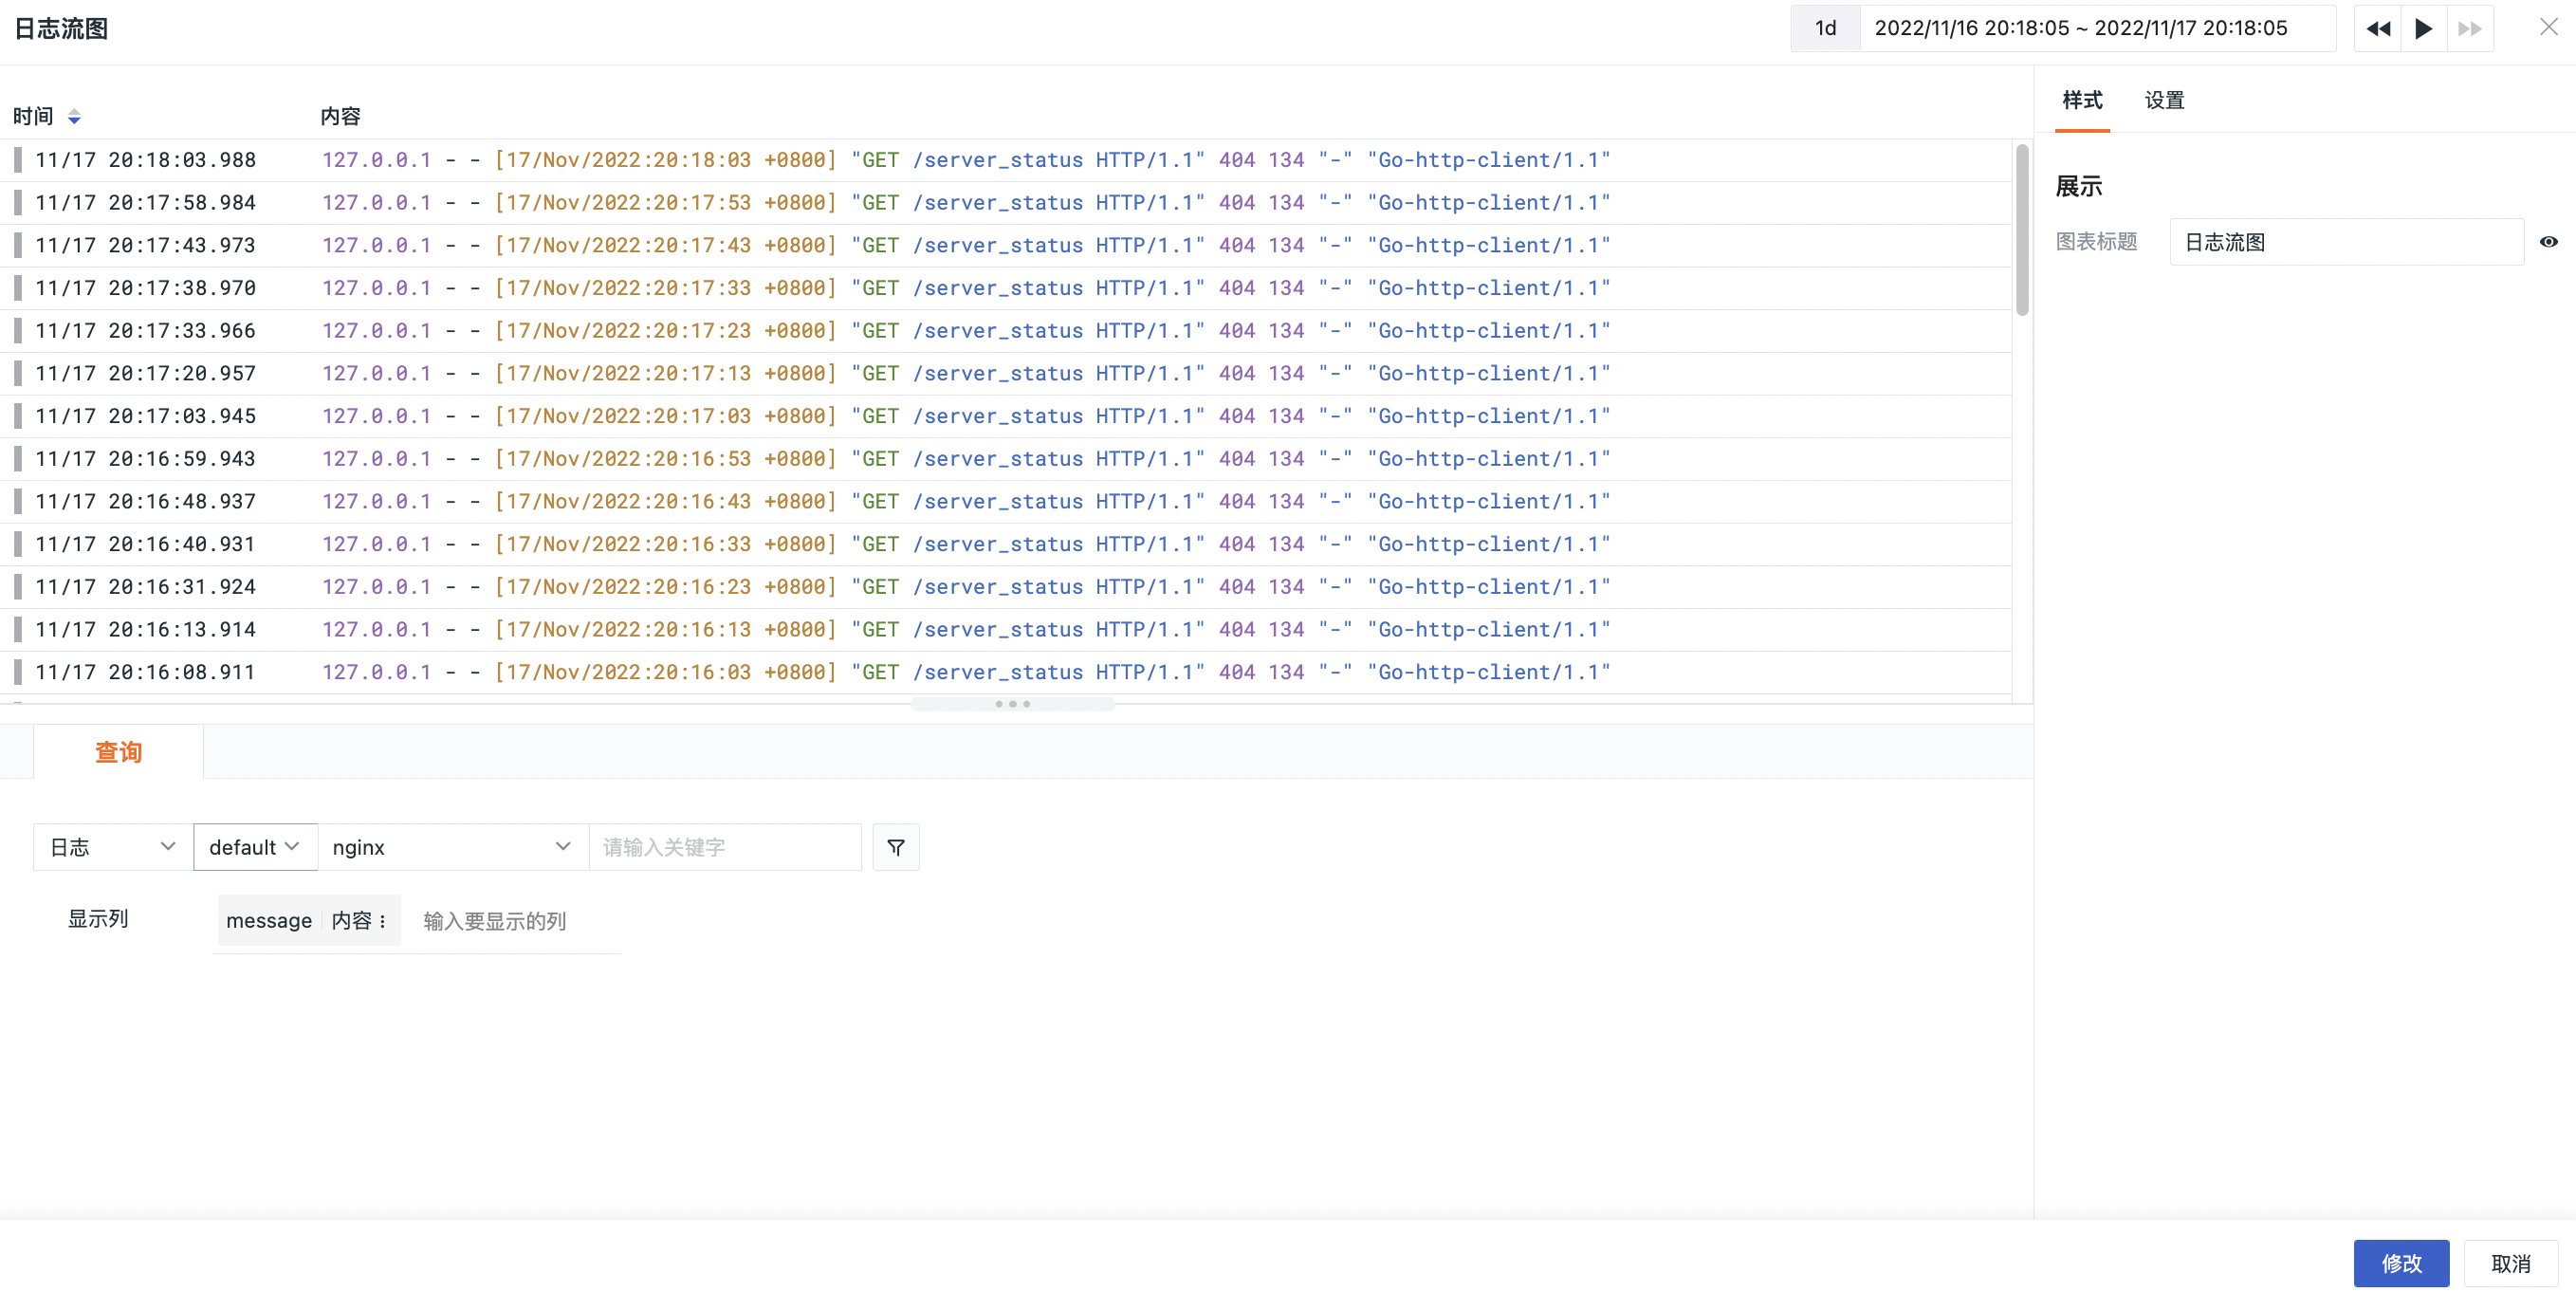
Chart Query
- Query: Supports queries with the data source fixed as Logs, and supports keyword search;
- Filter: Apply filter conditions to refine the queried log data;
- Display Columns: Choose which columns to display. The
messagecontent is present by default and can be renamed.
Chart Configuration
For more details, refer to Chart Configuration.