Generate Metrics
Guance supports generating new metric data based on existing data within the current workspace, allowing you to design and implement new technical metrics according to your needs.
Warning
- The role with Metric Generation Configuration Management permissions list can create and edit metric generation rules;
- After metric generation, the metric data will be stored according to the current default data retention policy, and charges will be applied based on the generated time series count;
- If no data is reported during the period after metric generation, it cannot be queried or analyzed in the workspace, such as in Metrics Analysis, Charts, or DQL Query Tool.
Create/Clone Rules
Navigate to the APM > Generate Metrics page,
- Click Create Rule to start creating a new metric generation rule;
- Click the icon to clone an existing rule to create a new one.
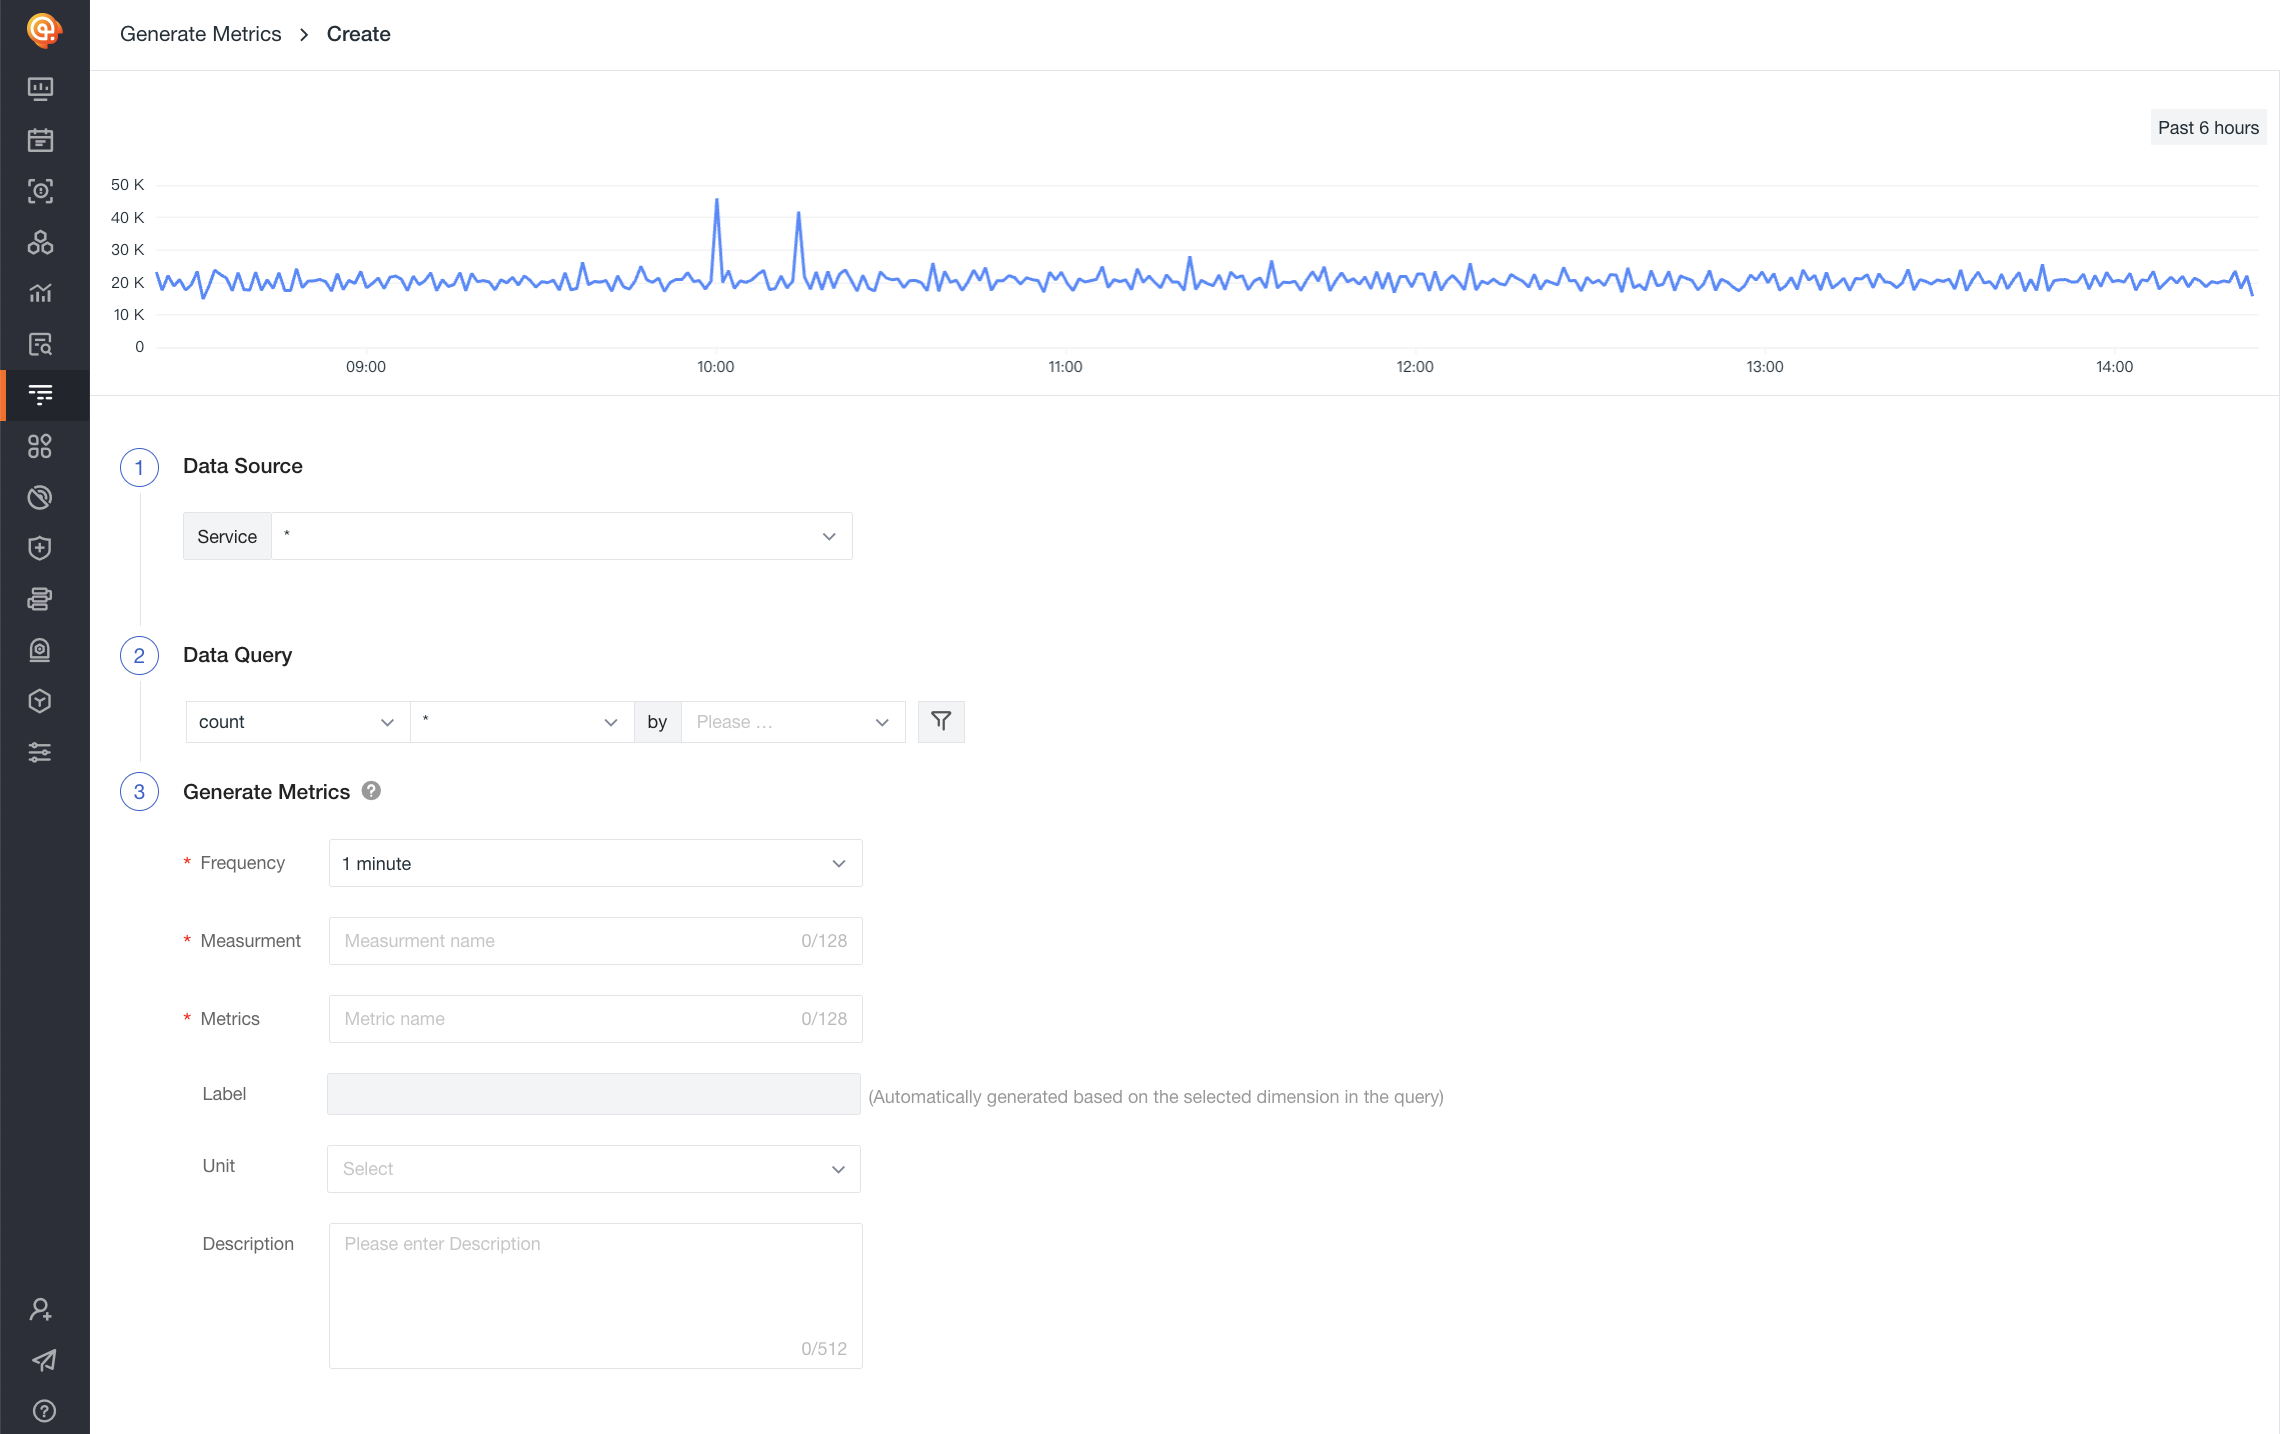
Step 1: Data Source. Filter out all or individual service data sources currently available in the workspace and generate new data based on this data source.
- Source: Data source, i.e., the data source of services that have started collection; Note: “ * ” indicates all data sources
Step 2: Data Query. Based on the selected data source, you can add filtering and aggregation expressions to the existing data to request new metric results and data sets.
- Aggregation Method: See the table below
| Aggregation Method | Description |
|---|---|
| count | Count occurrences |
| avg | Calculate the average value, requires selecting a field for aggregation |
| max | Find the maximum value, requires selecting a field for aggregation |
| min | Find the minimum value, requires selecting a field for aggregation |
| P75 | Calculate the 75th percentile value of the specified field, requires selecting a field for aggregation |
| P95 | Calculate the 95th percentile value of the specified field, requires selecting a field for aggregation |
| P99 | Calculate the 99th percentile value of the specified field, requires selecting a field for aggregation |
- Dimensions: Aggregate data based on the selected objects, i.e., generate a statistical value for each selected object in the data request;
- Filters: Support adding one or more filter conditions to existing tag data and add AND (and) or OR (or) relationships between the same row filter conditions.
Step 3: Generate Metrics. Set up the method and results for generating metrics, including the frequency of metric generation, the name of the new metric tags, and the measurement set name.
| Field | Description |
|---|---|
| Frequency | The execution cycle for generating metrics, default is 1 minute, i.e., a new metric data is generated every 1 minute; the selected time also serves as the aggregation time. If the frequency is 1 minute, then every 1 minute a metric is aggregated and generated, and each aggregation time range is also 1 minute. |
| Measurement Set | Set the name of the measurement set where the metrics will be stored. |
| Metric | Set the name of the metric, where the metric name must be unique, multiple metrics can be added. |
| Tags | Automatically generated based on the dimensions selected in the query. |
| Unit | Optional, set the unit for the metric. Once set, it can be used in chart queries. |
| Description | Optional, set a description for the metric. Once set, it can be used in chart queries. |
Step 4: After completing the metric generation rule, click Confirm to complete the rule creation and start data collection.
Operation Instructions
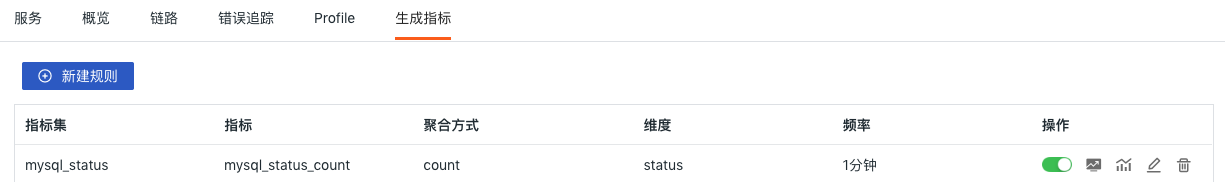
All added rules will be displayed on the Generate Metrics interface, where users can perform the following operations:
Note:
-
Since the data source, aggregation expression, etc., of the metric generation rules determine the data type, some rules do not support editing or modification.
-
When a metric generation rule is disabled, the corresponding data will not be written to the measurement set, and writing will resume upon re-enabling.
-
After a rule is deleted, the measurement set will not be deleted, but data writing will stop.
View Metrics
In Metrics Analysis
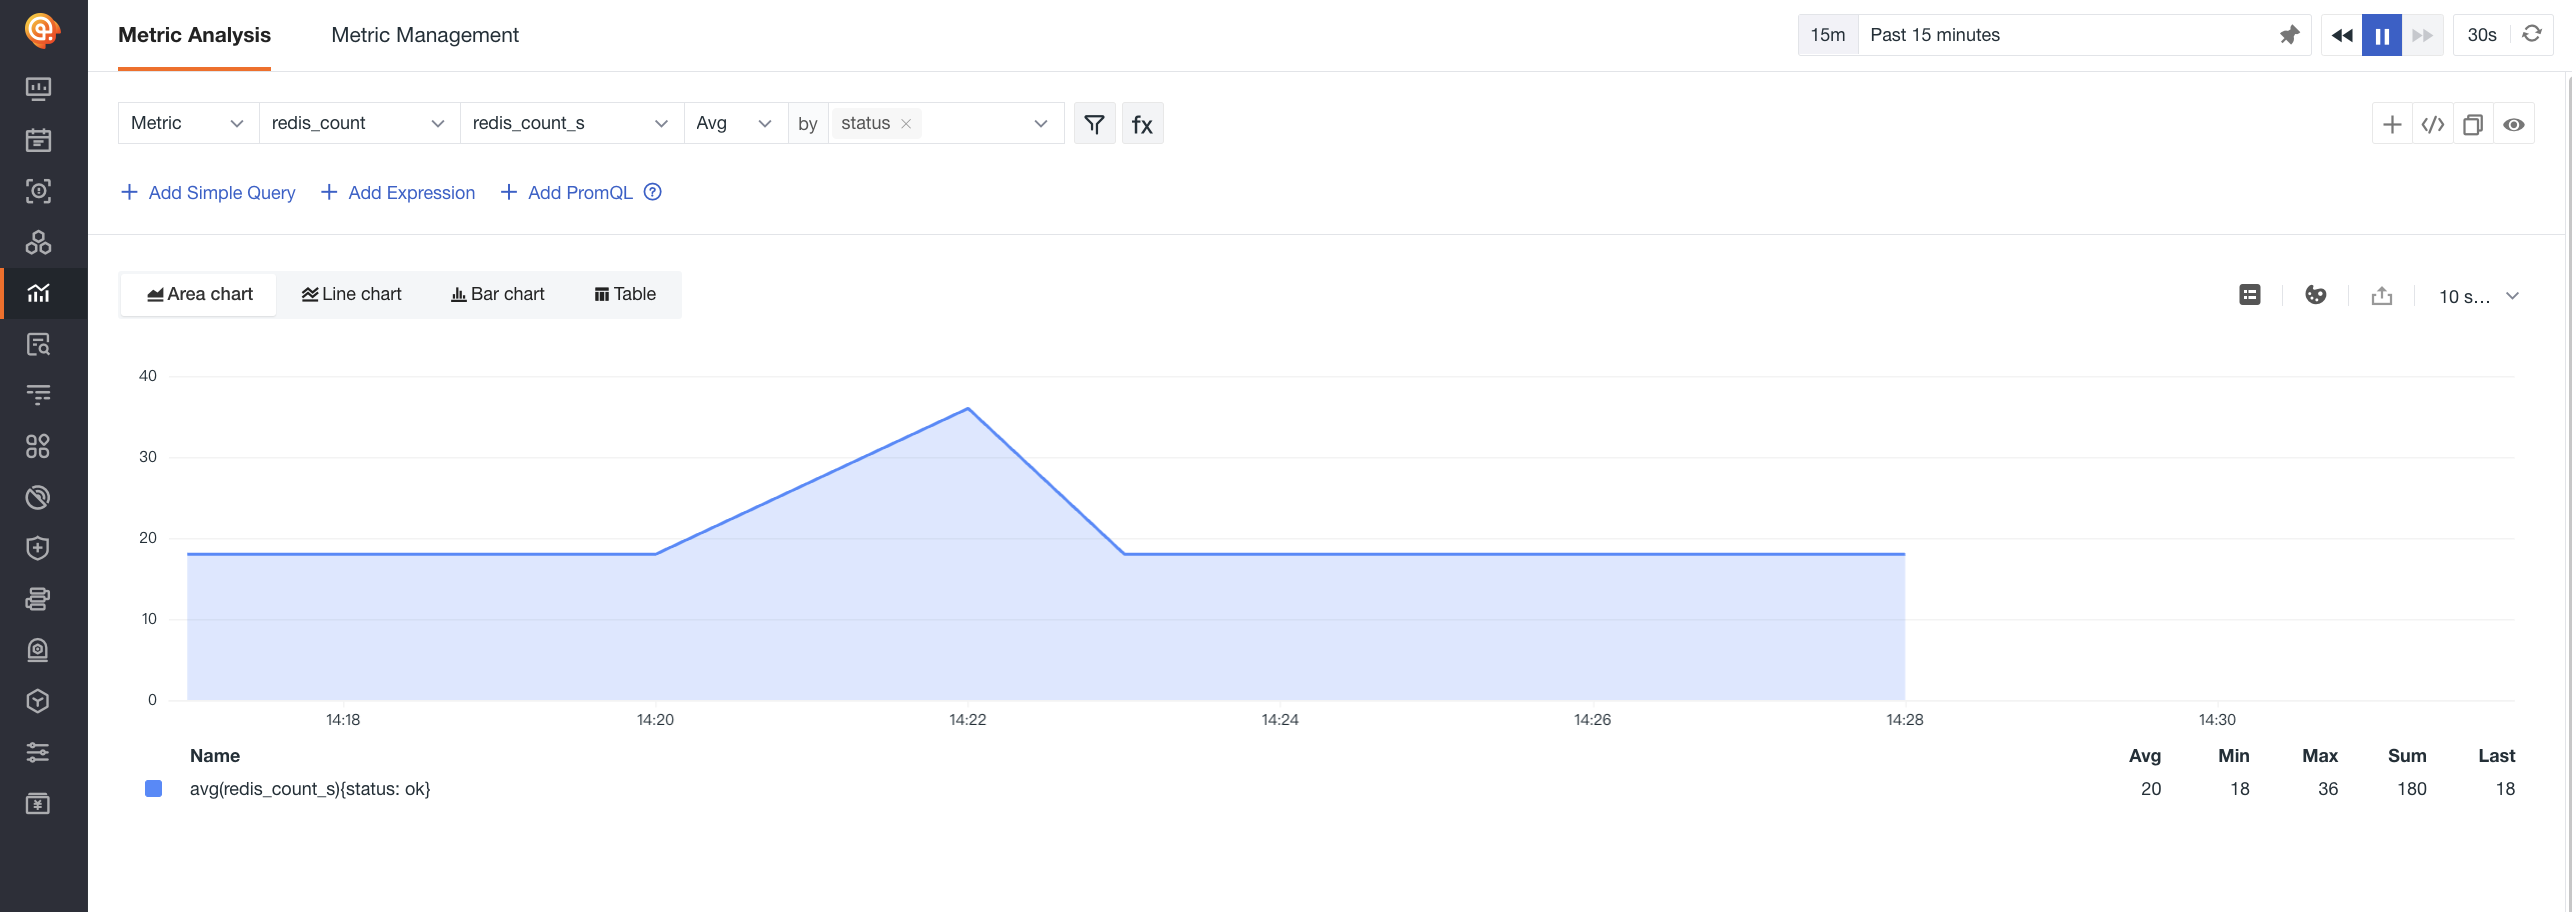
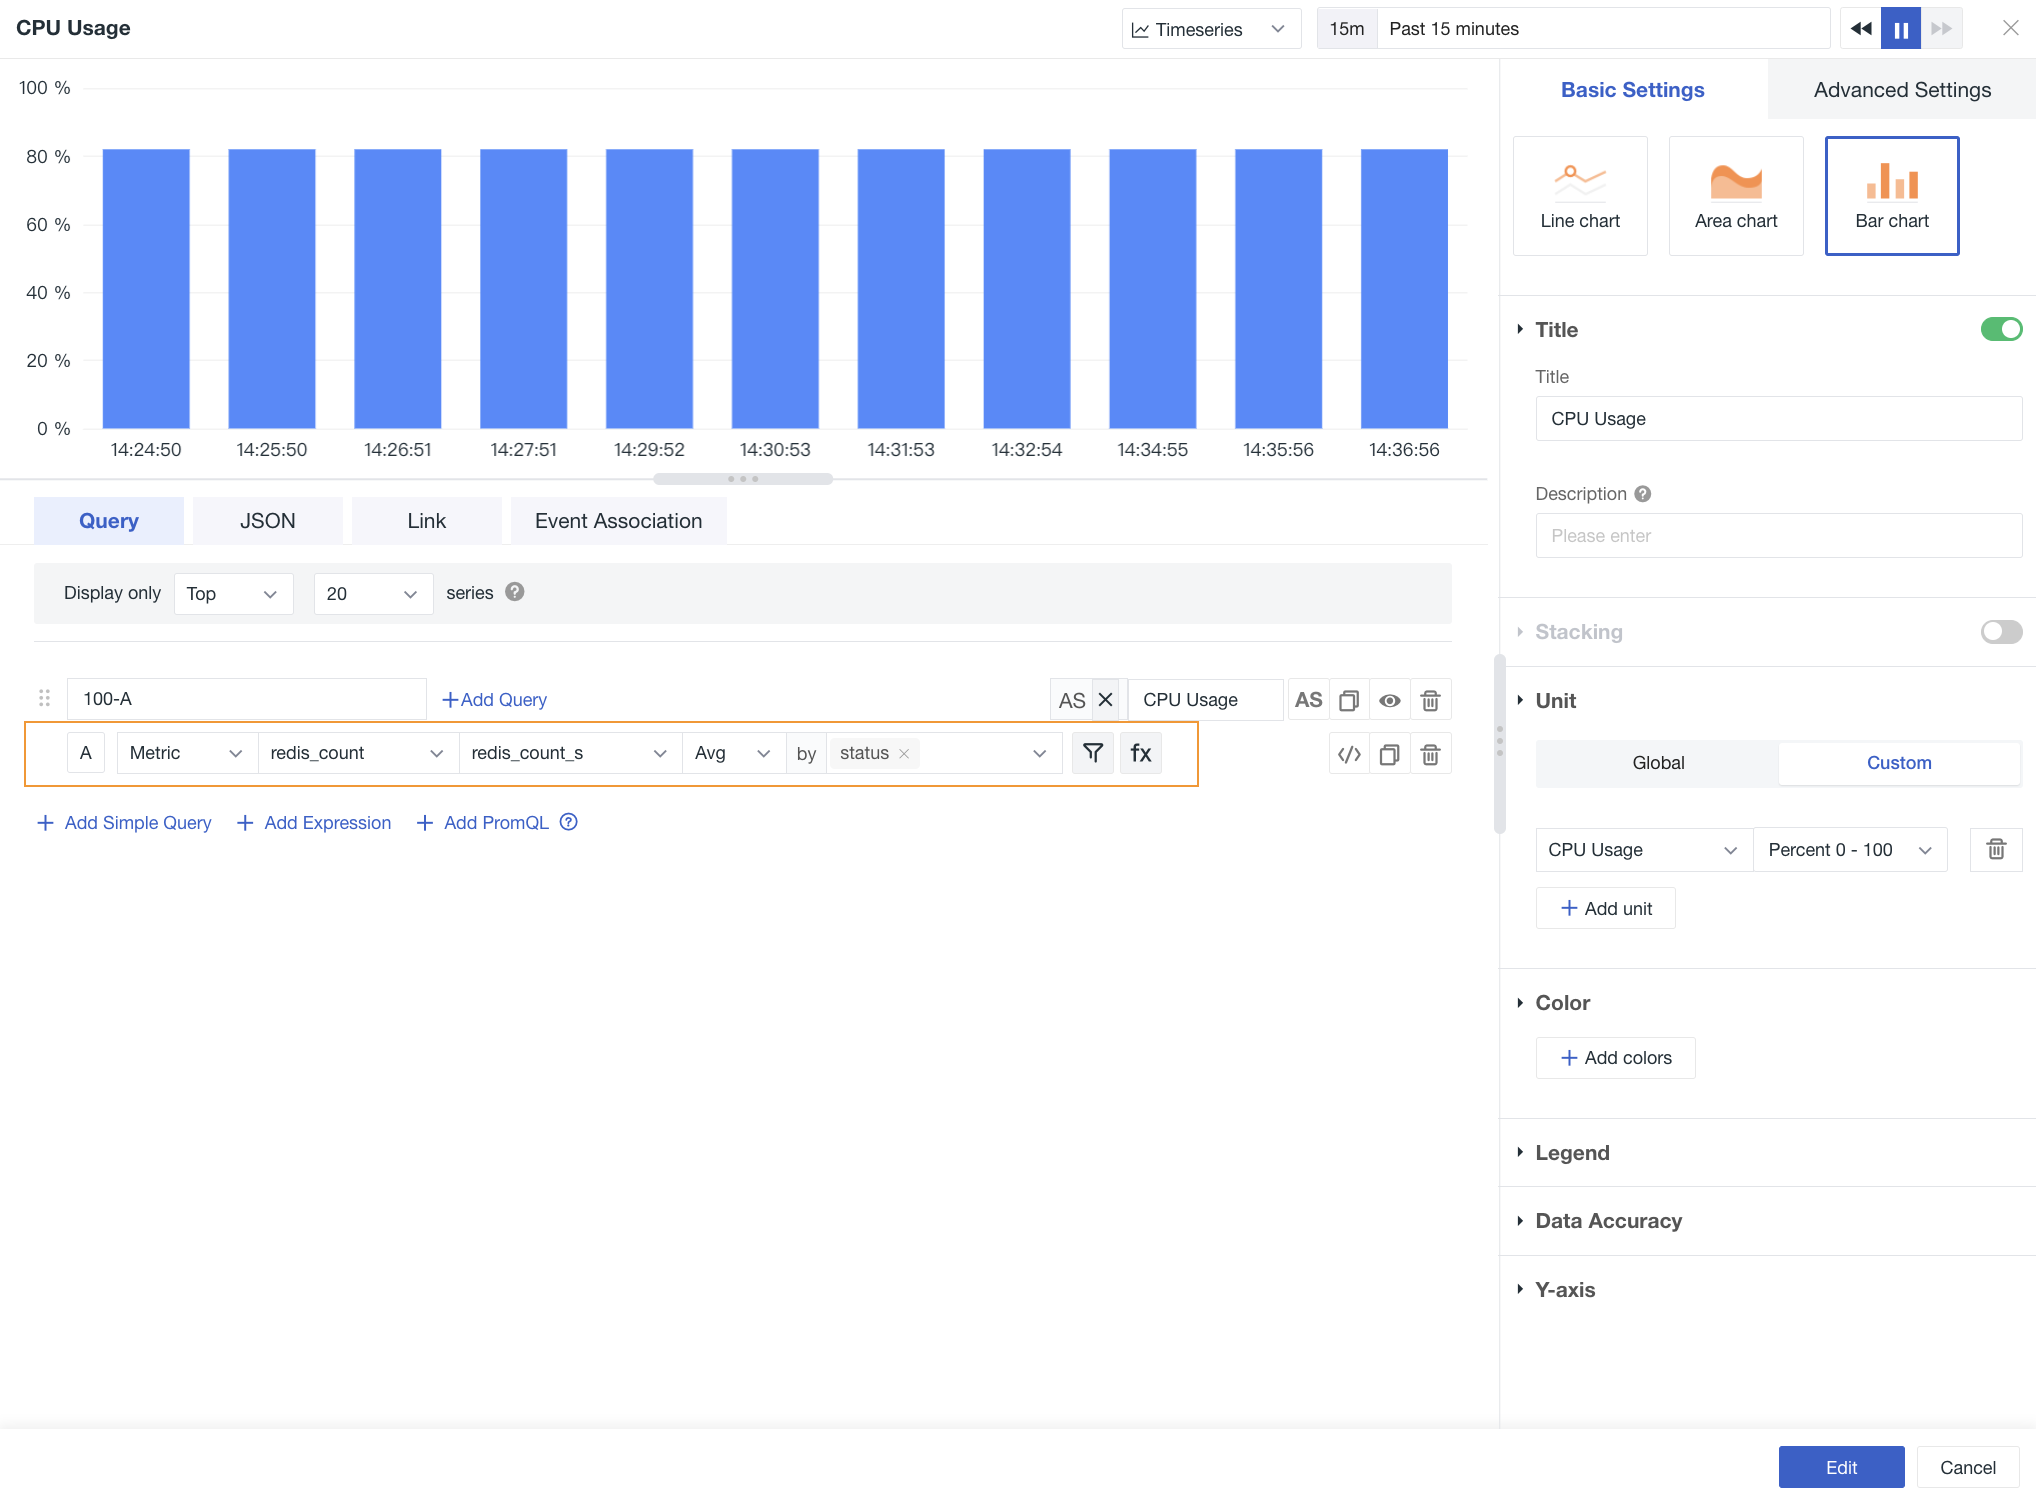
On the Generate Metrics page, click the Open in Metrics Analysis button on the right side of the rule to navigate to the Metrics Analysis page for querying and analysis.
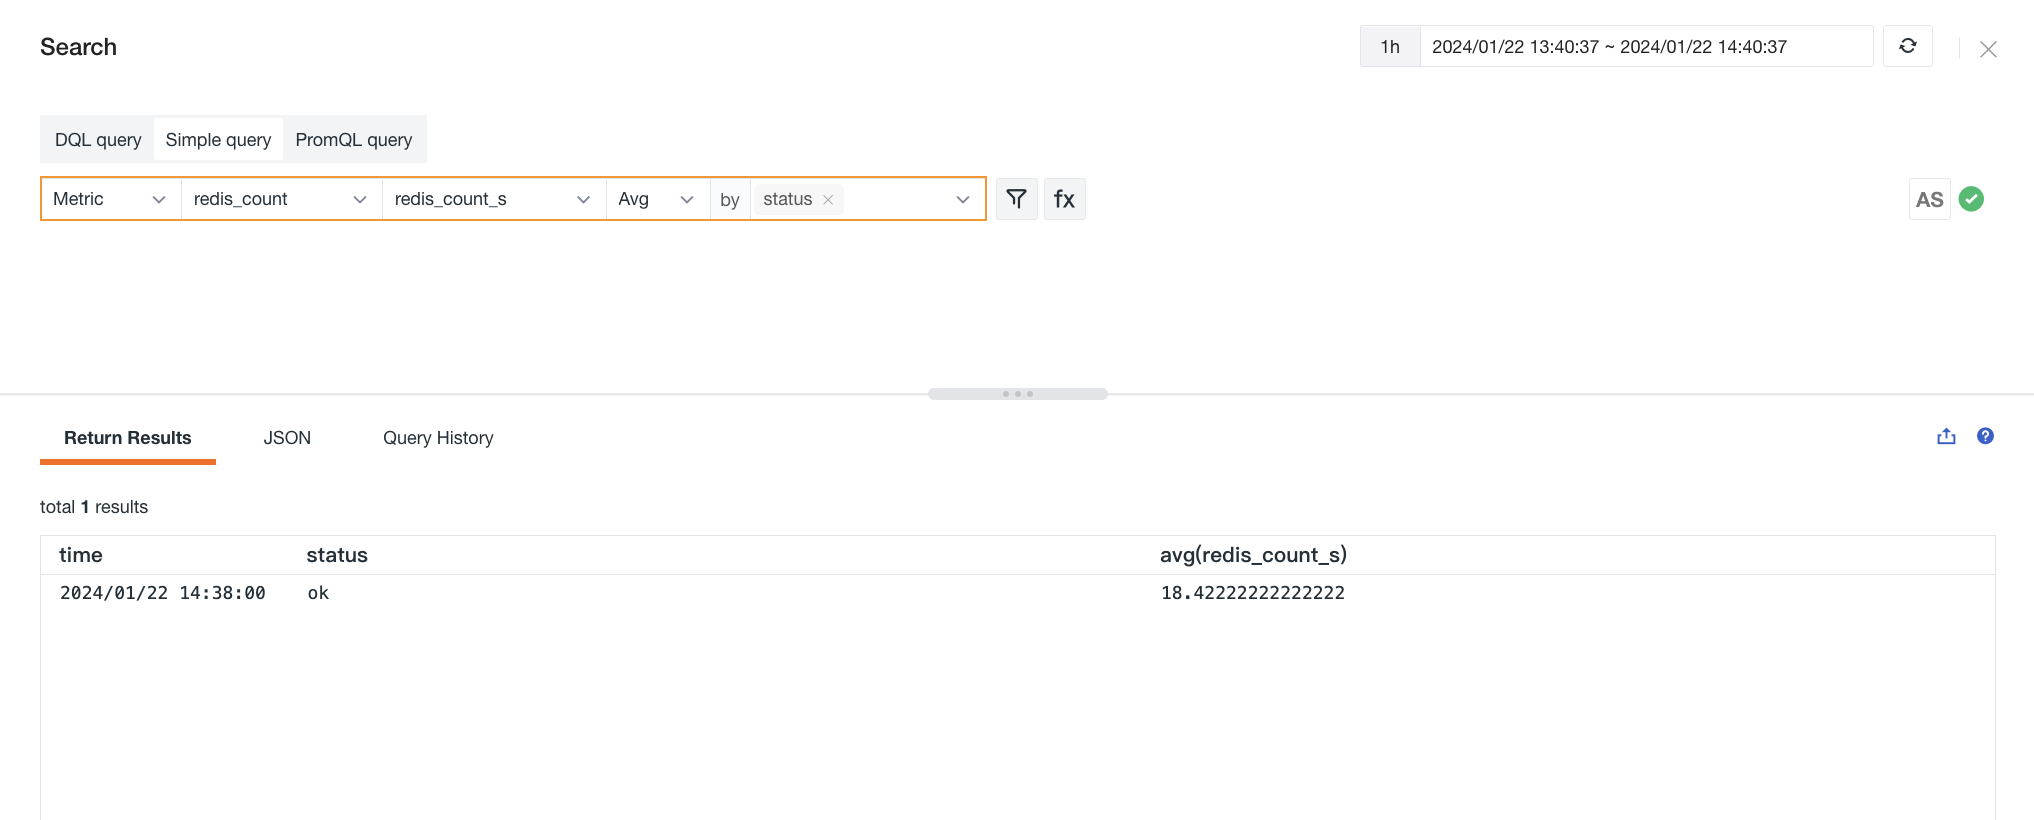
Note: Metrics are generated based on the frequency you choose, aggregating data within the selected time range. If no data is reported during this period, metrics cannot be generated and thus cannot be queried or searched in Metrics.
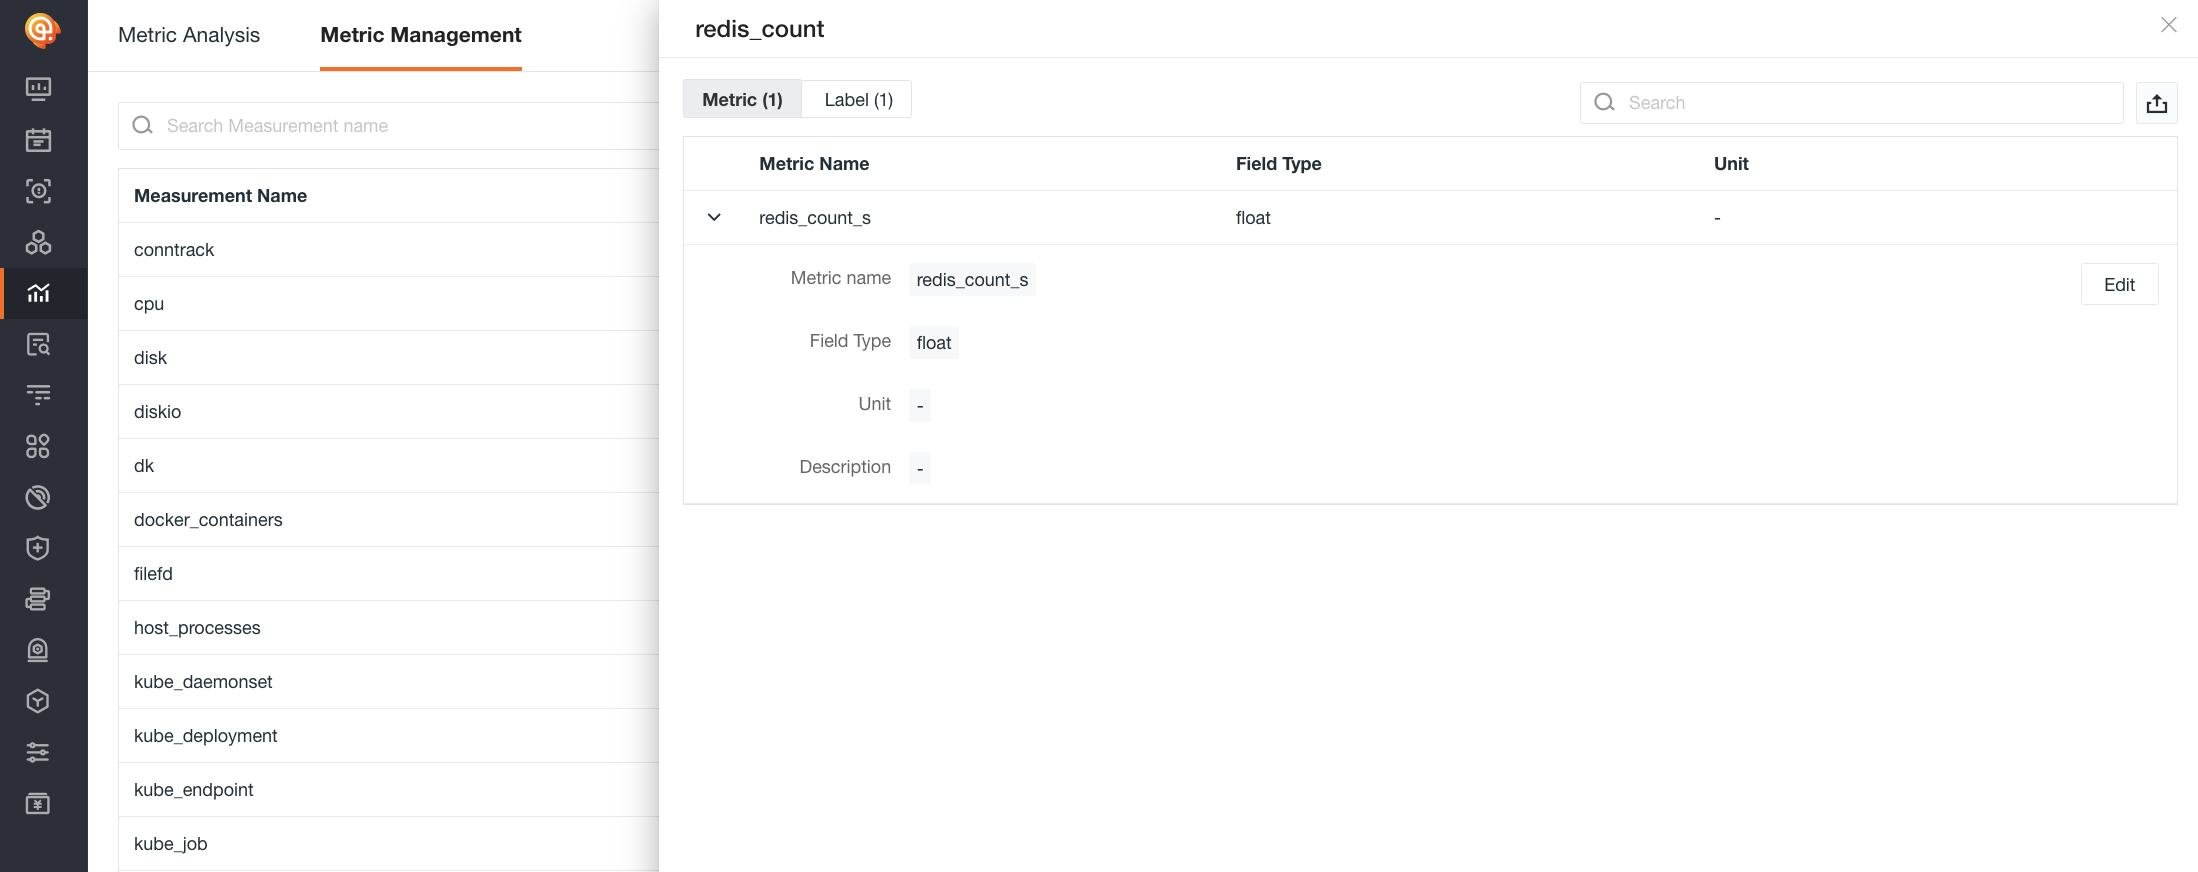
In Metrics Management
On the Generate Metrics page, click the Open in Metrics Management button on the right side of the rule to navigate to the Metrics Management page to view metrics and tags, supporting editing of metric units and descriptions.
Use Cases
Chart Queries
After metrics are generated, you can go to Use Cases > Dashboard > Create Dashboard, and use Visual Charts to query and analyze metric data.
DQL Query Tool
After metrics are generated, you can use the Query Tool via Shortcut > Query Tool to query and analyze metric data.