Intelligent Monitoring
Intelligent Monitoring provides a mechanism for quickly locating abnormal nodes, which is essential for business analysis, user behavior analysis, and root cause analysis during failures. It is suitable for business metrics and highly volatile indicators. By building analysis scenarios, it locates key dimensions for multi-dimensional metrics. After identifying the scope of business dimensions, it quickly locates and analyzes anomalies around service invocations in microservices and service resource dependencies.
Monitor through various intelligent detection rule configurations. Set the detection scope and notification recipients. Based on intelligent detection algorithms, it identifies abnormal data and predicts future trends.
Note
Different from traditional monitoring methods, Intelligent Monitoring does not require configuring detection thresholds or trigger rules. You only need to set the detection scope and notification recipients to enable monitoring with one click. It uses intelligent algorithms to identify and locate anomalies and supports analysis and reporting of abnormal intervals.
Usage Notes
Data Storage
-
Due to the need for data archiving, enabling Log and Application intelligent detection will generate a new number of time series, which is the number of detection dimensions filtered by the current monitor configuration filter conditions (Service, Source) * the number of detection metrics (provided the metrics are valid values).
-
Intelligent Monitoring detection metrics:
- Log intelligent detection: Error log count (
error_log_count), Log count (log_count); - Application intelligent detection: P90 latency (
p90), Error request count (error_request_count), Request count (request_count).
- Log intelligent detection: Error log count (
-
-
To reduce overhead, the time series rewriting for Log and Application intelligent detection adopts a minimal storage logic. It only retains the detection dimensions, measurement name, and detection metrics, and does not store the monitor's filter conditions. Given this current storage rewriting logic, if the monitor's filter condition configuration is modified, new time series will be generated. Therefore, duplicate billing for time series might occur on the day the monitor's filter conditions are modified. The changes take effect immediately after modification.
-
To improve algorithm accuracy and achieve the best detection results, please set the metric storage period to a maximum of 30 days before enabling Intelligent Monitoring (default configuration is 7 days).
-
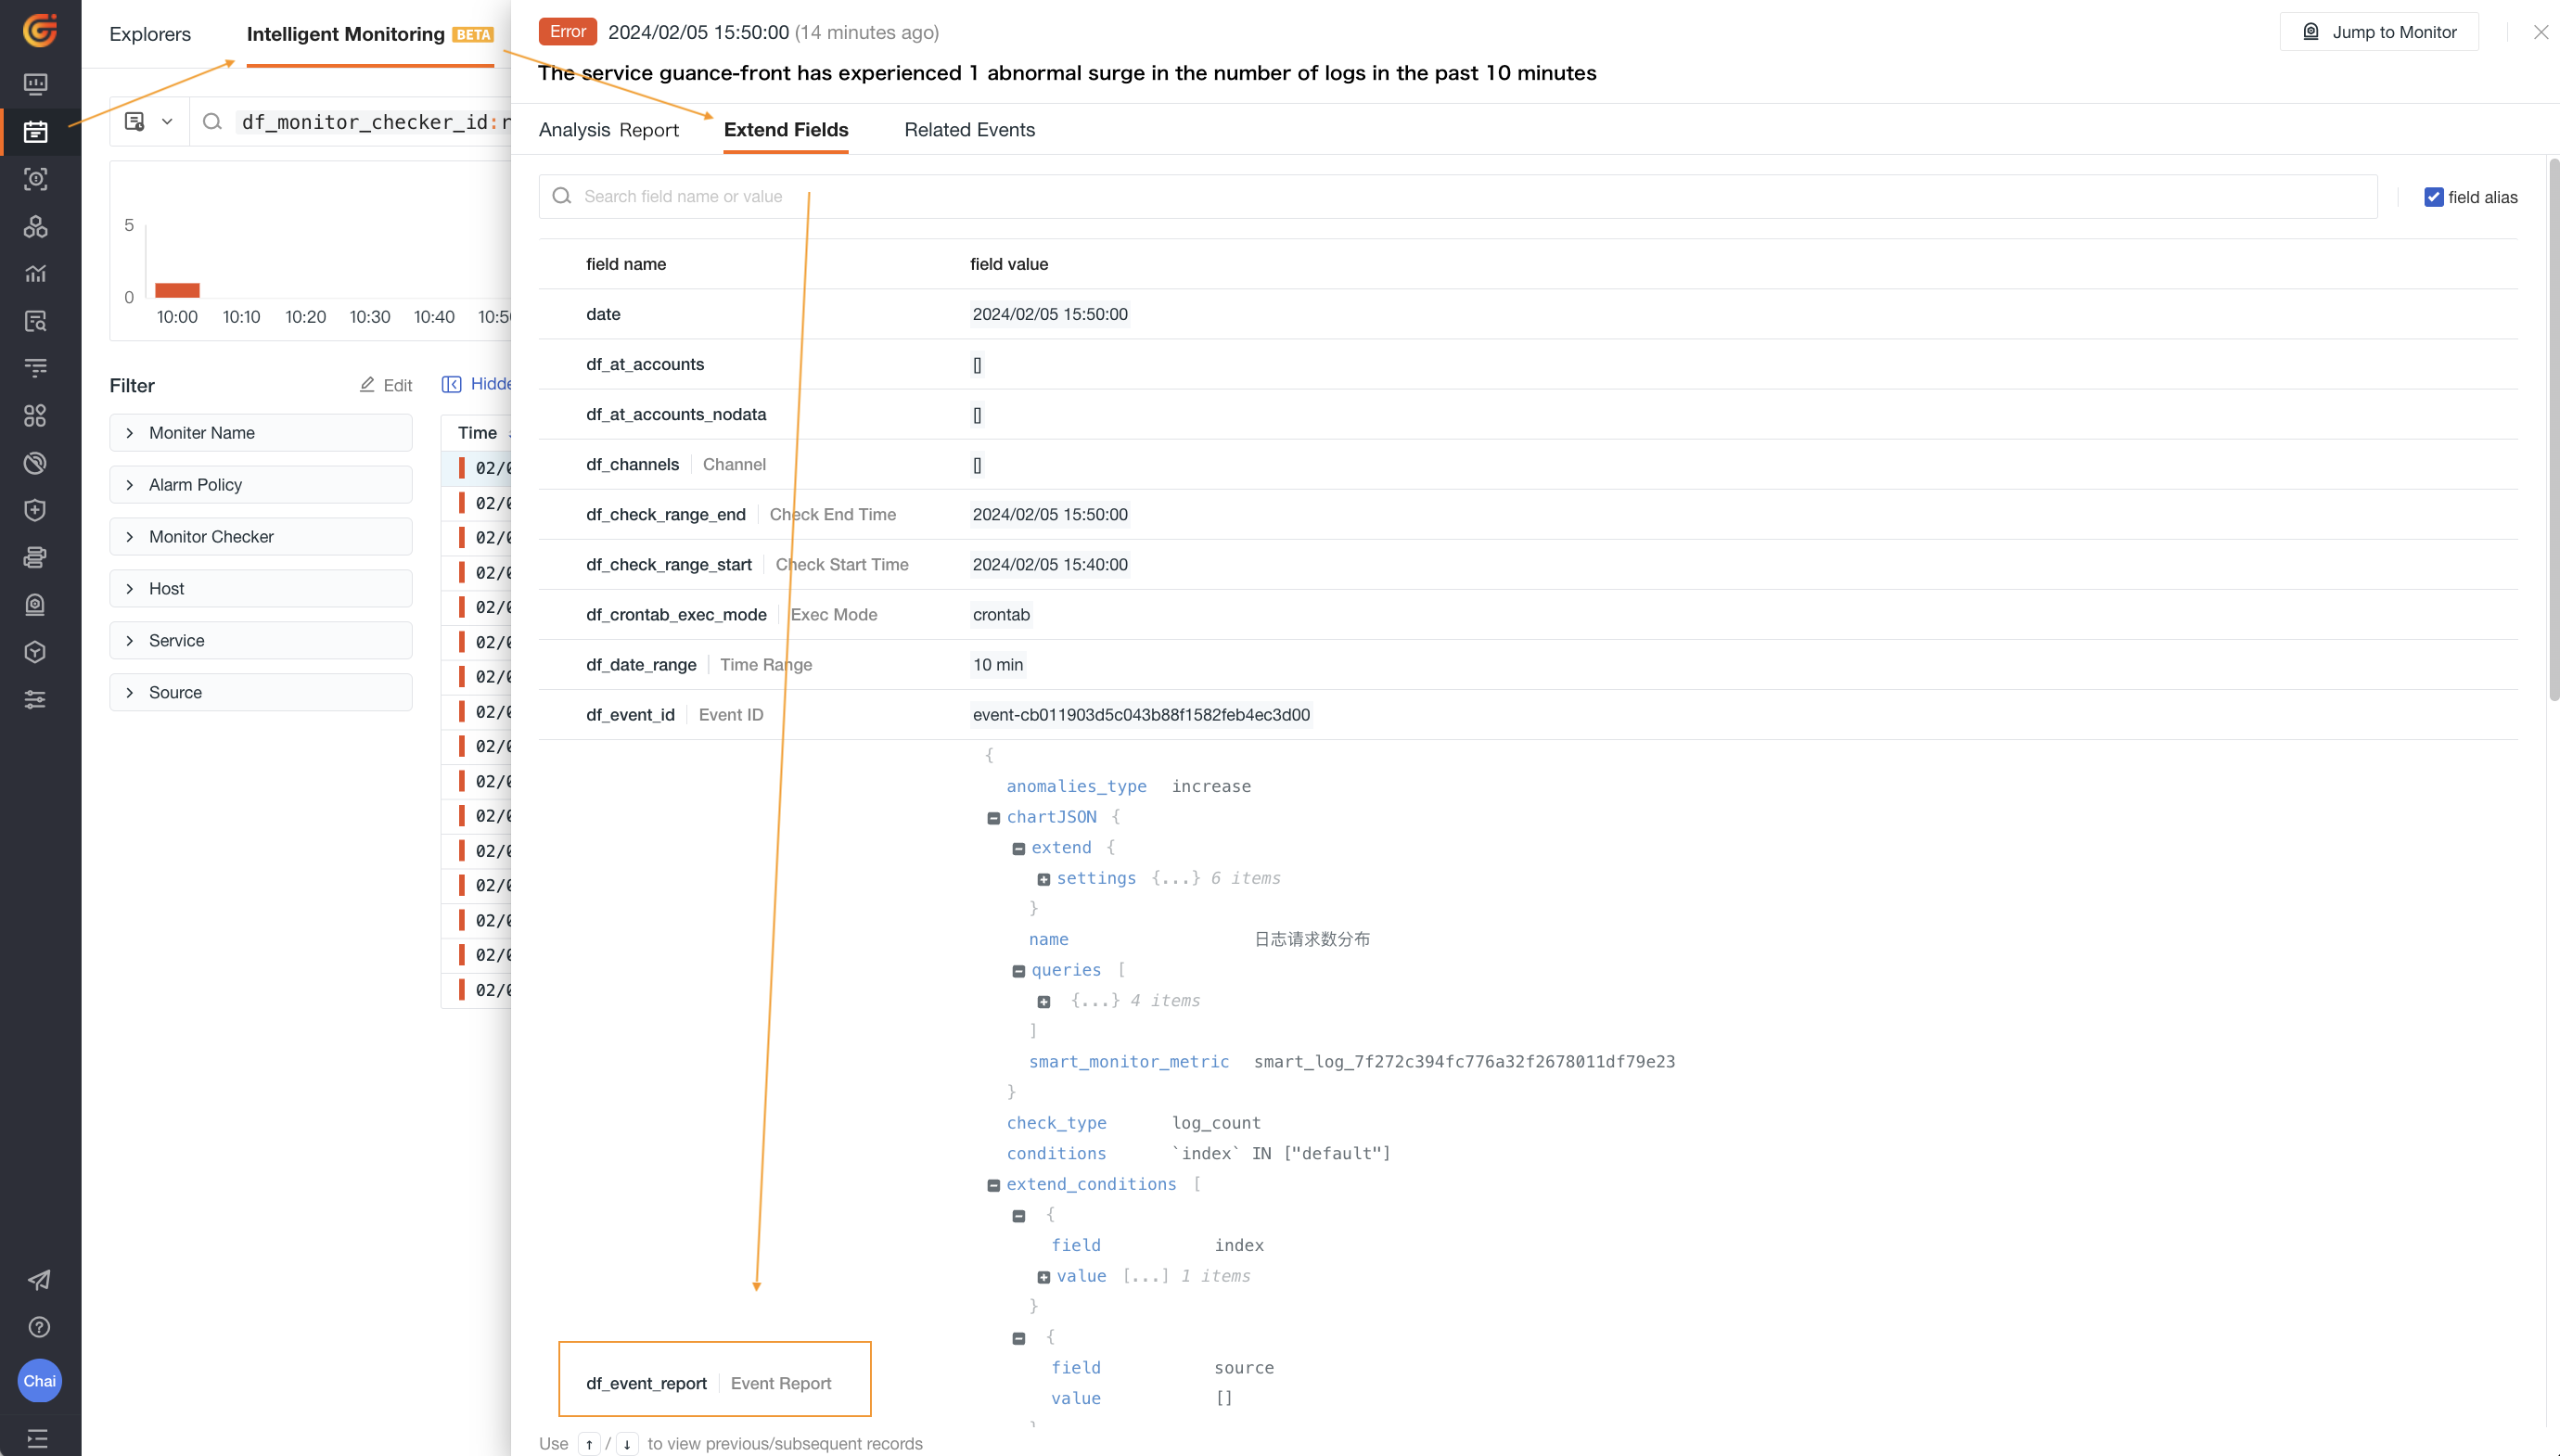
To view the metric data (Metric) rewritten by Log and Application intelligent detection, go to the current monitoring alert event > Extended Fields >
df_event_report> Report Content >smart_monitor_metric:smart_apm_ff5cf0ea792f4bac72ca1afdcd431c82.
Algorithm Description: Intelligent Monitoring uses algorithms based on the time-series anomaly detection library ADTK.
This monitoring system compares time series values with their values from the previous time window. If a value shows an abnormally large change compared to the average or median of its previous period, that time point is identified as an anomaly. Simultaneously, the system calculates the expected normal range for the current detection dimension based on past data. This expected range is determined based on the time of day and the day of the week. In this way, the system can verify whether the anomalies detected in the data are genuine.
Rule Types
Currently, Guance supports various intelligent detection rules, with different rules covering different data scopes.
Rule Name |
Data Scope |
Basic Description |
|---|---|---|
| Host Intelligent Detection | Metrics (M) | Automatically detects hosts using intelligent algorithms to discover CPU and memory anomalies. |
| Log Intelligent Detection | Logs (L) | Automatically detects anomalies in logs using intelligent algorithms. Detection metrics include log count and error log count. |
| Application Intelligent Detection | Traces (T) | Automatically detects anomalies in applications using intelligent algorithms. Detection metrics include application request count, error request count, and request latency. |
| RUM Intelligent Detection | RUM Data (R) | Automatically detects anomalies in websites/APPs using intelligent algorithms, including page performance analysis and error analysis. Related detection metrics include LCP, FID, CLS, Loading Time, etc. |
| Kubernetes Intelligent Detection | Metrics (M) | Automatically detects anomalies in Kubernetes using intelligent algorithms. Detection metrics include total Pod count, Pod restarts, Api QPS, etc. |
| Cloud Bill Intelligent Monitoring | Cloud Bills (B) | Automatically detects abnormal billing costs in accounts from different cloud providers using intelligent algorithms. The detection metric is billing cost. |
Getting Started
-
Set the corresponding detection conditions for different detection rules;
-
Fill in the event notification content as needed;
- Configure alert strategies;
- Set operation permissions;
- Save.
Billing Details
- Host, Log, and Application intelligent detection runs every 10 minutes. Each execution of detection is calculated as 10 trigger calls;
- RUM intelligent detection calculates each execution as 100 trigger calls.
For more details, please refer to Triggers.