Fluentd Logs
Fluentd log collection, which reports log text data to Guance.
Installation and Deployment
Prerequisites
- td-agent-4.2.x >= 4.2.x
- Check if Fluentd data is being collected properly
Collector Configuration
Enter the conf.d/samples directory under the DataKit installation directory, copy logstreaming.conf.sample and rename it to logstreaming.conf. Example as follows:
Restart DataKit
Linux Fluentd Collecting nginx Logs Integration with DataKit
Take Fluentd collecting nginx logs and forwarding them to an upstream server end plugin configuration as an example. We don’t want to send directly to the server end for processing but rather process them locally and send them to DataKit for analysis on the Guance platform.
##PC log collection
<source>
  @type tail
  format ltsv
  path /var/log/nginx/access.log
  pos_file /var/log/buffer/posfile/access.log.pos
  tag nginx
  time_key time
  time_format %d/%b/%Y:%H:%M:%S %z
</source>

##Collected data forwarded via TCP protocol to port 49875 of multiple servers
## Multiple output
<match nginx>
 type forward
  <server>
   name es01
   host es01
   port 49875
   weight 60
  </server>
  <server>
   name es02
   host es02
   port 49875
   weight 60
  </server>
</match>
Modify the match output by specifying the type as http and pointing the endpoint to the DataKit address that has logstreaming enabled to complete the collection.
##PC log collection
<source>
  @type tail
  format ltsv
  path /var/log/nginx/access.log
  pos_file /var/log/buffer/posfile/access.log.pos
  tag nginx
  time_key time
  time_format %d/%b/%Y:%H:%M:%S %z
</source>

##Collected data forwarded via HTTP protocol to local DataKit
## nginx output
<match nginx>
  @type http
  endpoint http://127.0.0.1:9529/v1/write/logstreaming?source=nginx_td&pipeline=nginx.p
  open_timeout 2
  <format>
    @type json
  </format>
</match>
After modifying the configuration, restart td-agent to complete the data reporting.
You can verify the reported data through DQL:
dql > L::nginx_td LIMIT 1
-----------------[ r1.nginx_td.s1 ]-----------------
    __docid 'L_c6et7vk5jjqulpr6osa0'
create_time 1637733374609
    date_ns 96184
       host 'df-solution-ecs-018'
    message '{"120.253.192.179 - - [24/Nov/2021":"13:55:10 +0800] \"GET / HTTP/1.1\" 304 0 \"-\" \"Mozilla/5.0 (Macintosh; Intel Mac OS X 10_15_7) AppleWebKit/537.36 (KHTML, like Gecko) Chrome/96.0.4664.45 Safari/537.36\" \"-\""}'
     source 'nginx_td'
       time 2023-11-07 13:56:06 +0800 CST
---------
1 rows, 1 series, cost 2ms
Windows Fluentd Collecting nginx Logs Integration with DataKit
Take Fluentd collecting nginx logs and forwarding them to an upstream server end plugin configuration as an example. We don’t want to send directly to the server end for processing but rather process them locally and send them to DataKit for analysis on the Guance platform.
##PC log collection
<source>
  @type tail
  format ltsv
  path D://opt/nginx/log/access.log
  pos_file D://opt/nginx/log/access.log.pos
  tag nginx
  time_key time
  time_format %d/%b/%Y:%H:%M:%S %z
</source>

##Collected data forwarded via TCP protocol to port 49875 of multiple servers
## Multiple output
<match nginx>
 type forward
  <server>
   name es01
   host es01
   port 49875
   weight 60
  </server>
  <server>
   name es02
   host es02
   port 49875
   weight 60
  </server>
</match>
Modify the match output by specifying the type as http and pointing the endpoint to the DataKit address that has logstreaming enabled to complete the collection.
## PC log collection
<source>
  @type tail
  format ltsv
  path D://opt/nginx/log/access.log
  pos_file D://opt/nginx/log/access.log.pos
  tag nginx
  time_key time
  time_format %d/%b/%Y:%H:%M:%S %z
</source>

## Collected data forwarded via HTTP protocol to local DataKit
## nginx output
<match nginx>
  @type http
  endpoint http://127.0.0.1:9529/v1/write/logstreaming?source=nginx_td&pipeline=nginx.p
  open_timeout 2
  <format>
    @type json
  </format>
</match>
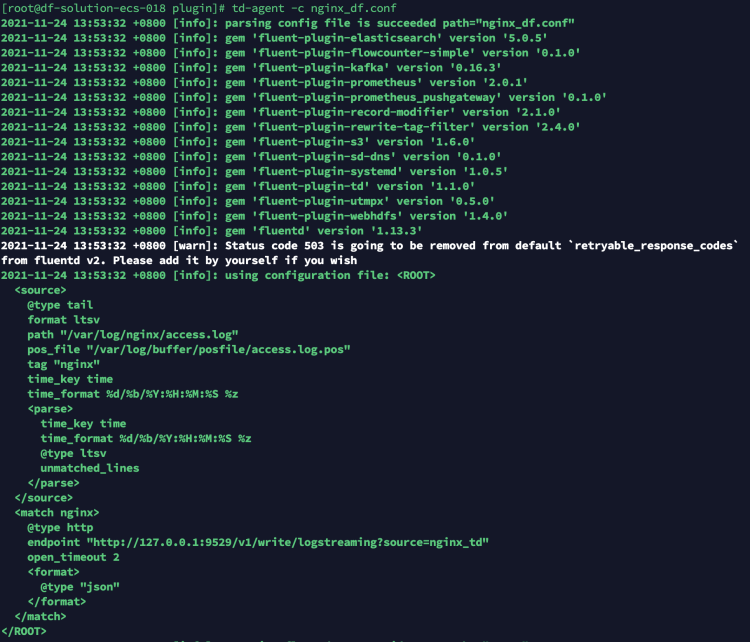
After modifying the configuration, restart fluentd -c with the modified configuration file to complete the data reporting.

You can verify the reported data through DQL:
dql > L::nginx_td LIMIT 1
-----------------[ r1.nginx_td.s1 ]-----------------
    __docid 'L_c6et7vk5jjqulpr6osa0'
create_time 1637733374609
    date_ns 96184
       host 'df-solution-ecs-018'
    message '{"120.253.192.179 - - [03/Mar/2022":"13:55:10 +0800] \"GET / HTTP/1.1\" 304 0 \"-\" \"Mozilla/5.0 (Macintosh; Intel Mac OS X 10_15_7) AppleWebKit/537.36 (KHTML, like Gecko) Chrome/96.0.4664.45 Safari/537.36\" \"-\""}'
     source 'nginx_td'
       time 2023-11-07 13:56:06 +0800 CST
---------
1 rows, 1 series, cost 2ms
Kubernetes sidecar Fluentd Collecting nginx Logs Integration with DataKit
Take a Deployment of Fluentd sidecar collecting nginx logs and forwarding them to an upstream server end plugin configuration as an example. We don’t want to send directly to the server end for processing but rather process them locally and send them to DataKit for analysis on the Guance platform.
apiVersion: apps/v1
kind: Deployment
metadata:
  name: sidecar-fd
  namespace: fd
  labels:
    app: webserver
spec:
  replicas: 1
  selector:
    matchLabels:
      app: webserver
  template:
    metadata:
      labels:
        app: webserver
      annotations:
    spec:
      containers:
      - name: nginx
        image: nginx:1.17.1
        imagePullPolicy: IfNotPresent
        ports:
        - containerPort: 80
        volumeMounts: # Mount logs-volume to the corresponding directory in the nginx container, which is /var/log/nginx
        - name: logs-volume
          mountPath: /var/log/nginx
      - name: fluentd
        image: bitnami/fluentd:1.14.5
        #command: [ "/bin/bash", "-ce", "tail -f /dev/null" ]
        env:
        - name: FLUENT_UID
          value: fluent
        - name: FLUENT_CONF
          value: fluent.conf
        - name: FLUENTD_ARGS
          value: -c /fluentd/etc/fluentd.conf
        volumeMounts:
        - name: logs-volume
          mountPath: /var/log/nginx/
        - name: varlog
          mountPath: /var/log/
        - name: config-volume
          mountPath: /opt/bitnami/fluentd/conf/

      volumes:
      - name: logs-volume
        emptyDir: {}
      - name: varlog
        emptyDir: {}
      - name: config-volume
        configMap:
          name: fluentd-config

---

apiVersion: v1
kind: ConfigMap
metadata:
  name: fluentd-config
  namespace: fd
data:
  fluentd.conf: |
      <source>
        @type tail
        format ltsv
        path /var/log/nginx/access.log
        pos_file /var/log/nginx/posfile/access.log.pos
        tag nginx
        time_key time
        time_format %d/%b/%Y:%H:%M:%S %z
      </source>
      ##Collected data forwarded via TCP protocol to port 49875 of multiple servers
      ## Multiple output
      <match nginx>
       type forward
        <server>
         name es01
         host es01
         port 49875
         weight 60
        </server>
        <server>
         name es02
         host es02
         port 49875
         weight 60
        </server>
      </match>
      ##Collected data forwarded via HTTP protocol to local DataKit
      ## nginx output
      <match nginx>
        @type http
        endpoint http://114.55.6.167:9529/v1/write/logstreaming?source=fluentd_sidecar
        open_timeout 2
        <format>
          @type json
        </format>
      </match>

---

apiVersion: v1
kind: Service
metadata:
  name: sidecar-svc
  namespace: fd
spec:
  selector:
    app: webserver
  type: NodePort
  ports:
  - name: sidecar-port
    port: 80
    nodePort: 32004
Modify the match output in the mounted Fluentd configuration file by specifying the type as http and pointing the endpoint to the DataKit address that has logstreaming enabled to complete the collection.
apiVersion: apps/v1
kind: Deployment
metadata:
  name: sidecar-fd
  namespace: fd
  labels:
    app: webserver
spec:
  replicas: 1
  selector:
    matchLabels:
      app: webserver
  template:
    metadata:
      labels:
        app: webserver
      annotations:
    spec:
      containers:
      - name: nginx
        image: nginx:1.17.1
        imagePullPolicy: IfNotPresent
        ports:
        - containerPort: 80
        volumeMounts: # Mount logs-volume to the corresponding directory in the nginx container, which is /var/log/nginx
        - name: logs-volume
          mountPath: /var/log/nginx
      - name: fluentd
        image: bitnami/fluentd:1.14.5
        #command: [ "/bin/bash", "-ce", "tail -f /dev/null" ]
        env:
        - name: FLUENT_UID
          value: fluent
        - name: FLUENT_CONF
          value: fluent.conf
        - name: FLUENTD_ARGS
          value: -c /fluentd/etc/fluentd.conf
        volumeMounts:
        - name: logs-volume
          mountPath: /var/log/nginx/
        - name: varlog
          mountPath: /var/log/
        - name: config-volume
          mountPath: /opt/bitnami/fluentd/conf/

      volumes:
      - name: logs-volume
        emptyDir: {}
      - name: varlog
        emptyDir: {}
      - name: config-volume
        configMap:
          name: fluentd-config

---

apiVersion: v1
kind: ConfigMap
metadata:
  name: fluentd-config
  namespace: fd
data:
  fluentd.conf: |
      <source>
        @type tail
        format ltsv
        path /var/log/nginx/access.log
        pos_file /var/log/nginx/posfile/access.log.pos
        tag nginx
        time_key time
        time_format %d/%b/%Y:%H:%M:%S %z
      </source>
      ##Collected data forwarded via HTTP protocol to local DataKit
      ## nginx output
      <match nginx>
        @type http
        endpoint http://114.55.6.167:9529/v1/write/logstreaming?source=fluentd_sidecar
        open_timeout 2
        <format>
          @type json
        </format>
      </match>

---

apiVersion: v1
kind: Service
metadata:
  name: sidecar-svc
  namespace: fd
spec:
  selector:
    app: webserver
  type: NodePort
  ports:
  - name: sidecar-port
    port: 80
    nodePort: 32004
After modifying the configuration, redeploy the yaml file to complete the data reporting. You can check if the data was successfully collected by accessing port 32004 on the corresponding node.

You can verify the reported data through DQL:
dql > L::nginx_td LIMIT 1
-----------------[ r1.nginx_td.s1 ]-----------------
    __docid 'L_c6et7vk5jjqulpr6osa0'
create_time 1637733374609
    date_ns 96184
       host 'df-solution-ecs-018'
    message '{"120.253.192.179 - - [24/Nov/2021":"13:55:10 +0800] \"GET / HTTP/1.1\" 304 0 \"-\" \"Mozilla/5.0 (Macintosh; Intel Mac OS X 10_15_7) AppleWebKit/537.36 (KHTML, like Gecko) Chrome/96.0.4664.45 Safari/537.36\" \"-\""}'
     source 'nginx_td'
       time 2023-11-07 13:56:06 +0800 CST
---------
1 rows, 1 series, cost 2ms