Bar Chart
Generally applicable for showing data changes over a period of time and comparing the contrast between various variables.
Includes two types of chart displays:
- Bar Chart
- Horizontal Bar Chart
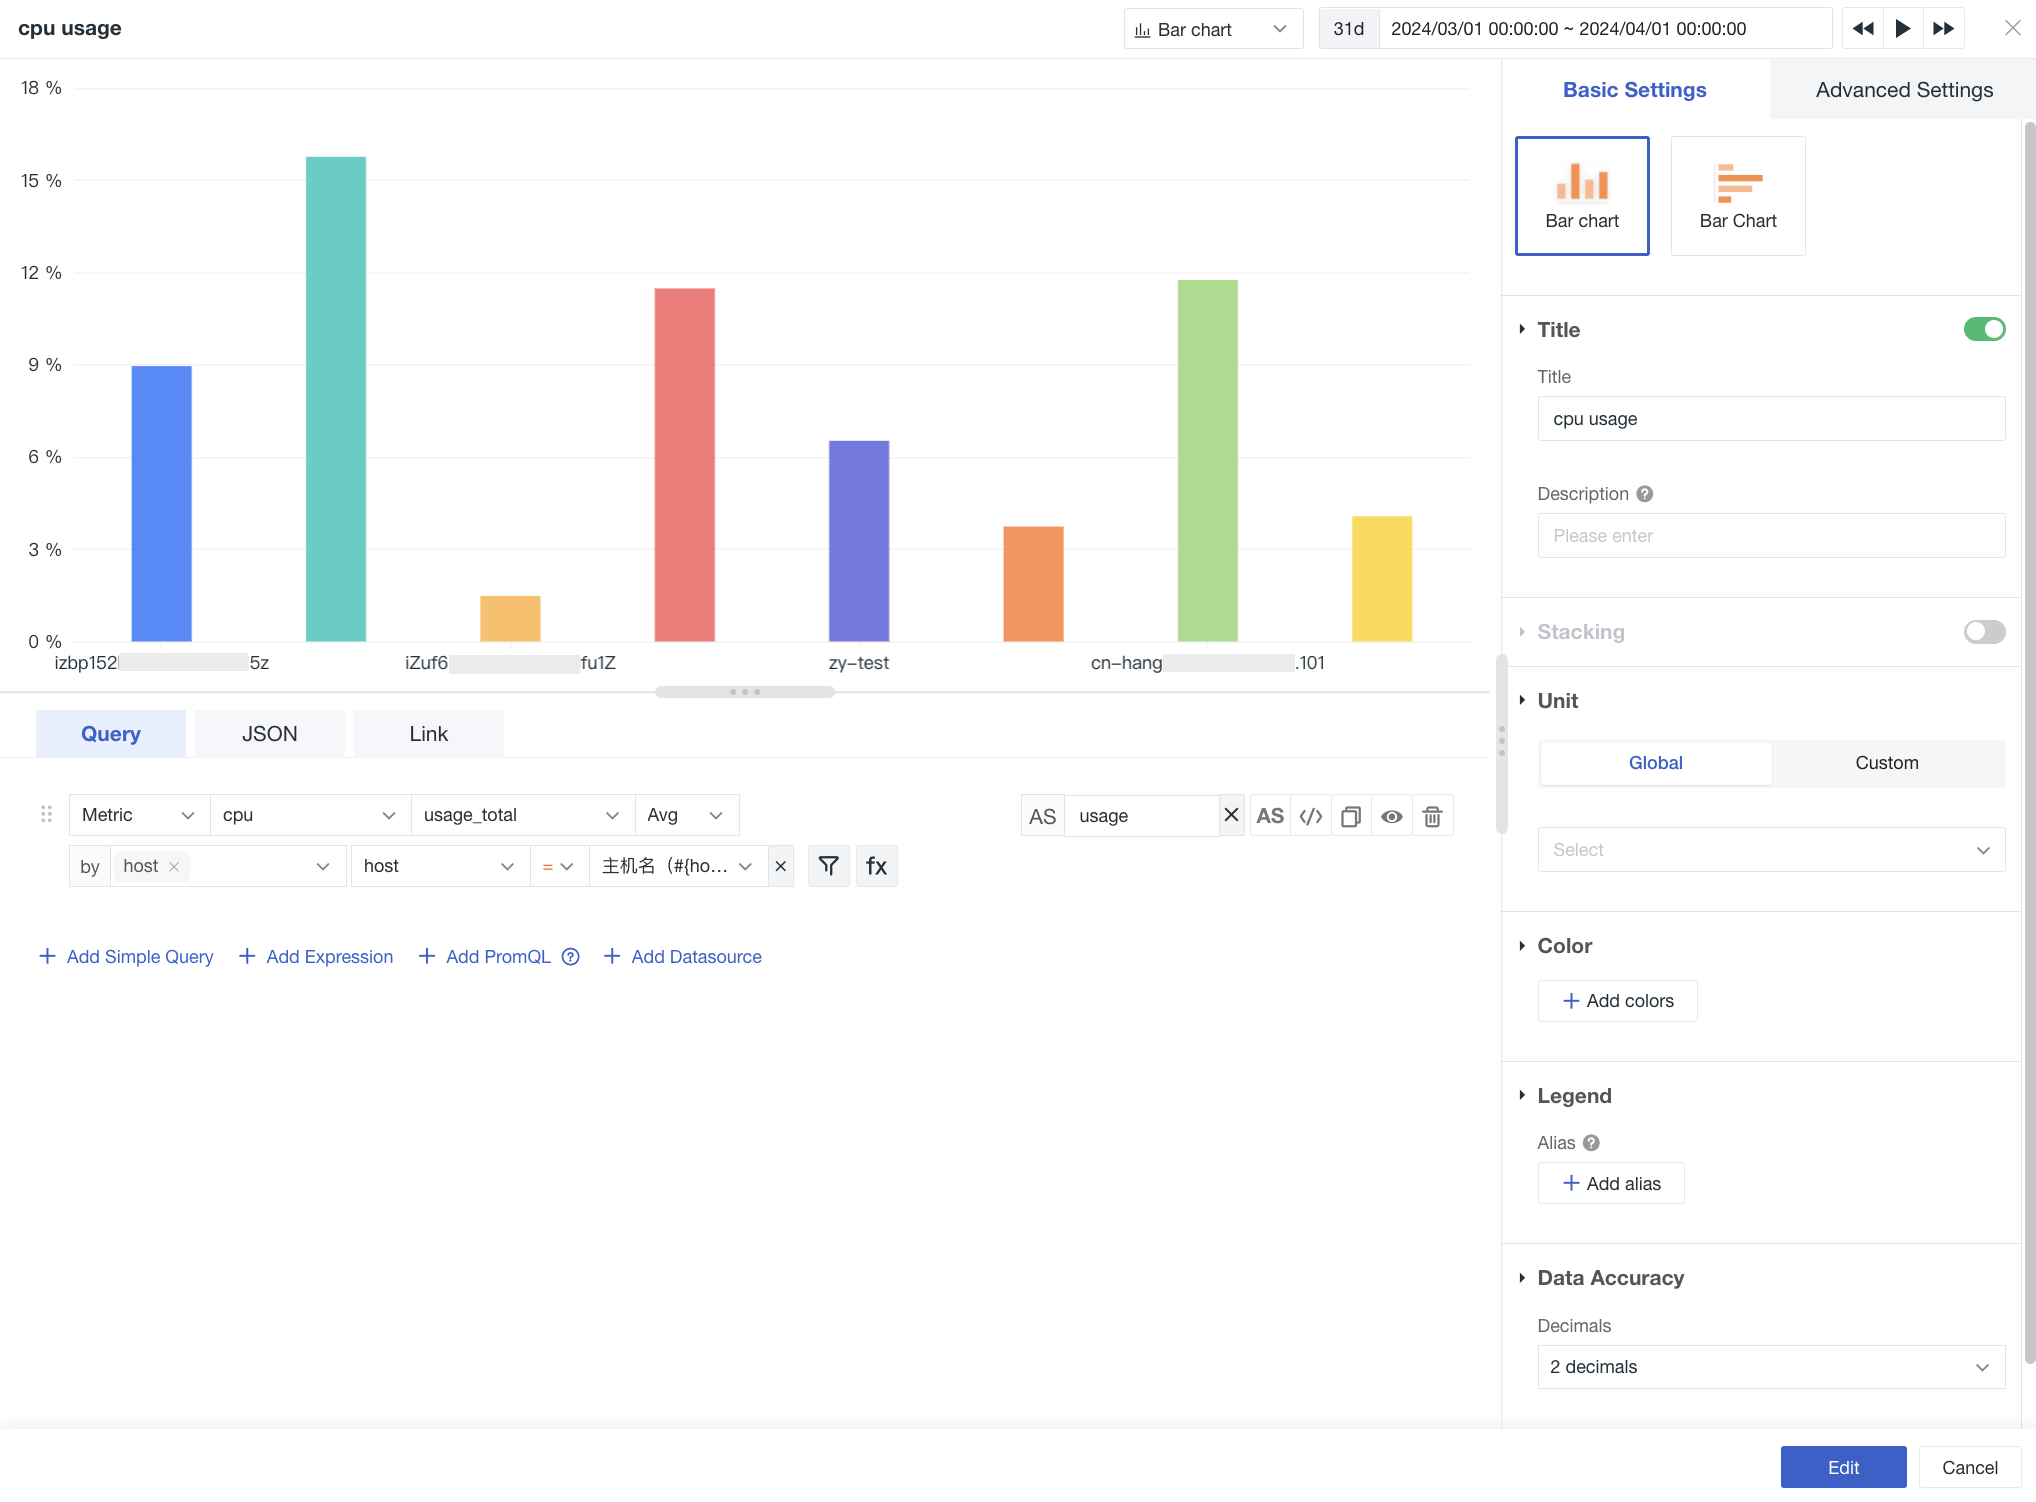
Chart Configuration
For more details, refer to Chart Configuration.
Stacking
-
Type: Includes standard stacking and percentage stacking.
-
X-axis
- Grouping: Each group corresponds to one bar; datasets with the same grouping are stacked;
- Query: Each query corresponds to one bar; groups within the query are stacked.
X Axis
Set rotated labels for sequence names to adjust the tilt angle of group names, allowing for more text content to be displayed.
Y Axis
Set the maximum and minimum values for the numerical X/Y axis.
Baseline
Add baseline values, baseline titles, and baseline colors. Set a standard or expected value for comparing changes and trends in the data.