Intelligent Inspection Events
The Intelligent Inspection Events Explorer centrally displays all events generated by Intelligent Inspection within the current workspace. You can filter by df_source:smartMonitor to view such events in all event explorers.
Event List
Go to Event Center > All Events, enter df_source:smartMonitor in the search bar to view all Intelligent Inspection events.
-
Use stacked bar charts to count the number of events triggered by different rules at different time points, providing an intuitive view of the time series distribution of AI-detected events.
-
Event Filtering: Supports keyword search, tag filtering, field filtering, and associative search on events based on tags, fields, and text, enabling quick location of specific types of AI anomaly events.
-
Aggregation Analysis: Supports aggregated event analysis based on selected field groupings. Perform multi-dimensional analysis in the analysis panel based on tag fields, and click on aggregated events to view details.
Event Details
Click on an Intelligent Inspection event to enter its details page. In addition to extended fields, extended attributes, and alert notifications, it includes:
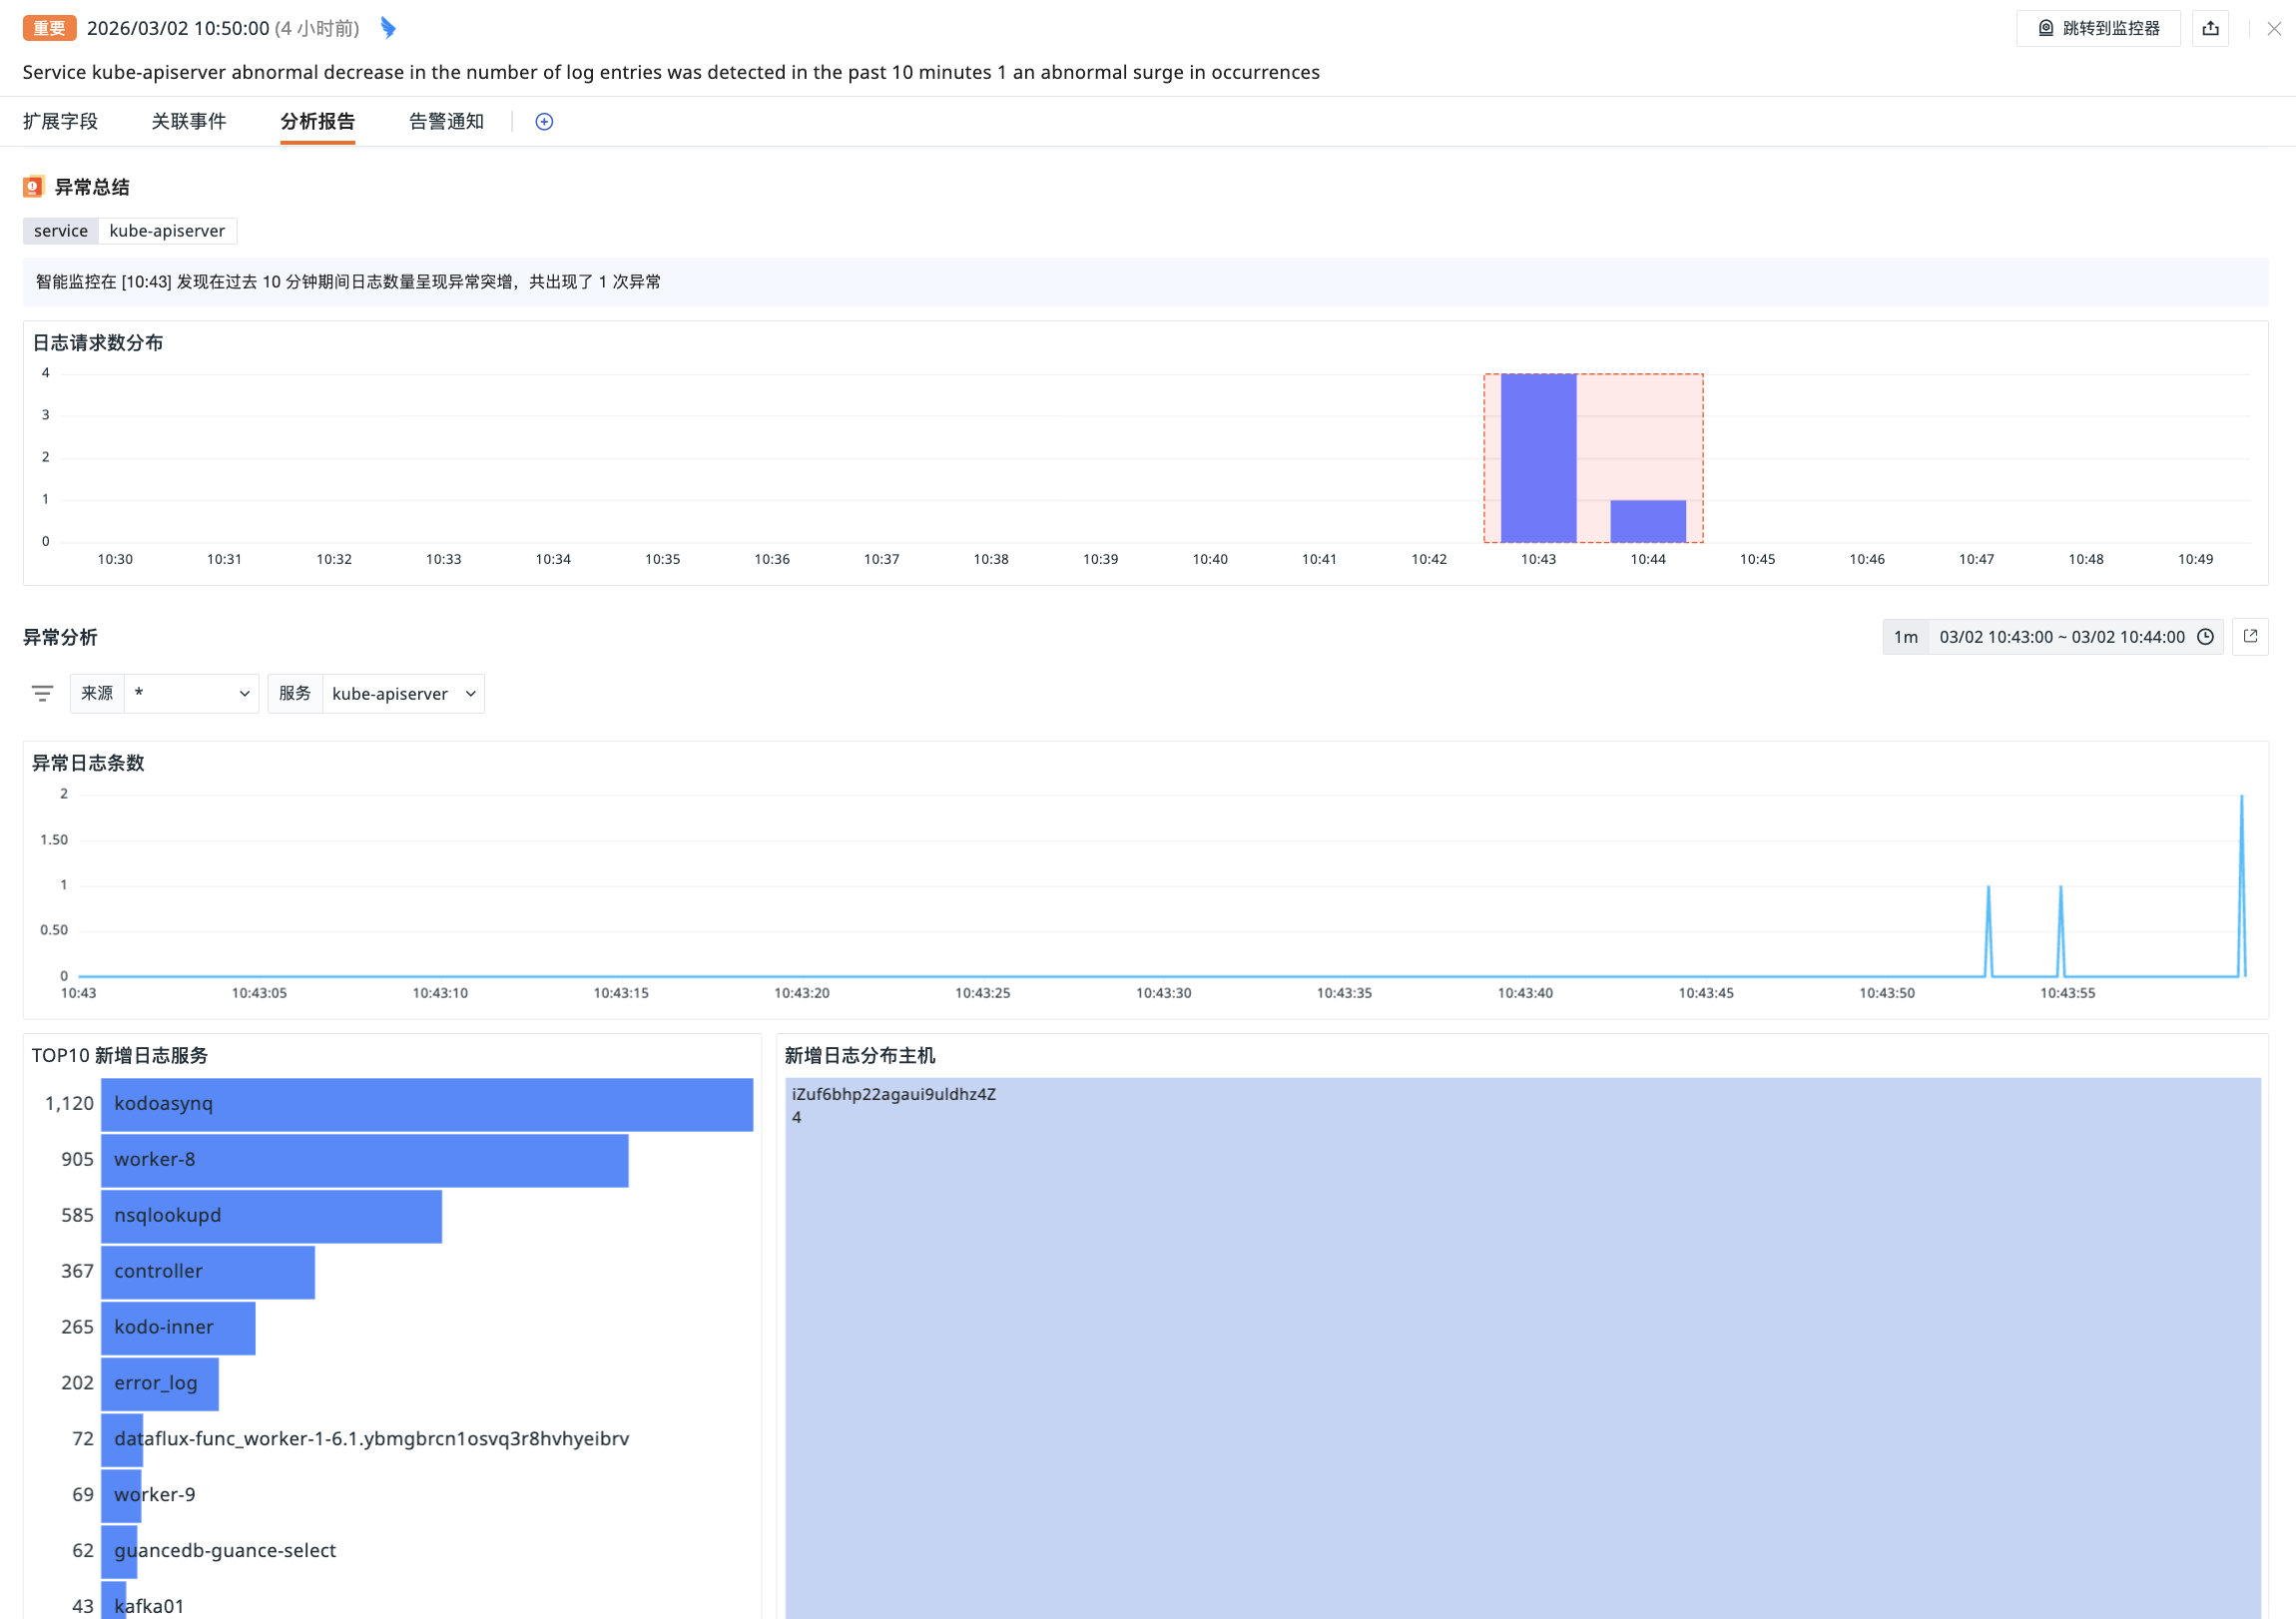
Analysis Report
The anomaly analysis report generated by Intelligent Inspection, including anomaly summary, anomaly analysis, etc.
Supports jumping to the monitor associated with the current event, or exporting key event information to PDF/JSON files.