DDTrace
DDTrace is an open-source APM (Application Performance Monitoring) product by DataDog. The DDTrace Agent embedded in DataKit is used to receive, process, and analyze data in the DataDog Tracing protocol.
DDTrace Documentation and Examples
-
Python
SDK · Documentation · Example
-
Java
SDK · Documentation · Example
-
Ruby
SDK · Documentation · Example
-
Golang
SDK · Documentation · Example
-
PHP
SDK · Documentation · Example
-
NodeJS
SDK · Documentation · Example
-
C++
SDK · Documentation · Example
-
.NET
Info
We have made some functional extensions to DDTrace to support more mainstream frameworks and more granular data tracing.
Configuration
Go to the conf.d/samples directory under the DataKit installation directory, copy ddtrace.conf.sample and name it ddtrace.conf. Examples are as follows:
[[inputs.ddtrace]]
  ## DDTrace Agent endpoints register by version respectively.
  ## Endpoints can be skipped listen by remove them from the list.
  ## NOTE: DO NOT EDIT.
  endpoints = ["/v0.3/traces", "/v0.4/traces", "/v0.5/traces"]

  ## customer_tags will work as a whitelist to prevent tags send to data center.
  ## All . will replace to _ ,like this :
  ## "project.name" to send to center is "project_name"
  # customer_tags = ["sink_project", "custom_dd_tag", "reg:key_*"]

  ## Keep rare tracing resources list switch.
  ## If some resources are rare enough(not presend in 1 hour), those resource will always send
  ## to data center and do not consider samplers and filters.
  # keep_rare_resource = false

  ## By default every error presents in span will be send to data center and omit any filters or
  ## sampler. If you want to get rid of some error status, you can set the error status list here.
  # omit_err_status = ["404"]

  ## compatible otel: It is possible to compatible OTEL Trace with DDTrace trace.
  ## make span_id and parent_id to hex encoding.
  # compatible_otel=true

  ##  It is possible to compatible B3/B3Multi TraceID with DDTrace.
  # trace_id_64_bit_hex=true

  ## api:/telemetry/proxy/api/v2/apmtelemetry is collect jvm metadata.
  ## data is: app-dependencies-loaded,app-client-configuration-change,app-integrations-change ...
  ## default is true.
  # apmtelemetry_route_enable = true

  ## When true, the tracer generates 128 bit Trace IDs,
  ## and encodes Trace IDs as 32 lowercase hexadecimal characters with zero padding.
  ## default is true.
  # trace_128_bit_id = true

  ## delete trace message
  # del_message = true

  ## max spans limit on each trace. default 100000 or set to -1 to remove this limit.
  # trace_max_spans = 100000

  ## max trace body(Content-Length) limit. default 32MiB or set to -1 to remove this limit.
  # max_trace_body_mb = 32

  ## tracing_metric_enable: trace_hits trace_hits_by_http_status trace_latency trace_errors trace_errors_by_http_status trace_apdex.
  ## Extract the above metrics from the collection traces.
  # tracing_metric_enable = true

  ## Blacklist of metric tags: There are many labels in the metric: "tracing_metrics".
  ## If you want to remove certain tag, you can use the blacklist to remove them.
  ## By default, it includes: source,span_name,env,service,status,version,resource,http_status_code,http_status_class
  ## and "customer_tags", k8s related tags, and others service.
  # tracing_metric_tag_blacklist = ["resource","operation","tag_x"]

  ## Whitelist of metric tags: There are many labels in the metric: "tracing_metrics".
  # tracing_metric_tag_whitelist = []

  ## Ignore tracing resources map like service:[resources...].
  ## The service name is the full service name in current application.
  ## The resource list is regular expressions uses to block resource names.
  ## If you want to block some resources universally under all services, you can set the
  ## service name as "*". Note: double quotes "" cannot be omitted.
  # [inputs.ddtrace.close_resource]
  #   service1 = ["resource1", "resource2", ...]
  #   service2 = ["resource1", "resource2", ...]
  #   "*" = ["close_resource_under_all_services"]
  #   ...

  ## Sampler config uses to set global sampling strategy.
  ## sampling_rate used to set global sampling rate.
  # [inputs.ddtrace.sampler]
  #   sampling_rate = 1.0

  # [inputs.ddtrace.tags]
  #   key1 = "value1"
  #   key2 = "value2"
  #   ...

  ## Threads config controls how many goroutines an agent cloud start to handle HTTP request.
  ## buffer is the size of jobs' buffering of worker channel.
  ## threads is the total number fo goroutines at running time.
  # [inputs.ddtrace.threads]
  #   buffer = 100
  #   threads = 8

  ## Storage config a local storage space in hard dirver to cache trace data.
  ## path is the local file path used to cache data.
  ## capacity is total space size(MB) used to store data.
  # [inputs.ddtrace.storage]
  #   path = "./ddtrace_storage"
  #   capacity = 5120
After configuration, restart DataKit to take effect.
You can enable the collector by injecting collector configuration via ConfigMap or configuring ENV_DATAKIT_INPUTS.
You can also modify configuration parameters via environment variables (you need to add the collector to ENV_DEFAULT_ENABLED_INPUTS as a default collector):
-
ENV_INPUT_DDTRACE_ENDPOINTS
Agent endpoints
Type: JSON
input.conf:
endpointsExample:
'["/v0.3/traces", "/v0.4/traces", "/v0.5/traces"]' -
ENV_INPUT_DDTRACE_CUSTOMER_TAGS
Whitelist to tags
Type: JSON
input.conf:
customer_tagsExample:
'["sink_project", "custom_dd_tag"]' -
ENV_INPUT_DDTRACE_KEEP_RARE_RESOURCE
Keep rare tracing resources list switch
Type: Boolean
input.conf:
keep_rare_resourceDefault: false
-
ENV_INPUT_DDTRACE_COMPATIBLE_OTEL
Compatible
OTEL TracewithDDTrace traceType: Boolean
input.conf:
compatible_otelDefault: false
-
ENV_INPUT_DDTRACE_TRACE_ID_64_BIT_HEX
Compatible
B3/B3Multi TraceIDwithDDTraceType: Boolean
input.conf:
trace_id_64_bit_hexDefault: false
-
ENV_INPUT_DDTRACE_TRACE_128_BIT_ID
Trace IDs as 32 lowercase hexadecimal
Type: Boolean
input.conf:
trace_128_bit_idDefault: true
-
ENV_INPUT_DDTRACE_DEL_MESSAGE
Delete trace message
Type: Boolean
input.conf:
del_messageDefault: false
-
ENV_INPUT_DDTRACE_TRACING_METRIC_ENABLE
These metrics capture request counts, error counts, and latency measures.
Type: Boolean
input.conf:
tracing_metric_enableDefault: false
-
ENV_INPUT_DDTRACE_APMTELEMETRY_ROUTE_ENABLE
Enable route
/telemetry/proxy/api/v2/apmtelemetryand collect JVM metadata.Type: Boolean
input.conf:
apmtelemetry_route_enableDefault: true
-
ENV_INPUT_DDTRACE_TRACING_METRIC_TAG_BLACKLIST
Blacklist of tags in the metric: "tracing_metrics"
Type: JSON
input.conf:
tracing_metric_tag_blacklistExample:
'["tag_a", "tag_b"]' -
ENV_INPUT_DDTRACE_TRACING_METRIC_TAG_WHITELIST
Whitelist of tags in the metric: "tracing_metrics"
Type: JSON
input.conf:
tracing_metric_tag_whitelistExample:
'["tag_c", "tag_d"]' -
ENV_INPUT_DDTRACE_OMIT_ERR_STATUS
Whitelist to error status
Type: JSON
input.conf:
omit_err_statusExample:
'["404", "403", "400"]' -
ENV_INPUT_DDTRACE_CLOSE_RESOURCE
Ignore tracing resources that service (regular)
Type: JSON
input.conf:
close_resourceExample:
'{"service1":["resource1","other"],"service2":["resource2","other"]}' -
ENV_INPUT_DDTRACE_SAMPLER
Global sampling rate
Type: Float
input.conf:
samplerExample: 0.3
-
ENV_INPUT_DDTRACE_THREADS
Total number of threads and buffer
Type: JSON
input.conf:
threadsExample:
'{"buffer":1000, "threads":100}' -
ENV_INPUT_DDTRACE_STORAGE
Local cache file path and size (MB)
Type: JSON
input.conf:
storageExample:
'{"storage":"./ddtrace_storage", "capacity": 5120}' -
ENV_INPUT_DDTRACE_TAGS
Customize tags. If there is a tag with the same name in the configuration file, it will be overwritten
Type: JSON
input.conf:
tagsExample:
'{"k1":"v1", "k2":"v2", "k3":"v3"}' -
ENV_INPUT_DDTRACE_ENV_INPUT_DDTRACE_MAX_SPANS
Max spans of single trace. Set to -1 to remove this limit
Type: Int
input.conf:
env_input_ddtrace_max_spansExample: 1000
Default: 100000
-
ENV_INPUT_DDTRACE_ENV_INPUT_DDTRACE_MAX_BODY_MB
Max body(in MiB) of single trace POST. Set to -1 to remove this limit
Type: Int
input.conf:
env_input_ddtrace_max_body_mbExample: 32
Default: 10
The
customer_tagsparameter supports regular expressions but requires a fixed prefix formatreg:. For example,reg:key_*matches all keys starting withkey_.
Notes on Multi-Tool Tracing Propagation
The TraceID in the DDTrace data structure is of uint64 type. When using the tracecontext propagation protocol, a _dd.p.tid:67c573cf00000000 field is added inside the DDTrace trace details. This is because the trace_id in the tracecontext protocol is a 128-bit hexadecimal-encoded string, and this high-bit tag is added for compatibility purposes.
Currently, DDTrace supports the following propagation protocols: datadog/b3multi/tracecontext. Note the following two scenarios:
- When using tracecontext, since the trace ID is 128-bit, you need to enable the compatible_otel=true and trace_128_bit_id switches in the configuration.
- When using b3multi, pay attention to the length of the trace_id. If it is a 64-bit hexadecimal encoding, you need to enable trace_id_64_bit_hex=true in the configuration file.
- For more propagation protocols and tool usage, refer to: Multi-Tracing Propagation
Info
compatible_otel: Convertsspan_idandparent_idto hexadecimal strings.trace_128_bit_id: Combines_dd.p.tidinmetawithtrace_idinto a 32-character hexadecimal-encoded string.trace_id_64_bit_hex: Converts 64-bittrace_idto a hexadecimal-encoded string.
Inject Pod and Node Information
When the application is deployed in a container environment such as Kubernetes, you can append Pod/Node information to the final Span data by modifying the application's YAML file. Below is an example YAML for a Kubernetes Deployment:
---
apiVersion: apps/v1
kind: Deployment
metadata:
  name: my-app
spec:
  selector:
    matchLabels:
      app: my-app
  replicas: 3
  template:
    metadata:
      labels:
        app: my-app
        service: my-service
    spec:
      containers:
        - name: my-app
          image: my-app:v0.0.1
          env:
            - name: POD_NAME
              valueFrom:
                fieldRef:
                  fieldPath: metadata.name
            - name: NODE_NAME
              valueFrom:
                fieldRef:
                  fieldPath: spec.nodeName
            - name: DD_TAGS
              value: pod_name:$(POD_NAME),host:$(NODE_NAME)
            - name: DD_SERVICE
              valueFrom:
                fieldRef:
                  fieldPath: metadata.labels['service']
Note that you need to first define POD_NAME and NODE_NAME, then embed them into the DDTrace-specific environment variables.
After the application starts, enter the corresponding Pod and verify if the ENV is in effect:
Once injected successfully, you can see the Pod and Node names where the Span is located in the final Span data.
Warning
- Do not modify the
endpointslist here (unless you clearly understand the configuration logic and effects).
- To disable sampling (i.e., collect all data), set the sampling rate field as follows:
Do not only comment out the line sampling_rate = 1.0; you must also comment out [inputs.ddtrace.sampler]. Otherwise, the collector will treat sampling_rate as 0.0, resulting in all data being discarded.
HTTP Settings
If Trace data is sent from a remote machine, you need to configure the HTTP settings of DataKit.
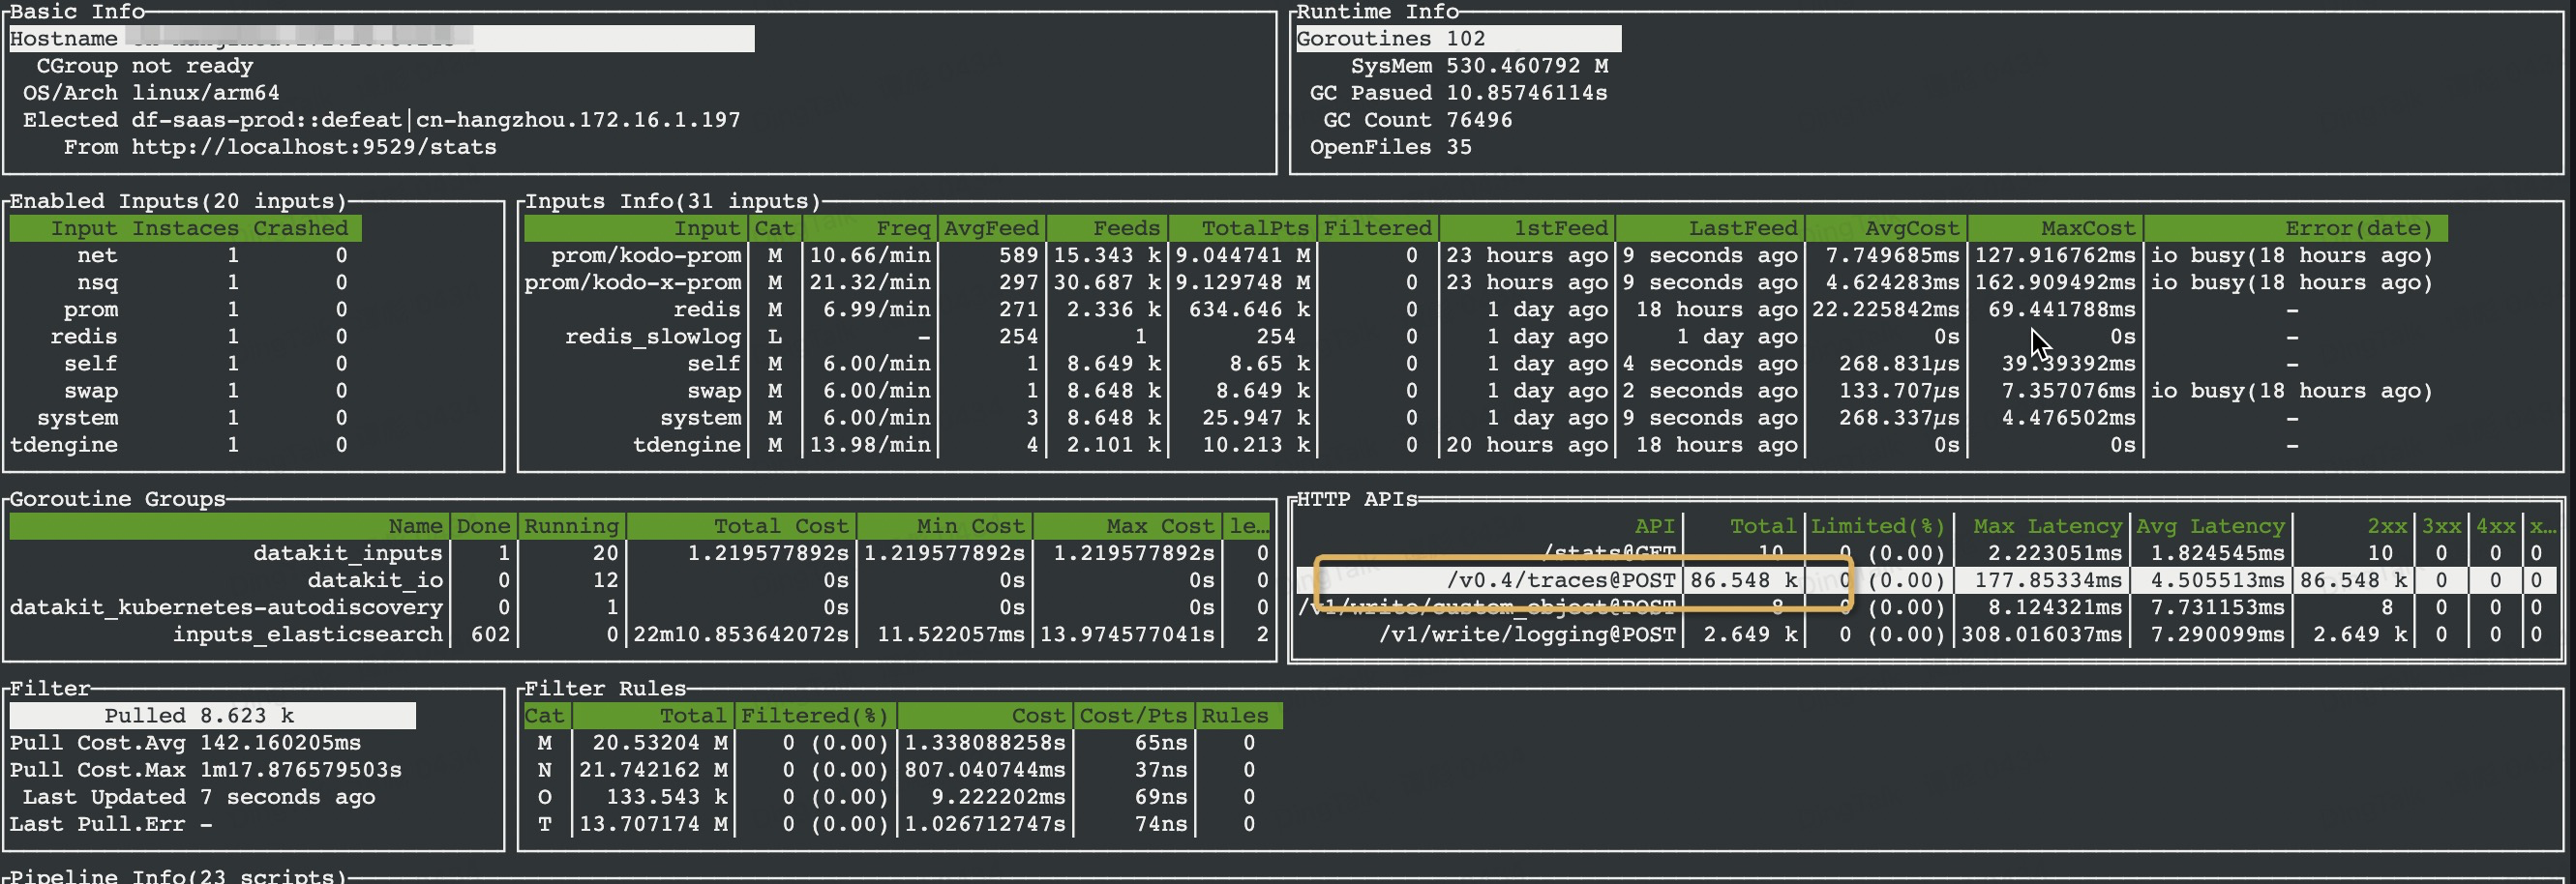
If DDTrace data is sent to DataKit, you can view it on the DataKit monitor:
Enable Disk Cache
If the volume of Trace data is large, to avoid excessive resource consumption on the host, you can temporarily cache Trace data to disk for delayed processing:
DDTrace SDK Configuration
After configuring the collector, you can also make additional configurations on the DDTrace SDK side.
Environment Variable Settings
DD_TRACE_ENABLED: Enable global tracer (supported by some language platforms)DD_AGENT_HOST: DDTrace agent host addressDD_TRACE_AGENT_PORT: DDTrace agent host portDD_SERVICE: Service nameDD_TRACE_SAMPLE_RATE: Set sampling rateDD_VERSION: Application version (optional)DD_TRACE_STARTUP_LOGS: DDTrace loggerDD_TRACE_DEBUG: DDTrace debug modeDD_ENV: Application environment valueDD_TAGS: Application tags
In addition to setting the project name, environment name, and version number during application initialization, you can also set them in the following two ways:
- Inject environment variables via the command line
- Configure custom tags directly in ddtrace.conf. This method affects all data sent to the DataKit tracing service, so use it with caution:
# tags are key-value pairs configured for ddtrace
[inputs.ddtrace.tags]
  some_tag = "some_value"
  more_tag = "some_other_value"
APMTelemetry
After the DDTrace agent starts, it continuously reports service-related information through an additional interface, such as startup configuration, heartbeat, and the list of loaded agents. You can view this information in Guance Infrastructure -> Resource Directory. The displayed data is helpful for troubleshooting issues related to startup commands and versions of referenced third-party libraries. It also includes host information, service information, and the number of Spans generated.
Data may vary significantly across different languages and versions; please refer to the actual received data.
Fixed Tag Extraction
Starting from DataKit version 1.21.0, the blacklist function is deprecated, and not all fields in Span.Meta are extracted into top-level tags anymore—only selected fields are extracted.
The following is a list of tags that may be extracted:
| Original Meta Field | Extracted Field Name | Description |
|---|---|---|
http.url |
http_url |
Full HTTP request path |
http.hostname |
http_hostname |
Hostname |
http.route |
http_route |
Route |
http.status_code |
http_status_code |
Status code |
http.method |
http_method |
Request method |
http.client_ip |
http_client_ip |
Client IP |
sampling.priority |
sampling_priority |
Sampling status |
span.kind |
span_kind |
Span type |
error |
error |
Whether an error occurred |
runtime.name |
runtime_name |
Runtime name |
dd.version |
dd_version |
Agent version |
error.message |
error_message |
Error message |
error.stack |
error_stack |
Stack trace information |
error.type |
error_type |
Error type |
system.pid |
pid |
Process ID (pid) |
error.msg |
error_message |
Error message |
project |
project |
Project name |
version |
version |
Version |
env |
env |
Environment |
host |
host |
Hostname in tags |
pod_name |
pod_name |
Pod name in tags |
pod_namespace |
pod_namespace |
pod namespace |
_dd.base_service |
_dd_base_service |
Parent service |
peer.hostname |
db_host |
May be an IP or domain name (depends on configuration) |
db.type |
db_system |
Database type: mysql, oracle, etc. |
db.instance |
db_name |
Database name |
out.host |
out_host |
Database or Middleware host |
dd_ext_version |
sdk_version |
SDK extend version |
language |
sdk_language |
SDK language |
In the Studio tracing interface, tags not in the list can also be used for filtering.
Starting from DataKit version 1.22.0, the whitelist function is restored. If there are tags that must be extracted into the top-level tag list, you can configure them in customer_tags. If the whitelisted tags are in the original message.meta, the collector will use . as a separator and convert . to _ during extraction.
Collected Data Field Description
Tracing
ddtrace
Following is tags/fields of tracing data
| Tags & Fields | Description |
|---|---|
| base_service ( tag) |
Span base service name |
| container_host ( tag) |
Container hostname. Available in OpenTelemetry. Optional. |
| db_host ( tag) |
DB host name: ip or domain name. Optional. |
| db_name ( tag) |
Database name. Optional. |
| db_system ( tag) |
Database system name:mysql,oracle... Optional. |
| dk_fingerprint ( tag) |
DataKit fingerprint(always DataKit's hostname) |
| endpoint ( tag) |
Endpoint info. Available in SkyWalking, Zipkin. Optional. |
| env ( tag) |
Application environment info. Available in Jaeger. Optional. |
| host ( tag) |
Hostname. |
| http_method ( tag) |
HTTP request method name. Available in DDTrace, OpenTelemetry. Optional. |
| http_route ( tag) |
HTTP route. Optional. |
| http_status_code ( tag) |
HTTP response code. Available in DDTrace, OpenTelemetry. Optional. |
| http_url ( tag) |
HTTP URL. Optional. |
| operation ( tag) |
Span name |
| out_host ( tag) |
This is the database host, equivalent to db_host,only DDTrace-go. Optional. |
| project ( tag) |
Project name. Available in Jaeger. Optional. |
| service ( tag) |
Service name. Optional. |
| source_type ( tag) |
Tracing source type |
| span_type ( tag) |
Span type |
| status ( tag) |
Span status |
| version ( tag) |
Application version info. Available in Jaeger. Optional. |
| duration | Duration of span Type: int | (gauge) Unit: time,μs |
| message | Origin content of span Type: string Unit: N/A |
| parent_id | Parent span ID of current span Type: string Unit: N/A |
| resource | Resource name produce current span Type: string Unit: N/A |
| span_id | Span id Type: string Unit: N/A |
| start | start time of span. Type: int | (gauge) Unit: timeStamp,usec |
| trace_id | Trace id Type: string Unit: N/A |
Metrics
tracing_metrics
Based on DDTrace's span data, we count span count, span cost metrics
| Tags & Fields | Description |
|---|---|
| collector_source_ip ( tag) |
Remote agent IP. |
| env ( tag) |
Application environment info(if set in span). |
| host ( tag) |
Hostname. |
| http_status_class ( tag) |
HTTP response code class, such as 2xx/3xx/4xx/5xx |
| http_status_code ( tag) |
HTTP response code |
| operation ( tag) |
Span name |
| pod_name ( tag) |
Pod name(if set in span). |
| pod_namespace ( tag) |
Pod namespace(if set in span). |
| project ( tag) |
Project name(if set in span). |
| resource ( tag) |
Application resource name. |
| service ( tag) |
Service name. |
| source ( tag) |
Source, always ddtrace |
| status ( tag) |
Span status(ok/error) |
| version ( tag) |
Application version info. |
| apdex | Measures the Apdex score for each web service. The currently set satisfaction threshold is 2 seconds.The tags for this metric are fixed: service/env/version/resource/source. The value range is 0~1.Type: float | (gauge) Unit: N/A |
| errors | Represent the count of errors for spans. Type: int | (gauge) Unit: count |
| errors_by_http_status | Represent the count of errors for a given span group by HTTP status code. Type: int | (gauge) Unit: count |
| hits | Count of spans. Type: int | (count) Unit: count |
| hits_by_http_status | Represent the count of hits for a given span group by HTTP status code. Type: int | (gauge) Unit: count |
| latency_bucket | Represent the latency distribution for all services, resources, and versions across different environments and additional primary tags. Recommended for all latency measurement use cases. Use the 'le' tag for filtering Type: int | (histogram) Unit: count |
| latency_count | The number of spans is equal to the number of web type spans. Type: int | (count) Unit: count |
| latency_sum | The total latency of all web spans, corresponding to the 'latency_count' Type: int | (gauge) Unit: time,μs |
Custom Objects
After DDTrace starts, it reports its own configuration information, integration list, dependencies, and service-related information to DataKit. Currently, only Java Agent is supported. The following is a description of each field:
app_client_configuration_change: Contains the agent's configuration informationapp_dependencies_loaded: Dependency list (including package names and version information)app_integrations_change: Integration list (including package names and whether the agent is enabled)- Other host information, service information, etc.
tracing_service
Collect service, host, process APM telemetry message.
| Tags & Fields | Description |
|---|---|
| architecture ( tag) |
Architecture |
| env ( tag) |
Service ENV |
| hostname ( tag) |
Host name |
| kernel_name ( tag) |
Kernel name |
| kernel_release ( tag) |
Kernel release |
| kernel_version ( tag) |
Kernel version |
| language_name ( tag) |
Language name |
| language_version ( tag) |
Language version |
| name ( tag) |
Same as service name |
| os ( tag) |
OS name |
| os_version ( tag) |
OS version |
| runtime_id ( tag) |
Runtime ID |
| runtime_name ( tag) |
Runtime name |
| runtime_patches ( tag) |
Runtime patches |
| runtime_version ( tag) |
Runtime version |
| service ( tag) |
Service |
| service_version ( tag) |
Service version |
| tracer_version ( tag) |
DDTrace version |
| app_client_configuration_change | JSON payload from a DDTrace APM telemetry client-configuration-change request. Type: string | (string) Unit: N/A |
| app_closing | JSON payload from a DDTrace APM telemetry app-closing request. Type: string | (string) Unit: N/A |
| app_dependencies_loaded | JSON payload containing dependencies loaded by the traced application. Type: string | (string) Unit: N/A |
| app_integrations_change | JSON payload from a DDTrace APM telemetry integrations-change request. Type: string | (string) Unit: N/A |
| app_started | JSON payload from the DDTrace APM telemetry app-started request. Type: string | (string) Unit: N/A |
| spans_created | Number of spans created by the traced application as reported by DDTrace telemetry. Type: float | (count) Unit: count |
| spans_finished | Number of spans finished by the traced application as reported by DDTrace telemetry. Type: float | (count) Unit: count |