Event Correlation
Guance supports adding filter fields to match incidents related to selected fields, associating queried data with events. This helps in understanding whether any related events occur during data fluctuations while viewing trends, aiding in multi-perspective problem localization.
Note: This feature is currently supported only for time series charts and histograms.
Example
In the chart below, the filter condition is:
This means querying the latest CPU usage rates of all hosts within the past 15 minutes in the current workspace.
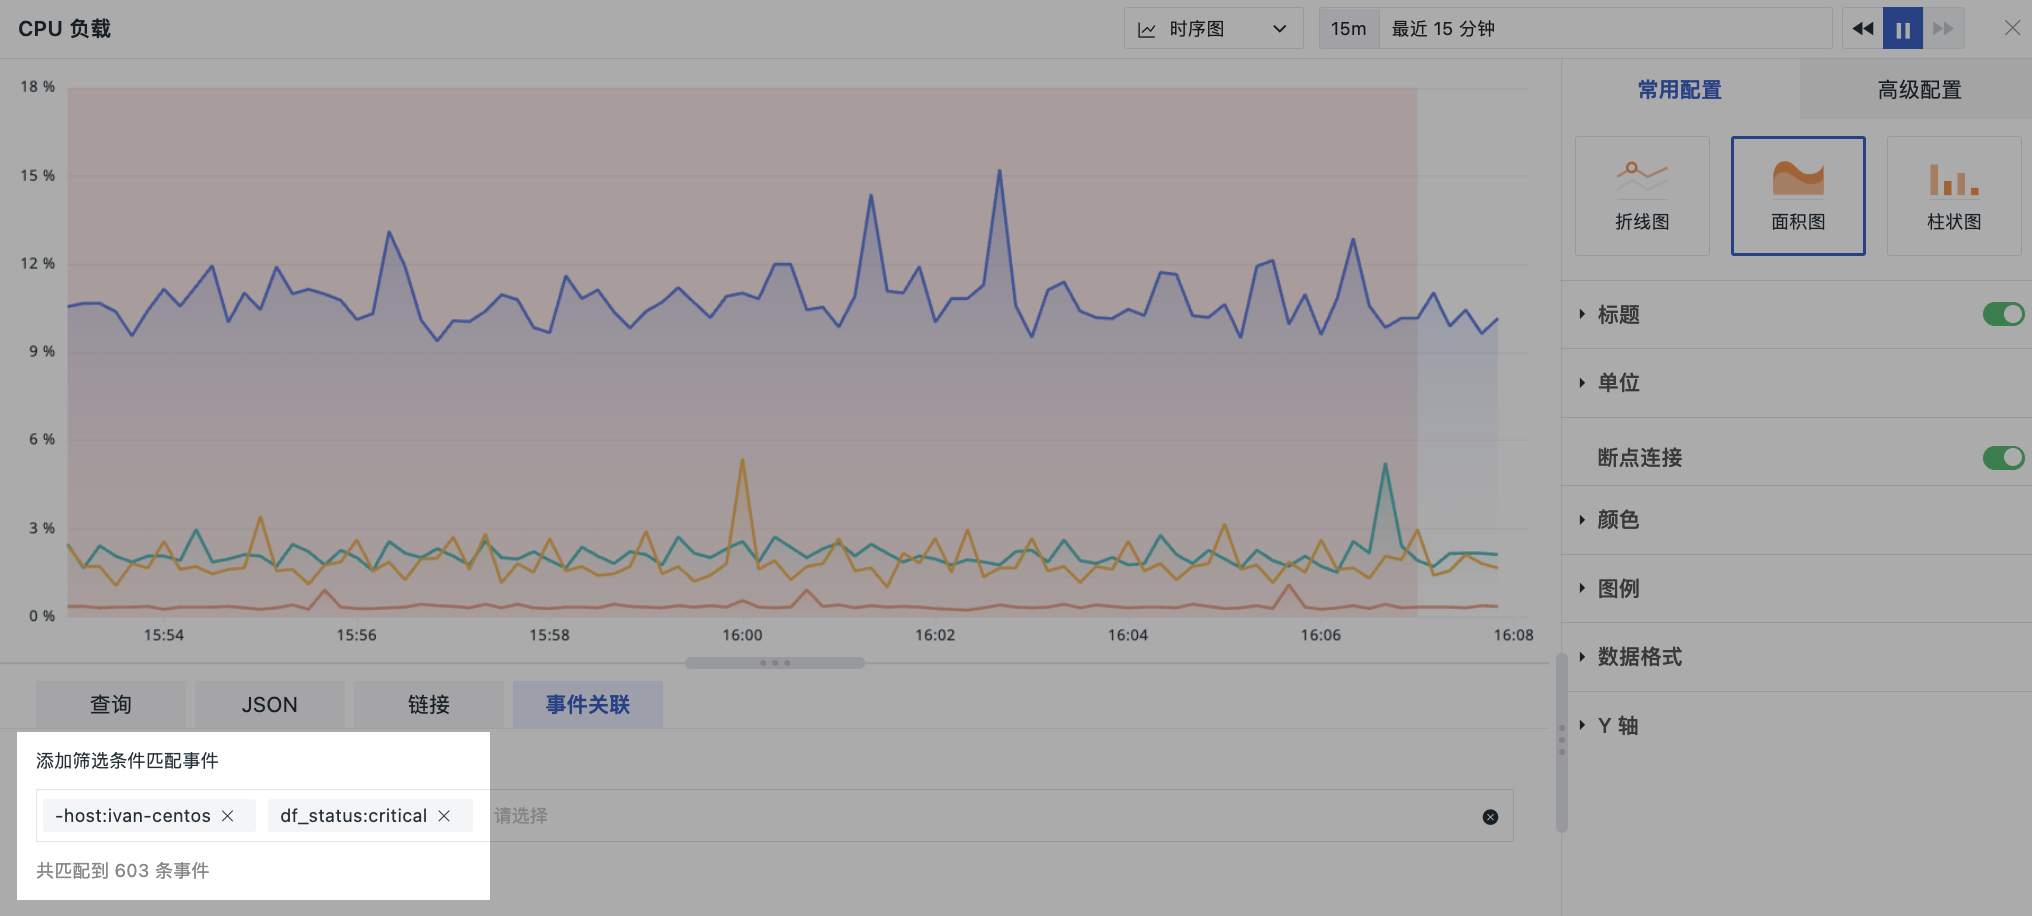
The added event correlation filter conditions are -host:ivan-centos, df_status:critical. This filters out all hosts except ivan-centos and correlates events with a severity level of critical.
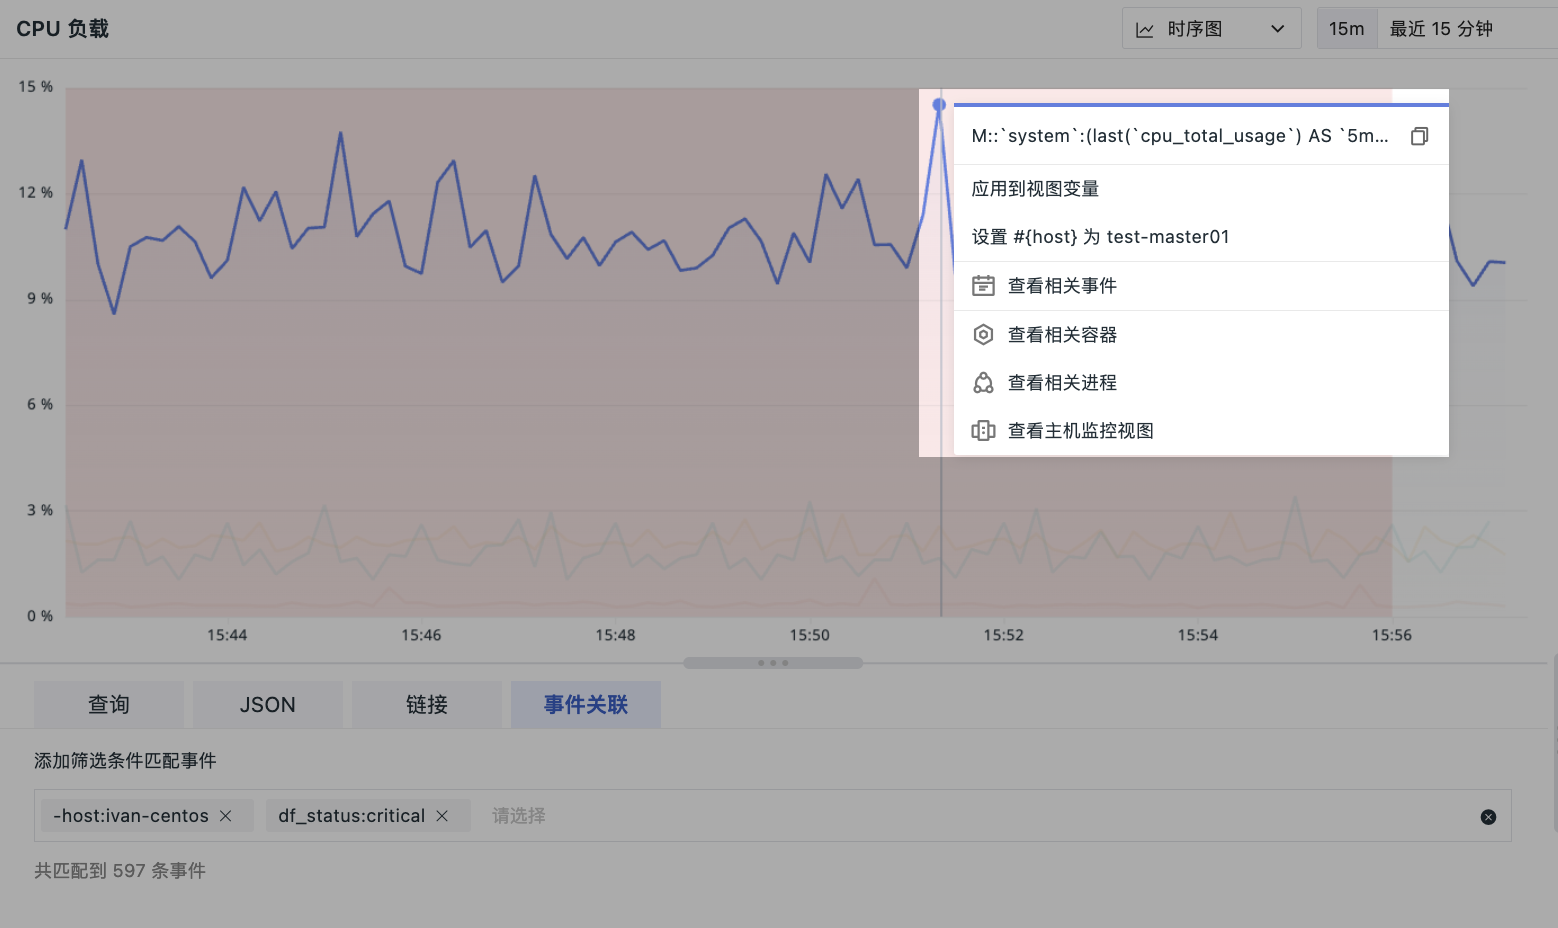
On the time series, if there are event records, they will be marked with shaded blocks. Clicking on a query highlighted under a shaded block allows you to view incidents related to the current field.

