Processes
A "process" is an instance of a program running in an operating system, with independent memory space and system resource allocation. In infrastructure, the main tasks of the process explorer include:
- Monitoring process status: Real-time understanding of the running status of processes (such as running, stopped, abnormal exit, etc.).
- Analyzing resource usage: Monitoring the resource usage of processes (such as CPU usage, memory usage, disk I/O, etc.).
- Detecting abnormal behavior: Timely detection of abnormal process behavior by setting thresholds and alert rules.
- Correlating with other data: Associating process data with other data types such as hosts, containers, and logs to gain a comprehensive understanding of the system's operating status.
Data Display
The process explorer provides various professional analysis views based on lists and charts.
Displays the latest metric data (within the last 2 days) of all processes in the current workspace, including host names/tags, CPU usage, memory usage, and startup time, helping to quickly understand the process running status.
Uses chart forms such as Top Lists, pie charts, treemaps, and grouped tables, based on calculation modes like count, last, first, and count_distinct, to filter data under by conditions.
Process List
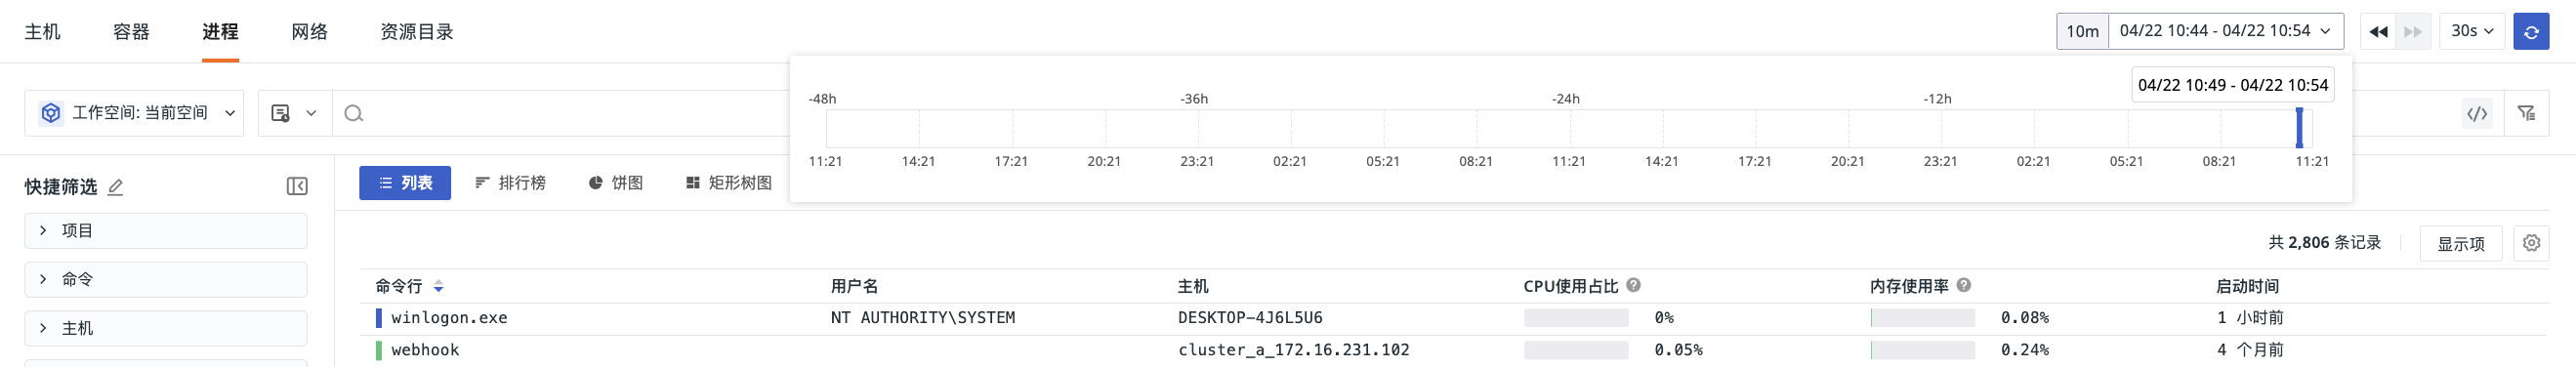
Time Widget
The process list supports viewing process data collected within the last 10 minutes. Clicking the play button refreshes to the current time range, reloading the data list.
Click the time range to view process playback:
- After dragging, the refresh pauses, and the time is displayed as: [start time - end time]. The queried time range is 5 minutes.
- After dragging, historical process data is queried.
- After dragging, click the play button or refresh the page to return to viewing the last 10 minutes of processes.
Cross-Workspace Authorization
If the current workspace has configured Data Authorization and the authorized data types include "Infrastructure," you can switch to the authorized workspace in the upper left corner of the process explorer page to view relevant process data.
Process Details
Click the process name in the process list to slide out the details page and view detailed information about the process object, including the object it belongs to, Label attributes, other extended attributes, and associated metrics, logs, hosts, networks, etc.
Correlation Analysis
Click the process name in the process list to slide out the details page and view detailed information about the process object, including the object it belongs to, Label attributes, other extended attributes, and associated metrics, logs, hosts, networks, etc.
Host Query
The system supports correlation analysis for each process.
| Operation | Description |
|---|---|
| Filter field value | Adds this field to the explorer to view all data related to this field. |
| Invert filter field value | Adds this field to the explorer to view all data except this field. |
| Add to display column | Adds this field to the explorer list for viewing. |
| Copy | Copies this field to the clipboard. |
| View related logs | Views all logs related to this host. |
| View related containers | Views all containers related to this host. |
| View related processes | Views all processes related to this host. |
| View related traces | Views all traces related to this host. |
Bind Built-in Views
For specific steps, refer to Bind Built-in Views.