Field Management
The system supports unified management of field data in the current workspace, including two types:
You can view field descriptions in different Use Cases within the console to help quickly understand field meanings and apply them.
Official Fields
Official fields are default fields provided by Guance. You can view all official fields in the workspace under Manage > Field Management, including field name, field type, and detailed field description.
Note
Official fields cannot be deleted.
Custom Fields
Custom fields are fields added by users based on collected data, including collected metrics, tags, fields parsed through Pipeline, etc.
Create
Navigate to Manage > Field Management in the workspace and click Create.
- Define the field name. It must be unique and will serve as the field's unique identifier.
- Configure an alias: a descriptive name for the field.
- Select the field source: includes General Fields, Logs, Basic Objects, Resource Catalog, Events, APM, RUM, Network.
- Select the field type: includes int, float, boolean, string, long.
-
Define the unit: includes percentage, length, custom, and other unit components.
- After the field is created, the unit will be automatically displayed wherever the field is applied, e.g., in Monitors, Explorers, charts, etc.
-
Select the attribute classification: includes System Fields (selected by default), Business Fields, Other.
- Optionally set a field description for further explanation and clarification of the current field.
- Confirm.
Options
After a field is created, you can perform the following operations for custom fields:
- Perform a fuzzy search by entering the field name.
- Configure the display columns.
- Edit: update the field name, field type, attribute classification, and field description.
-
Delete the field.
- If a custom field is deleted, the originally overridden official field will be displayed again, and editing and deletion will no longer be supported.
-
Override: If a conflict arises with an official field when creating a new field, you can choose to override the official field. After overriding, this field becomes a custom field and can be edited and deleted.
Use Cases
After data is reported to the Guance workspace, you can first describe the reported field data in Field Management. This helps other team members quickly understand field meanings and apply fields when querying and analyzing data.
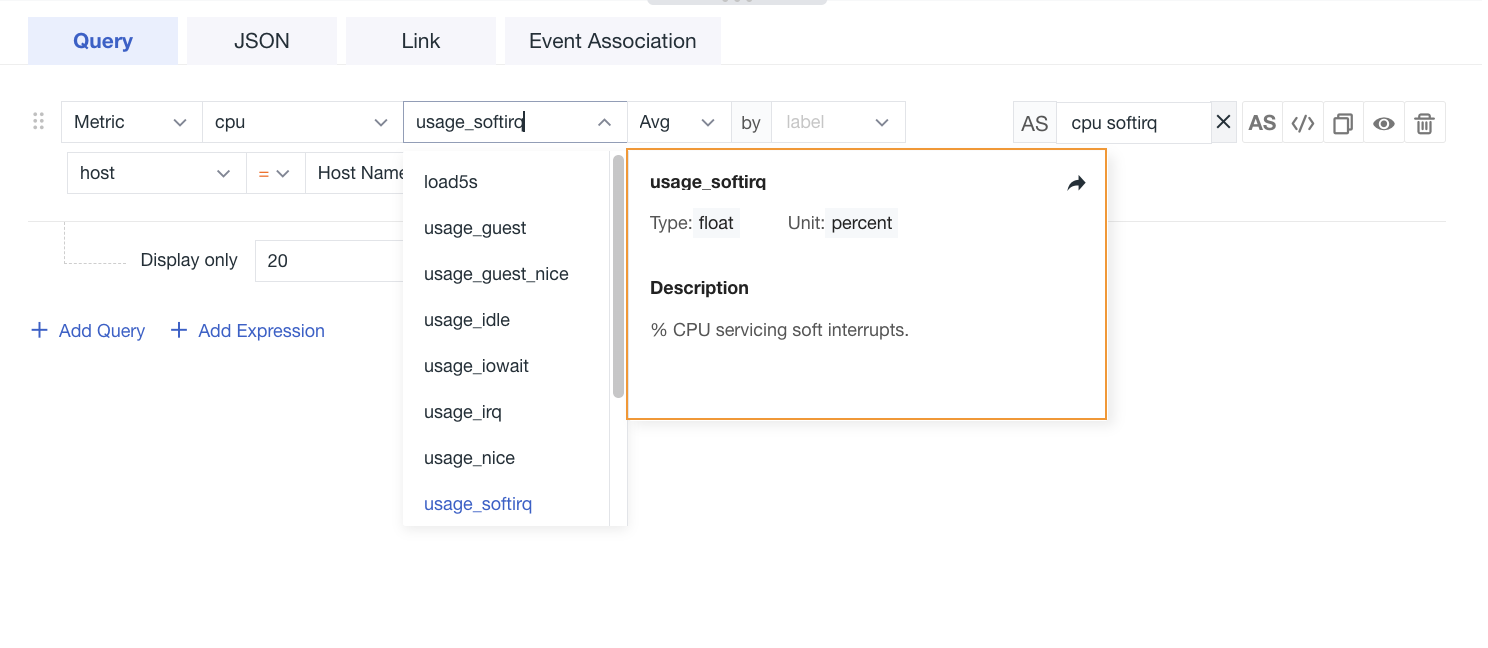
In the workspace under Scenarios > Dashboards, select a chart. In the Query section, you can view field descriptions.
Note
Units are not displayed when the count or count_distinct function is selected.
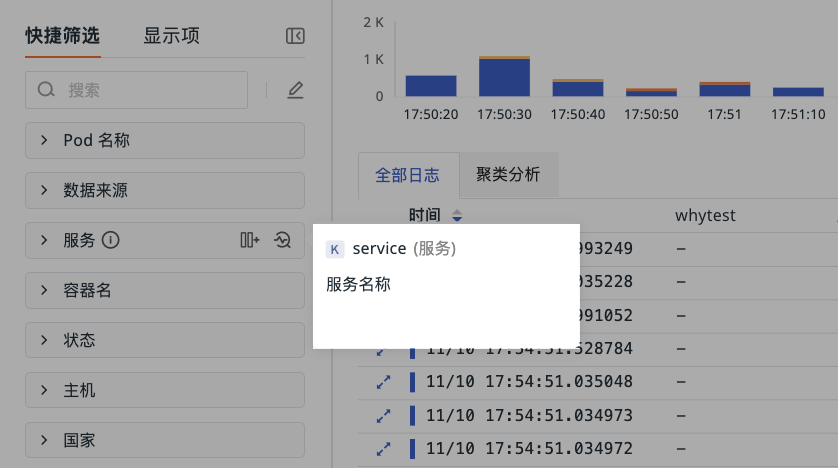
In the Explorer, you can view fields and their corresponding information in Explorer > Quick Filters, Display Columns.
1. Quick Filters
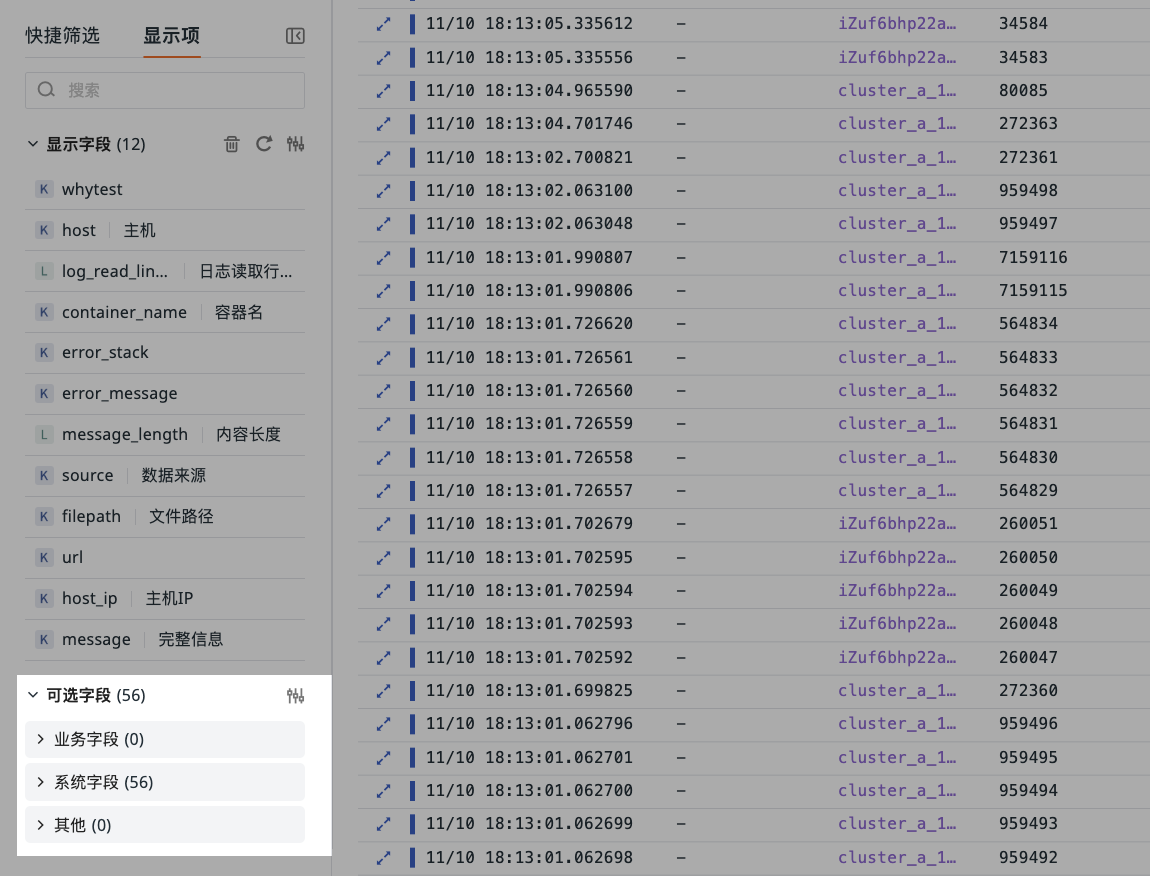
2. Display Columns
Based on field attributes, System Fields (selected by default), Business Fields, and Other will be displayed separately here.
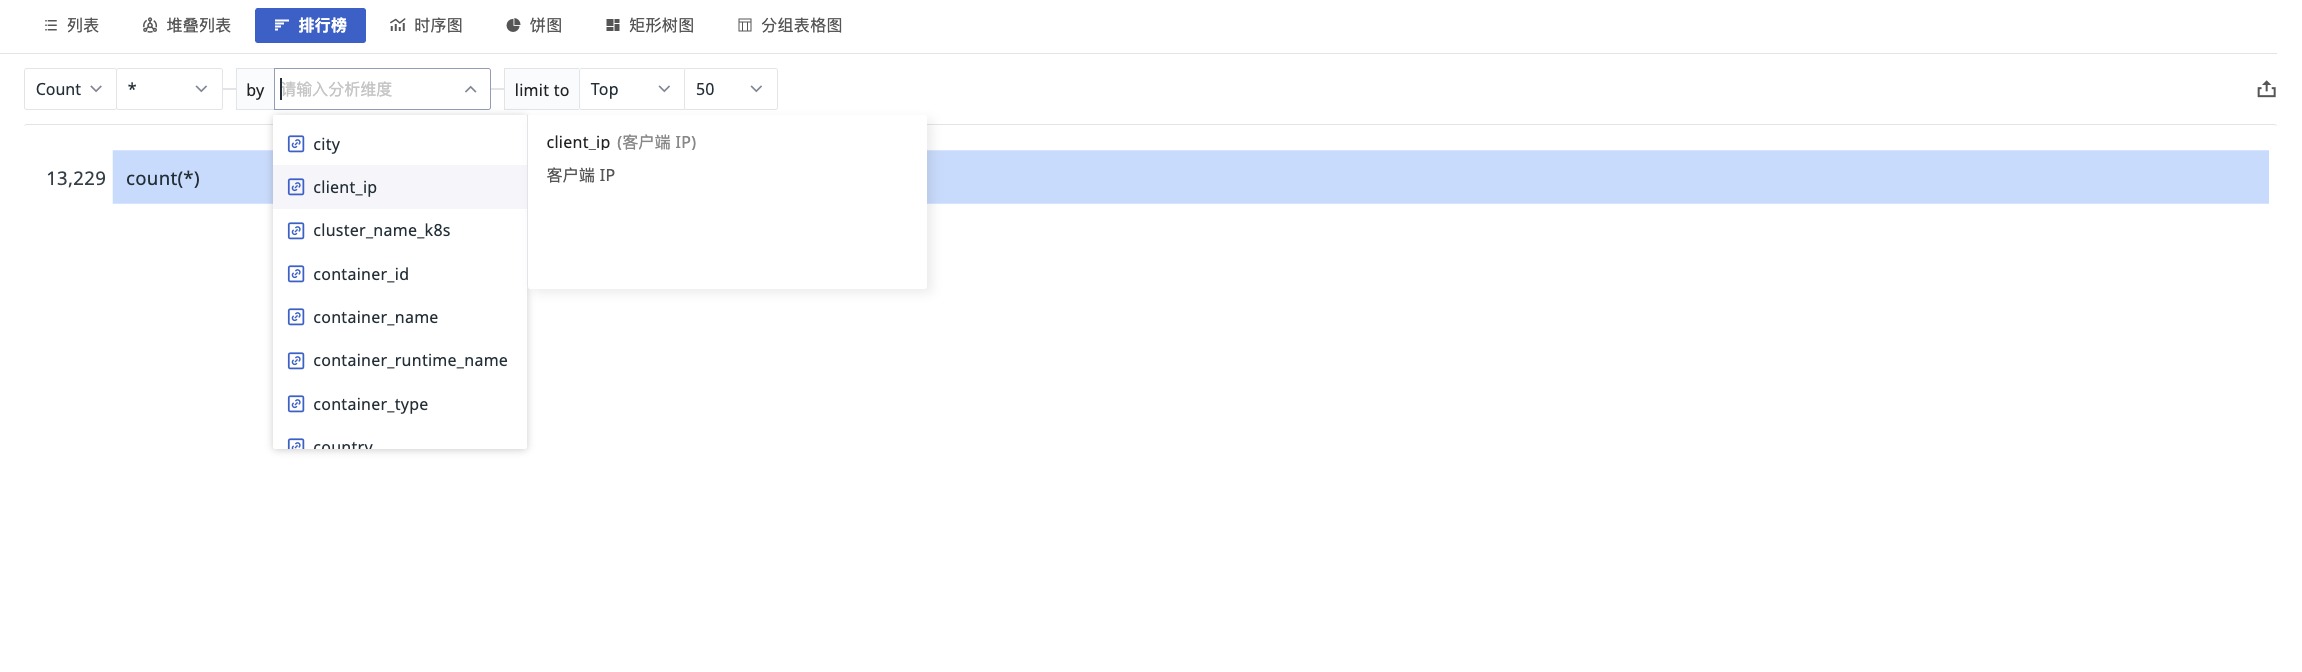
3. Explorer Chart Mode
In the workspace under Monitoring > Monitors, select a monitor. In the Detection Metrics section, you can view field descriptions.
Note
Units are not displayed if the detection metric selects the count or count_distinct function.
=== "Shortcut > Query Tool**
In the workspace under **Shortcut > Query Tool**, switch to **Simple Query** to view field descriptions.

<img src="../img/field_use_case_in_query_tool.png" width="50%" >

---
=== "Metrics > Metrics Analysis**
In the workspace under **Metrics > Metrics Analysis**, you can view field descriptions in the simple query.

<img src="../img/field_use_case_in_metrics.png" width="50%" >

---