View Monitor for DataKit
DataKit provides relatively complete output of basic observable information. By looking at the monitor output of DataKit, we can clearly know the current operation of DataKit.
View Monitor
Execute the following command to get the running status of the native DataKit.
Tip
You can see more monitor options through the datakit monitor --help.
The DataKit Basic Monitor page information is shown in the following figure:
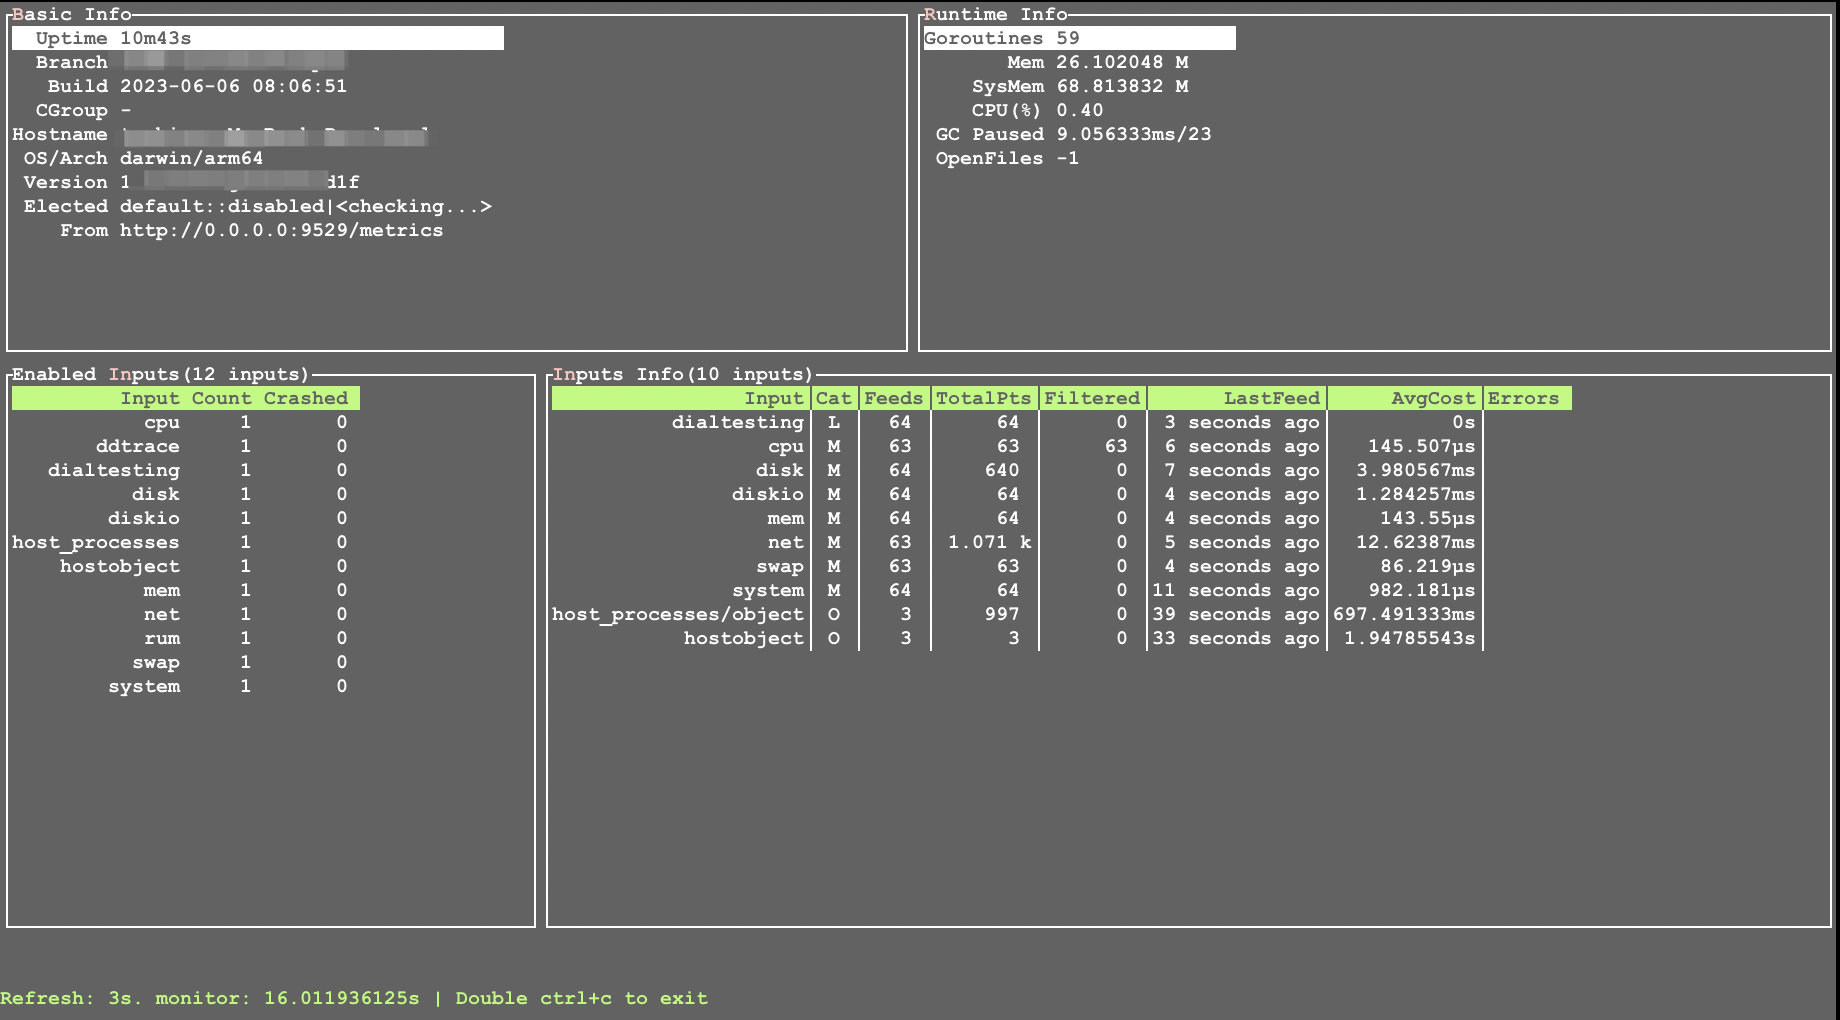
The elements in this diagram can be manipulated by mouse or keyboard. Blocks selected by the mouse are highlighted in bilateral boxes (as shown in the Basic Info block in the upper left corner of the above figure), and can also be browsed through the mouse wheel or the up and down arrow keys of the keyboard (or J/K of vim).
The information of each UI block in the above figure is:
-
Basic Infois used to display basic information about DataKit, such as the version number, hostname, and runtime duration. From here, we can get a basic understanding of the current status of DataKit. Here are a few fields highlighted for individual explanation:Uptime: The startup time of DataKit.Version: The current version number of DataKit.Build: The release date of DataKit.Branch: The current code branch of DataKit, which is usuallymaster.Build Tag: The compilation options for DataKit; for the Lite version, this islite.OS/Arch: The current hardware and software platform of DataKit.Hostname: The current hostname.Resource Limit: Displays the current resource limit configurations for DataKit, wherememrefers to the maximum memory limit, andcpurefers to the usage limit range (if displayed as-, it means the current cgroup is not set).Elected: Shows the election status, see here for details.From: The current DataKit address being monitored, such ashttp://localhost:9529/metrics.Proxy: The current proxy server being used.
-
Runtime Infois used to display the basic runtime consumption of DataKit (mainly memory, CPU and Golang runtime), including:Goroutines: The number of Goroutine currently running.Total/Heap: The memory occupied by the Golang virtual memory(sys-alloc) and the memory currently in use(heap-alloc) 1.RSS/VMS: The RSS memory usage and VMS.GC Paused: The time and number of times the GC (garbage collection) has consumed since DataKit started.OpenFiles: The number of files currently open (on some platforms, it may display as-1, indicating that the feature is not supported).
-
Enabled Inputsdisplays a list of open collectors:Input: Refer to the collector(input) name, which is fixed and cannot be modifiedCount: Refer to the number of the collector turned onCrashed: Refer to the number of crashes of the collector
-
Inputs Info: It is used to show the running status of each collector. There is more information here:Input: Refer to the collector name. In some cases, this name is collector-specific (such as Log Collector/Prom Collector)Cat: Refer to the type of data collected by the collector (M (metrics)/L (logs)/O (objects...)Feeds: Total updates(collects) since DataKit startedLat(...): Feed latency (blocked on queue) time. By default, it shows average (avg), and you can use-Q/--quantileto select a quantile (P50/P90/P99). The longer the duration, the slower the upload workers Version-1.91.0Pts(...): Points collected by the collector. By default, it shows average (avg), and you can use-Q/--quantileto select a quantile (P50/P90/P99) Version-1.91.0Last Feed: Time of last update(collect), relative to current timeCost(...): Cost of each collect. By default, it shows average (avg), and you can use-Q/--quantileto select a quantile (P50/P90/P99)Errors: Collect error count(if no error, empty here)
-
The prompt text at the bottom tells you how to exit the current Monitor program and displays the current Monitor refresh rate.
If the verbose option (-V) is specified when Monitor is run, additional information is output, as shown in the following figure:
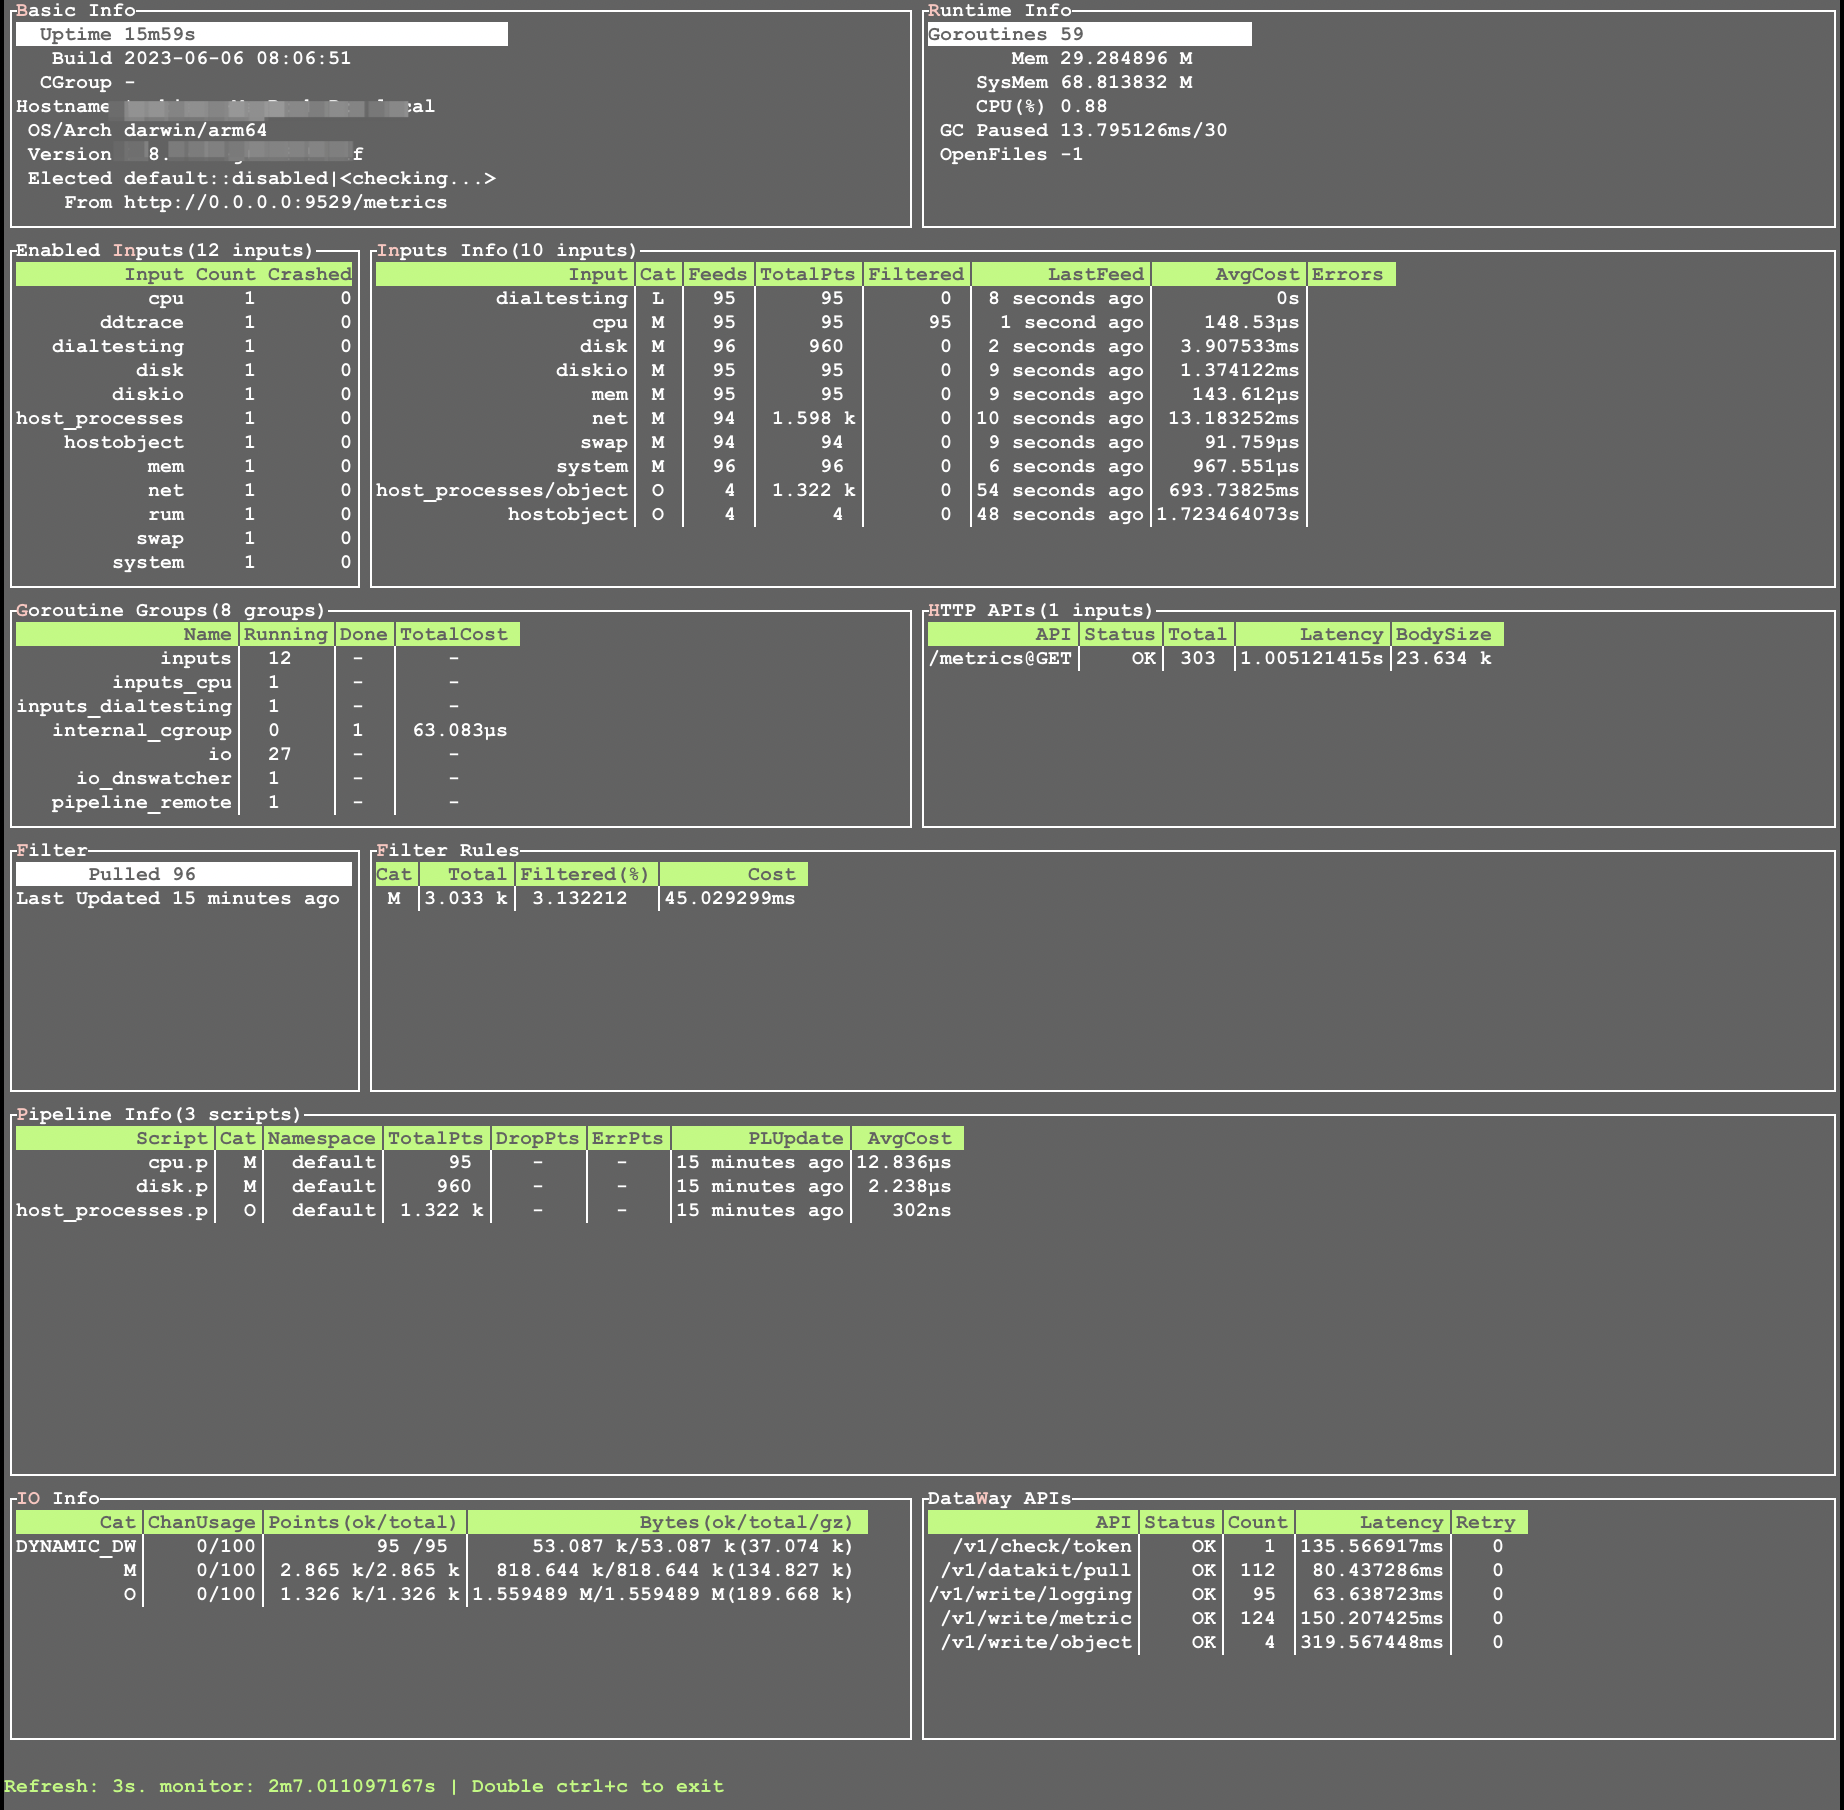
Goroutine Groupsshows the existing Goroutine Groups in the DataKit (the number of Goroutines in the group < = the number ofGoroutinesin the panel above).HTTP APIs: HTTP API request infoFilter: Pull of blacklist filtering rulesFilter Rules: Filtering of each type of blacklistPipeline Info: Pipeline running info-
WAL InfoWAL Queue Usage Version-1.62.0The WAL queue consists of two parts: a small in-memory queue and a default 2GB disk queue. Here,
memrefers to the number of points processed by the in-memory queue,diskrefers to the number of points processed by the disk queue, anddroprefers to the number of points discarded by the disk queue (for example, when the disk queue is full). Total refers to the total number of points. -
Point Upload InfoDisplays the operation of the data upload channel 2. DataWay APIsDisplays the invocation situation of Dataway APIs.
FAQ
How to show only the operation of the specified module?
You can specify a list of module names (multiple modules are separated by English commas): Version-1.5.7
datakit monitor -M inputs,filter
# or
datakit monitor --module inputs,filter

# use thd module abbreviation
datakit monitor -M in,f
How to show only the operation of the specified collector?
You can specify a list of collector names (multiple collectors are separated by English commas):
How to display too long text?
When some collectors report errors, their error information will be very long and incomplete in the table.
Complete information can be displayed by setting the column width of the display:
How to change the Monitor refresh rate?
It can be changed by setting the refresh frequency:
Note
Note that the units here must be the following: s (seconds)/m (minutes)/h (hours). If the time range is less than 1s, refresh according to 1s.
How to select a quantile (P50/P90/P99) for display?
Monitor shows average (avg) for Summary metrics by default. If you want to display quantile values, use -Q/--quantile:
# Show P90 (commonly used)
datakit monitor -Q 90
# or
datakit monitor --quantile 90

# Show P50 / P99
datakit monitor -Q 50
datakit monitor -Q 99
This option affects Summary columns such as Lat(...), Pts(...), Cost(...), and Body(...) (for example, Lat(p90) and Cost(p99)). Without -Q/--quantile, it remains avg.
How to Monitor other DataKits?
We can specify other DataKit's IP to show it's monitor:
Info
By default, metrics data used by monitor are not accessible for non-localhost, we can add API /metrics to API white list.
-
Note that the memory usage displayed here is specific to the Golang virtual machine and does not include the memory used by external collectors that may be running. ↩
-
Version-1.62.0 There have been updates here, and previous versions may show slightly different information. ↩