Key Metrics Management (Warroom)
Guance provides a Warroom dashboard where you can overview the trends of key metrics for all workspaces, helping you quickly understand the critical data situation of each workspace and promptly identify and resolve abnormal issues.
Viewing Key Metrics in the Warroom
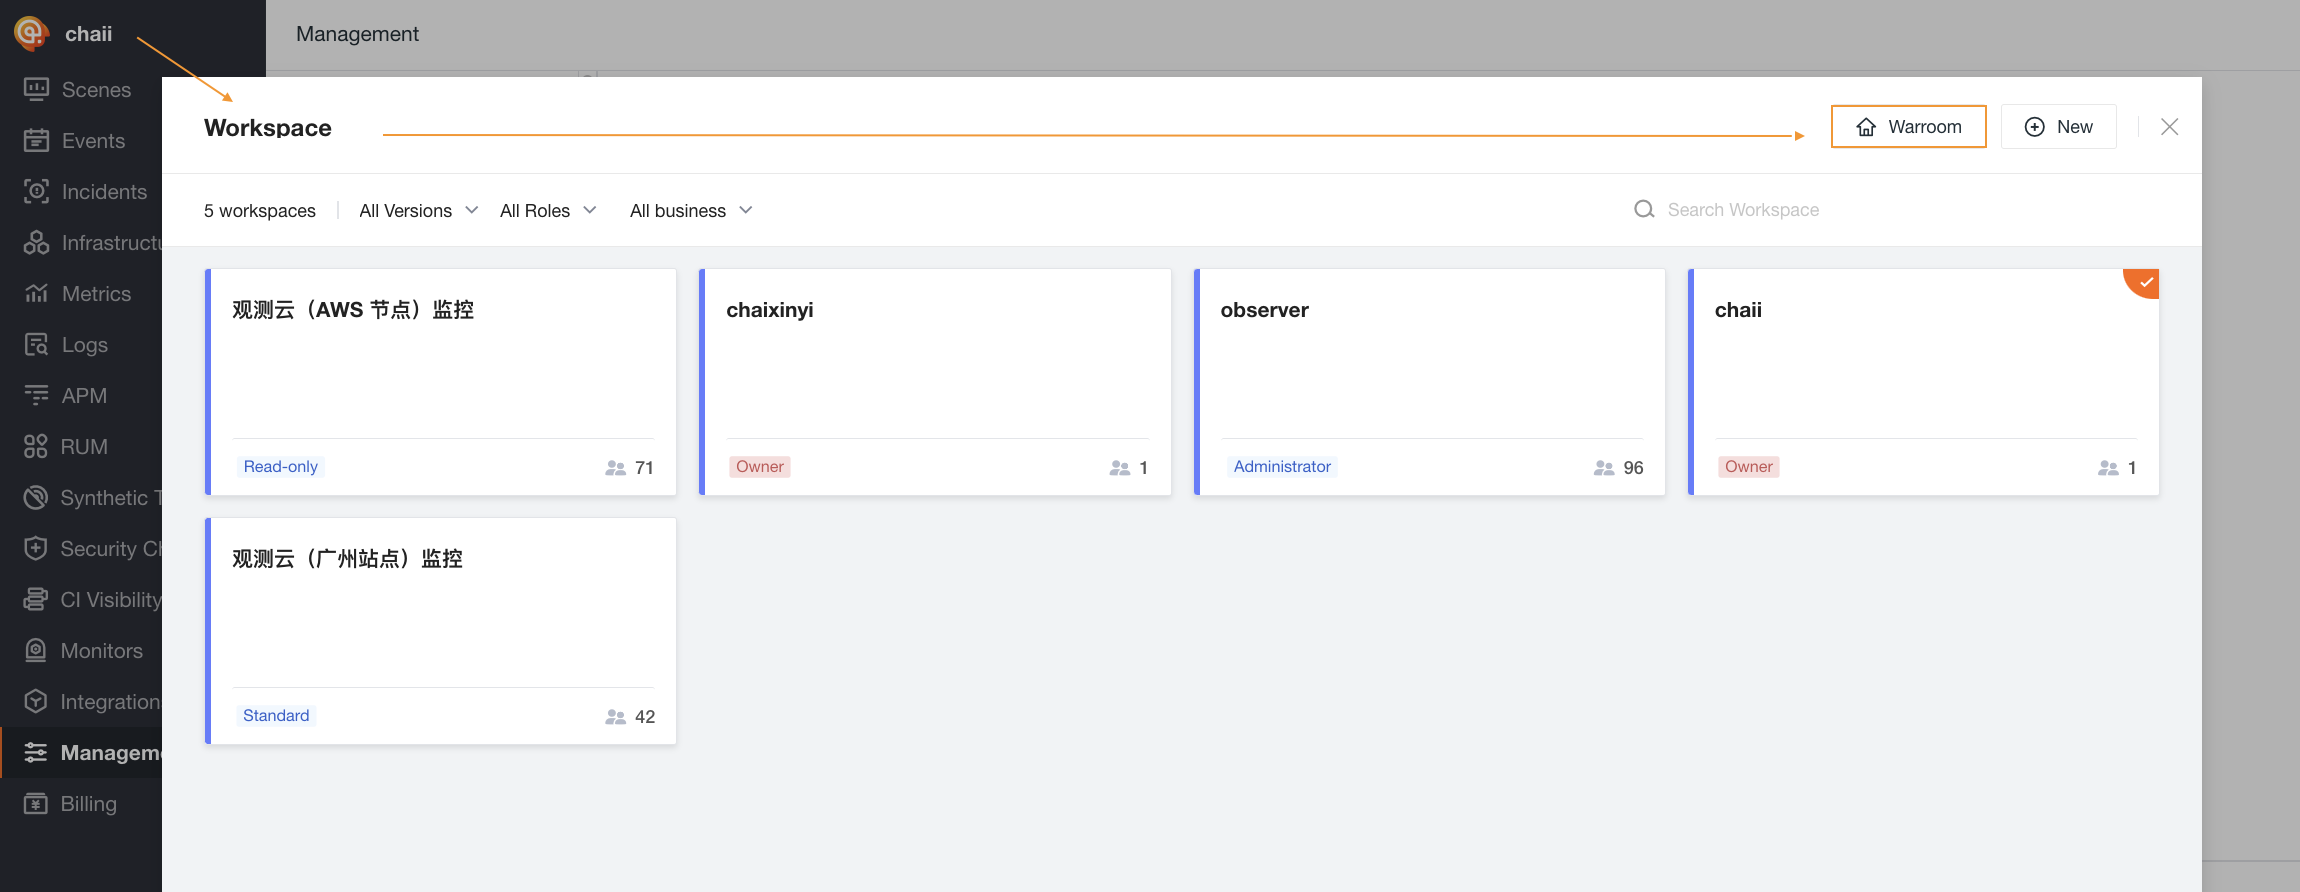
In Guance workspace, click the workspace name in the top-left corner. In the dialog box that appears, click Enter Warroom.
After entering the Warroom, you can view the trends of key metrics for all workspaces associated with your current account. In the Warroom, you can view key metric trends in the form of icons or lists. You can sort workspaces by multiple dimensions such as event urgency, workspace, and number of unresolved events.
- Event Urgency: Sorted by Critical > Important > Warning > Data Interruption;
- Workspace: Sorted by Alias > Workspace Name;
- Number of Unresolved Events: Sorted from highest to lowest based on the number of unresolved events within 48 hours for each workspace.
Configuring Key Metrics in the Warroom
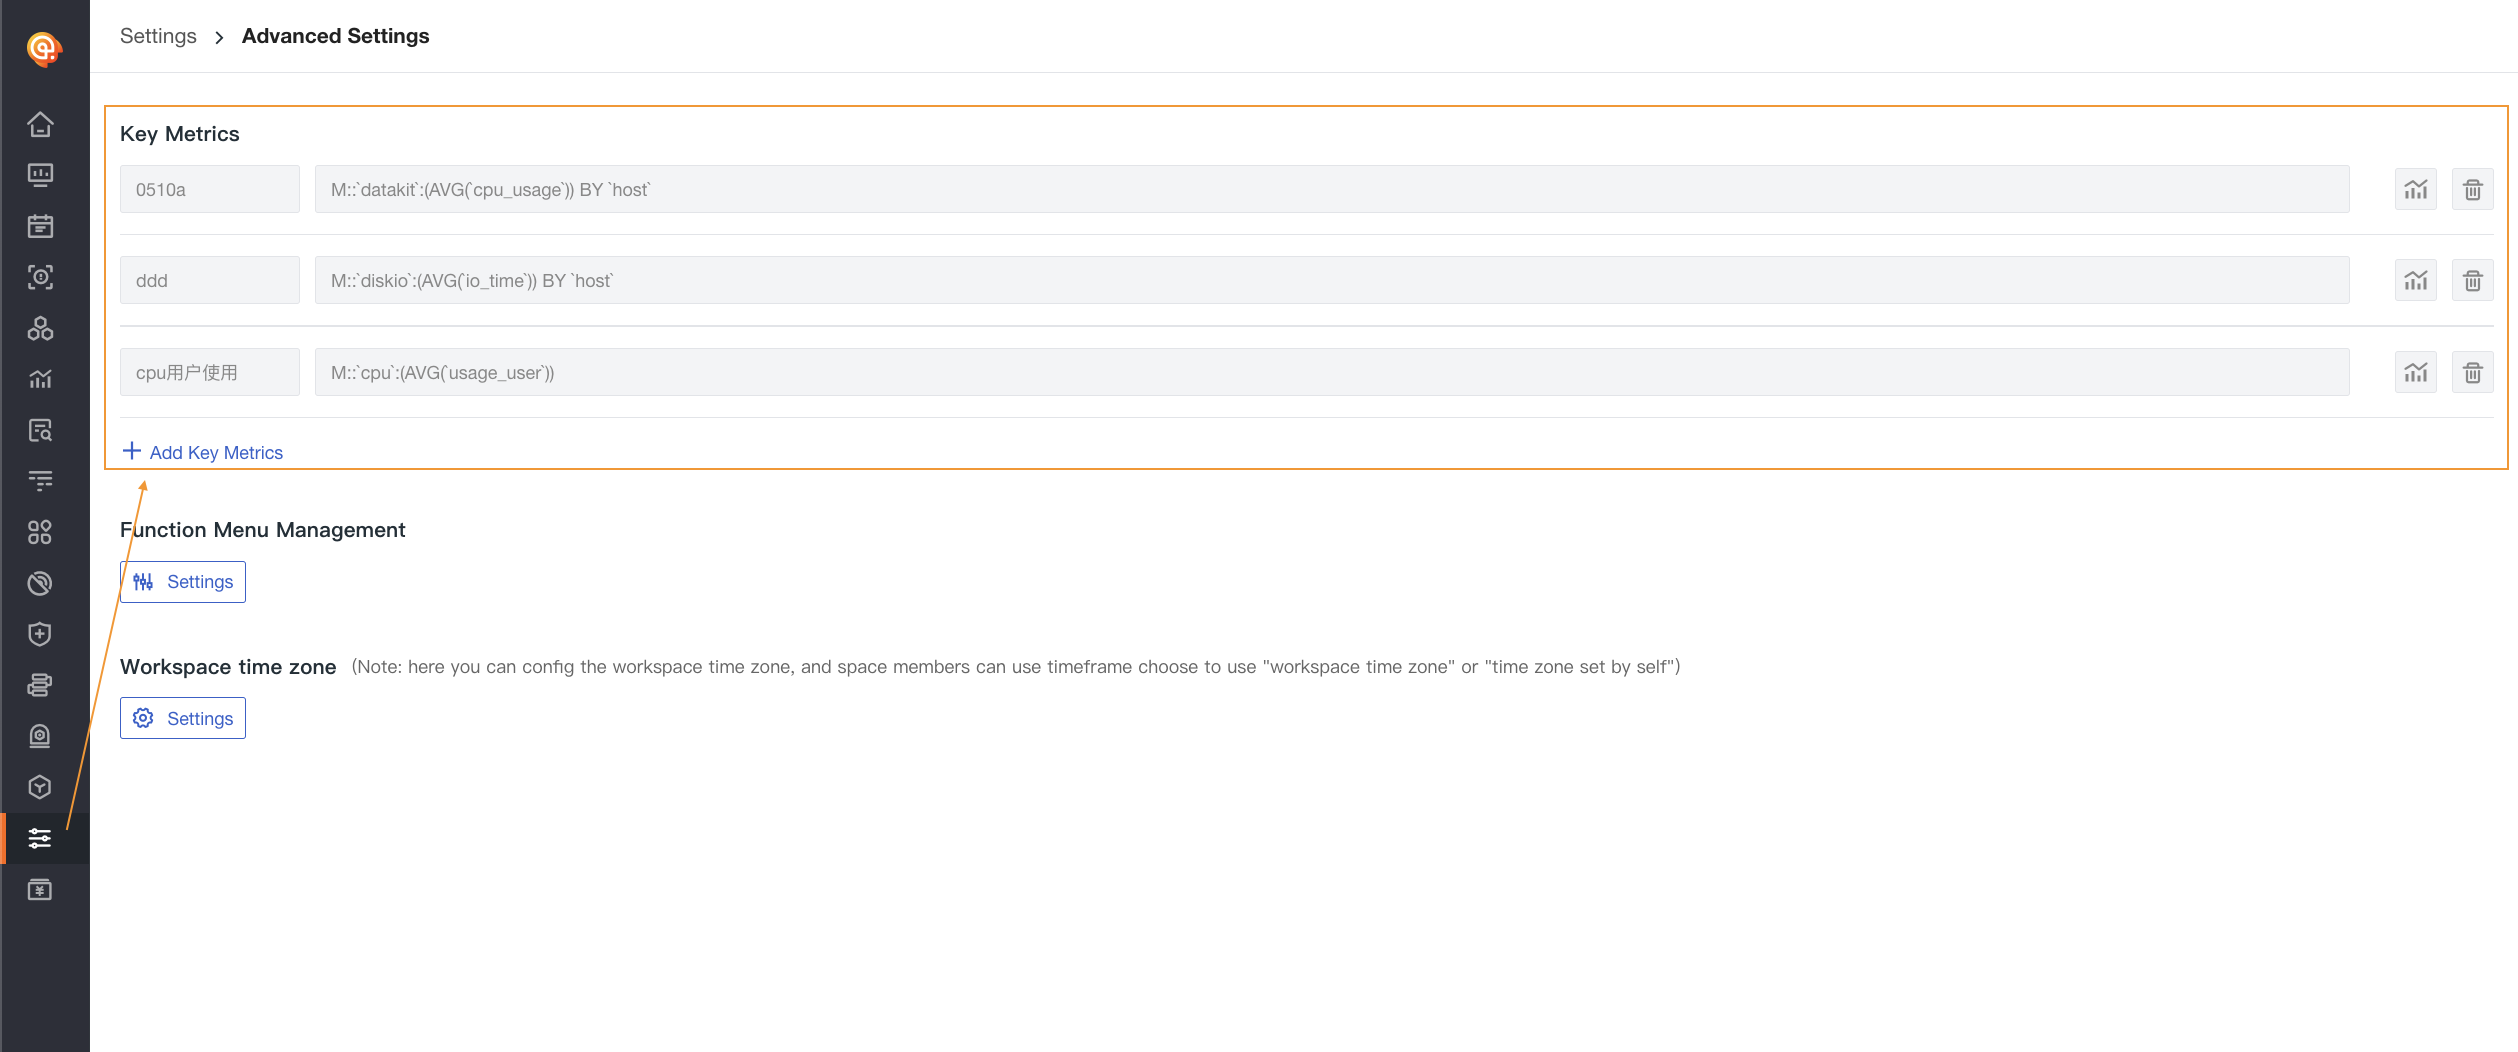
In Guance workspace Management > Settings > Advanced Settings > Key Metrics, you can view already configured key metrics. Click Add Key Metric to configure a new key metric.
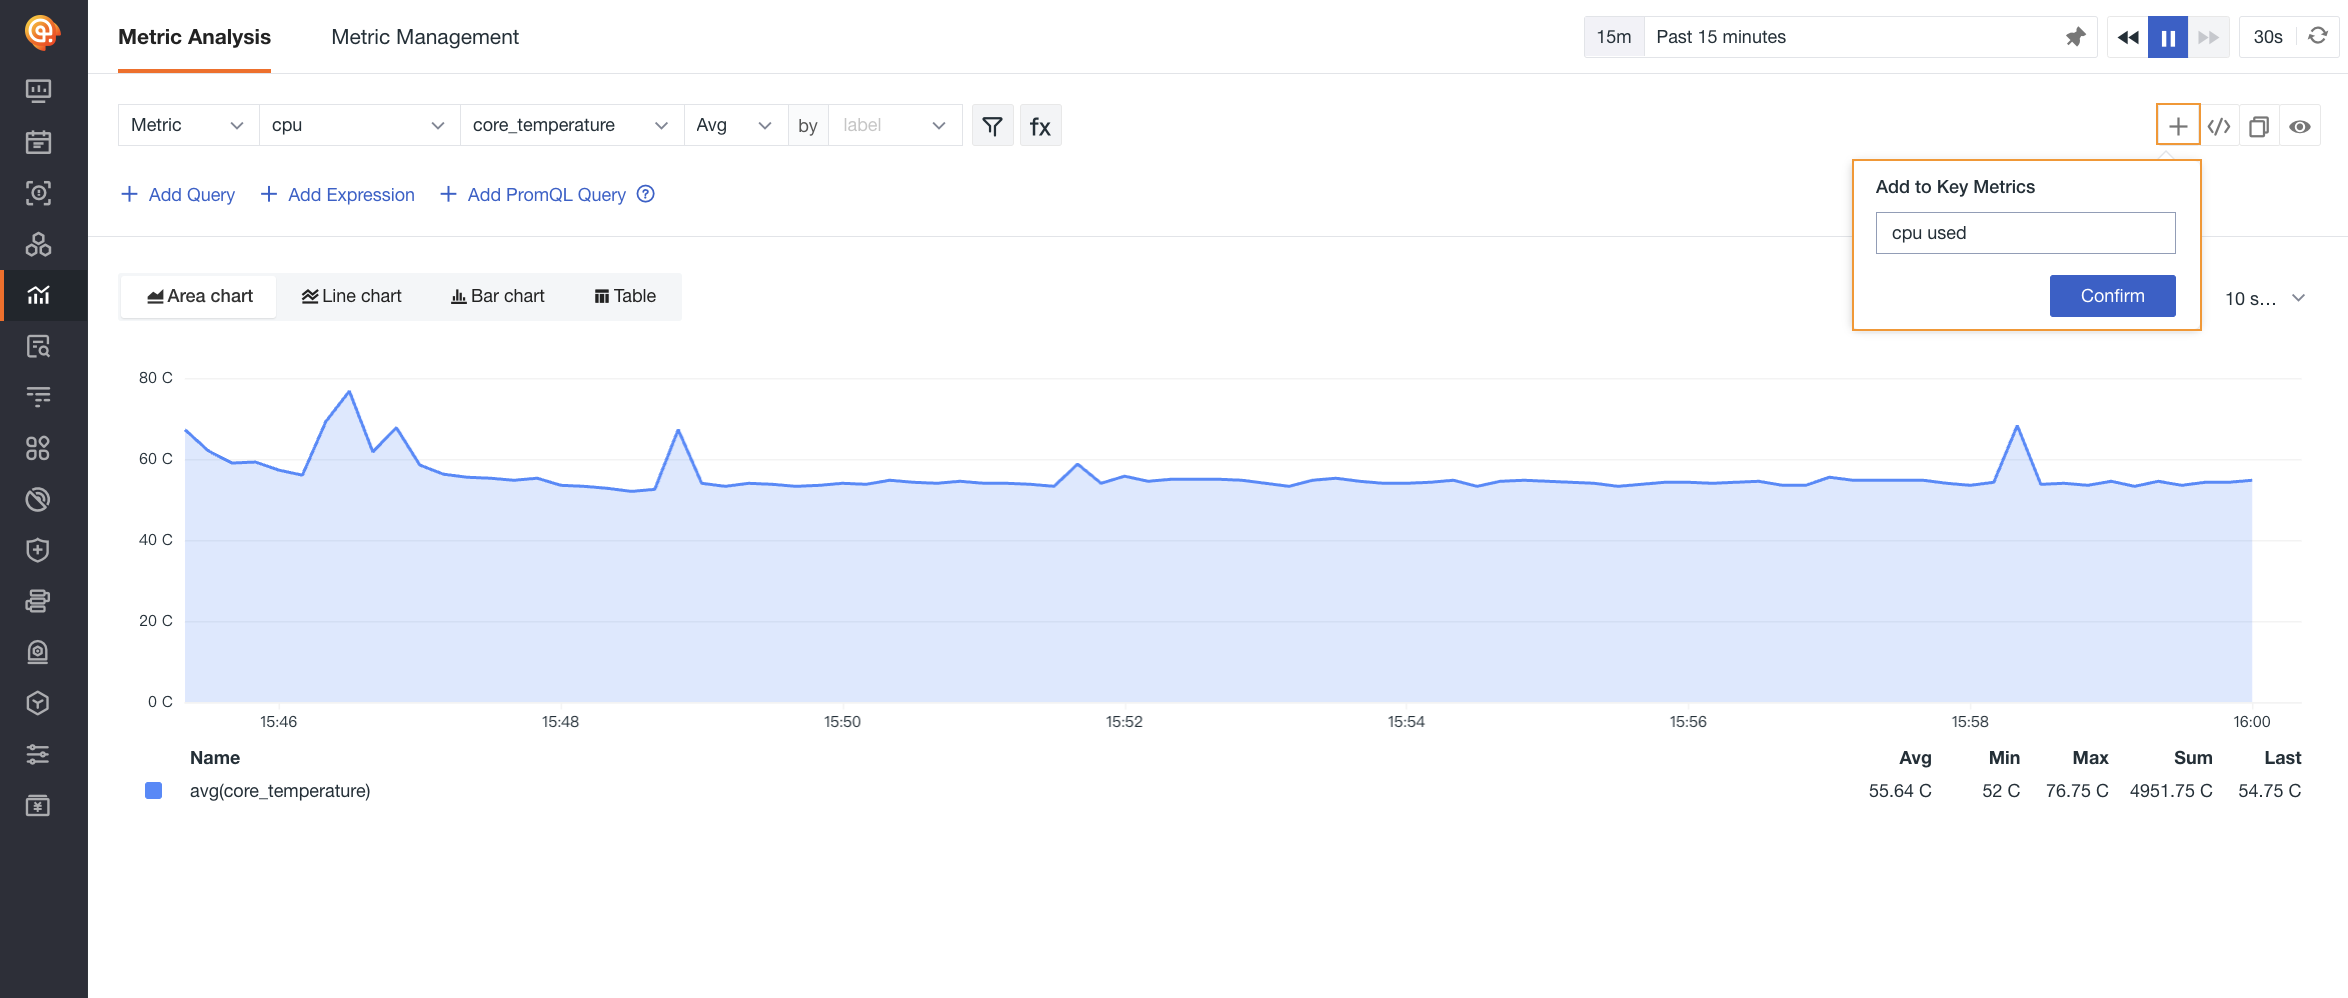
After clicking Add Key Metric, it will redirect you to Metric Analysis for querying metrics. After configuring the query statement, click the  button on the right, input the key metric name, and click Confirm to add a new key metric.
Note: A maximum of 3 DQL queries can be configured for key metrics. If you need to view other key metrics, you can delete the current DQL queries and reconfigure them.
Viewing Key Metrics
On the right side of Management > Settings > Key Metrics, click the view icon to jump to Metric Analysis and view the query statement. If there are fewer than 3 key metrics configured, you can modify the query statement and add new key metrics.

Deleting Key Metrics
Click the delete icon on the right side of the key metric to delete the current key metric.