Mini Program Application Analysis
Introduction
After application data is collected in Guance, you can view the APM analysis through the Guance console.
Explorer Analysis
Guance provides a RUM PV Explorer to help you view and analyze detailed information about user visits to your application. Within the Guance workspace, open User Analysis, click on any application, and use the Explorer to understand each user session, page performance, resources, long tasks, errors in operations, delays affecting users, and more. This allows you to comprehensively understand and improve the operational status and usage of your application by searching, filtering, and correlating analyses, thereby enhancing user experience. For more details, refer to the documentation Explorer.
Use Cases Analysis
Guance offers visualized mini program application analysis with built-in monitoring solutions for various scenarios. You can view overviews, performance analysis, resource analysis, and error analysis under User Analysis - «Analysis Dashboard» - «Mini Program».
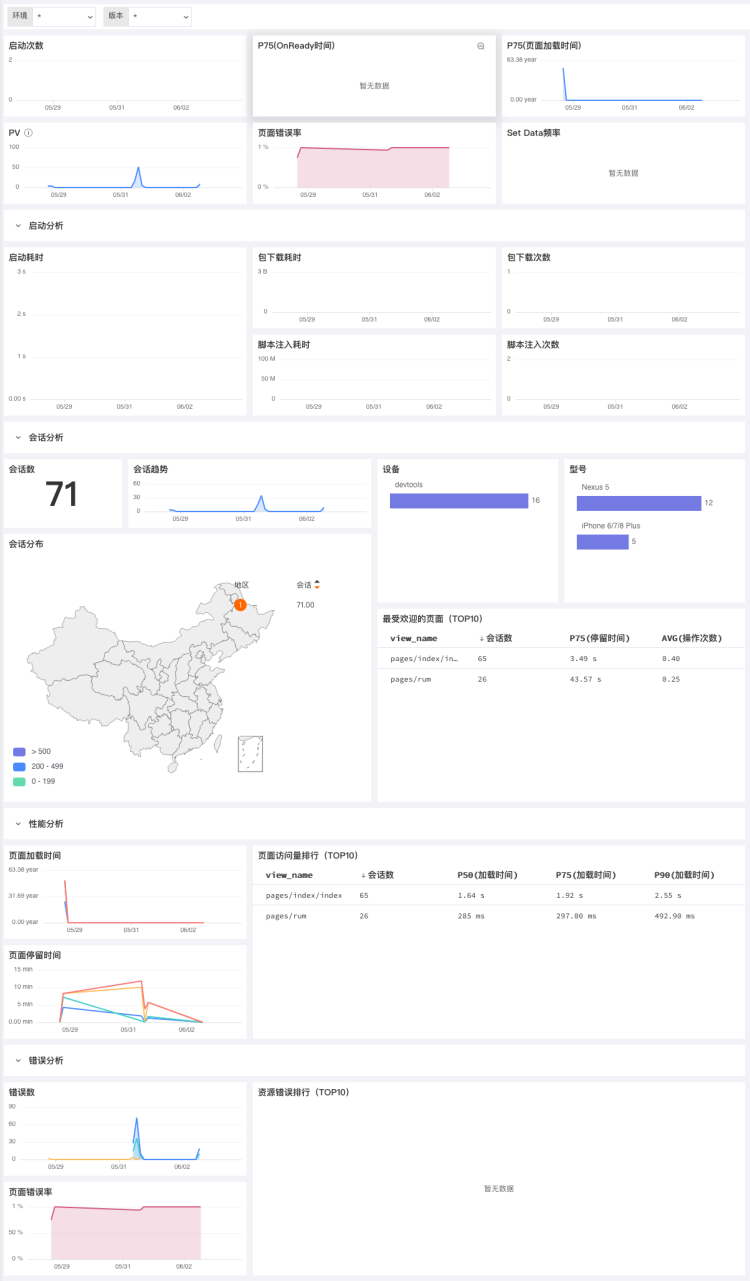
Overview
The overview of mini program applications includes statistics on launch counts, PV numbers, page error rates, page load times, startup analysis, session analysis, performance analysis, and error analysis. It visually presents data on user visits to mini programs from aspects such as startup, session distribution, visiting user devices, popular page rankings, page visit volume rankings, and resource error rankings. This helps quickly identify issues with user visits to mini programs and improves user access performance. You can filter by environment and version to view connected mini programs.
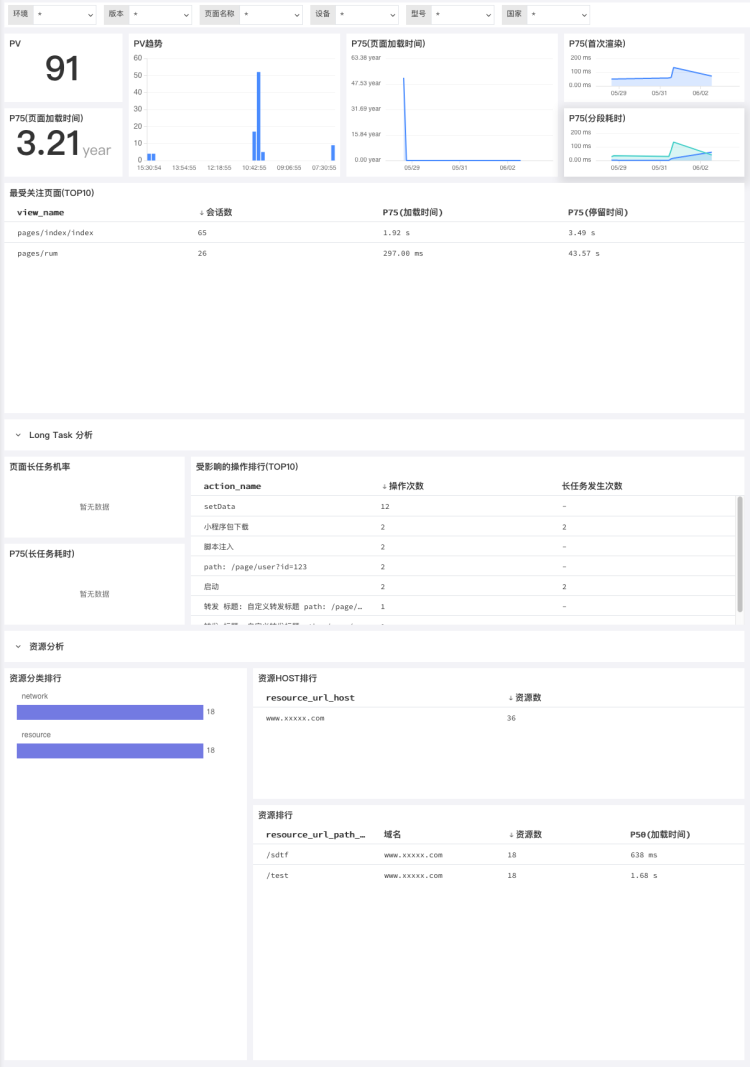
Performance Analysis
Performance analysis of mini program applications involves metrics like PV numbers, page load time, first render time, segment duration, most concerned page session counts, page long task analysis, and resource analysis. It provides real-time visualization of overall mini program page performance, allowing for precise identification of pages that need optimization. You can filter by environment and version to view connected mini programs.
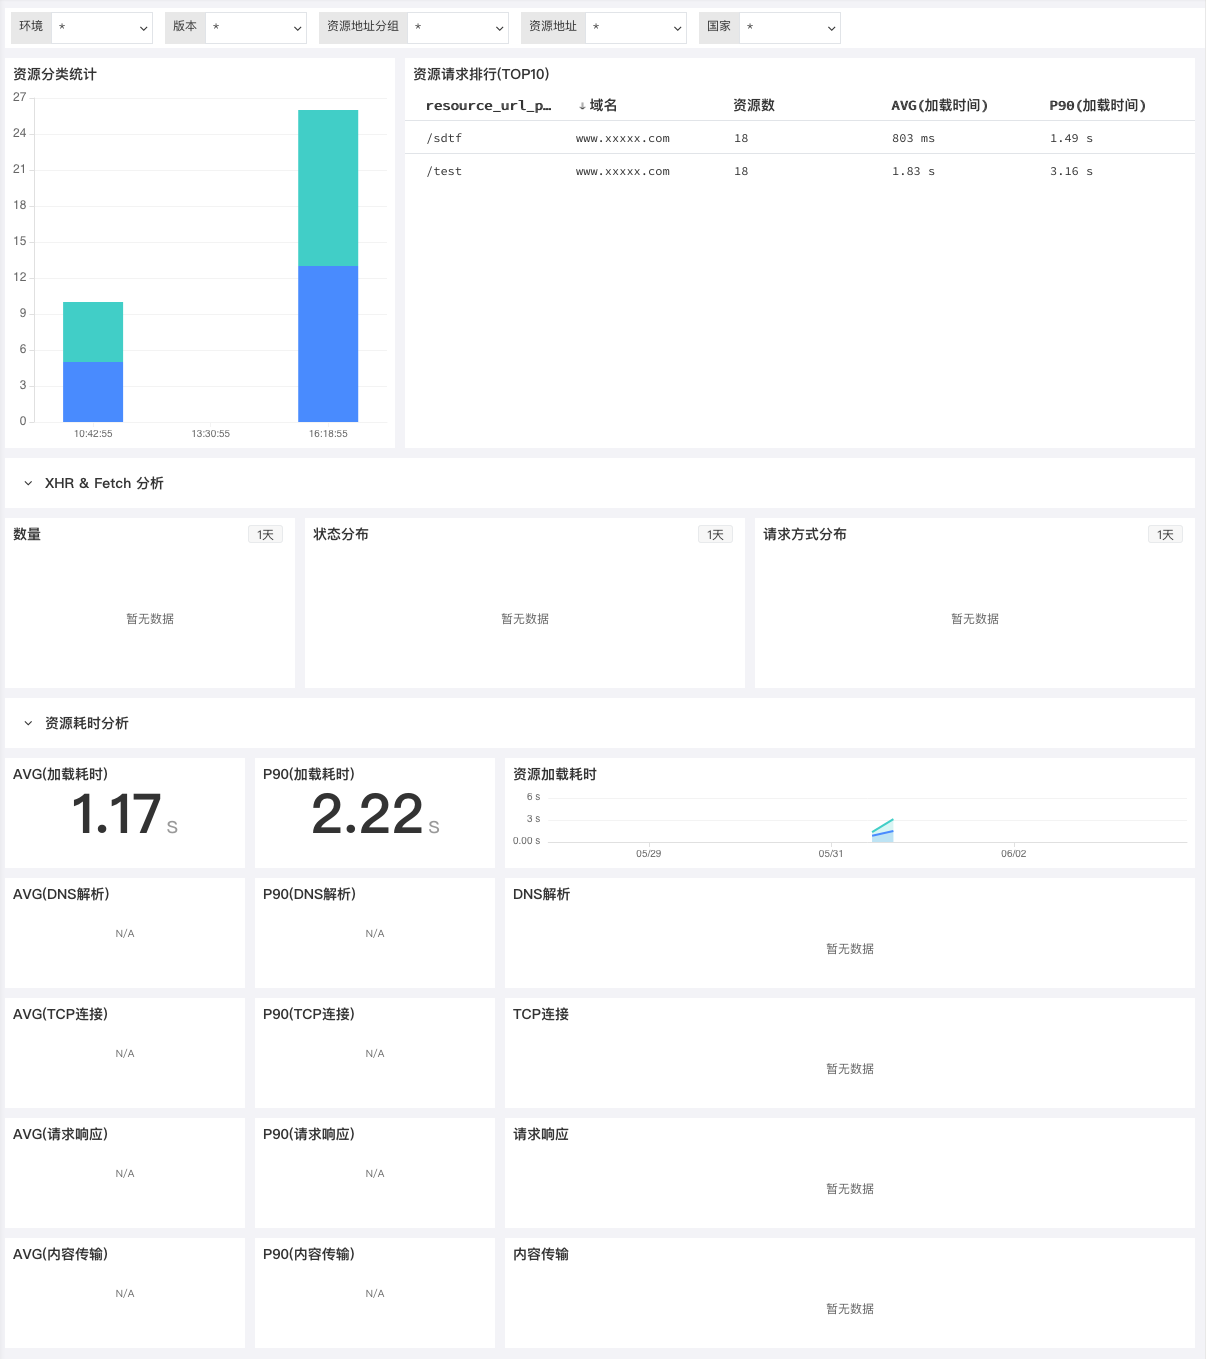
Resource Analysis
Resource analysis of mini program applications involves metrics like resource classification, XHR & Fetch analysis, and resource timing analysis. It provides real-time visualization of overall mini program resource conditions. By analyzing resource request rankings, it helps precisely identify resources that need optimization. You can filter by environment and version to view connected mini programs.
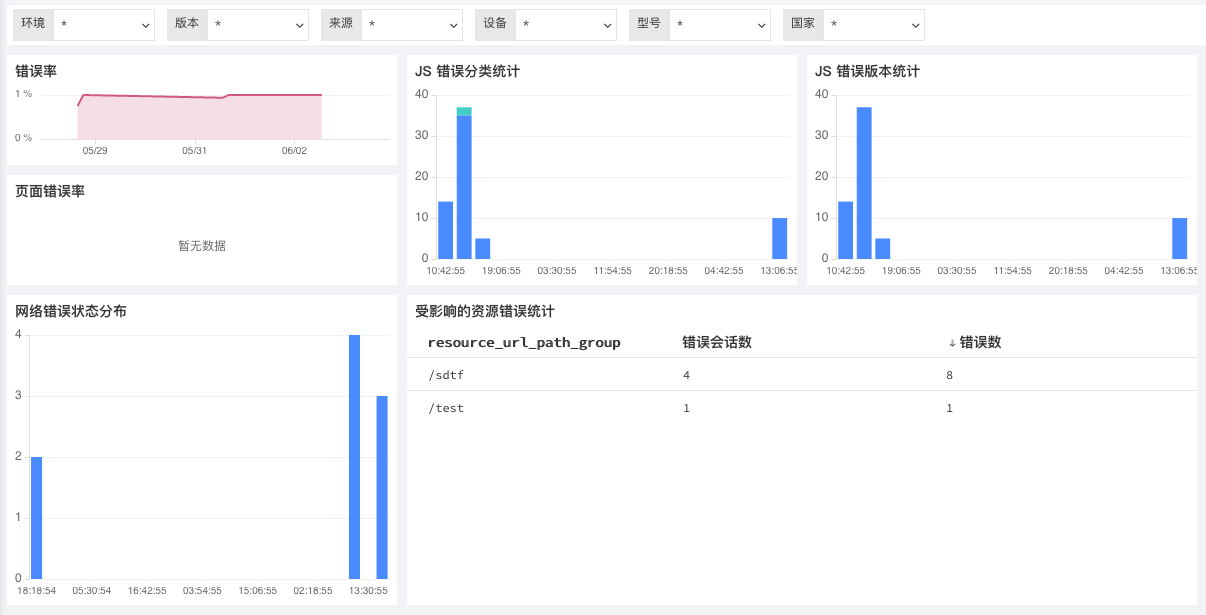
Error Analysis
JS error analysis of mini program applications involves metrics like error rates, error classifications, error versions, and network error status distributions. It provides real-time visualization of overall mini program error conditions. By analyzing affected resource errors, it helps quickly locate resource errors. You can filter by environment and version to view connected mini programs.