Analysis Dashboard
Guance supports visual analysis of applications on different ports and presets multiple monitoring solutions. After application data is uploaded to Guance, you can directly view the analysis of Web, mobile, mini-programs, and macOS applications in the monitoring and analysis dashboard, covering key analysis dimensions such as overview, performance, resources, and errors.
Concepts
LCP, FID, CLS are Google's core website metrics used to measure the loading speed, interactivity, and page stability of a website.
| Metrics | Description | Target Value |
|---|---|---|
| LCP(Largest Contentful Paint) | Calculates how long it takes to load the largest content element within the visible area of a webpage | Less than 2.5s |
| FID(First Input Delay) | Calculates the delay time when users first interact with a webpage | Less than 100ms |
| CLS(Cumulative Layout Shift) | Calculates whether the content on a webpage shifts due to dynamic loading during loading, 0 indicates no change. | Less than 0.1 |
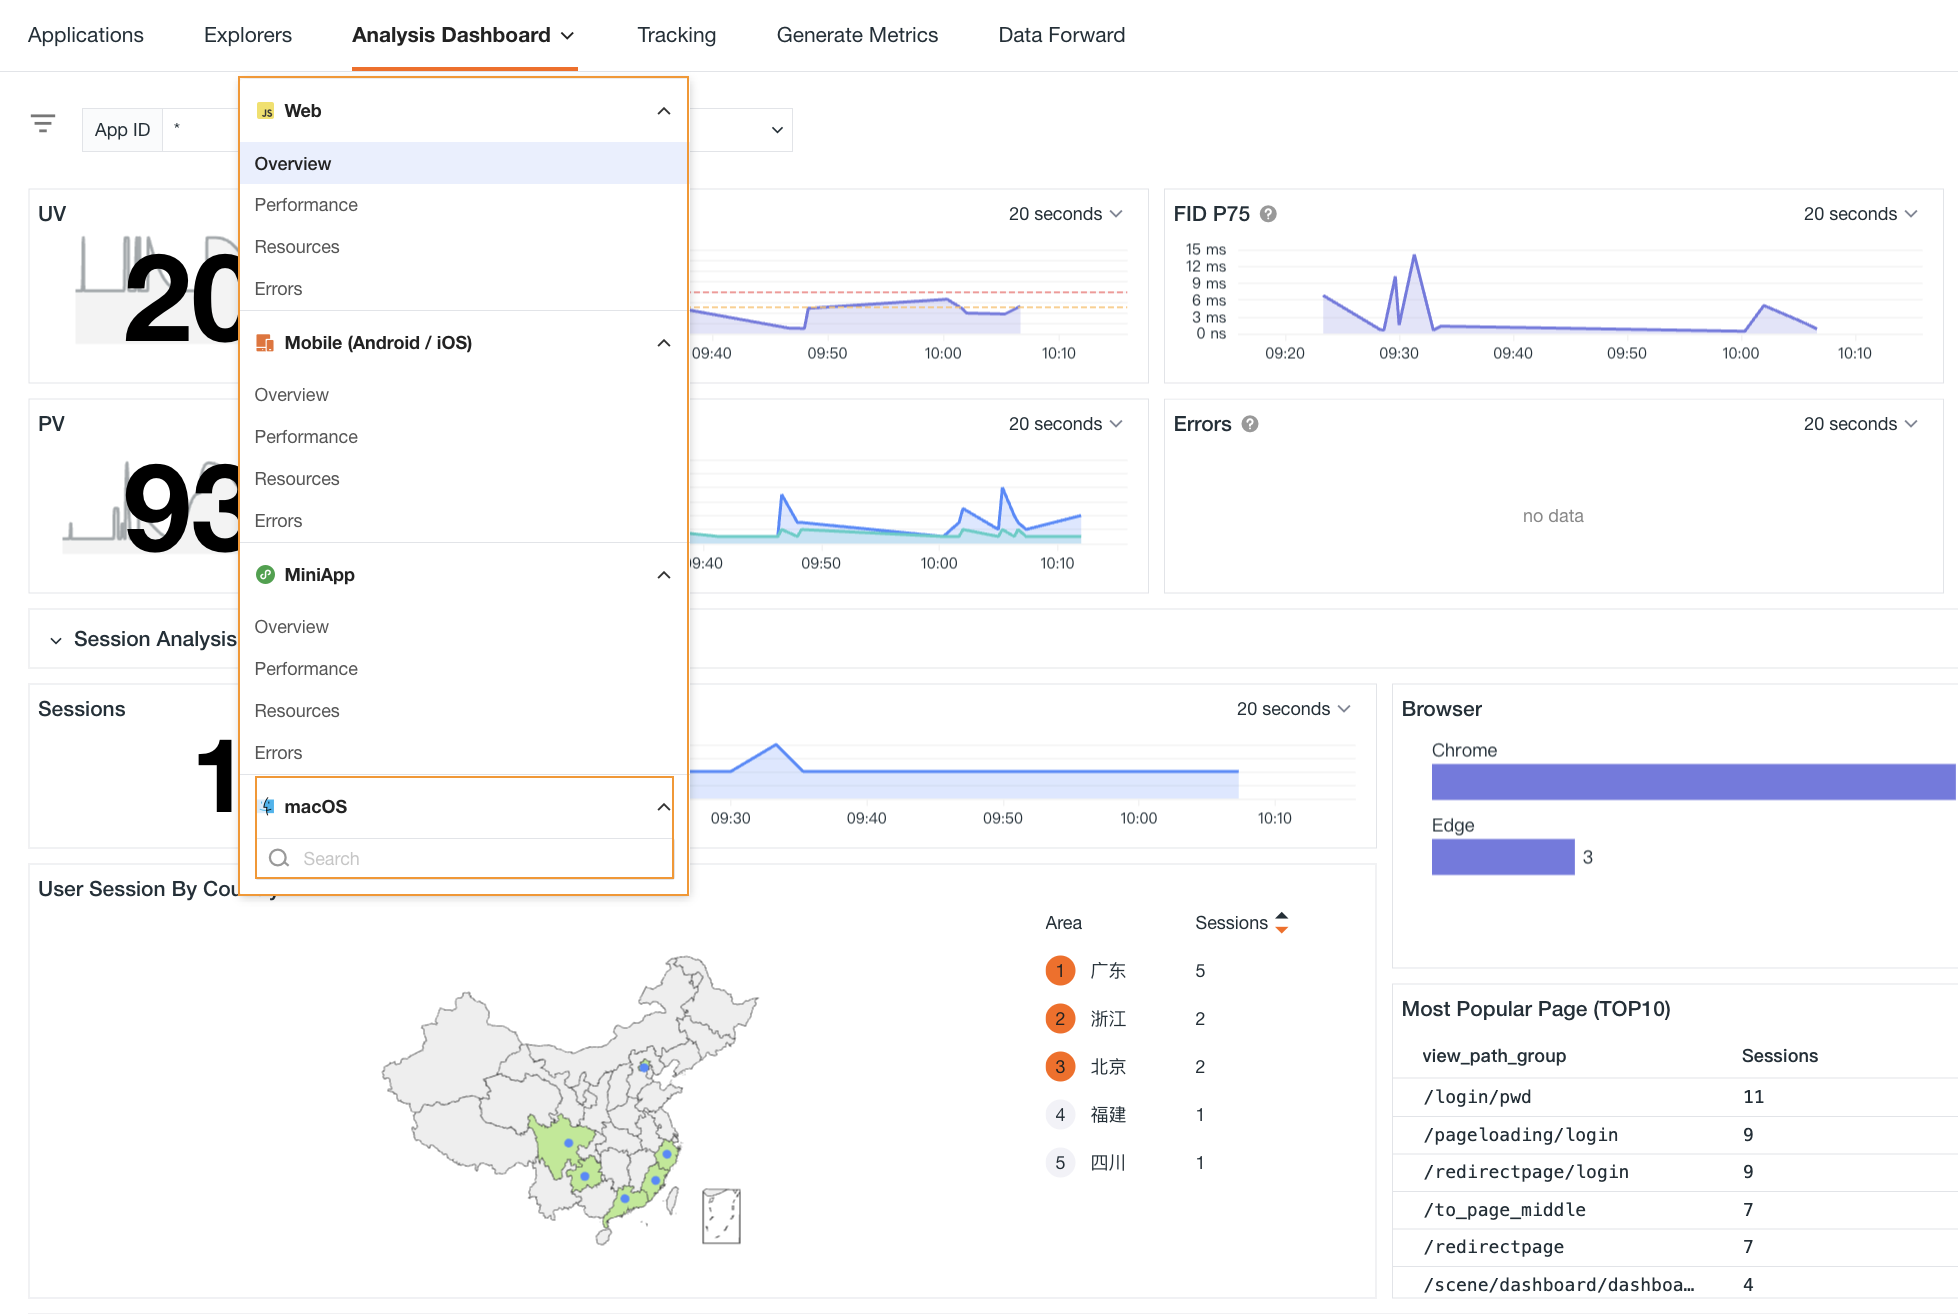
Analysis Dimensions
Includes four dimensions:
- Web end;
- Mobile end (Android / iOS);
- Mini-programs;
- macOS applications.
Switch tabs above the view to switch and view the charts.
Overview
Statistics for UV count, PV count, page error rate, page load time, and other metrics of current port applications are provided. It visually displays user access application data statistics from three aspects: session analysis, performance analysis, and error analysis, helping quickly locate issues with user access to the application and improve user access performance.
You can use filters like application ID, environment, version to quickly locate and check already integrated applications.
Performance Analysis
Statistics for PV count, page load time, number of sessions for most viewed pages, page long task analysis, resource analysis, and other metrics are provided. Real-time views of overall application page performance are available through Long Task analysis, XHR & Fetch analysis, and resource analysis, allowing further precise identification of pages that need optimization.
You can perform detailed filtering by application ID, environment, version, load type, etc.
Resource Analysis
Statistics for resource classification, resource request rankings, and other metrics are provided. From two aspects—XHR & Fetch analysis and resource timing analysis—you can real-time monitor the overall resource situation and identify resources that need optimization.
You can perform detailed filtering by application ID, environment, version, resource address grouping, and resource address.
Error Analysis
Statistics for error rates, crash versions, network error status distribution, page error rates, and other metrics allow quick identification of resource errors.
You can perform detailed filtering by application ID, environment, version, source, page address grouping, browser, etc.
Associated Views
The current analysis dashboard is the standard "System View" provided by Guance. If you wish to use a personalized view for analysis, you can create a "User View" with the same name as the system view. The system will automatically prioritize displaying your "User View".
Click the jump button in the top-right corner to proceed.