Official Monitor Template Library
The system includes a rich set of ready-to-use monitoring templates out-of-the-box, covering dozens of common technology stacks from infrastructure, middleware to cloud services. You can enable monitoring for hosts, containers (Docker), databases (Elasticsearch, Redis), cloud services (Alibaba Cloud RDS, SLB), and big data components (Flink) with one click, without starting from scratch, simplifying the initial configuration work.
Prerequisites
Before creating a template, you need to install DataKit on the host and enable the configuration of the relevant collector. Otherwise, the monitor corresponding to the template will not generate alert events.
Create
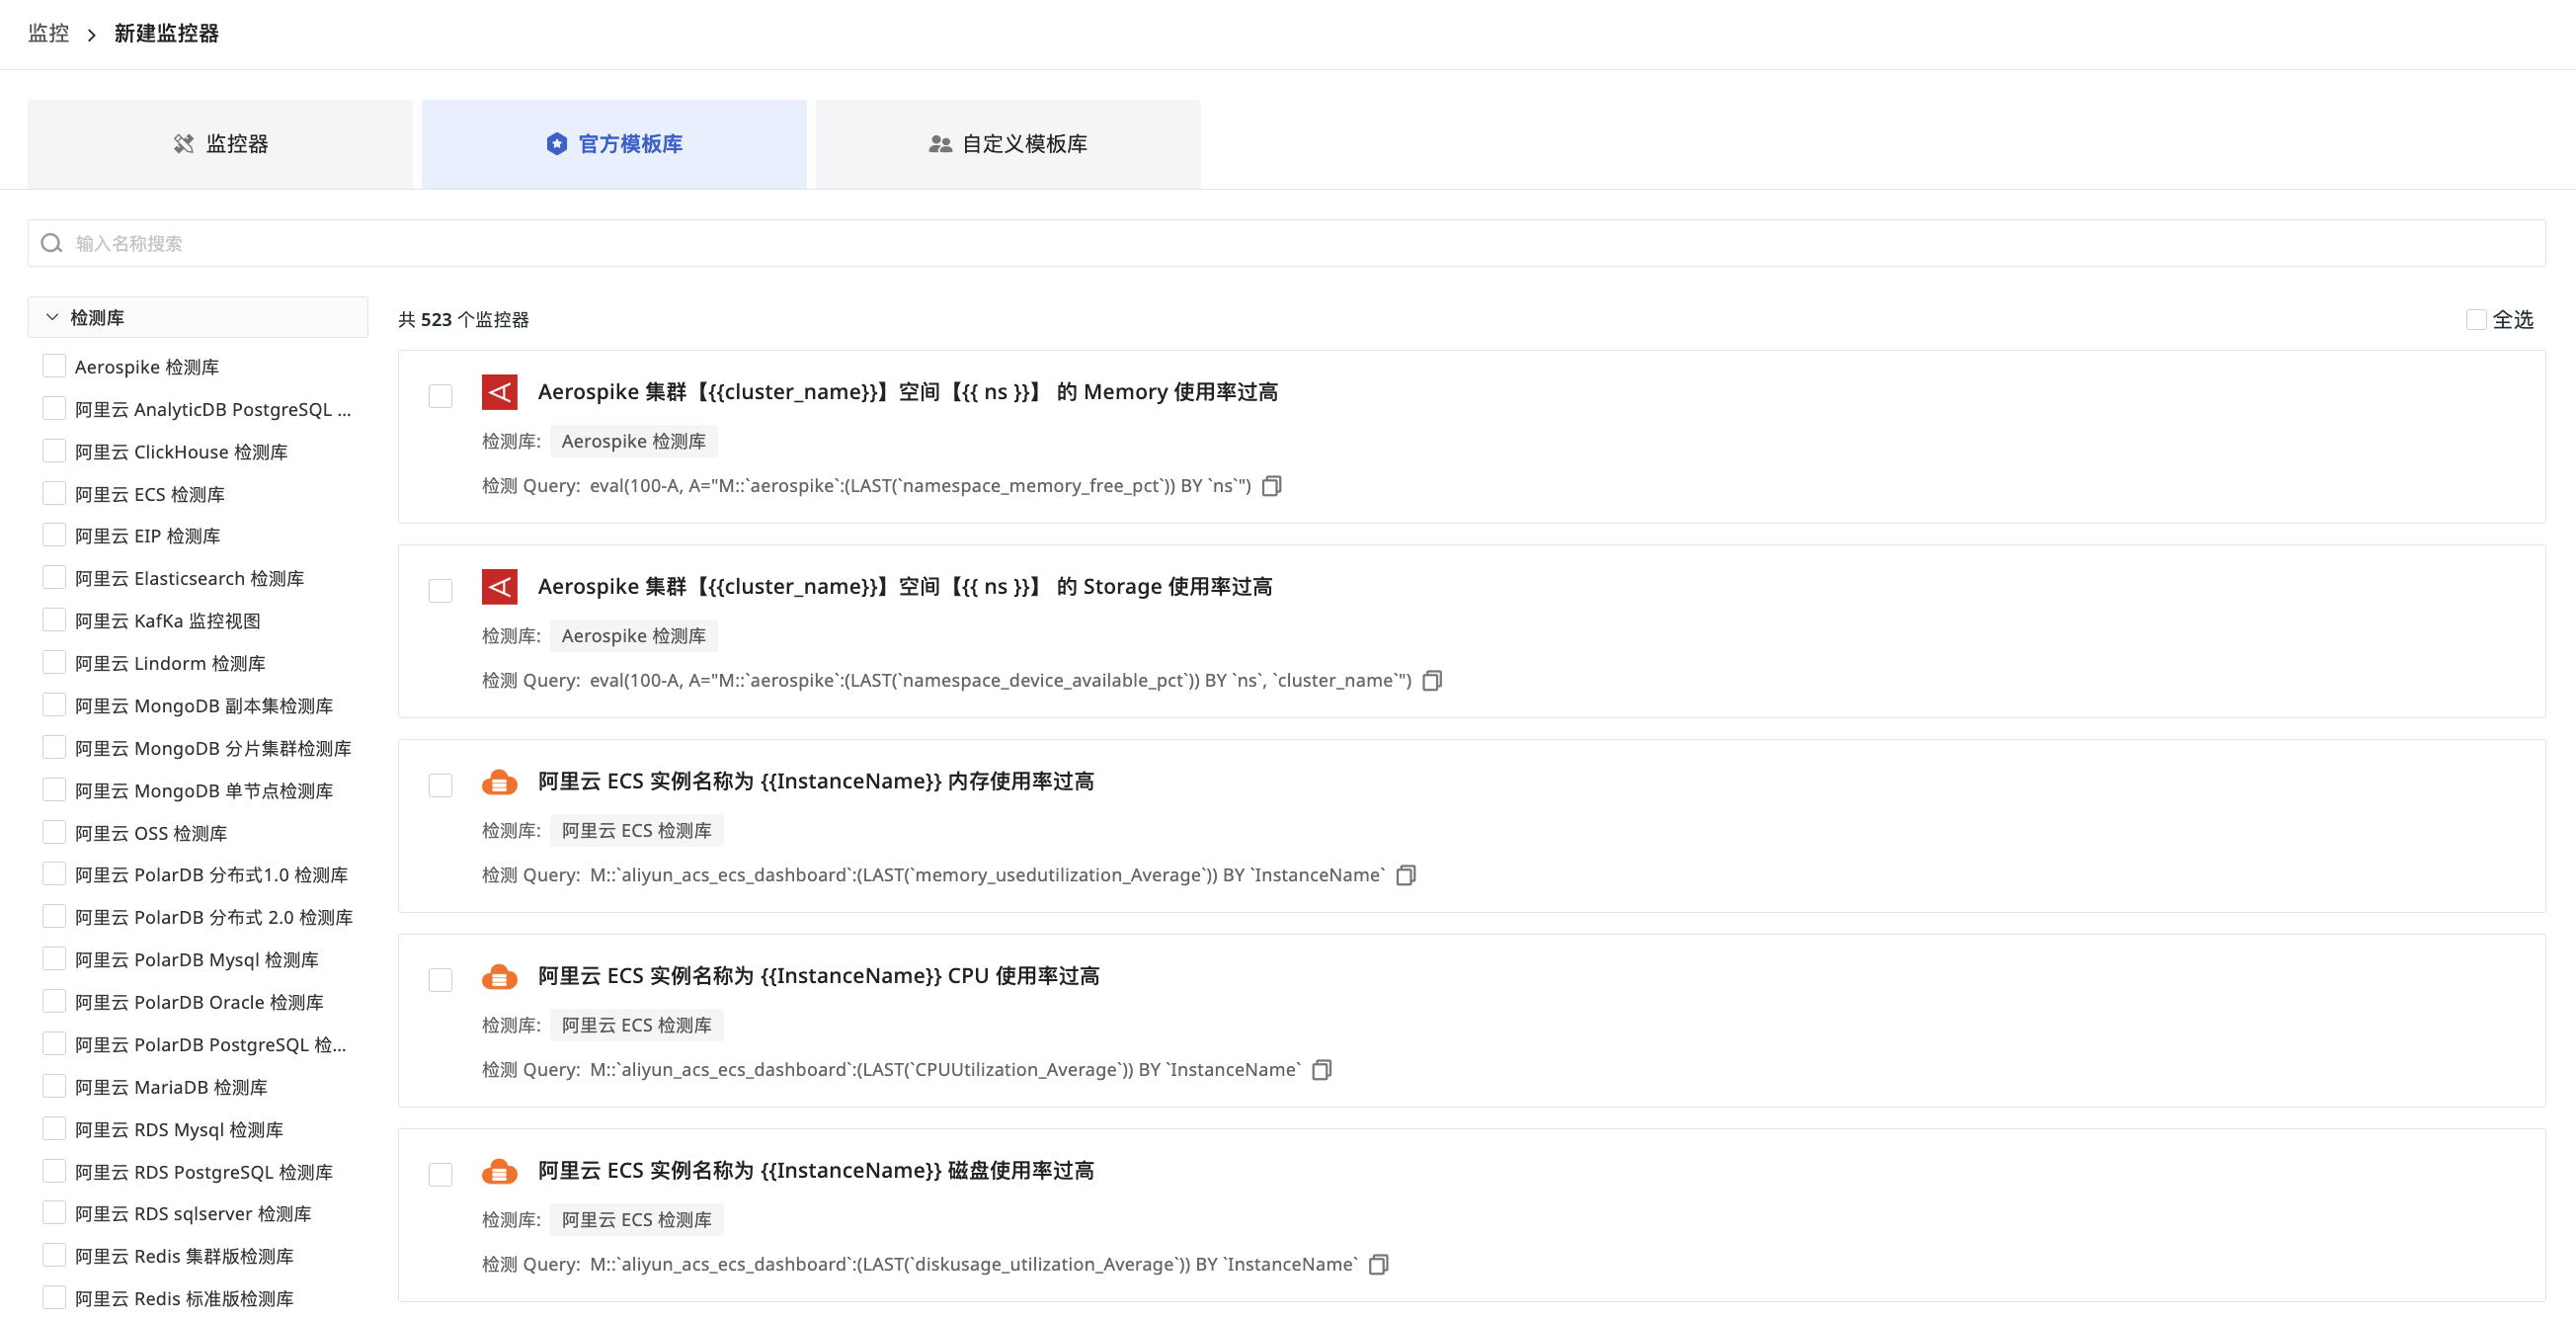
- Go to Monitor > Official Template Library.
- Select a monitoring template.
- Start configuring.
You can choose to create templates individually or in batches, quickly putting them into use without manual configuration.
Manage Templates
On the Template Library page, the left side lists all monitoring template types, and the right side shows all detection rules under the selected template type. On this page, you can perform the following operations:
- Filter by selecting specific detection libraries in the left Detection Library.
- View detection rules page by page, or perform a real-time search by entering a name in the search bar.
- Select multiple detection rules on the right to create monitors in bulk.
- After successful creation, return to the monitor list. Click to open a monitor, then you can edit the detection rules and save them.