Host Intelligent Inspection
Leveraging intelligent inspection algorithms, the system periodically conducts intelligent monitoring of CPU and memory usage on hosts. When anomalies in CPU or memory are detected, it performs in-depth root cause analysis to determine if the host exhibits abnormal patterns such as sharp increases, decreases, or persistent rises, thereby effectively monitoring the operational status and stability of the host.
Use Cases
Suitable for monitoring business hosts with high requirements for stability and reliability. Supports providing analysis reports for generated anomaly events.
Configuration
-
Define the monitor name.
-
Select the inspection scope: Limit the range of hosts to be inspected through filter combinations. If no filters are added, Guance inspects data from all hosts.
Viewing Events
The monitor retrieves the CPU, memory, network, and disk usage of the target hosts from the last 10 minutes. When abnormal conditions are identified, corresponding events are generated. You can view these anomaly events in the Incident > Intelligent Monitoring list.
Event Details Page
Click on an Incident to view the details page of the intelligent monitoring event. This includes the event status, anomaly occurrence time, anomaly name, analysis report, extended fields, alert notifications, history records, and related events.
- Click Jump to Monitor in the upper right corner to view and adjust the Intelligent Monitoring Configuration.
- Click the Export button in the upper right corner. You can choose to Export JSON File or Export PDF File to obtain all key data corresponding to the current event.
Analysis Report
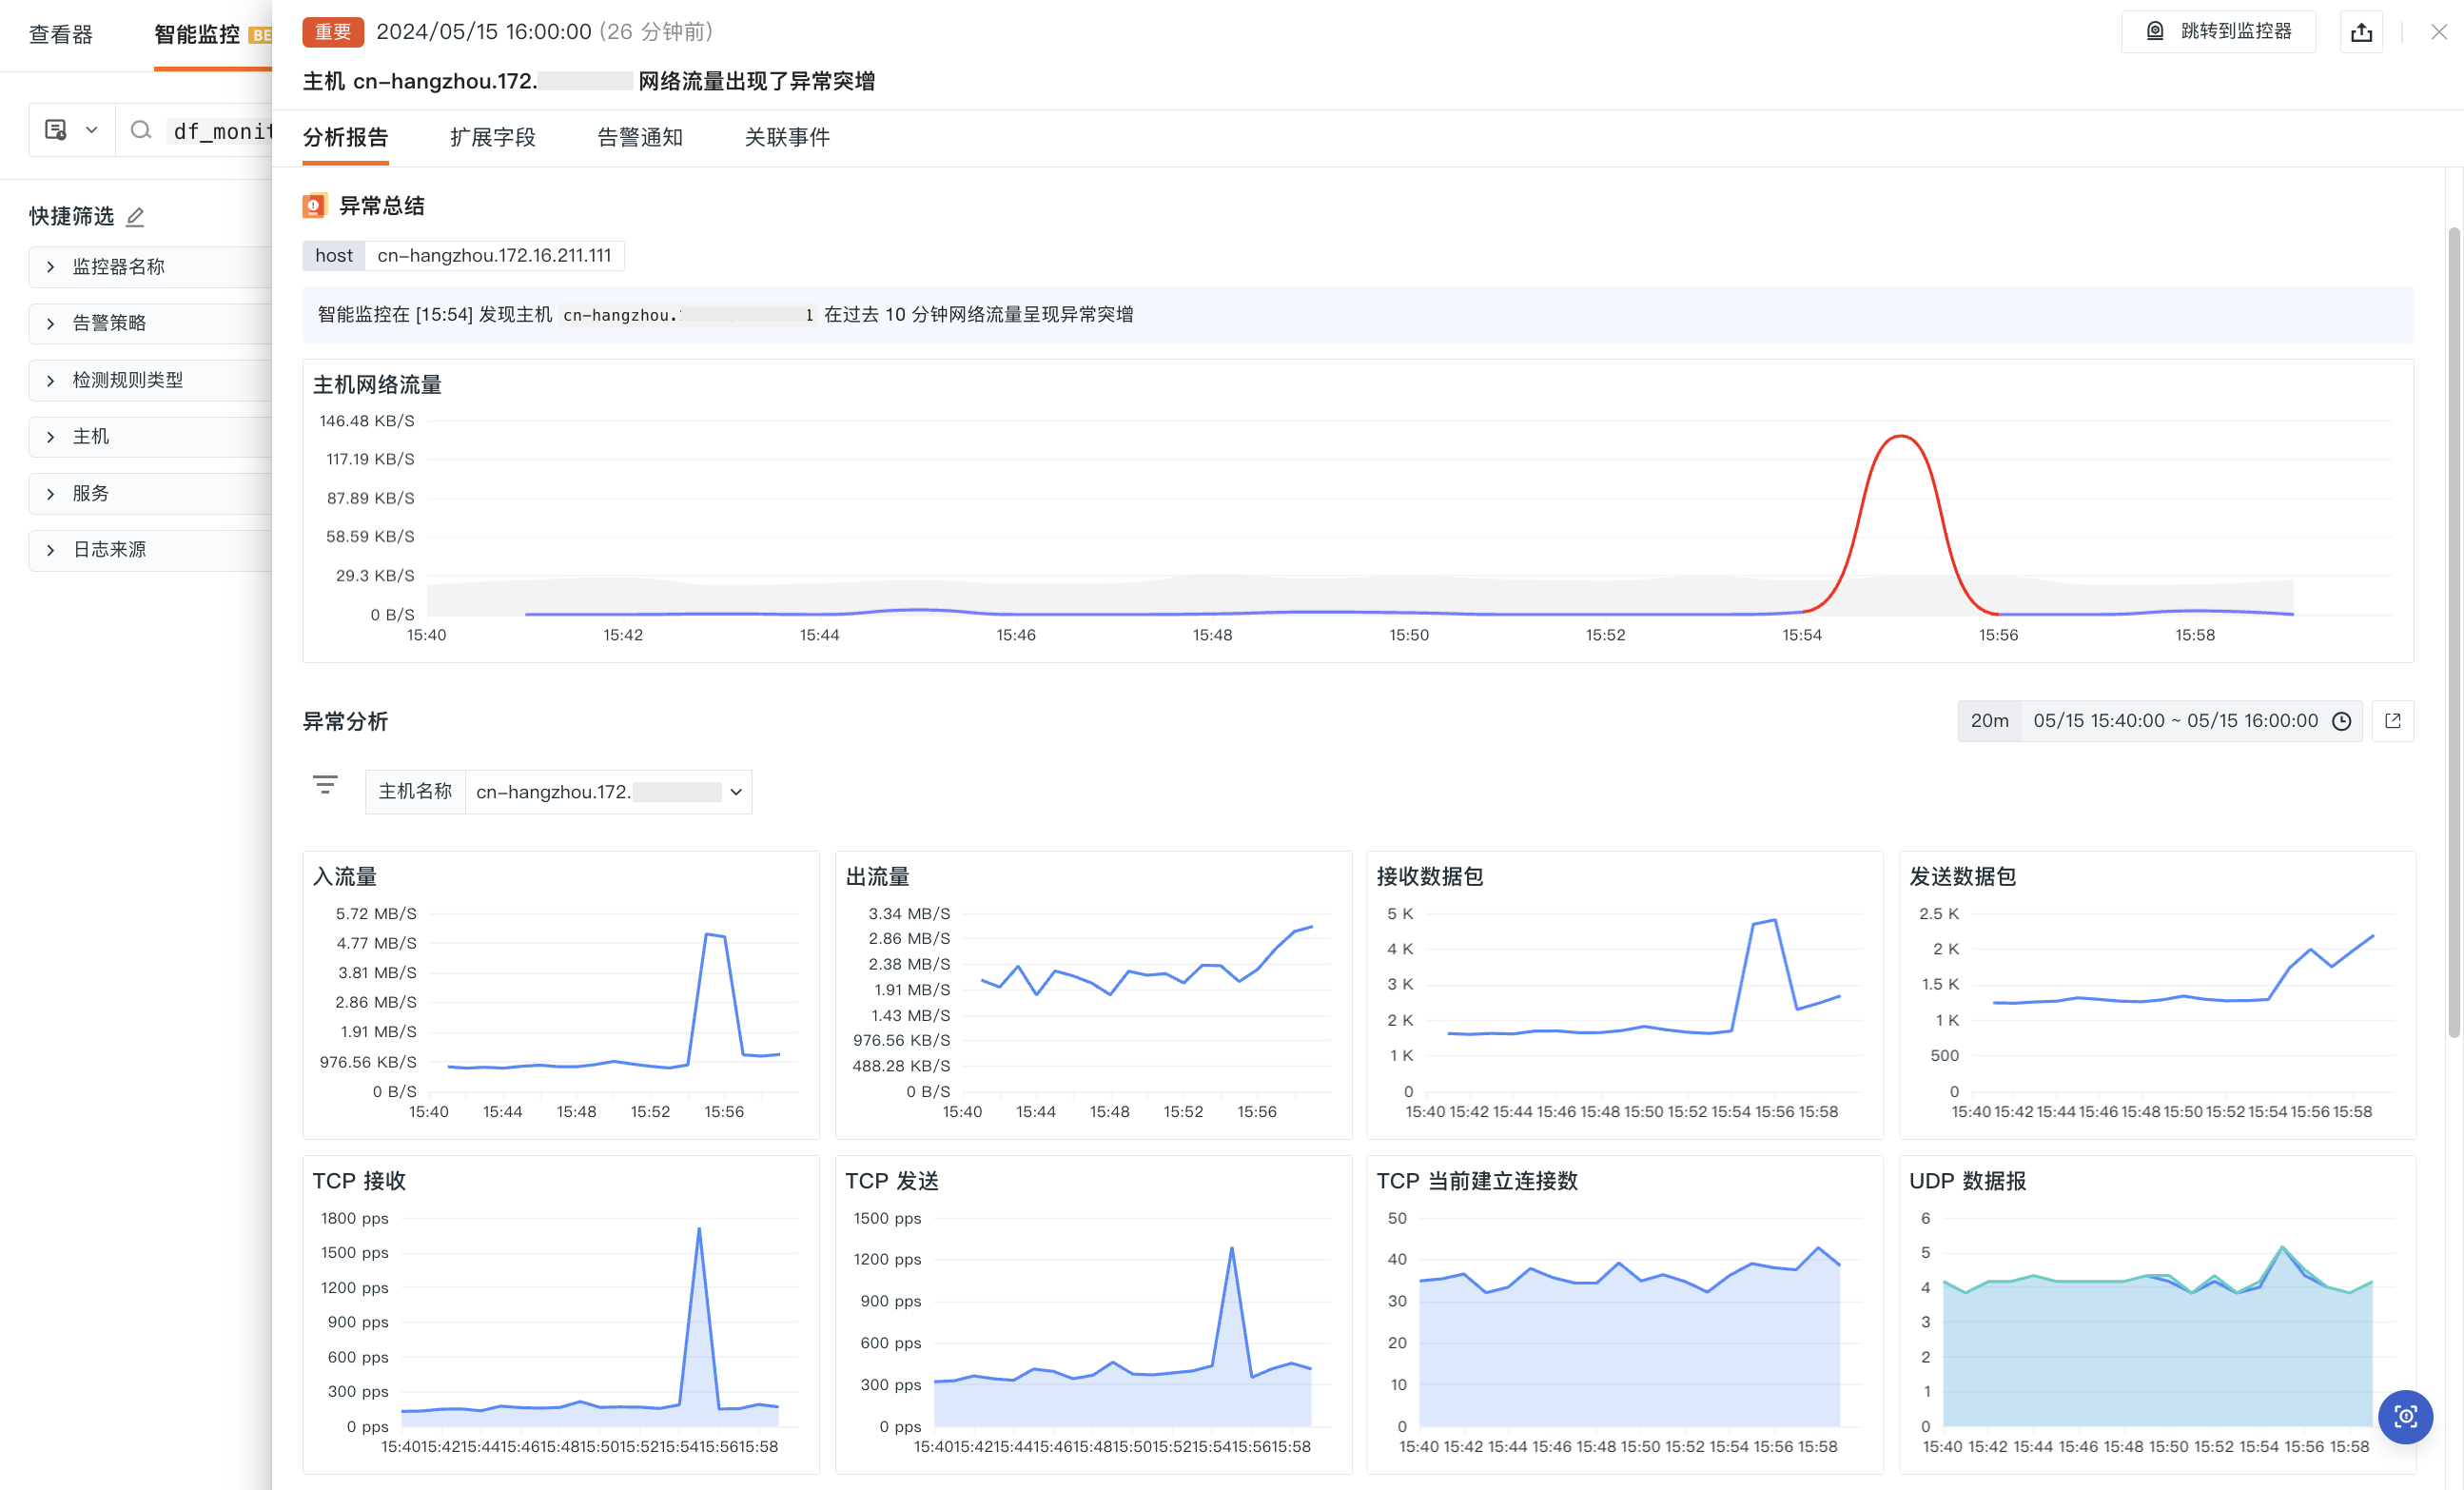
- Event Content: Displays the event content configured for the monitor.
- Anomaly Summary: Shows the label of the anomalous host, details of the anomaly analysis report, and a time series chart displaying the anomaly trend for the anomalous value.
- Anomaly Analysis: An anomaly analysis dashboard where you can view the host's anomalous processes, CPU usage rate, and other basic information.
- Host Details: You can view the host integration operational status, system information, and cloud provider information.
Note
When multiple interval anomalies exist, the Anomaly Summary > Anomaly Trend Chart and the Anomaly Analysis dashboard default to displaying the analysis for the first anomaly interval. You can click on the "Anomaly Trend Chart" to switch intervals; the Anomaly Analysis dashboard will update accordingly.